GHG Accounting for Electricity Transmission and Distribution Projects Marcelino Madrigal Sr. Energy Specialist, ETWEN The World Bank Randal Spalding-Fecher Pöyry Energy Management Consulting June 2010 1
Transcript
GHG Accounting for Electricity Transmission and
Distribution Projects
Marcelino MadrigalSr. Energy Specialist, ETWEN
The World Bank
Randal Spalding-FecherPöyry Energy Management Consulting
June 2010
1
Outline
• Study objective
• Background and rationale
• Basic GHG accounting principles
• Key GHG impacts and existing methodologies
• WB’s T&D project types categorization
• Recommended approach for assessing GHG impacts
• Case studies
• Conclusions
2 GHG impacts of T&D projects
Outline
• Study objective
• Background and rationale
• Basic GHG accounting principles
• Key GHG impacts and existing methodologies
• WB’s T&D project types categorization
• Recommended approach for assessing GHG impacts
• Case studies
• Conclusions
3 GHG impacts of T&D projects
Objective: GHG impacts of T&D projects
• Contribute to the SFDCC goal of
improving GHG accounting in the energy
sector by reviewing, assessing and
recommending GHG accounting
methodologies for electricity T&D projects
• Examine and build on existing
methodologies to find out whether they
can feasibly and reliably provide
estimates of net project emissions
• Identify and conceptually design a
methodological approach for T&D
projects in the context of World Bank
lending operations
4 GHG impacts of T&D projects
Outline
• Study objective
• Background and rationale
• Basic GHG accounting principles
• Key GHG impacts and existing methodologies
• WB’s T&D project types categorization
• Recommended approach for assessing GHG impacts
• Case studies
• Conclusions
5 GHG impacts of T&D projects
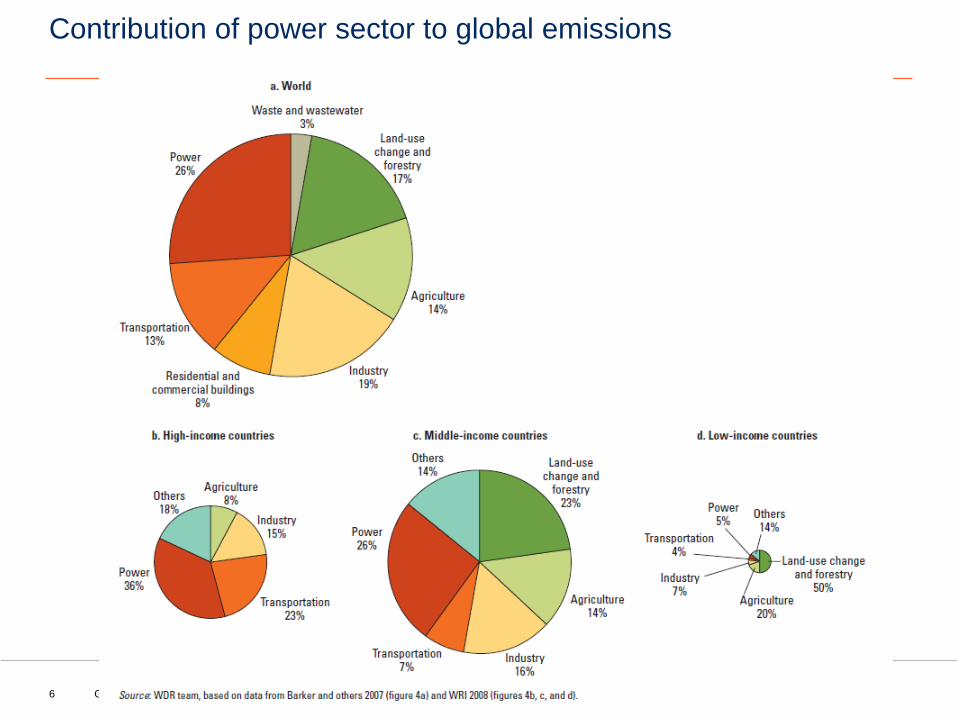
Contribution of power sector to global emissions
6 GHG impacts of T&D projects
Rationale for GHG accounting for T&D
7 GHG impacts of T&D projects
-
1,000
2,000
3,000
4,000
5,000
6,000
7,000
8,000
9,000
FY2003 FY2004 FY2005 FY2006 FY2007 FY2008 FY2009
US
$ M
illio
ns
World Bank Group Energy Financing, FY03-FY09, by Project Type
Regulation & Reform Transmission and Distribution Oil, Gas and CoalThermal Generation Energy Efficiency Hydro > 10MWNew Renewable Energy
• Less knowledge of the
implications of T&D on GHG
emissions
• Considerable importance to
WB portfolio
• Better understand the
implications of possible new
accounting approaches
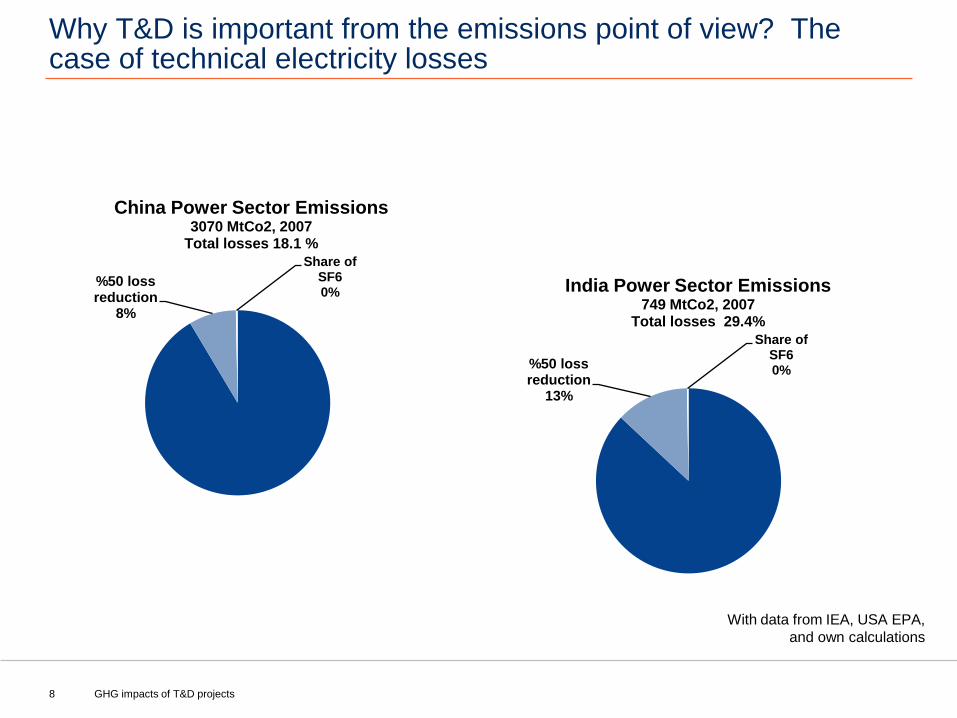
Why T&D is important from the emissions point of view? The case of technical electricity losses
8 GHG impacts of T&D projects
%50 loss reduction
8%
Share of SF60%
China Power Sector Emissions3070 MtCo2, 2007
Total losses 18.1 %
%50 loss reduction
13%
Share of SF60%
India Power Sector Emissions749 MtCo2, 2007
Total losses 29.4%
With data from IEA, USA EPA,
and own calculations
Outline
• Study objective
• Background and rationale
• Basic GHG accounting principles
• Key GHG impacts and existing methodologies
• WB’s T&D project types categorization
• Recommended approach for assessing GHG impacts
• Case studies
• Conclusions
9 GHG impacts of T&D projects
GHG Accounting principles
• Gross emissions “inventory” versus project level “net impact”
– Inventory approach used for corporate or national “carbon footprints” in
a defined geographical area: companies, organisations, or countries (e.g.
IPCC inventories)
– Net emissions approach used to evaluate project impact on the entire
emissions system, by comparing “with project” to “without project”
scenarios
• Defining project boundary
• Generic principles
– Credibility/accuracy, Transparency
– Feasibility/ease of harmonization
10 GHG impacts of T&D projects
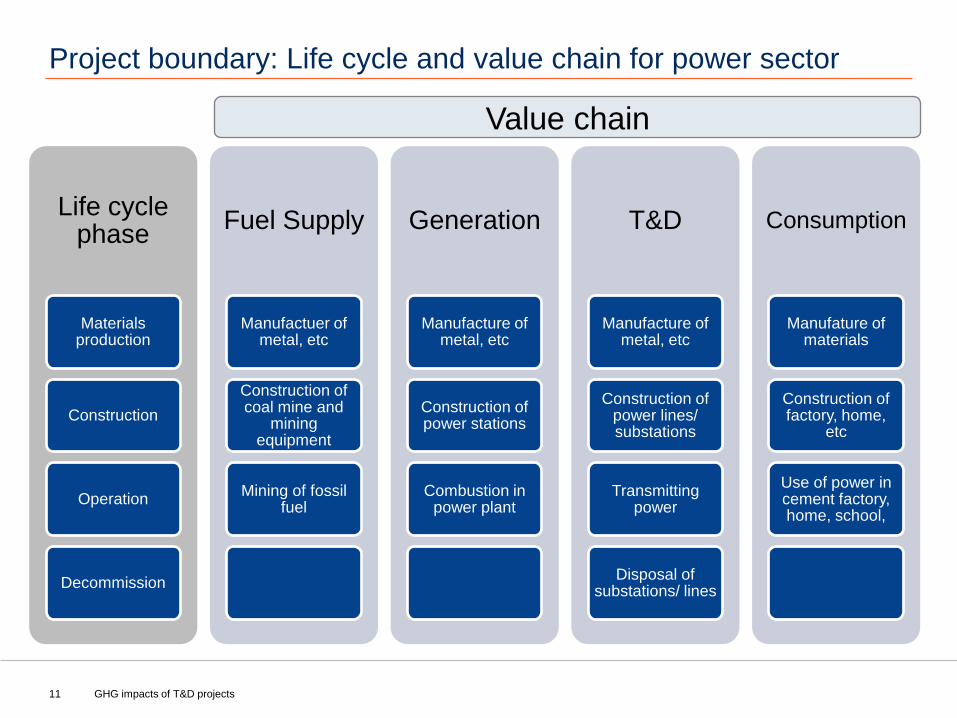
Project boundary: Life cycle and value chain for power sector
11
Life cycle phase
Materials production
Construction
Operation
Decommission
Fuel Supply
Manufactuer of metal, etc
Construction of coal mine and
mining equipment
Mining of fossil fuel
Generation
Manufacture of metal, etc
Construction of power stations
Combustion in power plant
T&D
Manufacture of metal, etc
Construction of power lines/ substations
Transmitting power
Disposal of substations/ lines
Consumption
Manufature of materials
Construction of factory, home,
etc
Use of power in cement factory, home, school,
GHG impacts of T&D projects
Value chain
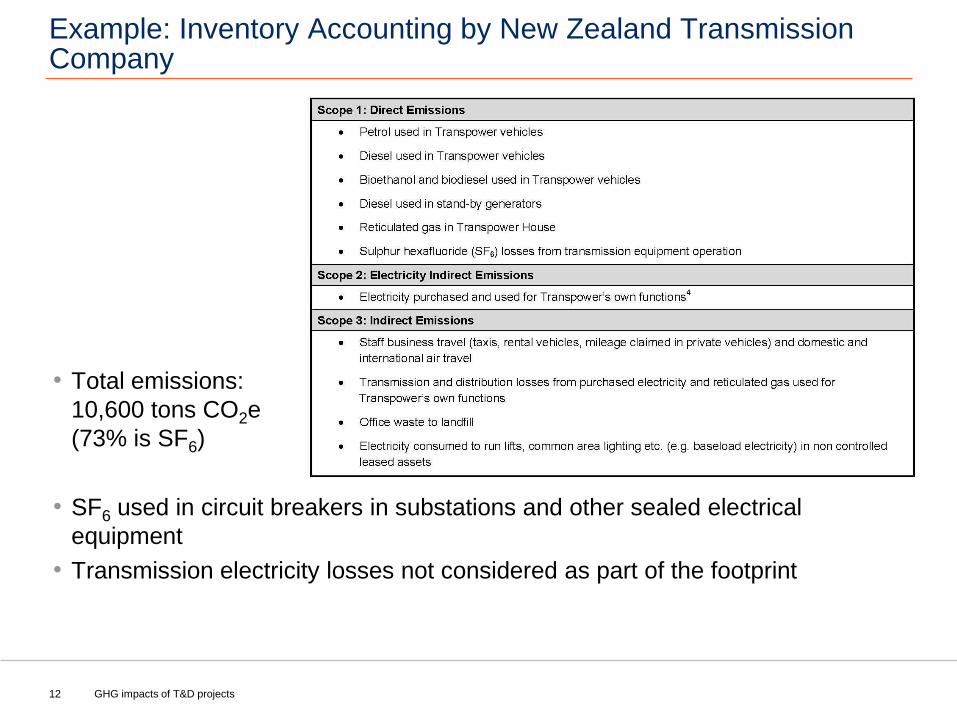
Example: Inventory Accounting by New Zealand Transmission Company
• Total emissions:
10,600 tons CO2e
(73% is SF6)
• SF6 used in circuit breakers in substations and other sealed electrical
equipment
• Transmission electricity losses not considered as part of the footprint
12 GHG impacts of T&D projects
Example of net emissions approach: transmission interconnection between two countries
• 220 kV onterconnection between
Cambodia and Vietnam
• 156 km line (220 kV/200 MW) to export
from Vietnam to Cambodia, along with
local grid strengthening in Phnom Penh
• Vietnamese grid is 40% hydropower while
Cambodia is 95% fuel oil
• Estimated emissions reductions from
cleaner energy exports: 536,000 tCO2 over
10 years
• Combined margin emissions: Vietnam
0.678 tCO2/MWh and Cambodia 0.741
tCO2/MWh
13 GHG impacts of T&D projects
Outline
• Study objective
• Background and rationale
• Basic GHG accounting principles
• Key GHG impacts and existing methodologies
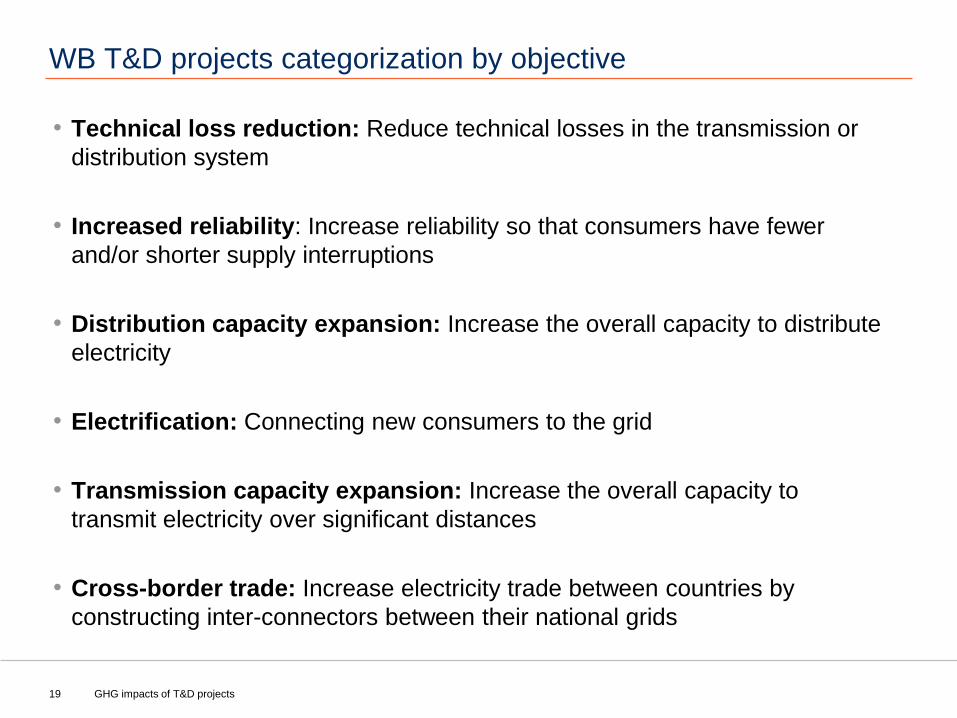
• WB’s T&D project types categorization
• Recommended approach for assessing GHG impacts
• Case studies
• Conclusions
14 GHG impacts of T&D projects
• Hypothetical project: 1000 km with 2 x 500 kV lines, clearing natural
tropical forest, aluminium and steel lines, in grid with emissions factor
of 700 kg CO2/MWh
• Direct emissions from transmission line
– Embodied emissions: 0.3 kg CO2/MWh
– Land clearing : 19 kg CO2/MWh
– Corona effect: ~1-3 kg CO2/MWh
– SF6: 2 kg CO2/MWh
• Impacts on generation emissions for different project alternatives
– Reduce technical losses from 15% to 10%: -35 kg CO2/MWh
– Expansion to serve suppressed demand: +700 kg CO2/MWh
– Expansion displacing diesel generators: -100 kg CO2/MWh
– Importing hydro power (EF100 kg CO2/MWh): -600 kg CO2/MWh
15 GHG impacts of T&D projects
The different impacts of T&D on emissions: example
Existing methodologies and case studies have narrower scopes
Transmission and Distribution Guidelines
IPCC 2006 Guidelines for National Greenhouse Gas
Inventories, Vol 3, Ch 8.2 Emissions of SF6 and PFCs from


![Electricity Storage in Buildings for Residential Sector ... · overall cost as well as life cycle greenhouse gas(GHG) emissions per unit of consumed electricity [1, 5]. The novel](https://static.documents.pub/doc/80x56/5f667ce2261e5a2bb459df62/electricity-storage-in-buildings-for-residential-sector-overall-cost-as-well.jpg)

