Groundwater Monitoring Report Central Nevada Test Area, Corrective Action Unit 443 April 2008 Office of Legacy Management DOE M/1538 2008 – –L Office of Legacy Management Office of Legacy Management Office of Legacy Management U.S. Department of Energy Work Performed Under DOE Contract No. for the U.S. Department of Energy Office of Legacy Management. DE–AM01–07LM00060 Approved for public release; distribution is unlimited.
Transcript
Groundwater Monitoring ReportCentral Nevada Test Area,Corrective Action Unit 443
April 2008
Office ofLegacy Management
DOE M/1538 2008––L
Office of Legacy ManagementOffice of Legacy ManagementOffice of Legacy ManagementU.S. Department
of Energy
Work Performed Under DOE Contract No.for the U.S. Department of Energy Office of Legacy Management.
DE–AM01–07LM00060
Approved for public release; distribution is unlimited.
This page intentionally left blank
DOE-LM/1538-2008
Groundwater Monitoring Report Central Nevada Test Area, Corrective Action Unit 443
April 2008 Work Performed by S.M. Stoller Corporation under DOE Contract No. DE–AM01–07LM00060
for the U.S. Department of Energy Office of Legacy Management, Grand Junction, Colorado
This page intentionally left blank
U.S. Department of Energy Groundwater Monitoring Report—CNTA, CAU 443 April 2008 Doc. No. S0366000 Page iii
Contents 1.0 Introduction......................................................................................................................... 1 2.0 Site Location and Background............................................................................................ 1 3.0 Geologic and Hydrologic Setting........................................................................................ 4 4.0 Monitoring Objectives ........................................................................................................ 4
4.1 Detection Monitoring................................................................................................. 4 4.2 System Monitoring..................................................................................................... 7
Figures Figure 1. Central Nevada Test Area Location Map........................................................................ 2 Figure 2. Location Map of Monitoring Wells and Boundaries at the CNTA................................. 3 Figure 3. Physiographic Features Near the Central Nevada Test Area .......................................... 5 Figure 4. Water Elevations in Reentry Well UC-1-P-2SR ............................................................. 6 Figure 5. Water Level Elevations for the Alluvial Wells and UC-1-P-1S...................................... 9 Figure 6. Water Level Elevations for the MV Well/Piezometers with the Highest Open Interval
in the Volcanic Section. ................................................................................................... 9 Figure 7. Water Level Elevations for the MV Wells/Piezometer with the Lowest Open Interval in
the Volcanic Section. ..................................................................................................... 10
Tables Table 1. Construction and Head Data for Wells at CNTA ............................................................. 6 Table 2. Radioisotopic Sampling Results ....................................................................................... 8
Appendixes Appendix A Well Purging Data Appendix B Carbon-14 Radioisotope Calculation Data
Groundwater Monitoring Report—CNTA, CAU 443 U.S. Department of Energy Doc. No. S0366000 April 2008 Page iv
End of current text
U.S. Department of Energy Groundwater Monitoring Report—CNTA, CAU 443 April 2008 Doc. No. S0366000 Page 1
1.0 Introduction
This report presents the 2007 groundwater monitoring results collected by the U.S. Department of Energy (DOE) Office of Legacy Management (LM) for the Central Nevada Test Area (CNTA) Corrective Action Unit (CAU) 443. Responsibility for the environmental site restoration of the CNTA was transferred from the DOE Office of Environmental Management (DOE-EM) to DOE-LM on October 1, 2006. Requirements for CAU 443 are specified in the Federal Facility Agreement and Consent Order (FFACO 2005) entered into by DOE, the U.S. Department of Defense, and the State of Nevada and includes groundwater monitoring in support of site closure. This is the first groundwater monitoring report prepared by DOE-LM for the CNTA.
2.0 Site Location and Background
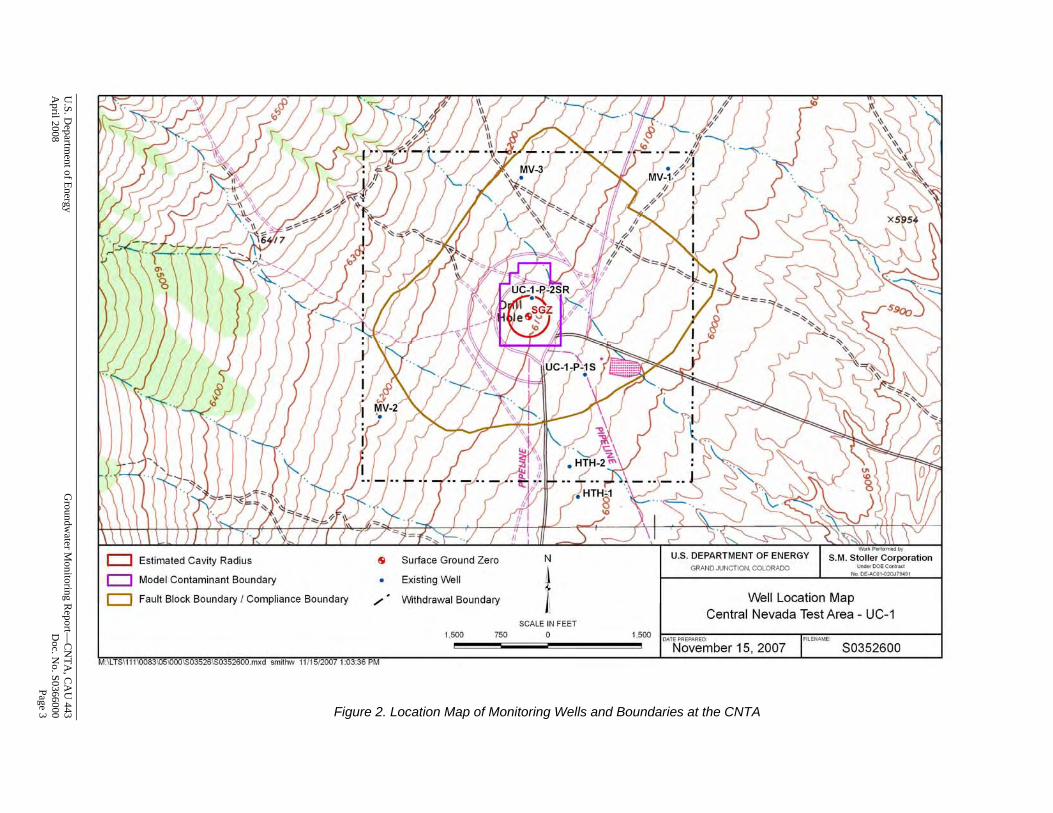
The CNTA is located north of U.S. Highway 6, approximately 30 miles north of Warm Springs in Nye County, Nevada (Figure 1). Three emplacement boreholes, UC-1, UC-3, and UC-4, were drilled at the CNTA for underground nuclear weapons testing. The initial underground nuclear test, Project Faultless, was conducted in borehole UC-1 at a depth of 3,199 feet (ft) (975 meters) below ground surface on January 19, 1968. The yield of the Project Faultless test was estimated to be 0.2 to 1 megaton (DOE 2004). The test resulted in a down-dropped fault block visible at land surface (Figure 2). No further testing was conducted at the CNTA, and the site was decommissioned as a testing facility in 1973. Surface and subsurface CAUs were identified at the CNTA and addressed through separate investigation and evaluation processes. The remediation of the surface CAU 417 was completed in 1999 and is described in the surface closure report (DOE 2001). The corrective action process for the subsurface CAU 443 has not yet been completed. The current status of CAU 443 is summarized in the remainder of this section. A Corrective Action Investigation Plan (CAIP) was developed and approved for CAU 443 in 1999. The CAIP outlined the specific objectives of the Corrective Action Investigation (CAI). The objectives outlined in the CAIP are provided below:
• Determine the characteristics of the groundwater flow system, the sources of contamination, and the transport processes to acceptable levels of uncertainty;
• Develop a credible numerical model of groundwater flow and contaminant transport for the UC-1 Subsurface Corrective Action Site and downgradient areas; and
• Develop stochastic predictions of the contaminant boundary at an acceptable level of uncertainty (DOE 1998).
These objectives were accomplished using existing data to develop a numeric model and predict the contaminant boundary for the site (Pohlmann et al. 1999).
Groundwater Monitoring Report—CNTA, CAU 443 U.S. Department of Energy Doc. No. S0366000 April 2008 Page 2
Figure 1. Central Nevada Test Area Location Map Results of the CAI and the corrective action evaluation were presented in the Corrective Action Decision Document/Corrective Action Plan (CADD/CAP) (DOE 2004). Modeling indicated that groundwater velocities at the site were very slow (due to very low hydraulic conductivities) and predicted that the contaminant boundary would be very small (between two and three radii of the cavity from the working point [DOE 2004]). A compliance boundary was negotiated; it factored in modeling results as well as associated uncertainties, especially with respect to the potential effects of the nuclear test within the down-dropped fault block. The compliance boundary corresponds approximately to the boundaries of the fault block and is contained fully within the land withdrawal boundary (Figure 2). The preferred corrective action alternative selected in the CADD/CAP was proof of concept and monitoring with institutional controls. Three wells (MV-1, MV-2, and MV-3) were installed in 2005 for the dual purpose of monitoring groundwater flow and validating the transport model. Hydraulic heads observed in these wells were in significant disagreement with heads predicted by the groundwater flow model, meaning the model could not be validated. Instead of additional modeling, DOE proposed a “path forward” (DOE 2007) that consisted of validating the compliance boundary through groundwater monitoring over a new 5-year proof-of-concept period. The revised approach is described in the CADD/CAP addendum (DOE 2008). The groundwater monitoring activities completed in February 2007 and presented in this report were conducted following the requirements of the original CADD/CAP (DOE 2004). The new 5 year proof-of-concept monitoring period shall begin upon the completion of two new alluvial wells (DOE 2008).
Figure 2. Location Map of Monitoring Wells and Boundaries at the CNTA
U.S. D
epartment of Energy
Groundw
ater Monitoring R
eport—C
NTA
, CA
U 443
April 2008
Doc. N
o. S0366000
Page 3
Groundwater Monitoring Report—CNTA, CAU 443 U.S. Department of Energy Doc. No. S0366000 April 2008 Page 4
3.0 Geologic and Hydrologic Setting
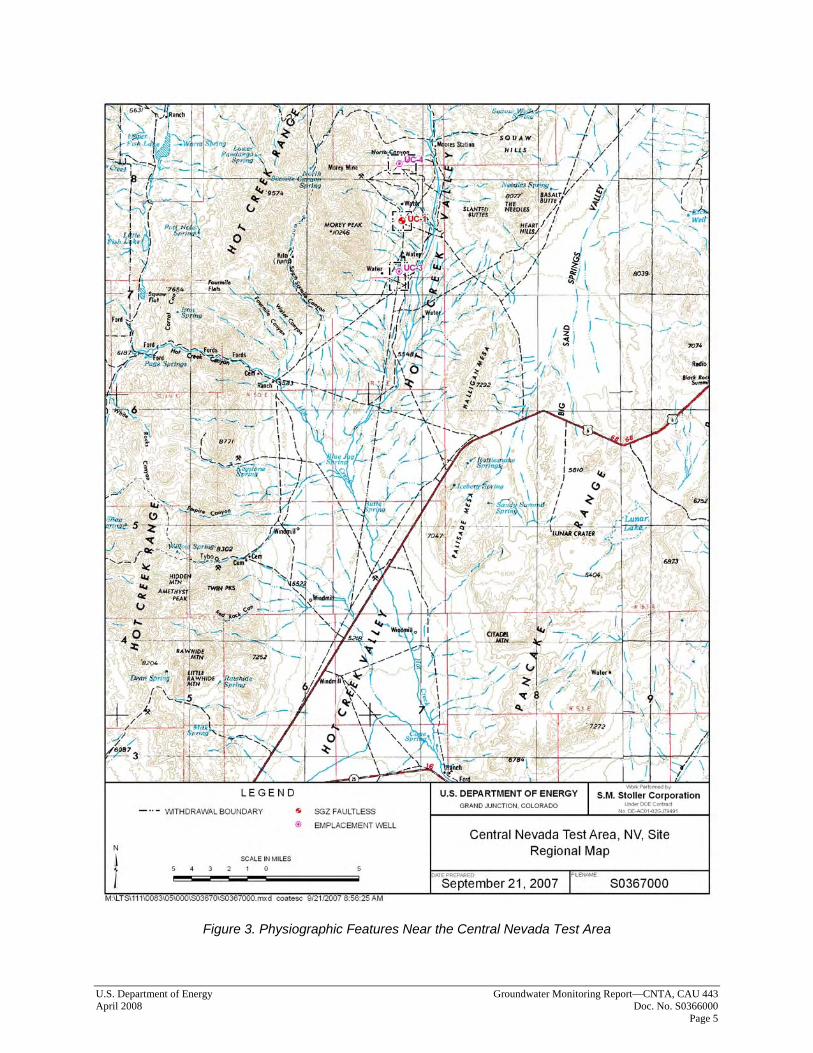
The CNTA is in south-central Nevada in Hot Creek Valley (Figure 3), a north-south trending graben that is 68 miles long and located in the Basin and Range physiographic province. Hot Creek Valley varies in width from 5 to 19 miles and contains two major units—a thick sequence of Quaternary- and Tertiary-age alluvial deposits (“alluvium”) underlain by a thick section of Tertiary-age volcanic rocks (“volcanics”). In the immediate vicinity of UC-1 (the Faultless test), the thickness of alluvium ranges from 1,960 ft to 2,410 ft, based on logs of the three monitoring/validation (MV) wells installed in 2005. The Tertiary volcanics below the alluvium include tuffaceous sediments, welded and nonwelded tuffs, and rhyolite lavas. The cavity created by the Faultless test in the Tertiary volcanics resulted in a collapse chimney that extends upward into the alluvium. Water in the reentry well, UC-1-P-2SR, drilled into the chimney, has not yet recovered to pre-test levels (Figure 4) due to the very low permeability of the volcanic section. The depressed water levels in and near the test cavity inhibit the movement of contamination both horizontally and vertically away from the detonation zone. The most likely migration path for contamination moving away from the detonation zone is downward. Regional hydrologic data, supported by measurements in the MV wells, suggest that permeable zones in the deep volcanic section support flow to the north-northeast, toward Railroad Valley. These permeable zones occur in fractured densely welded tuff (DWT) units. The MV wells identified only a thin zone of DWT below the cavity, separated from it by very low permeability tuffaceous sediments. The DWT in this area was less permeable than expected.
4.0 Monitoring Objectives
The two major objectives of the monitoring identified in the CADD/CAP (DOE 2004) are (1) “detection monitoring” to identify any releases of contamination from the test cavity itself and (2) “system monitoring” to ensure the overall stability (quasi-steady state) of the hydrogeologic system. The 2007 monitoring network at CNTA consisted of wells MV-1, MV-2, and MV-3, and piezometers MV-1UPZ, MV1-LPZ, MV-2UPZ, MV2-LPZ, MV-3UPZ, and MV3-LPZ. Well locations are shown in Figure 2. A summary of well-construction data is presented in Table 1. 4.1 Detection Monitoring Detection monitoring is performed by collecting groundwater samples for radioisotopic analyses from the MV wells at the site. Tritium is the analyte selected as an indicator of contaminant migration from the cavity due to its mobility and abundance in the first 100-year, post-shot monitoring period. However, because of tritium’s short half-life, monitoring of C-14 and I-129 will also be conducted in support of long-term post-closure monitoring; data for these latter two isotopes collected in the near term will provide a background/baseline for post-closure monitoring. According to the CADD/CAP, once baseline values for C-14 and I-129 are established, analysis may be deferred for several decades. After the proof-of-concept monitoring phase has ended, the long-term monitoring requirements will be presented in the site Closure Report.
U.S. Department of Energy Groundwater Monitoring Report—CNTA, CAU 443 April 2008 Doc. No. S0366000 Page 5
Figure 3. Physiographic Features Near the Central Nevada Test Area
Groundwater Monitoring Report—CNTA, CAU 443 U.S. Department of Energy Doc. No. S0366000 April 2008 Page 6
UC-1-P-2SR Water Elevations
3800
4000
4200
4400
4600
4800
5000
5200
5400
5600
5800
Jan-67 Jan-77 Jan-87 Jan-97 Jan-07
elev
atio
n [ft
]
Figure 4. Water Elevations in Reentry Well UC-1-P-2SR (http://nevada.usgs.gov/doe_nv/sitepage_temp.cfm?site_id=383806116125951)
Table 1. Construction and Head Data for Wells at CNTA
TOC = Top of casing (well/piezometer). TSZ, BSZ (top and bottom of open interval, screened or perforated). aHole directionally drilled to get to test cavity/chimney; due to drilling problems, completion data are not certain. bAlluvium with possible contribution from volcanics.
U.S. Department of Energy Groundwater Monitoring Report—CNTA, CAU 443 April 2008 Doc. No. S0366000 Page 7
The CADD/CAP (page 41) established groundwater compliance levels for the site of 20,000 picocuries per liter (pCi/L) tritium, 2,000 pCi/L C-14, and 1 pCi/L I-129 (DOE 2004). These levels are not to be exceeded outside the compliance boundary; the transport modeling predicts that concentrations of these constituents will remain below current detection limits at the contaminant boundary (DOE 2004), which is well within the compliance boundary (see Figure 2). 4.2 System Monitoring System monitoring is performed by measuring hydraulic head in the MV wells and piezometers at the site. Transducers were installed in the MV wells in March 2007 to increase the frequency of data collection at the site. In addition to the MV wells, depth-to-groundwater measurements were collected from wells HTH-1, HTH-2, and UC-1-P-1S. Head monitoring will be conducted during the 5-year proof-of-concept period. As stated in the CADD/CAP (page 74), “Hydraulic head will be used to monitor the quasi steady-state of the groundwater system; i.e., to determine if mean hydraulic head values remain constant through time, given fluctuations caused by natural temporal stresses and stresses related to well drilling, construction, and testing. This requires first determining when heads have stabilized following drilling and testing activities, then quantifying the natural mean and temporal variation in hydraulic head, and finally comparing subsequent monitoring measurements to that range.”
5.0 Monitoring Results
As described in the CADD/CAP (page 74), the 2007 monitoring program required the measurement of four parameters—hydraulic head and activities of carbon-14, iodine-129, and tritium—from three monitor wells (MV-1, MV-2, and MV-3). Head measurements were collected from all wells and are presented in Section 5.2. Groundwater samples for radioisotopic analysis could only be collected from wells MV-2 and MV-3 due to pump problems associated with MV-1. Radioisotopic data that were collected are presented in Section 5.1. The monitoring activities at CNTA were conducted February 20 through 23, 2007. 5.1 Radioisotopic Results The DOE-LM Sampling and Analysis Plan (DOE 2006) was used to guide the use of standard operating procedures to ensure quality assurance and quality control of the monitoring program at CNTA. Radioisotopes of carbon, iodine, and hydrogen were analyzed in water samples collected from wells MV-2 and MV-3. The wells were purged prior to sampling, then sampled using dedicated submersible pumps. The purging process is intended to remove stagnant water from the well bore to acquire a sample that is representative of water within the adjacent geologic formation. Because of low production rates from wells MV-2 and MV-3, it was not possible to purge a full well volume from either well. Instead, a modified procedure was used to collect representative water samples. These wells were purged until a well-screen volume was removed, the field parameters stabilized, and drawdown in the well was below the lift capacity of the pump. The wells were then allowed to recover overnight, and they were sampled the following day.
Groundwater Monitoring Report—CNTA, CAU 443 U.S. Department of Energy Doc. No. S0366000 April 2008 Page 8
Due to problems with the pump, MV-1 could not be sampled during the February 2007 sampling event. The pump was replaced in September, and MV-1 was sampled in October 2007. Results of those analyses will be submitted in the next annual report. Field parameter stabilization measurements during well purge activities are presented in Appendix A. Radioisotopic sampling results are presented in Table 2. Tritium results for 2007 continue to be below detection limits as in previous sampling rounds. Estimated activities of C-14 and I-129 are comparable to previous sampling results and continue to provide a baseline for long-term monitoring. Once sufficient data for C-14 and I-129 have been compiled to serve as a representative baseline foundation, sampling frequency for those constituents may be reduced. Data used to calculate the radioisotope activities are provided in Appendix B.
a2006 sample results from DRI (2006). bEstimated based on sample volume of 200 milliliters. NS = not sampled. <RDL = below required detection limit with laboratory result in parentheses. 5.2 Hydraulic Head After evaluation of water level data from the site (both transducer data recorded by DRI during the aquifer testing and subsequent water level measurements taken in September 2006 and February 2007), the decision was made to install transducers in all readily accessible wells at the CNTA (the MV wells and piezometers, wells UC-1-P-1S, HTH-1, and HTH-2). The wells (and piezometers) with transducers and the date of installation are listed in Table 1. Transducers provide an essentially continuous record (every hour or few hours) of water levels in wells screened in the various units at the site. This will allow seasonal variability and other effects, such as the recovery of water levels from yearly sampling events, to be identified and considered when interpreting flow gradients at the site. The well hydrographs of hydraulic head data collected during site visits and historical data are presented in Figure 5 through Figure 7. They are grouped by the relative depth of open interval: alluvial wells, upper open interval in the volcanic section, and lower open interval in the volcanic section.
U.S. Department of Energy Groundwater Monitoring Report—CNTA, CAU 443 April 2008 Doc. No. S0366000 Page 9
Water Elevations (Open Interval in the Alluvium)
5700
5725
5750
5775
5800
Jul-05 Jul-06 Jul-07 Jun-08
elev
atio
n (ft
)
5400
5450
5500
5550
5600
MV-1-UMV-1UMV-2-UMV-2UMV-3-UMV-3UUC-1-P-1SHTH-2
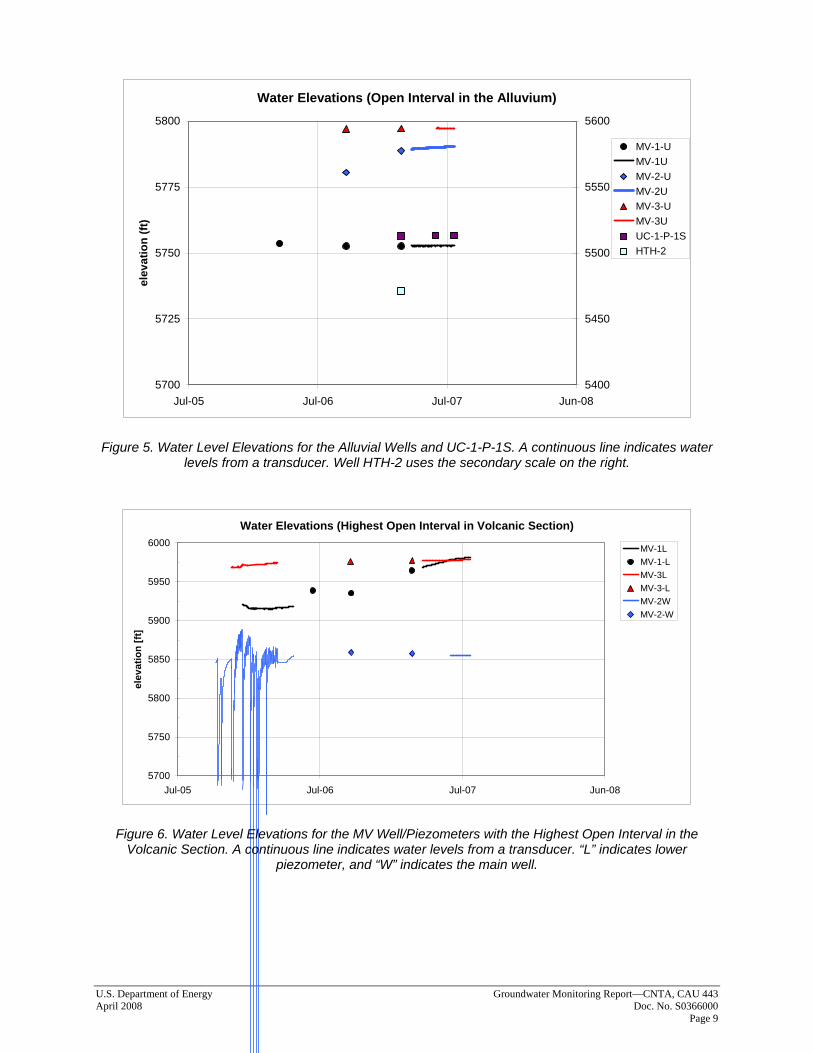
Figure 5. Water Level Elevations for the Alluvial Wells and UC-1-P-1S. A continuous line indicates water
levels from a transducer. Well HTH-2 uses the secondary scale on the right.
Water Elevations (Highest Open Interval in Volcanic Section)
5700
5750
5800
5850
5900
5950
6000
Jul-05 Jul-06 Jul-07 Jun-08
elev
atio
n [ft
]
MV-1LMV-1-LMV-3LMV-3-LMV-2WMV-2-W
Figure 6. Water Level Elevations for the MV Well/Piezometers with the Highest Open Interval in the Volcanic Section. A continuous line indicates water levels from a transducer. “L” indicates lower
piezometer, and “W” indicates the main well.
Groundwater Monitoring Report—CNTA, CAU 443 U.S. Department of Energy Doc. No. S0366000 April 2008 Page 10
Water Elevations (Lowest Open Interval in Volcanic Section)
5500
5525
5550
5575
5600
Jul-05 Jul-06 Jul-07 Jun-08
elev
atio
n (ft
)
5750
5775
5800
5825
5850
MV-1WMV-1-WMV-3WMV-3-WMV-2LMV-2-L
Figure 7. Water Level Elevations for the MV Wells/Piezometer with the Lowest Open Interval in the Volcanic Section. A continuous line indicates water levels from a transducer. “MV-2L” uses the secondary
scale on the right. Water levels in the alluvium are monitored by the MV alluvial piezometers and well HTH-2. The slow return of water level in the MV-2 upper piezometer to a relative equilibrium is due to difficulties encountered during development. The water level data from well UC-1-P-1S are plotted with data from the alluvial wells, though the UC-1-P-1S drilling history is complicated, and groundwater in that well may be in communication with groundwater in the volcanic section. The highest open intervals in the volcanic section at the MV well clusters are the MV-2 main well and the lower MV-1 and MV-3 piezometers (Figure 6). Wells and piezometers in the volcanic section are slow to recover from pumping due to the low permeability of the adjacent geologic formation. The MV-1 lower piezometer is still recovering from the bailing associated with development (black, Figure 6). The lowest open intervals in the volcanic section at the MV well clusters are the MV-2 lower piezometer and the MV-1 and MV-3 main wells (Figure 7). Wells and piezometers in the volcanic section are recovering slowly from well development due to the low permeability of the adjacent formation. Well MV-3 (red, Figure 7) was still recovering from the February 2007 sampling event 5 months later. The slow recovery of water levels in the wells in the volcanic section supports the low permeability values calculated from the aquifer tests.
6.0 Summary
Detection monitoring results indicate that radioisotope levels in groundwater continue to remain below compliance levels. Water level data indicate that hydraulic heads still appear to be recovering from well drilling, development, aquifer testing, and sampling, and the data support the presence of extremely low hydraulic conductivities in the vicinity of the test cavity. Well
U.S. Department of Energy Groundwater Monitoring Report—CNTA, CAU 443 April 2008 Doc. No. S0366000 Page 11
MV-1 could not be sampled during the February 2007 event; subsequent sampling did take place, but results were not available for this report. Those data will be presented in the next annual report.
7.0 References
DOE (U.S. Department of Energy, Nevada Operations Office), 1998. Corrective Action Investigation Plan for the Central Nevada Test Area Subsurface Sites (Corrective Action Unit No. 443), Rev. 1, DOE/NV-483-Rev. 1, Las Vegas, Nevada, February. DOE (U.S. Department of Energy, National Nuclear Security Administration Nevada Site Office), 2001. Closure Report for Corrective Action Unit 417: Central Nevada Test Area Surface, Nevada, DOE/NV-743, Rev. 1, Las Vegas, Nevada, November. DOE (U.S. Department of Energy, National Nuclear Security Administration Nevada Site Office), 2004. Corrective Action Decision Document/Corrective Action Plan for Corrective Action Unit 443: Central Nevada Test Area (CNTA)—Subsurface, Rev. 0, DOE/NV-977, Las Vegas, Nevada. DOE (U.S. Department of Energy, Office of Legacy Management), 2006. Sampling and Analysis Plan for U.S. Department of Energy Office of Legacy Management Sites, DOE-LM/GJ1197-2006. DOE (U.S. Department of Energy, Office of Legacy Management), 2007. Corrective Action Plan Path Forward Proposal, Central Nevada Test Area, April. DOE (U.S. Department of Energy, Office of Legacy Management), 2008. Addendum to: Corrective Action Decision Document/Corrective Action Plan (CADD/CAP) for Corrective Action Unit (CAU) 443: Central Nevada Test Area (CNTA) – Subsurface Central Nevada Test Area, Nevada, DOE/NV-977, DOE−LM/1555-2007, January. DRI (Desert Research Institute), 2006. Central Nevada Test Area Monitoring Report, Publication No. 45222, DOE/NV/13609-52, September. FFACO (Federal Facility Agreement and Consent Order), 2005. Federal Facility Agreement and Consent Order (FFACO), January. Pohlmann, K.F., J. Chapman, A. Hassan, and C. Papelis, 1999. Evaluation of Groundwater Flow and Transport at the Faultless Underground Nuclear Test, Central Nevada Test Area, Publication No. 45184, U.S. Department of Energy, Nevada Operations Office report DOE/NV/13609-13, Las Vegas, Nevada: Desert Research Institute, Division of Hydrologic Sciences, 152p.
Groundwater Monitoring Report—CNTA, CAU 443 U.S. Department of Energy Doc. No. S0366000 April 2008 Page 12
End of current text
Appendix A
Well Purging Data
This page intentionally left blank
U.S. Department of Energy Groundwater Monitoring Report—CNTA, CAU 443 April 2008 Doc. No. S0366000 Page A−3
Time Total Vol. Purged (gal) Temp (oC) Spec. Cond.
aModern 14C standard at 1950 AD has activity of 13.6 dpm/gram C = 0.000227 dps/mg C (1 μCi = 3.7 x 10⁴ dps); therefore, modern 14C standard at 1950 AD has activity of 6.135 x 10⁻⁹ μCi/mg. bAssumes 200 mL sampled used to obtain mass of carbon. pmc = percent modern carbon; mc = modern carbon; s = standard deviation
Groundwater Monitoring Report—CNTA, CAU 443 U.S. Department of Energy Doc. No. S0366000 April 2008 Page B−4