45
HAMA 2 October 2009 Bobby Bowers Smith Travel Research / STR Global
| Date post: | 29-Dec-2015 |
| Category: |
Documents |
| Upload: | charla-york |
| View: | 214 times |
| Download: | 0 times |

HAMA
2 October 2009
Bobby Bowers
Smith Travel Research /
STR Global

Presentation Outline
• Global / U.S. Overview
• Chain Scales
• Markets
• Pipeline
• 2009 / 2010 Forecast

www.strglobal.com
615.824.8664 x3321
Want a copy of the presentation?
Have questions about the presentation?
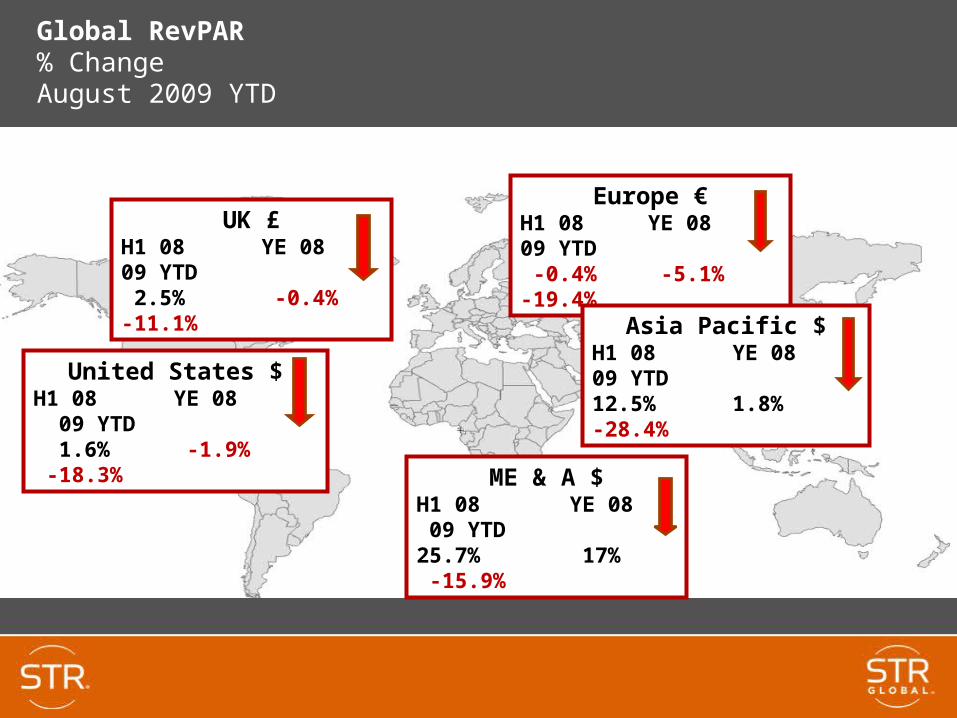
Europe €H1 08 YE 08 09 YTD -0.4% -5.1% -19.4%
ME & A $H1 08 YE 08 09 YTD25.7% 17% -15.9%
Asia Pacific $H1 08 YE 08 09 YTD12.5% 1.8% -28.4%United States $
H1 08 YE 08 09 YTD 1.6% -1.9% -18.3%
UK £H1 08 YE 08 09 YTD 2.5% -0.4% -11.1%
Global RevPAR% Change August 2009 YTD

-10.3
2.5
-1.8-4.2
-1.8
2.6 3.2
-9.0-7.4
-18.3
-25
-20
-15
-10
-5
0
5
10
Supply Demand Occ ADR RevPAR
2008 YTD 2009
Total United StatesKey Performance Indicators Percent ChangeFull Year 2008 / August 2009 YTD

-8.9
-19.9
-12.0-14.5
-6.3-8.8
-25
-20
-15
-10
-5
0
5
10
Occ ADR RevPAR
Weekday Weekend
Total United StatesWeekday / Weekend Percent ChangeAugust 2009 YTD
Weekends = Friday / Saturday

Total United StatesQuarterly RevPar Percent Change / 2007 - 2Q 09
5.3 6.2
2.0 1.4
-1.1
-9.8
-17.7-19.5
-17.3
6.05.6
-25
-20
-15
-10
-5
0
5
10
1Q 07 2Q 07 3Q 07 4Q 07 1Q 08 2Q 08 3Q 08 4Q 08 1Q 09 2Q 09 7/8 09

-8
-6
-4
-2
0
2
4
6
1989 1991 1993 1995 1997 1999 2001 2003 2005 2007 2009
Supply % Change
Demand % Change
Total United StatesRoom Supply/Demand Percent ChangeTwelve Month Moving Average – 1989 to August 2009
2008 Smith Travel Research, Inc.
3.1%
-6.6%
-1.1%
- 4.8%

-12-10-8-6-4-202468
10
1989 1991 1993 1995 1997 1999 2001 2003 2005 2007 2009
Occ % Chg
ADR % Chg
Total United StatesOccupancy/ADR Percent ChangeTwelve Month Moving Average – 1989 to August 2009
-3.4%
-6.8%-9.5%
-6.3%
-4.7%
0.1%

-20
-15
-10
-5
0
5
10
15
1989 1991 1993 1995 1997 1999 2001 2003 2005 2007 2009
RevPAR % Chg
-2.7%
Total United StatesRevPAR Percent ChangeTwelve Month Moving Average – 1989 to August 2009
2008 Smith Travel Research, Inc.
-10.5% - 15.1%

Chain Scales

STR Chain ScalesSelected Brands by Category
• Luxury – Four Seasons, Ritz Carlton, Fairmont
• Upper Upscale – Marriott, Hilton, Hyatt, Sheraton
• Upscale – Courtyard, Springhill Suites, Crowne Plaza
• Midscale with F&B – Holiday Inn, Best Western, Quality
• Midscale no F&B – Hampton, TownePlace, H.I. Express
• Economy – Days Inn, Red Roof, Econolodge

8.9
4.9
9.1
-1.5
7.2
1.3
-4.9 -5.2
-2.1
-12.8
-4.7
-8.6
-20
-15
-10
-5
0
5
10
15
Luxury UpperUpscale
Upscale Mid w F&B Mid wo F&B Economy
SupplyDemand
Chain ScalesSupply/Demand Percent ChangeAugust 2009 YTD

-11.4
-5.9
-11.2
-9.7
-11.6-10.2
-9.9
-12.6
-5.8
-16.8
-9.9
-5.0
-20
-15
-10
-5
0
Luxury UpperUpscale
Upscale Mid w F&B Mid wo F&B Economy
OccupancyADR
Chain ScalesOccupancy/ADR Percent ChangeAugust 2009 YTD

61.7 62.5
51.9
58.0
51.0
64.6
30
35
40
45
50
55
60
65
70
Luxury UpperUpscale
Upscale MidscaleW/FB
Midscalew/o FB
Economy
Chain ScaleOccupancy PercentAugust 2009 YTD

$142.31
$108.73
$84.22
$51.88
$86.42
$241.44
25
75
125
175
225
275
Luxury UpperUpscale
Upscale MidscaleW/FB
Midscale w/oFB
Economy
Chain ScalesAverage Daily Rate August 2009 YTD

-30
-20
-10
0
10
20
1/31/08
Group Demand
Transient Demand
9/26/09
United States – Upper Tier Hotels28 Day Moving Average Group & Transient Demand % ChangeJan 31, 2008 – September 26th, 2009

-20
-10
0
10
1/31/08
Group ADR
Transient ADR
9/26/09
United States – Upper Tier Hotels28 Day Moving Average Group & Transient ADR % ChangeJan 31, 2008 – September 26th, 2009

-25
-20
-15
-10
-5
0
5
10
J F M A M J J A S O N D J F M A M J J A S
Total U.S. RevPAR - Monthly Percent ChangeJanuary 2008 – September 2009
20092008
September based on reporting through 9.26

-15
-10
-5
0
5
10
J F M A M J J A S O N D J F M A M J J A S
Total U.S.Average Daily Rate - Monthly Percent ChangeJanuary 2008 – September 2009
20092008
September based on reporting through 9.26

-15
-10
-5
0
5
J F M A M J J A S O N D J F M A M J J A S
Total U.S.Occupancy - Monthly Percent ChangeJanuary 2008 – September 2009
20092008
September based on reporting through 9.26

Market Performance

-11.9
-7.7
-10.5
-18.7
3.1
-10.2
3.2
-6.8-7.2
-13.6
-25
-20
-15
-10
-5
0
5
10
Supply Demand Occ ADR RevPAR
Top 25 Rest of U.S.
Top 25 Markets versus rest of U.S.Key Performance Indicators Percent ChangeAugust 2009 YTD

-27.4
-26.0
-23.1
-22.8
-22.4
-22.4
-20.6
-19.9
-19.7
-19.5
-18.7
-18.4
-18.3
-16.0
-7.1
-32.4
-35 -30 -25 -20 -15 -10 -5 0
NEW YORK
PHOENIX
CHICAGO
SAN DIEGO
MIAMI
LOS ANGELES
SAN FRANCISCO
ORLANDO
ANAHEIM
ATLANTA
DALLAS
BOSTON
HONOLULU
U.S.
HOUSTON
DC
Key 15 MarketsRevPar Percent ChangeAugust YTD 2009
Excludes Las Vegas

-2.2
-2.0
-1.8
-1.8
-1.2
-1.0
-1.0
0.6
1.9
2.6
3.1
3.4
4.9
-0.2
7.9
-5 0 5 10
Corbin/London, KY
Tacoma/Olympia, WA
Georgetown/Richmond, KY
Branson, MO
Lubbock, TX
Shreveport, LA
Charleston, WV
Pensacola, FL
Rapid City, SD
Lynchburg, VA
Gallup/Grants, NM
Evansville-Henderson, IL
Fargo, ND
Orangeburg/Sumter, SC
Bismarck, ND
15 Markets outside the Top 25RevPar Percent ChangeAugust YTD 2009

Pipeline

Total United StatesActive Development Pipeline - RoomsChange From Prior Year
Aug 2009 Aug 2008 Change % Chg
In Construction 130,471 195,947 -65,476 -33.4%
“Planned” Pipeline 345,050 463,843 -118,793 -25.6%
Planned Pipeline includes projects in Final Planning and Planning phases
Source: STR / TWR / Dodge Construction Pipeline

0
50
100
150
200
250
2003/01 2004/01 2005/01 2006/01 2007/01 2008/01 2009/01-60
-40
-20
0
20
40
60
80
UC Rooms % Change
Total U.S.Hotel Rooms Under Construction and Percent ChangeJanuary 2003 –August 2009
Under Construction room percentage change measured against same month, prior year.

Total United StatesRooms Under Construction by Scale – In ThousandsAugust 2009
5.7
12.8
34.7
43.0
9.0
5.0
20.3
0
10
20
30
40
50
60
Luxury Upper Upscale Upscale Mid w F&B Mid w/o F&B Economy Unaffiliated
Source: STR / Dodge Construction Pipeline

4.3
4.4
4.9
5.0
5.1
5.3
5.6
8.6
11.4
4.1
0 5 10 15
Candlewood
Courtyard
Fairfield
Marriott
Comfort
Springhill
Hilton G.I.
Holiday Inn
H.I. Express
Hampton Inn
Top Brands – Rooms Under ConstructionAugust 2009 – in Thousands
Top 10 brands = 45% U.S. under construction rooms

3.3
3.3
3.5
3.7
4.1
4.4
5.7
7.0
13.1
2.9
0 5 10 15
Los Angeles
Atlanta
Phoenix
Orlando
Dallas
DC
San Antonio
Houston
Las Vegas
New York
Top 10 MSAs – Rooms Under ConstructionAugust 2009 – in Thousands
39% of all under construction rooms

5.5
5.6
5.6
6.5
7.4
7.9
8.1
8.1
10.7
5.3
0 5 10 15
Richmond, VA
Austin
Oklahoma City
Phoenix
Indianapolis
Houston
Raleigh
Tulsa
New York
San Antonio
Top 10 MSAsRooms Under Construction - % Existing SupplyAugust 2009

Projections

U.S. Economic OutlookBlue Chip Economic Indicators – September 2009
2008 2009F 2010F
Real GDP +0.4% -2.6% +2.4%
CPI +3.8% -0.5% +1.8%
Corporate Profits -11.8% -8.1% +9.8%
Disp Personal Income +0.5% +0.8% +1.7%
Unemployment Rate 5.8% 9.2% 9.8%

-5
-4
-3
-2
-1
0
1
2
3
4
5
6
1988q1 1991q1 1994q1 1997q1 2000q1 2003q1 2006q1 20091Q-10
-8
-6
-4
-2
0
2
4
6
8
GDP % Chg Demand % Chg
Total U.S.Hotel Rooms Sold vs. Real GDP ChangeQuarterly Change – 1988 to 2009 2Q
Real GDP and Lodging Demand measured against same quarter, prior year.Real GDP left scale / Rooms sold right scale.

Real GDP Growth ForecastQuarterly Percent Change vs. Same Quarter Prior Year
0.0
-3.3
-2.5
-0.6
1.7
2.6 2.6 2.7
-3.9
-1.9
-5
-4
-3
-2
-1
0
1
2
3
4
5
3Q 08 4Q 08 1Q 09 2Q 09 3Q 09 4Q 09 1Q 10 2Q 10 3Q 10 4Q 10
Source: Blue Chip Economic Indicators – 10 September 2009

-0.6
-9.7
-5.5
-8.4
-17.1
3.01.8
-3.4
1.3
-4.0
-20
-15
-10
-5
0
5
10
Supply Demand Occ ADR RevPAR
2009 F 2010 F
Total United StatesKey Performance Indicators Percent ChangeFull Year 2009 & 2010 Forecast

Total US Industry Consecutive Quarterly DeclinesKey Indicators
1990/1991
2001/2002
Current(Q2-09)
Estimate 2008/09
Demand 3 5 6 9
Occupancy 7 6 7 11
ADR 0 5 3 9
RevPAR 5 5 4 9
Room Revenue 2 5 4 7

3.0
-4.5
-7.3
2.0
0.2
-1.8
1.7
2.6
0.91.3
3.0
1.7
2.7
-3.4
-0.8-1.0
-3.3
2.4
-10
-5
0
5
Supply Demand Occupancy
Total United StatesSupply, Demand & Occupancy ForecastQ3 2009 – Q4 2010
2008 Smith Travel Research, Inc.

-11.0
-17.5
-15.0
-4.4
-6.1
-4.2
-2.2-1.3
0.4
-1.5
0.2
1.5
-13.0
-10.6-9.9
-5.6-6.5
-8.7
-20
-15
-10
-5
0
5
ADR RevPar Revenue
Total United StatesADR, RevPar and Room Revenue ForecastQ3 2009 – Q4 2010

Total United StatesOccupancy Percent2003 – 2010P
59.2
61.4
63.1 63.3 63.1
60.4
55.4 55.1
50
60
70
2003 2004 2005 2006 2007 2008 2009P 2010P

$86.40$91.16
$97.99
$106.78
$96.43$93.16
$82.95
$104.07
$50
$75
$100
$125
2003 2004 2005 2006 2007 2008 2009P 2010P
Total United States Average Daily Rate 2003 – 2010P

86.40 91.16 104.07 106.78 96.43 93.1684.0685.29 97.9982.9582.82
$87.73$89.11
$91.15
$93.57
$96.74
$99.86
$105.90$107.81$106.65
$85.30
$102.71
80
90
100
110
Nominal ADRYr 2000, Grown by CPI
If year 2000 ADR had increased by CPI each year…
Total US Room RatesActual vs. Inflation Adjusted2000 – 2010E

STR Chain Scale Forecast
2009 2010Segment RevPar Chg RevPar Chg
Luxury -25.0 / -28.0 -7.0 / -10.0
Upper Upscale -18.0 / -21.0 -1.0 / -4.0
Upscale -16.0 / -19.0 -5.0 / -8.0
Midscale with F&B -12.5 / -15.5 -3.0 / -6.0
Midscale without F&B -10.5 / -13.5 +1.0 / -2.0
Economy -13.0 / -16.0 Flat / -3.0
Forecast produced August 2009

Takeaways
• Decline is global
• Supply growth still an issue
• Demand declines may be near bottom
• ADR weakness continues
• “Less Worse” 2H 2009
• Moderate improvement 2010
• Meaningful growth anticipated 2011


