High-resolution characterization of the pancreaticadenocarcinoma genomeAndrew J. Aguirre*†, Cameron Brennan*†, Gerald Bailey‡, Raktim Sinha*, Bin Feng*, Christopher Leo*, Yunyu Zhang*,Jean Zhang*, Joseph D. Gans*, Nabeel Bardeesy*, Craig Cauwels*, Carlos Cordon-Cardo§, Mark S. Redston‡,Ronald A. DePinho*, and Lynda Chin*¶�
*Department of Medical Oncology, Dana–Farber Cancer Institute, Boston, MA 02115; ‡Department of Pathology, Brigham and Women’s Hospital, Boston,MA 02115; §Department of Pathology, Memorial Sloan–Kettering Cancer Center, New York, NY 10021; and ¶Department of Dermatology, Brigham andWomen’s Hospital and Harvard Medical School, Boston, MA 02115
Communicated by Lewis C. Cantley, Harvard Institutes of Medicine, Boston, MA, April 27, 2004 (received for review February 18, 2004)
The pancreatic adenocarcinoma genome harbors multiple amplifi-cations and deletions, pointing to the existence of numerousoncogenes and tumor suppressor genes driving the genesis andprogression of this lethal cancer. Here, array comparative genomichybridization on a cDNA microarray platform and informatics toolshave been used to define the copy number alterations in a panelof 24 pancreatic adenocarcinoma cell lines and 13 primary tumorspecimens. This high-resolution genomic analysis has identified allknown regional gains and losses as well as many previouslyuncharacterized highly recurrent copy number alterations. A sys-tematic prioritization scheme has selected 64 focal minimal com-mon regions (MCRs) of recurrent copy number change. These MCRspossess a median size of 2.7 megabases (Mb), with 21 (33%) MCRsspanning 1 Mb or less (median of 0.33 Mb) and possessing anaverage of 15 annotated genes. Furthermore, complementaryexpression profile analysis of a significant fraction of the genesresiding within these 64 prioritized MCRs has enabled the identi-fication of a subset of candidates with statistically significantassociation between gene dosage and mRNA expression. Thus, theintegration of DNA and RNA profiles provides a highly productiveentry point for the discovery of genes involved in the pathogenesisof pancreatic adenocarcinoma.
Pancreatic adenocarcinoma is among the most lethal of hu-man cancers, typically presenting as advanced inoperable
disease with a rapidly progressive clinical course characterizedby intense resistance to all therapeutic modalities. Significanteffort has been directed toward charting the molecular geneticevents in this cancer with the goals of improving early detectionand providing new therapeutic targets. The current compendiumof validated genetic mutations has provided a multistep modelfor the initiation and progression of pancreatic adenocarcinomathat is typified by the near-universal and early occurrence ofactivating mutations in KRAS and frequent later-stage inactiva-tion of p16INK4A, p53, and�or SMAD4 (1).
These stereotypic genetic lesions take place against the backdropof a high level of genomic instability that is evident in the earlieststages of the disease (2–4). Indeed, a hallmark genomic feature ofthis cancer is the presence of numerous complex chromosomestructural aberrations, including nonreciprocal translocations, am-plifications, and deletions. To date, karyotype analyses (5–10),chromosomal comparative genomic hybridization (CGH) (11–17),and loss of heterozygosity mapping (18–20) have identified recur-rent regions of copy number change or allelic loss. In particular,frequent gains have been mapped to 3q, 5p, 7p, 8q, 11q, 12p, 17q,and 20q and losses to 3p, 4q, 6q, 8p, 9p, 10q, 12q, 13q, 17p, 18q, 21q,and 22q. In some instances, validated oncogenes and tumor sup-pressor genes residing within these loci have been identified,including MYC (8q24), p16INK4A (9p21), p53 (17p13), SMAD4(18q21), and AKT2 (19q13). However, for the majority of amplified
and deleted loci, the presumed cancer-relevant targets remain to bediscovered.
In this study, the development of optimized protocols andbioinformatic tools has enabled the use of a cDNA-based platformfor the high-resolution characterization of copy number alterations(CNAs) in the pancreatic adenocarcinoma genome, leading to therediscovery of known cytogenetic alterations and the identificationof many focal and previously undescribed CNAs. Furthermore, theintegration of these copy number data with expression profiles andother cancer database information provides for a highly efficiententry point for cancer gene discovery.
Materials and MethodsPrimary Tumors and Cell Lines. All cell lines were acquired from theAmerican Type Culture Collection (ATCC) or the German Col-lection of Microorganisms and Cell Cultures (DSMZ). All fresh-frozen specimens of primary pancreatic ductal adenocarcinomawere obtained from the Memorial Sloan–Kettering Cancer Centertumor bank, and histology was confirmed by hematoxylin�eosinbefore inclusion in this study (Tables 2 and 3, which are publishedas supporting information on the PNAS web site).
Array-CGH Profiling on cDNA Microarrays. Genomic DNA was frag-mented and random-prime labeled according to published proto-cols (21) with modifications (for details, see http:��genomic.dfci.harvard.edu�array�cgh.htm). Labeled DNAs were hybridized tohuman cDNA microarrays containing 14,160 cDNA clones (Agi-lent Technologies, Palo Alto, CA, Human 1 clone set), for which�9,420 unique map positions were defined (National Center forBiotechnology Information, Build 33). The median interval be-tween mapped elements is 100.1 kb, 92.8% of intervals are �1megabases (Mb), and 98.6% are �3 Mb.
Fluorescence ratios of scanned images of the arrays were calcu-lated, and the raw array-CGH profiles were processed to identifystatistically significant transitions in copy number using a segmen-tation algorithm, which uses permutation to determine the signif-icance of change points in the raw data (22). Each segment isassigned a log2 ratio that is the median of the contained probes. Thedata are centered by the tallest mode in the distribution of thesegmented values. After mode centering, we defined gains andlosses as log2 ratios of ��0.13 or –0.13 (�4 standard deviations ofthe middle 50% quantile of data), and amplification and deletionas a ratio �0.52 or less than –0.58, respectively (i.e., 97% or 3%quantiles) (Fig. 4, which is published as supporting information onthe PNAS web site).
Abbreviations: CGH, comparative genomic hybridization; MCR, minimal common region;QPCR, quantitative PCR; CNA, copy number alteration; CIS, common integration site; Mb,megabase(s).
†A.J.A. and C.B. contributed equally to this work.
�To whom correspondence should be addressed. E-mail: lynda�[email protected].
Automated Locus Definition. Loci are defined by an automatedalgorithm applied to the segmented data based on the followingrules:
(i) Segments above the 97th or below the 3rd percentile areidentified as altered.
(ii) If two or more altered segments are adjacent in a singleprofile or separated by �500 kb, the entire region spanned by thesegments is considered to be an altered span.
(iii) Highly altered segments or spans that are shorter than 20 Mbare retained as ‘‘informative spans’’ for defining discrete locusboundaries. Longer regions are not discarded but are not includedin defining locus boundaries.
(iv) Informative spans are compared across samples to identifyoverlapping groups of positive- or negative-value segments; eachgroup defines a locus.
(v) Minimal common regions (MCRs) are defined as contiguousspans having at least 75% of the peak recurrence as calculated bycounting the occurrence of highly altered segments. If two MCRsare separated by a gap of only one probe position, they are joined.If there are more than three MCRs in a locus, the whole region isreported as a single complex MCR.
MCR Characterization. For each MCR, the peak segment value isidentified. Recurrence of gain or loss is calculated across all samplesbased on the lower thresholds previously defined (��0.13). As anadditional measure of recurrence independent of thresholds forsegment value or length, median aberration (MA) is calculated foreach probe position by taking the median of all segment valuesabove zero for amplified regions and below zero for deleted regions.This pair of values is compared with the distribution of valuesobtained after permuting the probe labels independently in eachsample profile. Where the magnitude of the MA exceeds 95% ofthe permuted averages, the region is marked as significantly gainedor lost, and this is used in the voting system for prioritization. Thenumber of known genes and GENSCAN (Massachusetts Institute ofTechnology, Cambridge, MA) model predicted genes is countedbased on the April 2003 human assembly at the University ofCalifornia at Santa Cruz (http:��genome.ucsc.edu).
Quantitative PCR (QPCR) Verification. PCR primers were designed toamplify products of 100–150 bp within target and control sequences(available upon request). Primers for control sequences in each cellline were designed within a region of euploid copy number as shownby array-CGH analysis. QPCR was performed by monitoring inreal-time the increase in fluorescence of SYBR green dye (Qiagen,Chatsworth, CA) with an ABI 7700 (Applied Biosystems) sequencedetection system (PerkinElmer). The relative gene copy numberwas calculated by the comparative Ct method (23).
Expression Profiling on Affymetrix GeneChip. Biotinylated targetcRNA was generated from total sample RNA and hybridized tohuman oligonucleotide probe arrays (U133A, Affymetrix, SantaClara, CA) according to standard protocols (24). Expression valuesfor each gene were standardized by log2 ratio to a middle value forthe sample set, defined as the midpoint between 25% and 75%quantiles, and mapped to genomic positions based on NationalCenter for Biotechnology Information Build 33 of the humangenome.
Integrated Copy Number and Expression Analysis. Array-CGH dataare interpolated such that each expression value can be mapped toits corresponding copy number value. To maximize detection offocal CNAs, two separate interpolations are calculated: one select-ing the higher bounding CGH probe and one choosing the lower.For each gene position, the samples are grouped based on whetheror not array-CGH shows an altered copy number according tointerpolated CGH value. The effect of gene dosage on expressionis measured by calculating a gene weight defined as the difference
of the means of the expression value in the altered and unalteredsample groups divided by the sum of the standard deviations of theexpression values in altered and unaltered sample groups (25). Thesignificance of the weight for each gene is estimated by permutingthe sample labels 10,000 times and applying an � threshold of 0.05.
Results and DiscussionComprehensive Catalog of CNAs in the Pancreatic AdenocarcinomaGenome. From a total of 75 primary pancreatic tumor specimens,we identified 13 samples that possessed �60% neoplastic cellularity(Table 2). Genomic DNAs from these primary tumor samples,along with DNAs derived from 24 established pancreatic cancer celllines (Table 3), were subjected to genome-wide array-CGH profil-ing by using a cDNA-based array platform that offers a medianresolution of 100 kB (see Materials and Methods). To facilitateidentification of significant copy number events in these array-CGHprofiles, this study has used a modified version of the circular binarysegmentation methodology developed by Olshen and colleagues(22, 26). This algorithm applies nonparametric statistical testing toidentify and distinguish discrete copy number transition points fromchance noise events in the primary dataset. As shown in Fig. 1A, thesegmented array-CGH profiles readily identified large regionalchanges that are typically of low amplitude, hereafter referred to as‘‘gain’’ or ‘‘loss’’ (see Materials and Methods). Similarly, focalhigh-amplitude alterations representing ‘‘amplification’’ or ‘‘dele-tion’’ are evident in both primary tumor specimens and tumor celllines (Fig. 1). Recurrence frequencies of the CNAs reported herematch the frequencies described in the published literature (11–17)(Fig. 1B). There is also strong concordance between primarytumors and cell lines with respect to gains on 3q, 8q, and 20q andlosses on 1p, 3p, 6q, 9p, 17p, and 18q (Fig. 5, which is published assupporting information on the PNAS web site). However, somedifferences were evident between primary tumor and cell linedatasets and are likely attributable to the cellular heterogeneitywithin primary tumor samples and�or culture-induced geneticadaptation in the cell lines.
The identification of many CNAs, along with the high degree ofstructural complexity within each CNA, prompted the implemen-tation of objective criteria to define and prioritize CNAs across thedataset. To that end, a locus-identification algorithm was developedthat defines informative CNAs on the basis of size and achievementof a high-significance threshold for the amplitude of change (seeMaterials and Methods). Overlapping CNAs from multiple profilesare then merged in an automated fashion to define a discrete‘‘locus’’ of regional copy number change, the bounds of whichrepresent the combined physical extent of these overlapping CNAs(Fig. 1C). Each locus is characterized by a peak profile, the widthand amplitude of which reflect the contour of the most prominentamplification or deletion for that locus. Furthermore, within eachlocus, one or more MCRs can be identified across multiple tumorsamples (Fig. 1C), with each MCR potentially harboring a distinctcancer-relevant gene targeted for copy number alteration across thesample set.
The locus identification algorithm appears to be highly effectivein delineating more discrete CNAs within previously describedlarger regions of gain or loss. For example, chromosome 6q hasbeen reported as one of the most frequently deleted regions inpancreatic adenocarcinoma, but to our knowledge, no validatedtumor suppressor gene has yet been assigned to this locus. Analysisof 6q loss in our dataset has identified four distinct MCRs that rangein size from 2.4 to 12.8 Mb, raising the possibility that there may bemultiple targets for 6q loss. Notably, two of these MCRs (Table 4,which is published as supporting information on the PNAS web site,locus nos. 74 and 75) coincide with previously identified regions ofcommon allelic loss (27), an observation that provides a measure ofvalidation for the analytical approach developed in this study.
9068 � www.pnas.org�cgi�doi�10.1073�pnas.0402932101 Aguirre et al.
Selection of High-Priority Loci. The above locus-identification algo-rithm defined 287 discrete MCRs (from 256 independent autoso-mal loci) within this dataset and annotated each in terms ofrecurrence, amplitude of change, and representation in both celllines and primary tumors. Based on our extensive experience withthis platform across many tumor types (unpublished data), recur-rence across multiple independent samples and high-amplitudesignals are the two features most predictive of verification byindependent assays. Hence, we prioritized these discrete MCRsbased on four criteria that include (i) recurrence of high-thresholdamplification or deletion (above the 97th percentile or below the3rd percentile) in at least two specimens, (ii) presence of a high-threshold event in at least one primary tumor specimen, (iii)statistically significant median aberration (see Materials and Meth-ods), and (iv) a peak amplitude of equal to or greater than absolutelog2 value of 0.8 in either a cell line or primary tumor (beyond 0.5%quantiles).
Implementation of this prioritization scheme yielded 64 MCRswithin 54 independent loci that satisfied at least three of the fourcriteria (Table 1). Notably, genes known to play important roles inthe pathogenesis of pancreatic adenocarcinoma, the p16INK4A andTP53 tumor suppressors and the MYC, KRAS2, and AKT2oncogenes, were present within these high-confidence loci (Table1). Within the prioritized MCRs, there was an average recurrencerate for gain�loss of 38% across the entire dataset and the maximaor minima absolute log2 values for 34 of these 64 MCRs are �1.0,placing them significantly above the threshold defined for amplifi-cation or deletion (Fig. 4). It is noteworthy that in the majority ofcases, the peak profile of a locus coincided with one of the MCRs(47 of 54 loci, Table 1), an observation that reinforces the notion
that important targets are likely to reside within the genomic regiondefined by the peak of a CNA (28). The median size of these 64prioritized MCRs is 2.7 Mb, with 21 MCRs (33%) spanning 1 Mbor less (Table 1). Residing within these 21 highly focal MCRs witha median size of 0.33 Mb, there are on average 15 annotated and8 GENSCAN predicted genes, rendering them highly attractive fortarget identification.
The confidence level ascribed to these prioritized loci has beenfurther validated by real-time QPCR, which demonstrated 100%concordance with 16 selected MCRs defined by array-CGH (Table1). For example, the MCR of an amplified locus at 7q21.11-7q32.2was readily confirmed by QPCR (Fig. 2A). Furthermore, QPCRanalyses also verified the structural details of complex CNAsreported by array-CGH. As shown in Fig. 2B, QPCR preciselymirrored each component of the complex 9p21 locus in HUP-T3,including homozygous deletion of p16INK4A, the known target forthis CNA. Such detailed structural information may prove useful indissecting the mechanisms responsible for the genesis of thesecancer-associated chromosomal aberrations.
Altogether, when high-priority MCRs in Table 1 are combinedwith an additional 80 moderate-priority MCRs (within 65 distinctloci) satisfying two of four criteria, our genomic characterization hasproduced a list of 144 MCRs within 119 independent loci thatwarrant further validation and detailed characterization (Table 4).Of note, the boundaries of the MCRs of each locus have beendefined based on conservative parameters. In many cases, the focaland informative nature of these recurrent aberrations can best beappreciated by examination of the primary array-CGH profiles andconsideration of such factors as the peak amplitude and morphol-ogy of the individual CNAs within an MCR. In addition, it is worth
Fig. 1. Genomic profiles from pancreatic adenocarcinoma samples. Array-CGH profiles with x axis coordinates representing cDNA probes ordered by genomicmap positions. Segmented data are displayed in red, median filtered (three nearest neighbors) in blue, and raw data in black. (A) Whole-genome profiles ofprimary tumor specimen PA.T.7692 (Upper) and cell line Panc 10.05 (Lower). Note presence of focal high-level amplifications and deletions as well as largeregional gains and losses in both samples. (B) Recurrence of chromosomal alterations. (Upper) Integer-value recurrence of CNAs in segmented data (y axis) plottedfor each cDNA probe evenly aligned along the x axis in genome order. Dark red or green bars denote gain or loss of chromosome material. Bright red or greenbars represent probes within regions of amplification or deletion. (Lower) TREEVIEW (Eisen laboratory, University of California, Berkeley) showing discrete CNAswithin all samples. Red represents chromosomal gain, and green denotes chromosomal loss. (C) CGH profiles of 12p12.3-q13.3 locus (locus no. 15, Table 1) in threesamples illustrating the definition of the physical extent, peak profile, and MCRs for that locus. Note that the left MCR is defined by the overlap between sampleson top and bottom, whereas the right MCR is defined by the overlap between the two samples on top. Because data points are plotted on the x axis by genomicmap positions, gaps in the profiles encompass regions of copy number transition for which there is no data point.
Aguirre et al. PNAS � June 15, 2004 � vol. 101 � no. 24 � 9069
MED
ICA
LSC
IEN
CES
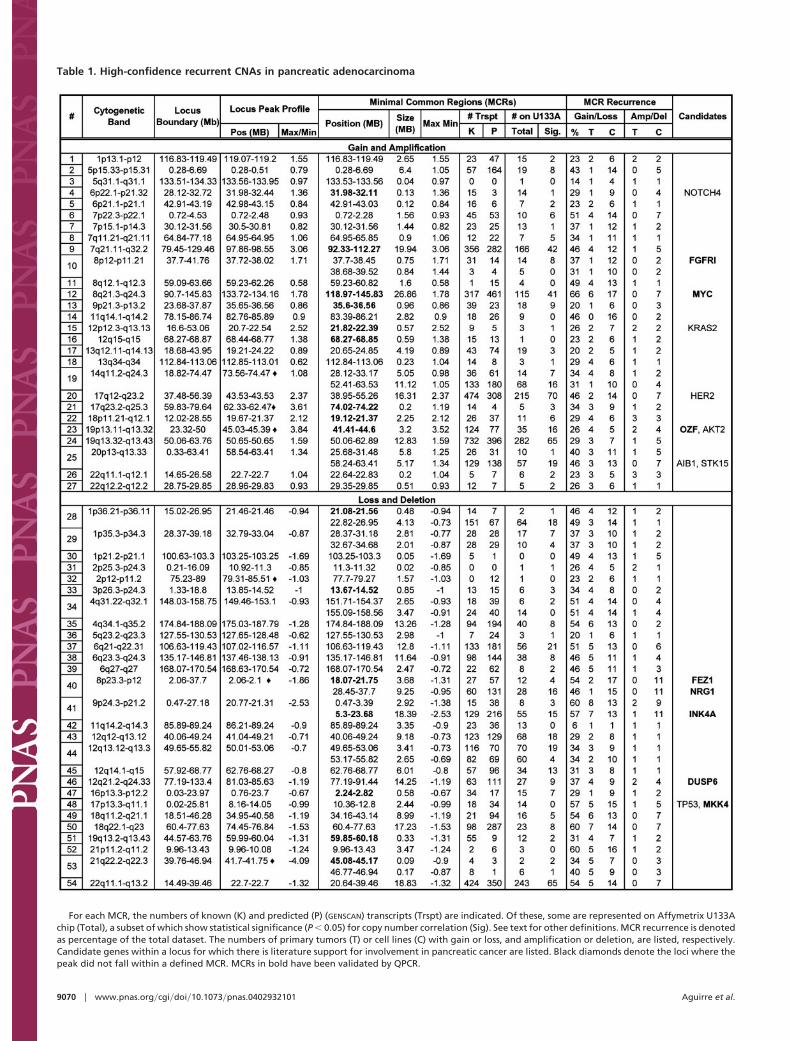
Table 1. High-confidence recurrent CNAs in pancreatic adenocarcinoma
For each MCR, the numbers of known (K) and predicted (P) (GENSCAN) transcripts (Trspt) are indicated. Of these, some are represented on Affymetrix U133Achip (Total), a subset of which show statistical significance (P � 0.05) for copy number correlation (Sig). See text for other definitions. MCR recurrence is denotedas percentage of the total dataset. The numbers of primary tumors (T) or cell lines (C) with gain or loss, and amplification or deletion, are listed, respectively.Candidate genes within a locus for which there is literature support for involvement in pancreatic cancer are listed. Black diamonds denote the loci where thepeak did not fall within a defined MCR. MCRs in bold have been validated by QPCR.
9070 � www.pnas.org�cgi�doi�10.1073�pnas.0402932101 Aguirre et al.
noting that the segmentation algorithm discards CNAs reported bysingle probes in exchange for an improved false-positive rate.Consequently, there may be highly focal alterations that are not
captured by the analysis reported here. A case in point is the lossof the SMAD4 tumor suppressor, which is represented by a singleprobe on the cDNA microarray. Although the raw CGH profilesshowed loss of copy number for this SMAD4 probe, the segmen-tation algorithm discarded this CNA. Data such as this shouldprovide impetus for development of array platforms with increaseddensity of coverage across the genome.
Integrated Analysis of Copy Number and Expression Information.Copy number aberrations and their associated impact on geneexpression patterns represent common mechanisms of oncogeneactivation and tumor suppressor inactivation. Indeed, integration ofcopy number and transcription profile datasets revealed a consis-tent influence of gene dosage on mRNA expression globally acrossthe genome (Fig. 6, which is published as supporting information onthe PNAS web site) (25, 29). Conversely, as previously demon-strated (30), only a subset of genes within any given CNA showcopy-number-driven expression changes, a feature that provides afirst-pass means of distinguishing bystanders from potential cancergene targets within the CNA. As a case in point, a locus ofamplification on chromosome 17 in the cell line Hup-T3 (locus no.21, Table 1) contains 455 genes of which 151 are present on theAffymetrix U133A array. Of these 151 genes, only 19 exhibitedincreased transcript levels �2-fold. Moreover, these 19 genes residewithin the peak of this locus (Fig. 3A). Similar correlations can beestablished in regions of deletion. For example, the 9p21 deletionlocus in the BxPC-3 cell line demonstrated that only 5 of 91 genesresiding within the MCR show undetectable or decreased expres-sion �2-fold (Fig. 3B). Examination of p16INK4A, the known targetfor deletion, across the entire sample set demonstrates that 11 of 24cell lines show low or absent expression, of which five had homozy-gous deletion, whereas the remaining six were present at the DNAlevel (Fig. 3C). In the latter, epigenetic silencing is the presumedmechanism of p16INK4a inactivation.
Fig. 2. QPCR verifies complexity within CNAs. (A) Chromosome 7 CGHprofiles (Left) showing amplification of a discrete region of 7q22 in both theAsPC-1 cell line and PA.T.14172 (locus no. 9, Table 1), with MCR defined byboth samples (outlined by dashed lines). A–D indicate the relative positions ofQPCR assays (Right), which confirm the gene copy alterations in AsPC-1 (darkgray bars) and PA.T.14172 (light gray bars). (B) Chromosome 9 array-CGHprofile (Left) for a complex CNA in the HUP-T3 cell line. Homozygous deletionof the known target p16Ink4a is confirmed by QPCR (Right), which also verifiesexistence of two discrete focal amplicons and a narrow region of one-copy lossrevealed by array-CGH. Note that CNAs covered by only one or two probes arenot identified by the segmentation algorithm.
Fig. 3. Combined array-CGH and expression analysis facilitates identification of candidate genes. (A) Analysis of 17q23.2–25.3 locus (locus no. 21, Table 1) incell line Hup T3. (Upper) Array-CGH profile of HUP-T3. (Lower) Expression profile of genes on Affymetrix U133A array within the specified locus for the HUP-T3cell line. Note that the subset of genes exhibiting prominent gene dosage correlated expression fall within the peak of the locus (arrows). (B) Analysis of9p24.3-21.2 locus (locus no. 41, Table 1) in the cell line BxPC-3. (Upper) Array-CGH profile of the 9p region. (Lower) Affymetrix expression profile of genes mappingto the same region. Note the dramatically reduced expression of the p16INK4A gene (arrows) within the MCR. (C) Correlation of p16INK4A expression and copynumber in 24 cell lines analyzed. Note the bimodal distribution of both expression values and copy number values for this gene across all samples (green lines).The red box defines those samples (BxPC-3, MiaPaCa, Capan 1, Hup-T3, and Dan-G) in which p16INK4A is homozygously deleted and not expressed. The blue boxencloses samples (Panc-1, Panc 03.27, SW1990, Panc 08.13, Hup-T4, and Panc 02.13) in which p16INK4A is present but with absent or reduced expression.
Aguirre et al. PNAS � June 15, 2004 � vol. 101 � no. 24 � 9071
MED
ICA
LSC
IEN
CES
It is important to emphasize that a major issue in interpretationof expression information is the challenge of defining over- orunderexpressed levels. In many cancer types, including pancreaticadenocarcinoma, the true cell of origin remains unknown, and thusa premalignant physiological frame of reference is not available. Inthe examples above, we have applied one model for interfacing copynumber and expression profiles by midpoint centering of theexpression data and calculating a weighted statistic for assignmentof significance values to genes with correlated copy number andexpression (24, 25) (see Materials and Methods). Using this ap-proach, we next sought to prioritize the genes residing within the 64high-confidence MCRs (Table 1) based on the correlation of theirexpression with gene dosage. Although only a subset of genes arerepresented, the Affymetrix U133A array permitted inclusion of1,926 genes of a total of 4,742 genes residing within these MCRs forthis analysis. By weighing each of these 1,926 genes based on themagnitude of its expression alteration and representation withinCNAs across the dataset, the integrated copy number and expres-sion analysis yielded a list of 603 genes that show a statisticallysignificant association between gene copy number and mRNAexpression (P � 0.05; Table 5, which is published as supportinginformation on the PNAS web site). Of these, 336 are located withinregions of amplifications and 267 within regions of deletions.Importantly, among these 603 genes were known pancreatic cancergenes such as MYC (13), p16INK4A (31, 32), and DUSP6 (33) (Table5), thus reinforcing the value of integrating both copy number andexpression information.
Although incomplete representation of known and predictedgenes on the Affymetrix U133A expression array precluded assess-ment of all possible target genes, the complementary analysis ofarray-CGH and expression profiles presented above serves toprioritize the list of available cancer gene candidates and provides
a basis for focus on a subset of high-probability candidates. Inaddition, integrating genomic datasets across species may alsoprove effective in facilitating cancer gene identification. A partic-ularly productive path for oncogene identification may be theanalysis of common integration sites (CISs) present in retrovirallypromoted leukemias and lymphomas (34). Consistent with theparadigm that proviral integration primarily serves to activateendogenous protooncogene (34), syntenic mapping of 232 CISs tothe human genome (35) uncovered 19 CISs residing within MCRsof amplified loci in Table 1, whereas only 10 would be expected bychance alone (P � 0.006). On the contrary, MCRs within regionsof loss or deletion contained only 16 CISs, whereas 14.4 would havebeen expected by chance alone. Thus, it is tempting to speculate thatthe abundance of CISs mapping to amplified loci represents geneswith pathogenetic relevance in mouse models of tumor progressionas well as in human pancreatic cancer, although we are mindful ofpossible cell-type-specific roles for these candidate genes. Ulti-mately, rigorous functional validation in cell culture-based assaysand engineered mouse models will be necessary to definitivelyassign cancer relevance to the genes targeted by the recurrentamplifications and deletions described in this study.
We thank Drs. Ruben Carrasco, Juan Cadinanos, Giovanni Tonon,Eric Martin, Jan-Hermen Dannenberg, and Kornelia Polyak for criticalcomments on the manuscript and Tali Muller and Melissa Donovan forsuperb technical support. Array-CGH profiles were performed at theArthur and Rochelle Belfer Cancer Genomic Center at the Dana–FarberCancer Institute. This work is supported in part by an ExtraordinaryOpportunity Award (to L.C.) from the Lustgarten Foundation, by anAmerican Cancer Society Professorship award (to R.A.D.), and byNational Institutes of Health grants [RO1 CA99041 (to L.C.) andR01CA86379 and R01CA84628 (to R.A.D.)]. C.B. is supported byNational Institutes of Health Training Grant T32 CA09382 and by theLeBow Fund for Myeloma Cure.
1. Bardeesy, N. & DePinho, R. A. (2002) Nat. Rev. Cancer 2, 897–909.2. Gisselsson, D., Pettersson, L., Hoglund, M., Heidenblad, M., Gorunova, L., Wiegant, J.,
Mertens, F., Dal Cin, P., Mitelman, F. & Mandahl, N. (2000) Proc. Natl. Acad. Sci. USA 97,5357–5362.
3. Gisselsson, D., Jonson, T., Petersen, A., Strombeck, B., Dal Cin, P., Hoglund, M., Mitelman,F., Mertens, F. & Mandahl, N. (2001) Proc. Natl. Acad. Sci. USA 98, 12683–12688.
4. van Heek, N. T., Meeker, A. K., Kern, S. E., Yeo, C. J., Lillemoe, K. D., Cameron, J. L.,Offerhaus, G. J., Hicks, J. L., Wilentz, R. E., Goggins, M. G., et al. (2002) Am. J. Pathol. 161,1541–1547.
5. Johansson, B., Bardi, G., Heim, S., Mandahl, N., Mertens, F., Bak-Jensen, E., Andren-Sandberg, A. & Mitelman, F. (1992) Cancer 69, 1674–1681.
6. Bardi, G., Johansson, B., Pandis, N., Mandahl, N., Bak-Jensen, E., Andren-Sandberg, A.,Mitelman, F. & Heim, S. (1993) Br. J. Cancer 67, 1106–1112.
7. Griffin, C. A., Hruban, R. H., Long, P. P., Morsberger, L. A., Douna-Issa, F. & Yeo, C. J.(1994) Genes Chromosomes Cancer 9, 93–100.
8. Griffin, C. A., Hruban, R. H., Morsberger, L. A., Ellingham, T., Long, P. P., Jaffee, E. M.,Hauda, K. M., Bohlander, S. K. & Yeo, C. J. (1995) Cancer Res. 55, 2394–2399.
9. Gorunova, L., Johansson, B., Dawiskiba, S., Andren-Sandberg, A., Jin, Y., Mandahl, N.,Heim, S. & Mitelman, F. (1995) Genes Chromosomes Cancer 14, 259–266.
10. Gorunova, L., Hoglund, M., Andren-Sandberg, A., Dawiskiba, S., Jin, Y., Mitelman, F. &Johansson, B. (1998) Genes Chromosomes Cancer 23, 81–99.
11. Solinas-Toldo, S., Wallrapp, C., Muller-Pillasch, F., Bentz, M., Gress, T. & Lichter, P. (1996)Cancer Res. 56, 3803–3807.
12. Mahlamaki, E. H., Hoglund, M., Gorunova, L., Karhu, R., Dawiskiba, S., Andren-Sandberg,A., Kallioniemi, O. P. & Johansson, B. (1997) Genes Chromosomes Cancer 20, 383–391.
13. Mahlamaki, E. H., Barlund, M., Tanner, M., Gorunova, L., Hoglund, M., Karhu, R. &Kallioniemi, A. (2002) Genes Chromosomes Cancer 35, 353–358.
14. Fukushige, S., Waldman, F. M., Kimura, M., Abe, T., Furukawa, T., Sunamura, M., Kobari,M. & Horii, A. (1997) Genes Chromosomes Cancer 19, 161–169.
15. Curtis, L. J., Li, Y., Gerbault-Seureau, M., Kuick, R., Dutrillaux, A. M., Goubin, G., Fawcett,J., Cram, S., Dutrillaux, B., Hanash, S. & Muleris, M. (1998) Genomics 53, 42–55.
16. Ghadimi, B. M., Schrock, E., Walker, R. L., Wangsa, D., Jauho, A., Meltzer, P. S. & Ried,T. (1999) Am. J. Pathol. 154, 525–536.
17. Armengol, G., Knuutila, S., Lluis, F., Capella, G., Miro, R. & Caballin, M. R. (2000) CancerGenet. Cytogenet. 116, 133–141.
18. Seymour, A. B., Hruban, R. H., Redston, M., Caldas, C., Powell, S. M., Kinzler, K. W., Yeo,C. J. & Kern, S. E. (1994) Cancer Res. 54, 2761–2764.
19. Hahn, S. A., Seymour, A. B., Hoque, A. T., Schutte, M., da Costa, L. T., Redston, M. S.,Caldas, C., Weinstein, C. L., Fischer, A., Yeo, C. J., et al. (1995) Cancer Res. 55, 4670–4675.
20. Kimura, M., Abe, T., Sunamura, M., Matsuno, S. & Horii, A. (1996) Genes ChromosomesCancer 17, 88–93.
21. Pollack, J. R., Perou, C. M., Alizadeh, A. A., Eisen, M. B., Pergamenschikov, A., Williams,C. F., Jeffrey, S. S., Botstein, D. & Brown, P. O. (1999) Nat. Genet. 23, 41–46.
22. Olshen, A. B. & Venkatraman, E. S. (2002) ASA Proceedings of the Joint Statistical Meetings,pp. 2530–2535.
23. Ginzinger, D. G. (2002) Exp. Hematol. 30, 503–512.24. Golub, T. R., Slonim, D. K., Tamayo, P., Huard, C., Gaasenbeek, M., Mesirov, J. P., Coller,
H., Loh, M. L., Downing, J. R., Caligiuri, M. A., et al. (1999) Science 286, 531–537.25. Hyman, E., Kauraniemi, P., Hautaniemi, S., Wolf, M., Mousses, S., Rozenblum, E., Ringner,
M., Sauter, G., Monni, O., Elkahloun, A., et al. (2002) Cancer Res. 62, 6240–6245.26. Lucito, R., Healy, J., Alexander, J., Reiner, A., Esposito, D., Chi, M., Rodgers, L., Brady,
A., Sebat, J., Troge, J., et al. (2003) Genome Res. 13, 2291–2305.27. Abe, T., Makino, N., Furukawa, T., Ouyang, H., Kimura, M., Yatsuoka, T., Yokoyama, T.,
Inoue, H., Fukushige, S., Hoshi, M., et al. (1999) Genes Chromosomes Cancer 25, 60–64.28. Albertson, D. G., Ylstra, B., Segraves, R., Collins, C., Dairkee, S. H., Kowbel, D., Kuo, W. L.,
Gray, J. W. & Pinkel, D. (2000) Nat. Genet. 25, 144–146.29. Pollack, J. R., Sorlie, T., Perou, C. M., Rees, C. A., Jeffrey, S. S., Lonning, P. E., Tibshirani,
R., Botstein, D., Borresen-Dale, A. L. & Brown, P. O. (2002) Proc. Natl. Acad. Sci. USA 99,12963–12968.
30. Platzer, P., Upender, M. B., Wilson, K., Willis, J., Lutterbaugh, J., Nosrati, A., Willson, J. K.,Mack, D., Ried, T. & Markowitz, S. (2002) Cancer Res. 62, 1134–1138.
31. Rozenblum, E., Schutte, M., Goggins, M., Hahn, S. A., Panzer, S., Zahurak, M., Goodman,S. N., Sohn, T. A., Hruban, R. H., Yeo, C. J., et al. (1997) Cancer Res. 57, 1731–1734.
32. Caldas, C., Hahn, S. A., da Costa, L. T., Redston, M. S., Schutte, M., Seymour, A. B.,Weinstein, C. L., Hruban, R. H., Yeo, C. J. & Kern, S. E. (1994) Nat. Genet. 8, 27–32.
33. Furukawa, T., Sunamura, M., Motoi, F., Matsuno, S. & Horii, A. (2003) Am. J. Pathol. 162,1807–1815.
34. Neil, J. C. & Cameron, E. R. (2002) Cancer Cell 2, 253–255.35. Akagi, K., Suzuki, T., Stephens, R. M., Jenkins, N. A. & Copeland, N. G. (2004) Nucleic
Acids Res. 32, D523–D527.
9072 � www.pnas.org�cgi�doi�10.1073�pnas.0402932101 Aguirre et al.