Allison Plyer & Elaine Ortiz Greater New Orleans Community Data Center Kathryn L.S. Pettit & Chris Narducci The Urban Institute Annual Report November 2011 Preparing for The Impending Elder Boom Drivers of Housing Demand Housing in the New Orleans Metro Series
Transcript
Page 1 of 20www.gnocdc.org
Allison Plyer & Elaine OrtizGreater New Orleans Community Data Center
Kathryn L.S. Pettit & Chris NarducciThe Urban Institute
UrbanInstituteA product of Nonprofit Knowledge Works
About Housing in the New Orleans MetroThe Housing in the New Orleans Metro series creates a common base of reliable information around housing and the recovery that is easy to use to support decision making at many levels as the New Orleans area moves from recovery to large-scale community development. Housing policy development must be informed by a solid understanding of demographic changes, housing demand and supply, housing affordability challenges, economic trends, and regional commuter patterns. The Housing in the New Orleans Metro annual report quantifies housing issues and raises promising policy options that can address current and future housing problems. In addition to the annual report, periodic Housing in the New Orleans Metro briefs highlight new data as they are acquired and analyzed to provide timely support to local, state, and federal decision-making. The complete collection of briefs and reports can be found on the Data Center’s website: www.gnocdc.org.
Annual Report November 2011
Preparing for The Impending Elder Boom
Drivers of Housing Demand
Housing in the New Orleans Metro Series
Page 2 of 20 www.gnocdc.org
About the authorsAllison Plyer is chief demographer and deputy director of the Greater New Orleans Community Data Center.
Elaine Ortiz is a senior research associate at the Greater New Orleans Community Data Center.
Kathryn L.S. Pettit is a senior research associate in the Metropolitan Housing and Communities Policy Center at the Urban Institute and co-director of the National Neighborhood Indicators Partnership.
Chris Narducci is a research associate with the Metropolitan Housing and Communities Policy Center at the Urban Institute.
About the Greater New Orleans Community Data CenterSince 1997, the Greater New Orleans Community Data Center (GNOCDC) has been gathering, analyzing and disseminating data to help nonprofit and civic leaders work smarter and more strategically. A product of Nonprofit Knowledge Works, we are longtime members of the National Neighborhood Indicators Partnership – a select group of local data experts dedicated to community change.
GNOCDC is recognized across the country for expertise in New Orleans demographics, disaster recovery indicators, and actionable data visualization. GNOCDC also plays a critical role in assessing the strength of the New Orleans economy and housing market since the onset of the Great Recession.
About the Urban Institute’s Metropolitan Housing and Communities Policy CenterThe Urban Institute’s Metropolitan Housing and Communities Policy Center believes that place matters in public policy. We bring local perspectives on economic development, neighborhood revitalization, and housing to our study of policies and programs. Our research pioneers diverse and innovative methods for assessing community change and program performance and builds the capacity of policymakers and practitioners to make more informed decisions at local, state, and federal levels. The views expressed are those of the authors and should not be attributed to the Urban Institute, its trustees, or its funders.
AcknowledgementsThe authors are grateful to the many people who reviewed this report and provided valuable feedback. The authors also thank colleagues at GNOCDC who contributed to this report. Melissa Schigoda supplied information design and layout, Ben Horwitz provided data analysis and maps, and Susan Sellers supplied editorial assistance. In addition, the authors thank Catherine Burke for graphics design and layout.
Both the Data Center and the Urban Institute wish to thank the Community Revitalization Fund of the Greater New Orleans Foundation for providing us with the opportunity to examine housing conditions and trends in our city over the last three years. Additionally, this report would not have been possible without the foundational data and analysis of The New Orleans Index at Six published in August of 2011. The Data Center would like to acknowledge the support of the United Way for the Greater New Orleans Area, Surdna Foundation, RosaMary Foundation, Metropolitan Opportunities Fund at the Greater New Orleans Foundation, Foundation for Louisiana, and Baptist Community Ministries. Finally, we are grateful for the insightful comments and suggestions offered by policy makers, advocates, nonprofit organizations, developers, research-ers, and bankers that make up our advisory committee.
In this report we describe recent and impending demographic shifts in the population of New Orleans. We are grateful for research by Audrey Singer and William Frey of the Brookings Institution who helped lay the foundation for this report by making clear the major demographic shifts happening in metropolitan areas nationwide.
Cover photo courtesy of Rebuilding Together New Orleans, a program of the Preservation Resource Center of New Orleans that uses a combination of volunteer and professional labor to improve the quality of life of low income homeowners, particularly those who are elderly, disabled, or single heads of households with minor children, through home repair and revitalization of New Orleans’ neighborhoods.
EXECUTIVE SUMMARYSince the onset of the recession, job losses in the New Orleans metro area have been more moderate than across the nation. However, the New Orleans metro had 98,300 fewer jobs and 148,746 fewer residents in 2010 than in 2000. As a result, demand for housing has declined since 2000, and vacancies and abandonment have increased. Current eco-nomic forecasts suggest only tepid job growth through 2018. Thus, demand for housing will likely be driven primarily by the changing needs and preferences of the population at its current level rather than by a large influx of newcomers.
Just as suburbanization has dramatically changed housing choices and caused major geographic shifts nationwide over the past half century, the aging of the baby boomers will profoundly affect housing needs and living arrangements in coming years. These impending changes may result in even greater loss of population and increasing blight in New Orleans. Or, by planning the city’s development with the knowledge of these demographic trends clearly in mind, we can leverage the power of these shifts to increase our popu-lation and reduce blight.
The progression of the baby boomers through the age ranks along with falling birth rates have already brought massive changes to our region – and indeed the whole country – with many more changes yet to come. For example, in the New Orleans metro area, since 1980, the share of households with children has fallen from 43 percent to 33 percent, while the share of individuals living alone has grown from 24 percent to 28 percent. These trends are likely to accelerate as the baby boomers age – with individuals living alone outnumbering households with children in the not too distant future.
By 2020, the share of the city’s households headed by adults age 65 and older will spike. We examined three possible sce-narios for the projected household mix of New Orleans in 2020. The scenarios differ as to the number of households that move to the metro to take advantage of possible work opportunities and the mix of households that choose the city over other parishes in the metro. But regardless of the scenario, the increase in New Orleans households headed by elderly will greatly surpass the increase in any other house-hold type. In the most conservative scenario, the number of elderly households will increase by 8,800 (or 34%) from 2010 to 2020.
The predictability of the upcoming demographic changes offers an opportunity for our city to get ahead of the curve and enact policies that support a diversity of households. The city and other stakeholders should continue to implement strategies to attract new residents. There are examples from other cities about coordinated marketing of neighborhoods and online portals to accomplish this goal. But in order for the city to thrive, we also need to ensure we meet the housing needs of aging residents.
Most older adults want to remain in their homes as long as possible. The community should support this choice, not only because of the householder’s wishes, but because it will reduce the number of homes coming onto the market in the near-term and avoid the risk of another vacant property, particularly in neighborhoods with weak housing markets. Many residents over age 65 will need no extra supports to remain in their homes. However, we project that by 2020 more than 12,000 New Orleanians over age 65 will have a moderate or serious disability and be living at home. For these households especially, the city, state, and community will need to develop a range of policies and programs that facilitate aging in place. These should include efforts to increase the accessibility of the housing stock through home improvements such as wheelchair ramps, widened doors, and off street parking, as well as through the promotion of uni-versal design in some new construction. Beyond the house itself, the community should monitor the supply of in-home services that are available to assist with health needs and daily living, and explore public policies to encourage the growth of this sector. Finally, because 44 percent of older adults in 2010 in the city lived below 200 percent of the poverty level ($22,688 annually for a single person household), afford-ability will also be a major concern. Programs that reduce the cost of housing for older owners or renters with limited incomes would lessen the financial pressures to move. For seniors who cannot or do not want to stay at home, a wider array of housing options designed for seniors with varying levels of support services (and not just expensive nursing home care) could help retain long-time residents in the city.
A strong love of place is perhaps one of the most distin-guishing features of New Orleanians. This love of place made us resilient enough to rebuild our city after the cost-liest disaster in U.S. history. If we start planning today, together we can ensure that New Orleans continues to be a place we can all enjoy well into our twilight years.
Page 5 of 20www.gnocdc.org
INTRODUCTIONThis report is the third in a series about housing in the New Orleans metropolitan area, and focuses on how changing demographics and household types will drive future housing demand. Just as suburbanization dramatically changed housing choices and caused major geographic shifts nationwide over the past half century, the aging of the baby boomers will profoundly affect housing needs and living arrangements in coming years.i These impending changes may result in greater loss of population and increasing blight in New Orleans. Or, by planning the city’s development with the knowledge of these demographic trends clearly in mind, we can aim to leverage the power of these shifts to increase our population and reduce blight.
We begin this year’s report with an analysis of the most cur-rent data on economic and housing trends in New Orleans and the surrounding parishes. Then we explore the signifi-cant demographic shifts that have taken place in our region since 1980, and provide a set of three different scenarios for the projected household mix in New Orleans by 2020. We end the report with a discussion of the policy options that can align the city’s development over the next several years to the projected regional demographic mix, with the aim of attracting and retaining as many households as possible.
PART I. ECONOMIC, HOUSING, & DEMOGRAPHIC TRENDSThe national recession brings job growth to a three year standstill and more people fall into poverty.There have been many news reports touting the strength of the New Orleans economy during the current global economic downturn. And these reports are accurate. The New Orleans regional economy has performed better than the national economy since 2008 – buoyed by massive post-Katrina rebuilding efforts. As of August 2011, the New Orleans metro had 528,400 jobs, which is roughly the same number of jobs (-0.2 percent) as three years earlier. The U.S. lost 4.0 percent of jobs during the same three year time period.
However, when considering housing issues it is important to look at a longer time frame because population and housing demand roughly parallels job growth in most American metro areas.ii As mentioned earlier, it is true that job losses in the New Orleans metro area have been more moderate than losses across the nation since the onset of the recession. But it is also true that the New Orleans metro had 98,300 fewer jobs and 148,746 fewer residents in 2010 than in 2000, when the metro was near its historical peak number of jobs and population. As a result, demand for housing has declined since 2000, and vacancies and abandonment have increased.
Population, jobs, and housing unitsNew Orleans metro
100
200
300
400
500
600 thousand
0.2
0.4
0.6
0.8
1
1.2
1.4 million
1970 1980 1990 2000 2010
Population & Jobs
Housing Units Vacant Housing Units Occupied Housing Units
Source: GNOCDC analysis of data from U.S. Census Bureau, Bureau of Labor Statistics and Moody’s Economy.com Database (U.S. Bureau of Labor Statistics: CES, QCEW)
Page 6 of 20 www.gnocdc.org
In short, Katrina and the levee failures dealt a massive blow to the metro’s economy. The New Orleans area economy was just recovering from that blow when the Great Recession struck and leveled off jobs recovery. Thus, the metro today has fewer jobs than during much of the 1980s, and a population that is roughly the size it was in 1975.Moreover, the New Orleans economy continues to be largely driven by declining industries of tourism, oil and gas, and shipping, which does not bode well for future job growth.iii Until new emerging industries generate substantially more jobs, the New Orleans metro will have slow population growth and modest housing demand.
And New Orleanians are feeling the impact of the Great Recession, although to a lesser degree than in the nation. The poverty rate in the city increased from 21 percent in 2007 to 27 percent in 2010, about the same as it was back in 1999. Meanwhile, poverty rates in the U.S. are now higher than eleven years ago. But even with the nationwide increase in poverty, the city of New Orleans’ 27 percent poverty rate is substantially higher than the United States average of 15 percent.
Home sales are stable but remain low.Single-family home sales in the city have fallen substantially since 2007 due to the credit crunch and weak economy. Average monthly home sales in New Orleans through September of 2011 are 35 percent lower than the same period in 2007 and 13 percent lower than in 2008. However, 2011 home sales are so far running about even with home sales during the previous two years. Thus far in 2011, 182 homes have been sold each month at an average sale price of $239,175, which is just 3 percent lower than during the same period in 2010.iv In the rest of the metro area, single family home sales through September are also down from 2007 and 2008, but slightly higher than last year. In 2011, 498 homes have been sold each month at an average sale price of $192,787.
Affordability problems persist for New Orleans homeowners.In the city of New Orleans, median housing costs for home-owners with a mortgage (including taxes, insurance, and utilities) were $1,470 per month in 2010, 14 percent higher than in 2004. For homeowners without a mortgage, costs have increased by 19 percent since 2004 to $467 per month. A cost-burdened household, as defined by federal standards, pays more than 30 percent of pre-tax household income on hous-ing costs. In 2010, 35 percent of New Orleans homeowners were cost-burdened, a higher share than the national average.
Poverty ratefor the population for whom poverty status is determined
0
10
20
30%
Orleans New Orleans Metro US
28%
21%18%
15%12%13%
27%
17%15%
1999 2007 2010
n.s.n.s.
n.s.
Source: GNOCDC analysis of data from Census 2000 SF3, American Com-munity Survey 2007, and American Community Survey 2010.
n.s.= Indicates change between 1999 and 2010 is not significant.
Average monthly home sales, Jan. - Sep.New Orleans
243278 279
209180 179 182
0
100
200
300
2005 2006 2007 2008 2009 2010 2011Source: GNOCDC analysis of data from the New Orleans Metropolitan Association of Realtors.
Homeowners paying unaffordable housing costs30% or more of pre-tax income on housing, 2010
42%
40%
35%
27%
26%
New York, NY
Las Vegas, NV
Orleans Parish, LA
Jefferson Parish, LA
St. Tammany Parish, LA
n.s.
U.S. average 31%
Source: GNOCDC analysis of data from American Community Survey 2010.
n.s.= indicates difference from Orleans is not significant at 95% confidence interval.
Page 7 of 20www.gnocdc.org
New Orleans renters struggle to bear costs of high rents on low incomes.Housing costs for New Orleans renters (including utilities) have skyrocketed 37 percent since 2004 to a median of $897 per month. In comparison, rents increased 7 percent nation-wide during the same time frame. Pre-Katrina, median rental costs in New Orleans were $653 (in 2010 dollars). Rents in New Orleans are now higher than the U.S. average and higher than rents in other cities like San Antonio, Memphis, and Milwaukee.
While median rent has increased since 2004, over the same time period median income has not. The median household income for New Orleans renters is only $24,535. New Orleans renters pay 5 percent more than the U.S. average for housing on incomes that are 20 percent lower than the U.S. average. These low incomes have caused the majority of New Orleans renters – just over 60 percent – to be housing cost burdened. Indeed, 38 percent of renters qualify as severely cost-burdened (paying more than half of their income on housing). A larger share of New Orleans renters are severely cost-burdened even when compared to high priced cities like New York, where 29 percent of renters are severely cost-burdened.v
Significant changes in the regional household mix have been underway for decades.The aging of the baby boomers has been a major driving force behind demographic changes in the New Orleans metro and the nation since 1960.vi As the baby boomers grew up and families started having fewer children, the share of households with children declined across the metro, and the share of single person households grew.
Since 1980, New Orleans is decreasingly made up of house-holds with children and increasingly made of up individuals living alone. Indeed these trends accelerated post-Katrina such that by 2010, the share of households in the city that are individuals younger than 65 living alone is equal to the share of households with children under 18 (28 percent each). In contrast, the share of individuals 65 and older living alone remained relatively the same from 1980 to 2000, but dropped 2 percentage points after the storm.
The rest of the metro has also experienced declining shares of households with children and increasing shares of indi-viduals living alone. In 2010, 35 percent of households in the suburban parishes were households with children and only 16 percent were individuals under 65 living alone. In contrast to the city, the rest of the metro has experienced steadily increasing shares of individuals 65 years and older living alone since 1980.
By 2010, while 31 percent of all metro area households live in New Orleans, households with children are less likely to live in the city (26 percent), while singles younger than 65
Annual housing costs vs. incomefor renters, 2010
Median Household Income
Housing Costs
Orleans
US
Orleans
US
$24,535
$30,671
$10,764
$10,260
Source: GNOCDC analysis of data from American Community Survey 2010.
Share of total households by typeNew Orleans
60%
1980 1990 2000 2010
40
20
0
37%
21%
10%
36%
21%
11%
35%
23%
10%
28% 28%
8%
Households with children under 18 years
Single person, under 65 years old
Single person, 65 years and older
Source: GNOCDC analysis of U.S. Census Bureau data from the decennial census.
Share of total households by typeRest of the New Orleans metro
Households with children under 18 years
Single person, under 65 years old
Single person, 65 years and older
1980 1990 2000 2010
40
20
0
60%
48%
42%39%
35%
13% 15% 16% 16%
5% 7% 8% 9%
Source: GNOCDC analysis of U.S. Census Bureau data from the decennial census.
Page 8 of 20 www.gnocdc.org
are more likely to live in the city (43 percent), and individuals 65 years and older living alone are equally likely to live in the city as in the suburbs (31 percent).
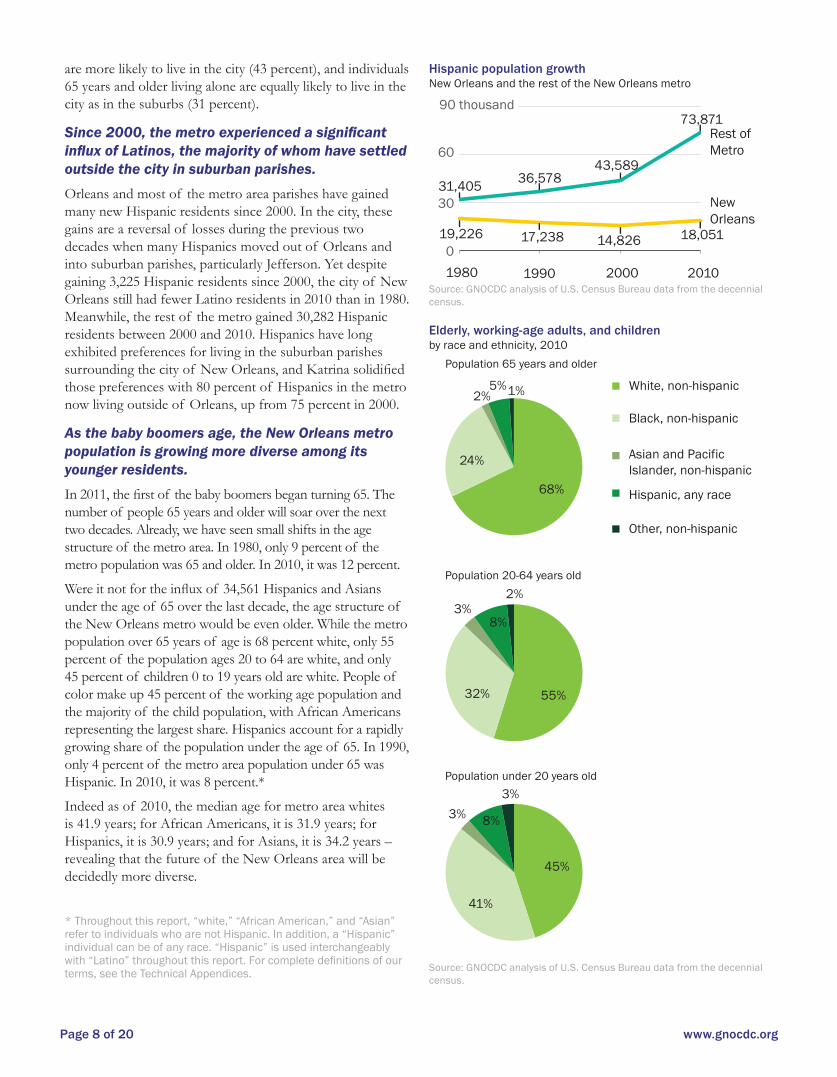
Since 2000, the metro experienced a significant influx of Latinos, the majority of whom have settled outside the city in suburban parishes.Orleans and most of the metro area parishes have gained many new Hispanic residents since 2000. In the city, these gains are a reversal of losses during the previous two decades when many Hispanics moved out of Orleans and into suburban parishes, particularly Jefferson. Yet despite gaining 3,225 Hispanic residents since 2000, the city of New Orleans still had fewer Latino residents in 2010 than in 1980. Meanwhile, the rest of the metro gained 30,282 Hispanic residents between 2000 and 2010. Hispanics have long exhibited preferences for living in the suburban parishes surrounding the city of New Orleans, and Katrina solidified those preferences with 80 percent of Hispanics in the metro now living outside of Orleans, up from 75 percent in 2000.
As the baby boomers age, the New Orleans metro population is growing more diverse among its younger residents.In 2011, the first of the baby boomers began turning 65. The number of people 65 years and older will soar over the next two decades. Already, we have seen small shifts in the age structure of the metro area. In 1980, only 9 percent of the metro population was 65 and older. In 2010, it was 12 percent.
Were it not for the influx of 34,561 Hispanics and Asians under the age of 65 over the last decade, the age structure of the New Orleans metro would be even older. While the metro population over 65 years of age is 68 percent white, only 55 percent of the population ages 20 to 64 are white, and only 45 percent of children 0 to 19 years old are white. People of color make up 45 percent of the working age population and the majority of the child population, with African Americans representing the largest share. Hispanics account for a rapidly growing share of the population under the age of 65. In 1990, only 4 percent of the metro area population under 65 was Hispanic. In 2010, it was 8 percent.*
Indeed as of 2010, the median age for metro area whites is 41.9 years; for African Americans, it is 31.9 years; for Hispanics, it is 30.9 years; and for Asians, it is 34.2 years – revealing that the future of the New Orleans area will be decidedly more diverse.
* Throughout this report, “white,” “African American,” and “Asian” refer to individuals who are not Hispanic. In addition, a “Hispanic” individual can be of any race. “Hispanic” is used interchangeably with “Latino” throughout this report. For complete definitions of our terms, see the Technical Appendices.
Hispanic population growthNew Orleans and the rest of the New Orleans metro
Rest of Metro
New Orleans
90 thousand
60
30
01980 1990 2000 2010
31,405 36,57843,589
73,871
19,226 17,238 14,826 18,051
Source: GNOCDC analysis of U.S. Census Bureau data from the decennial census.
Elderly, working-age adults, and children by race and ethnicity, 2010
45%
41%
8%3%3%
Population under 20 years old
55%32%
3%8%
2%Population 20-64 years old
68%
24%
2%5%1%
Population 65 years and older
White, non-hispanic
Black, non-hispanic
Asian and Pacific Islander, non-hispanic
Hispanic, any race
Other, non-hispanic
Source: GNOCDC analysis of U.S. Census Bureau data from the decennial census.
Page 9 of 20www.gnocdc.org
PART II. IMPENDING HOUSING DEMANDThere is no doubt that, as across the nation, the most important demographic shift over the next few decades in the New Orleans area will be the dramatic increase in the older adult population. Simply adding the 145,520 people 55 to 64 currently living in the metro to the group 65 and older (after applying age-specific mortality rates), we can anticipate a sizable jump in the metro population 65 and older by 2020. In addition, increasing life expectancy means that a growing number of people are reaching 75, 85, and even 100 years old.vii
Trends and projections in the population 65 years and olderNew Orleans metro
0
50
100
150
200 thousand
1980 1990 2000 2010 2020
116,291
138,877149,667 142,091
190,641
Source: GNOCDC analysis of U.S. Census Bureau data from the decennial census, and authors’ projections.
The aging of the baby boomers will bring other demo-graphic shifts such as a continued decrease in the number of households with children and greater increases in the number of people living alone. Having a reasonable idea of the scale of these upcoming changes is essential to inform current housing policy and planning decisions. As housing professionals in the New Orleans metro know all too well, housing plans and policies sometimes take five or more years to come to fruition. Projections of the change in the New Orleans household mix by 2020 can greatly aid the decisions policy makers must make today.
By 2020, the elder boom will dramatically change the household mix in New Orleans.Although it is not possible to perfectly predict the 2020 household mix in New Orleans, it is possible to estimate a range of futures based on recent 2010 census population and household counts combined with reliable employment forecasts. The analysis below estimates the city’s 2020 household mix for three distinct scenarios.
Americans tend to make decisions about moving from one home to another at key points in their lives. Often times these moves are made to pursue career opportunities early in our adult life. In addition, when families have children, many opt for suburban style living on larger plots of land in search of new or better housing and safer communities.viii As the graph below depicts, the likelihood of moving declines as we age. Individuals 65 and older tend to move to be closer to family, for better or cheaper housing, and for health reasons or to accommodate decreasing abilities, with the latter becoming increasingly important for individuals over 75.ix
Living in a different house one year agoShare of total population by age, 201040%
30
20
10
020-24 25-29 30-34 35-39 40-44 45-49 50-54 55-59 60-64 65-69 70-74 75 and over
United States
New Orleans Metro
Source: GNOCDC analysis of data from the American Community Survey 2010.
Page 10 of 20 www.gnocdc.org
Scenario 1: No net in-migration
Given current economic forecasts, it’s reasonable to assume that the number of newcomers who might come to the region could be offset by those who leave the region for work opportunities resulting in no significant net in-migration. Although zero net in-migration may seem pessimistic, simply factoring in expected births and deaths results in a 2.7 percent population growth rate for the metro by 2020, which is not inconsistent with the 2011 Louisiana Workforce Commission’s 3.5 percent predicted job growth rate over 10 years. The number of households yielded from this population forecast is derived and the current share in New Orleans is applied to determine the 2020 household mix in New Orleans.
Scenario 2: Retain families with young children and retirement age adults
This scenario also assumes no net in-migration to the metro, but it assumes that families with young children currently living in the city, who might otherwise consider moving to the suburbs when their children reach school age, instead choose to stay in the city. Further, it assumes that as house-holders currently between the ages of 55 and 64 join the cohort of householders 65 years and older, the entire cohort (less age specific death rates) remains in their homes in the city rather than moving to homes elsewhere.
Scenario 3: Robust economic growth
This scenario assumes a much more optimistic metro area population growth rate of 9.2 percent that mirrors the growth rates enjoyed by a comparably sized southern metro (the Memphis metro area) over the last ten years.
Regardless of the scenario, the increase in house-holds headed by adults 65 and older will greatly surpass the increase in any other household type. This is the effect of the aging of the baby boomers. In Scenarios 1 and 2, the number of householders 15 to 64 (whether living alone, not living alone, or with children) will decrease. These decreases are largely related to the aging of the population and the large cohort of people in the metro area that will move from working age to 65 and older by 2020 – resulting in an overall decrease in the number of adults 15 to 64 living in the metro area. In Scenario 2, the city retains all the families with only young children currently living in the city, leading to a relatively stable number of households with children by 2020. This scenario does not generate a large increase in households with children – because of the aging of women currently of childbearing age. In Scenario 3, job growth leads to increases in householders ages 15 to 64 with and without children.
But in every case, the number of households headed by older adults will increase as the metro and national population ages.
Table 1: Projected change in number of households by type for three scenariosNew Orleans
Age 15-64 Living alone
Age 15-64 With children
Age 15-64 Without children but not alone
Age 65+ Living alone
Age 65+ With children
Age 65+ Without children but not alone
Household Types 2010 Households 2020 Scenario 1: no net in-migration
2020 Scenario 2: retain families with young children and
adults 65+
2020 Scenario 3: robust economic
growth
39,098
37,210
40,215
11,909
1,754
11,972
-1,003
-1,165
4,069
599
4,091
5,331
-1,003
-170
-1,259-1,259
4,816
709
4,842
7,934
1,410
1,118
1,208
5,081
748
5,108
14,674Total 142,158
Source: GNOCDC analysis of U.S. Census Bureau data from the decennial census, and authors’ projections.Note: For a downloadable spreadsheet of household and population projections for Scenario 1, and Technical Appendices with information about our meth-odology, be sure to visit www.gnocdc.org.
Page 11 of 20www.gnocdc.org
In New Orleans, a large number of elderly may need supports in order to remain in the city.The kind of housing these older adults need will depend to some extent on their physical abilities and to some extent on their financial resources. Many of these older adults will eventually lose physical or mental abilities, and maintaining their lifestyles in their own homes may become untenable. Based on published research on disability rates among the elderly and the authors’ analysis of ACS 2009 microdata, we estimate that in 2010, 9,100 of the city’s adults 65 and older had a moderate or serious disability and were still living at home.x This number will jump to 12,600 by 2020. By 2030, a larger share of older adults will reach 75 years and older (after applying age-specific death rates), at which point a larger number of elderly will likely have disabilities. These older adults will only be able to remain in their homes with appropriate supports and if they are able to modify their homes to accommodate their disability, as necessary.
In addition, New Orleans’ elders are much more likely to be impoverished than elders in the surrounding suburbs and in the nation. In 2010, 17 percent of New Orleanians age 65 and older lived below the poverty level, which is $11,344 annually for a single person household. In comparison, only
7 percent of elders in the rest of the metro and 9 percent in the United States lived below the poverty level in 2010. An additional 27 percent of elders in the city lived between 100 percent ($11,344 annually) and 200 percent of poverty ($22,688 annually) – a similar rate as in the rest of the metro and the nation. Indeed, in their recently released strategic plan, the Housing Authority of New Orleans reported significant wait lists for their handicapped-accessible units.xi
Density of occupied housing unitsNew Orleans metro
St. Tammany
Jefferson
Orleans
St. Charles
Plaquemines
St. Bernard
St. John theBaptist
0 12 Miles
<www.gnocdc.org>
Data not available
Low High
St. Tammany
Jefferson
Orleans
St. Charles
Plaquemines
St. Bernard
St. John theBaptist
1960 2010
Projections in the population 65 years and olderNew Orleans
95+ years
85-94 years
75-84 years
65-74 years
2010 2020 2030
30
60
90 thousand
Source: GNOCDC analysis of U.S. Census Bureau data from the decennial census, and authors’ projections.
Source: GNOCDC analysis of U.S. Census Bureau data from the decennial census.
Page 12 of 20 www.gnocdc.org
These current wait lists, combined with the impending elder boom, suggest that demand for many of the rebuilt, highly subsidized housing units such as in the Iberville Develop-ment may come from individuals with accessibility needs.
Most baby boomers grew up in the suburbs, but the city also is home to a large number of aging boomers, who likely will want to remain.Like in other American cities, many New Orleanians expressed their preference for suburban-style living when the construction of levees, drainage, and Interstate 10 beginning in the 1960s supported new developments in former marshlands. Much of the movement to suburban parishes was racially motivated “white flight” in response to school de-segregation policies.xii In New Orleans, African Americans also expressed their preferences for suburban style living, but mostly within city boundaries in part because redlining practices restricted their access to suburban parishes.xiii These moves from the historic section of the city to suburban developments led to a dramatic shift in the concentration of households toward suburban and exurban parishes. By 2010, 69 percent of all households in the metro lived in the suburban parishes and only 31 percent lived in the cityxiv See p.11 for maps of occupied housing density that depict suburban sprawl across the New Orleans metro in 1960 and 2010.
Adults 65 years and older are also more likely to live in New Orleans’ suburbs rather than in the city, as are adults 55 to 64 years of age. As this next cohort reaches retirement age in the coming years, they too will likely remain in the sub-urbs because older adults largely prefer to “age in place.”xv This represents both a challenge and an opportunity for New Orleans. New Orleans can strive to attract those empty nesters who may prefer to give up their suburban homes for more walkable downtown neighborhoods, but because most older adults prefer to remain in their homes, the city will not likely see an enormous influx of retirees. However, as the large cohort of New Orleanians reaches older age, decision-makers may be able to reduce a large outflow of households by creating policies that support New Orleanians remaining in their homes as they age.
According to American Community Survey 2009 data, in New Orleans, individuals 65 and older living alone are disproportionately more likely to be homeowners living in single family homes built before 1950. As these seniors age, they may reach a decision point about whether they can continue to stay in their historic homes. Indeed, it seems that many seniors reached this decision point over the last decade resulting in the loss of hundreds of elder households from historic neighborhoods – including nearly every neighbor-hood that did not flood along the “sliver by the river.”xvi As more and more New Orleanians reach older age, enabling them to remain in their homes will be a critical component to reducing blight and abandonment in the city.
Share of metro population living in the cityby age group, 2010
40%
30
20
10
0
New Orleans average
0-17 18-24 25-34 35-4445-54 55-64 65+
Source: GNOCDC analysis of U.S. Census Bureau data from the decennial census.
Select household characteristicsNew Orleans, 2009
Home built before 1950
Single family home
Homeowners
55%
58%
52%
62%
46%
66%
Single person, 65 years and older
All households
Single person, 65 years and olderAll households
Single person, 65 years and olderAll households
Source: GNOCDC analysis of American Community Survey Public Use Micro-data Series, 2009.
Note: These percentages are derived from authors’ analysis of American Community Survey 2009 microdata in order to capture housing characteris-tics not included in the Census 2010. As a result, the homeownership rate published above for all households varies slightly from the Census 2010.
Page 13 of 20www.gnocdc.org
PART III. LOOKING AHEAD: WHAT DEMOGRAPHIC SHIFTS SUGGEST FOR POLICY AND PROGRAMSThis report describes the upcoming demographic changes in our nation and our community, and the implications for housing demand and community planning. But we also recognize that those implications are not fixed in stone. Public policy and private efforts can affect the level and mix of household growth over the next decade. The policies and programs described below are not meant as a comprehensive strategy, but as illustrations of programs to accomplish the goals of growing the city. Because the increase in older adult households is anticipated to greatly surpass growth of any other household type across the metro and in the city, the below policy and program ideas focus largely (although not exclusively) on that age group.
Omitted from the list of policies and programs below are suggestions for reducing crime. Violent crime rates in New Orleans are nearly twice the national average,xvii and certainly crime is a determining factor for many individuals when considering whether to move to or remain in a city.xviii However, reducing crime and strengthening our criminal justice system are very complex topics that require more attention than can be yielded to them in this report. Thus, we focus on a variety of other intervention areas.
Building Supports for Aging in Place
Studies show that most older adults by and large want to remain in their homes as long as possible.xix The community should support this choice, not only because of the householder’s wishes, but because it will benefit the neighborhood as a whole. Having older adult households stay in their home longer will reduce the number of homes coming onto the market in the near-term and avoid the risk of another vacant property, particularly in weak market neighborhoods. In order to stay in their homes, some older adults may never need physical accommodations or assistance with daily living activities. However, most older adults will consider a home’s accessibility, availability of services, and affordability when deciding whether to remain in their current home or within the city at all. Programs to address these concerns will be important in creating an environment suitable to aging adults.
One example of improving the accessibility and safety of existing homes is the nonprofit Rebuilding Together, which provides free repairs for low-income older homeowners, helping to keep homes safe and affordable while helping the neighborhood overall in maintaining the home. Other local governments have small grant programs for long-time older homeowners to retro-fit their homes (grab-bars, widen
doorways, etc.). Off-street parking may also ease access for some elderly homeowners, and programs like the Lot Next Door could transfer ownership of vacant lots for this purpose, serving the dual goals of assisting elderly adults in remaining in their homes and putting an empty property to productive use.
In regard to rental housing, a recent survey of apartment complexes in New Orleans suggests that much of the housing stock is not compliant with Fair Housing accessibility requirements aimed at those with a physical disability. Greater enforcement of these federal regulations should be a priority and would assist many seniors in remaining in these units.xx For both rental and homeowner units, government and nonprofit agencies responsible for rehabbing units could promote the use of universal design, a concept of designing residential homes “to be usable by all people, to the greatest extent possible, without the need for special adaptation.”xxi Examples of universal design for homes include a step-free entrance, multiple countertop heights, wide doorways, and a curbless shower. Other cities offer examples of voluntary and mandatory programs to increase these practices.
Other programs to help older residents remain in their homes and neighborhoods focus on in-home and community services that provide intermittent assistance. In New Orleans, the Pontchartrain Park neighborhood is developing programming and services that will allow older residents to remain in their homes while maintaining a high quality of life. This initiative has similar goals to those of the membership-based Capitol Hill Village in Washington, D.C., which provides occasional support to elderly in their homes.xxii The Capitol Hill Village vets contractors, connects seniors with volunteers to drive them to appointments or run errands, and organizes social activities. These smaller-scale nonprofit programs are pieces of the puzzle, but several larger public and private systems need to be in place to support older adults in the community. For example, city and regional transportation agencies could contribute to the region’s readiness for the aging population by specifically considering the needs and locations of the older adults both in their short-
Page 14 of 20 www.gnocdc.org
term decision-making about routes and in their long-term plans. The workforce development agencies also have a role to play in evaluating the size and strength of the in-home service sector.
Beyond the need for accessibility and services, older home-owners, many of whom have fixed incomes, also face affordability challenges. The city’s program to freeze the taxable assessed value for those homeowners over age 65 and earning less than $66,000 per year is one program to reduce the cost of housing for older adults. Many elderly homeowners may be unaware of this benefit and outreach to older homeowners could be a simple way to help them stay in their homes. The city could also think about how programs for all ages could be tapped to help the city’s aging population. The NOLA Wise program, which helps homeowners improve the energy efficiency of their homes, is available to households of all ages. A targeted outreach to older households to publicize the availability and benefits of this program, such as mailings to those receiving the elderly assessment freeze and the distribution of information at senior community centers, could help older households access these resources. Costs for services can also be overwhelming to low and moderate income seniors. At the state level, increasing the availability of Medicaid coverage for home based services would alleviate some of the financial pressures and enable more elders to stay at home and out of costly nursing care.
Understanding the Array of Specialized Private-Market HousingWhile senior households should enjoy as much independence as possible, many will need to move from their own homes to specialized housing designed for seniors. Based on our initial scan of the housing supply targeted for seniors (see side bar) and assuming the same rate of use among older adults that exists today, the city will need roughly 1,400 additional senior units or beds by 2020.xxiii Our first review of the supply based on two sources provides a start, but needs to be verified with other sources of information to create a full catalog of available senior housing. The city can then regularly assess both the older
Senior housing in New Orleans and the metro
Some households by necessity or choice move from their private homes to housing tailored to elderly with a range of supportive service needs (“senior housing”). To begin to paint a picture of this segment of the housing market, we conducted a scan of available privately owned residential facilities in the New Orleans metropolitan area.We include four main types of senior housing defined largely by the services offered. Independent Living facilities are age-restricted retirement and active living communities with private units with amenities such as community dining and group activities, but they do not provide health related services. In contrast, Assisted Living residences provide personalized assistance, supportive services, and an intermediate level of health care to elderly residents who need assistance with daily tasks, but do not require full-time nursing services. Together these two categories represent about 1,000 housing units in the New Orleans metro.The highest level of services can be found in Nursing Homes. They provide intensive, long-term, around the clock medical care for residents with serious health problems. These are generally larger and more expensive than other types of senior housing. In the New Orleans metro, nearly 5,000 beds are in nursing homes. Finally, Continuing Care Retirement Communities combine multiple levels of housing-based care so that residents can move easily between different types of residences as needs for varying levels of health care change. A quarter of all senior housing in the metro – 2,000 total units – are designated Continuing Care. In total, our survey captured nearly 8,000 private residences (or beds for nursing homes) operating for the sole purpose of housing older adults in the metropolitan area, and 43 percent of these are located in the city. While there is no published standard for the appropriate mix of types of senior housing, our impression is that aging New Orleanians could benefit from a larger supply of independent and assisted living to provide more options in between the burden of maintaining their own homes and group living with intensive medical services in nursing homes.The cost of senior housing is as much a concern as the supply. In the New Orleans area, the median monthly rent for a private residence in an assisted living development is $3,620, compared to $3,261 nationally. The median monthly rate for a semi-private unit in a nursing home is $4,471.xxv While we don’t have rates for continuing care facilities, down payments can often be over $100,000 before monthly rents. This represents an impossible cost burden for many in need of long term housing.
adult population and quantity and type of senior housing options. While nursing homes dominate the specialized housing right now, many forces are likely to lead to a shift away from institutionalization, including elders’ preference to age in place, the cost of nursing care, and a more flexible array of state and federal housing policies.xxiv Certainly, a wider array of options with varying levels of support services could help to retain long-time residents in the city. To pave the way, the city needs to understand the barriers and opportunities to building more independent and assisted living, including factors such as regulations, financing, land assembly, and the capacity of developers and management
Page 15 of 20www.gnocdc.org
companies. When developing new senior housing facilities or complexes, the city should first explore the possibility of re-purposing larger, empty public buildings such as closed schools for senior housing before new construction. If this is feasible, it would solve two problems at once – return vacant property to productive use and increase the supply of supportive housing for the elderly. Our current inventory indicates that New Orleans actually has a better range of senior housing options than the suburbs at this time. If the city continues to develop senior housing options, it could be a draw for aging households throughout the region.
Preserving the Role of Subsidized Housing for the Elderly
Elder households at the lowest income levels are particularly vulnerable. For those families in subsidized housing, the Housing Authority of New Orleans has already recognized the importance of accessibility. The agency’s strategic plan suggests the creation of an incentive program for landlords accepting housing vouchers to retrofit existing units to be accessible and requires that 10 percent of the units in new developments be accessible. These are steps in the right direction, but the agency will need to monitor the housing supply and residents’ needs to see if these measures are sufficient to address the upcoming demand. The subsidized units to be developed over the next year by Christopher Homes for low-income seniors will help boost the supply of affordable housing. The recently approved redevelopment of the Iberville public housing site offers an excellent opportunity for the Housing Authority to produce several hundred units with universal design features that will accommodate individuals of all ages. In addition, the newly-formed Louisiana Housing Corporation (LHC) can encourage a larger supply of subsidized housing suitable for seniors by, for example, requiring set-asides for housing with services. The LHC can reduce blight at the same time by prioritizing rehabilitation of small rental properties with accessibility features and reuse of old buildings such as churches and schools for senior housing.
Attracting New ResidentsGiven the current global economic climate, the likelihood of the economic boom (as described in Scenario 3) leading to a significant increase in housing demand in the New Orleans metro seems unlikely. Nonetheless, the city should continue to implement strategies to attract new residents. Our 2010 housing report, “Optimizing Blight Strategies,” described policies and programs to reduce blight, and bringing in new households to rehab and occupy abandoned units will be essential to ensuring that weak market neighborhoods improve rather than decline.
To support this goal of increasing population, other cities have built a central portal for marketing neighborhoods and facilitating moves into the city. The nonprofit organization Live Baltimore has provided resources for almost 15 years to those interested in moving to their city, including neighborhood profiles and information about home buying incentives. A diverse group from city government, nonprofits, and the business community funds and governs the organization.xxvi In the New Orleans area, promotional materials might be more effective if they are also published in Spanish in recognition of the growing Hispanic population in our suburban parishes. The City of Milwaukee and the Greater Milwaukee Foundation engage residents to design their own programs for promoting their neighborhoods, improving neighborhood appearance, and encouraging homeowners to buy in the neighborhood.xxvii Neighborhood Housing Services in Milwaukee began working more closely with the real estate com munity, and learned that profit margins were lower in weaker neighborhoods.xxviii Thus, they began offering small finder’s fees to agents as an incentive to market their properties.
In addition to encouraging people to move into neighbor-hoods as they exist now, local governments and nonprofits are reshaping many neighborhoods with decisions about redevelopment and new construction. Developing at least some of the housing suitable for the household types we know will increase in the future makes sense. For example, some of the new homeownership units being built with public subsidies could be smaller single family homes or condominiums in consideration of the growing number of single-person households. This tactic would make most sense in denser areas or neighborhoods with good access to public transportation.
Page 16 of 20 www.gnocdc.org
CONCLUSIONThe predictability of the upcoming demographic changes offers an opportunity for our city to get ahead of the curve and enact policies that support a diversity of households. Certainly increasing the city’s population has been a topic of public discussion, and a more coordinated effort to provide a welcoming and supportive environment for several target groups would advance that goal. But one clear challenge our city faces is to ensure that we can meet the housing needs of our very large cohort of aging residents. While this study lays out some of the issues, the city needs more detailed information on current programs and foreseeable gaps for supporting aging in place, for senior specific private market housing, and for appropriate public and subsidized hous-ing for the elderly. This would provide us with a common understanding of where we stand now and a blueprint for moving forward.
Whether supporting older households to age in place or developing targeted housing, government agencies, non-profit organizations, and private market firms are currently confronting these issues in silos. To make the best use of our limited resources, our community needs a forum to facilitate collaboration among the various systems working to improve elderly services, including housing, transporta-tion, social supports, and in- and out-of-home services. A network crossing issue areas and jurisdictional boundaries would enable groups to share their expertise and plans, help identify opportunities for leveraging disparate efforts, and provide a robust voice for increasing funding or innovative programs for services or housing.
A strong love of place is perhaps one of the most distinguishing features of New Orleanians. This love of place made us resilient enough to rebuild our city after the costliest disaster in U.S. history.xxix If we start planning today, together we can ensure that New Orleans continues to be a place we can all enjoy well into our twilight years.
Page 17 of 20www.gnocdc.org
END NOTESi Hayutin, A.M., Dietz, M., & Mitchell, L. (2010). New realities of an older America: Challenges, changes and questions. Stanford Center on Longevity. Retrieved October 27, 2011 from http://longevity.stanford.edu/files2/New Realities of an Older America_0.pdf.
ii U.S. Census Bureau. (2009). Geographic mobility: 2008 to 2009 (Table 27) [Data file]. Retrieved October 10, 2011 from http://www.census.gov/population/www/socdemo/migrate/cps2009.html.
iii Plyer, A., & Ortiz, E. (2011). Regional export industries: Drivers of the New Orleans economy. Greater New Orleans Community Data Center. Retrieved November 2, 2011 from https://gnocdc.s3.amazonaws.com/reports/GNOCDC_RegionalExportIndustries.pdf.
iv Although some recent news coverage has highlighted that September 2011 sale volumes in the city were up 29 percent and the average sale price was up 25 percent from one year ago, one month of data does not constitute a trend.
v U.S. Census Bureau. (2011). The Statistical Abstract of the United States: 2012. Cost of Living Index--Selected Urban Areas (Table 728) [Data file]. Retrieved October 26, 2011 from http://www.census.gov/compendia/statab/cats/prices.html.
vi Centers for Disease Control and Prevention. (2003). Vital statistics of the United States, 2003 (Table1–1) [Data file]. Retrieved October 27, 2011 from http://www.cdc.gov/nchs/data/statab/natfinal2003.annvol1_01.pdf; Fields, J. (June 2003). Children’s living arrangements and characteristics: March 2002. Washington, DC: U.S. Census Bureau. Retrieved October 27, 2011 from http://www.census.gov/prod/2003pubs/p20-547.pdf.
vii Hayutin, A.M., Dietz, M., & Mitchell, L. (2010).
viii GNOCDC analysis of Current Population Survey, 2009-2010.
ix Ibid.
x Estimates by authors based on national projections of disability rates and data from the American Community Survey and Decennial Census 2010. See the Technical Appendices for more details.
xi Housing Authority of New Orleans. (2011). Strategic Plan for Real Estate Development, Planning for the Future of New Orleans, 2011-2015. New Orleans, LA. Retrieved October 27, 2011 from http://www.hano.org/documents/Strategic_Plan_6_30_11.pdf.
xii Jackson, K.T. (1985). Crabgrass frontier: Suburbanization of the United States. New York, NY: Oxford University Press.
xiii Ibid.
xiv Plyer, A., Ortiz, E., & Horwitz, B. (2011). Housing development and abandonment in New Orleans since 1960. Greater New Orleans Community Data Center. Retrieved October 27, 2011 from http://www.gnocdc.org/HousingDevelopmentAndAbandonment/index.html.
xv Keenan, T. (2010). Home and community preferences of the 45+ population. Washington, DC: AARP. Retrieved October 27, 2011 from http://assets.aarp.org/rgcenter/general/home-community-services-10.pdf.
xvi Plyer, A., Ortiz, E., & Horwitz, B. (2011).
xvii Plyer, A., & Ortiz, E. (2011). The New Orleans Index at Six: Measuring greater New Orleans’ progress toward prosperity. Greater New Orleans Community Data Center. Retrieved October 27, 2011 from http://gnocdc.org/TheNewOrleansIndexAtSix/index.html.
xviii Blash, L., Shafer, H., Nakagawa, M., & Jarrett, S. (2005). Getting behind the headlines: Families leaving San Francisco. Public Research Institute, San Francisco State University. Retrieved October 20, 2011 from http://www.dcyf.org/downloads/Final White Paper10_21_05.pdf.
xix Keenan, T. (2010).
xx Greater New Orleans Fair Housing Action Center. (2009). Access denied: An audit report on housing accessibility for people with physical disabilities in the Greater New Orleans Rental Housing Market. Retrieved October 27, 2011 from http://dev.gnofairhousing.org/wp-content/uploads/2011/09/AccessDenied2009.pdf.
xxi Salomon, E. (2010). Expanding implementation of universal design and visitability features in the housing stock. Washington, DC: AARP. Retrieved October 28, 2011 from http://assets.aarp.org/rgcenter/ppi/liv-com/fs167-expanding-implementation.pdf.
xxii For an overview of the Village model, see Accius, J. C. (2010). The village: A growing option for aging in place. Washington, DC: AARP. Retrieved October 28, 2011 from http://assets.aarp.org/rgcenter/ppi/liv-com/fs177-village.pdf.
xxiii Estimates by authors based on estimated current supply of senior housing units and Decennial Census 2010. See the Technical Appendices for more details.
xxiv For an overview about trends and financing in long-term care, see Kassner, E. (2011). Home and community-based long-term services and supports for older people. Washington, DC: AARP. Retrieved October 28, 2011 from http://www.aarp.org/health/health-care-reform/info-05-2011/fs222-health.html.
Page 18 of 20 www.gnocdc.org
xxv Genworth Financial Inc. (2011). Louisiana state-specific data from the Genworth 2011 cost of care survey. Retrieved November 1, 2011 from http://www.genworth.com/content/etc/medialib/genworth_v2/pdf/ltc_cost_of_care.Par.25773.File.dat/Loiusiana_gnw.pdf.
xxvi Live Baltimore. (2011). Live Baltimore: I love city life. Retrieved October 27, 2011 from http://www.livebaltimore.com/.
xxvii Milwaukee Neighborhood Improvement Development Corporation. (n.d.). Healthy neighborhood initiatives. City of Milwaukee. Retrieved October 27, 2011 from http://www.mkedcd.org/housing/nidc/HealthyNeighborhoods.html.
xxviii Stockdale, D. (n.d.). NHS of Milwaukee Neighborhood Home Buyer Guide. Washington, DC: NeighborWorks America. Retrieved October 27, 2011 from http://www.nw2.org/WinningStrategies/display.asp?strategy=1015&offset=2.
xxix The Economist. (March 21, 2011). Natural disasters: Counting the cost. Retrieved October 27, 2011 from http://www.economist.com/blogs/dailychart/2011/03/natural_disasters.
Page 19 of 20www.gnocdc.org
This page intentionally left blank.
Page 20 of 20 www.gnocdc.org
Allison Plyer & Elaine OrtizGreater New Orleans Community Data Center
Kathryn L.S. Pettit & Chris NarducciThe Urban Institute
UrbanInstituteA product of Nonprofit Knowledge Works
About Housing in the New Orleans MetroThe Housing in the New Orleans Metro series creates a common base of reliable information around housing and the recovery that is easy to use to support decision making at many levels as the New Orleans area moves from recovery to large-scale community development. Housing policy development must be informed by a solid understanding of demographic changes, housing demand and supply, housing affordability challenges, economic trends, and regional commuter patterns. The Housing in the New Orleans Metro annual report quantifies housing issues and raises promising policy options that can address current and future housing problems. In addition to the annual report, periodic Housing in the New Orleans Metro briefs highlight new data as they are acquired and analyzed to provide timely support to local, state, and federal decision-making. The complete collection of briefs and reports can be found on the Data Center’s website: www.gnocdc.org.