38
I FilE COpy .. 383-76 , NSTTUTE FOR . RESEARCH ON, ,IV ',I I PAPERS A COST-EFFECTIVENESS STUDY OF LEASED PUBLIC HOUSING John F. Morrall III Edgar O. Olsen

I FilE COpy .._.~-----' ---'~-~--~[)O--NOI--RE-MOV-E----~-----~-
383-76
, ~, NSTTUTE FOR.RESEARCH ON,PO~ /ER'~/DISCUSSION
,IV ',I I PAPERS
A COST-EFFECTIVENESS STUDY OF LEASED PUBLIC HOUSING
John F. Morrall III
Edgar O. Olsen
A COST-EFFECTIVENESS STUDY OF LEASED PUBLIC HOUSING
John F. Morrall IIICouncil on Wage and Price Stability,Executive Office of the President
726 Jackson Place, N.W., Washington, D.C. 20506
Edgar o. OlsenDepartment of Economics, University of Virginia
Charlottesville, Virginia 22901
November. 1976
This study is a part of the in-house research pr.ogram of the Office ofProgram Analysis and Evaluation of the Office of the Assistant Secretaryfor Policy Development and Research in the U.S. Department of Housingand Urban Development. John MOrrall designed the st~dy, supervised thecollection of data, and completed a preliminary analysis while he wasemployed in this office. As a consultant to the Office of ProgramAnalysis and Evaluation, Edgar Olsen provided advice in-the early stagesof the study, supervised the editing of the data, analyzed it further,and had the primary responsibility for writing the final report. Heshould receive all correspondence concerning this paper. Completionof the study was facilitated by funds granted to the Institute forResearch on Poverty, at the University of Wisconsin-Madison, by theDepartment of Health, Education, and Welfare pursuant to the EconomicOpportunity Act of 1964.
ABSTRACT
The purpose of this study is to determine the cost-effectiveness
of various ways of providing housing services for low-income families
through the leased public housing approach, whereby a local housing
authority leases from the private sector and·sublets to tenants for no
more than 25 percent of their adjusted incomes.
The paper compares the cost-effectiveness of programs involving the
leasing of new housing versus those involving existing housing. Our
evidence tends to favor the hypothesis that the former is slightly more
cost-effective than the latter.
Other study findings are (a) that using FHA financing increases the
cost of the leased housing program by about 18 percent, and (b) that
leasing single-family homes costs over 8 percent more than providing
comparable units in a fully-leased apartment building.
The stu~y found no evidence that other policy decisions--such as
particular methods of obtaining units and assigning families; responsi
bility for rent collection and repairs; the number of years a unit
remains. in the program--affect the cost-effectiveness with which housing
services are provided. This suggests that such decisions can be made
without regard to cost-effectiveness.
A COST-EFFECTIVENESS STUDY OF LEASED PUBLIC HOUSING
The purpose of this study is to determine the cost-effectiveness
of various ways of providing housing services for low-income families
through the leased public housing approach. In this apjproacha local~
housing authority (LHA) leases units from the private sector and in turn
sublets them to low-income tenants for not more than 25 percent of their
adjusted incomes.
The leased public housing approach was first made possible by the
1965 amendments to the United States Housing Act of 1937. Before that,
public housing was mainly of the "conventional" type whereby the LHA
purchased sites and supervised planning, construction, and management.
A third type also developed in 1965 is known as the Turnkey I procedure;
it allows the LHA to purchase units proposed, designed, and constructed
by private developers on their own sites. 1
From 1974 through the first quarter of 1976, leased public housing
has been the dominant form of newly provided low-rent public housing;
95 percent of the 385,000 applications received by the Department of
Housing and Urban Development (HUD) for low-rent public housing during
2this period were for leased units. However, just recently the Housing
Authorization Act of 1976 was passed in an attempt to breathe new life
into the old, non-leased, low-rent public housing programs.
Summar~f Results
One of the reasons for the emphasis on the leased-housing approach
in providing housing services for low-income groups was that it was thought
that" the leased-housing approach was more cost-effective than the con-
ventiona1 or turnkey methods. The National Housing Policy Review Task
2
Force calculated in 1973 that it costs $1.03 to produce a dollar's worth
of housing services using the leased approach, $1.23 using the turnkey
3approach, and $1.40 using the conventional approach. The investigators
were unable to provide separate estimates for either newly constructed
(and then leased) or existing leased public housing. Since a major
difference between the three variants compared was that the former made
considerable use of the existing stock while the latter two rely on new
construction, they also concluded that housing services are produced more
efficiently under the leased-existing program than under the leased-new
4program.
The evidence presented in this paper,although generally sup-
porting the magnitude of the cost-effectiveness ratio for leased public
housing reported in tha National Housing Policy Review study, does not
support the hypothesis that the leased-existing program is more cost-ef-
fective than the leased-new program. In fact~ what evidence we did
find tends to favor the opposite hypothesis; i.e., that the leased-new
program is slightly more cost-effective than the leased-existing program.
In addition to examining the differences in cost-effectiveness among
leasing programs--new, existing, and rehab--we also attempted to determine
whether differences in the way these programs have been operated have
affected cost-effectiveness ..Such information would allow policy-makers
to design more efficient programs.
An important finding that corroborates a conclusion of the National
Housing Policy Review study concerns the cost-effectiveness of the Federal
Housing Administration's (FHA) financing programs for the construction
of rental housing. The National Housing Policy Review study found that
it costs from 10 to 20 percent more to construct FHA Section 236 rental
5housing than comparable private units. Our results indicate that using

3
. ..
FHA financing increases the cost of the leased housing program by about
18 percent.
A second important finding is that leasing single-family homes is
cost-ineffective relative to leasing apartments. We estimate that it
costs over eight percent more to provide comparable detached units than
to provide units in an apartment building fully leased by the LHA.
We are much less certa'in about the effects of variation in other
program parameters. Taking into account the directions of possible
bias in our estimates as well as the significance of the coefficients,
we are not able to recommend on cost-effectiveness grounds:
(1) that the LHA rent,any specific percentage of units in a
building;
(2) that the LHA use any particular method of obtaining units
and assigning families to them;
(3) that the LHA either delegate or take responsibility for
collecting rents;
(4) that the LHA either delegate or take responsibility for
maintenance and repairs;
(5) that the years a unit stays in the leased program be limited
or increased;
(6) that counseling of tenants be utilized;
(7) that the LHA emphasize housing for the elderly;
(8) that HUD allocate funds to any particular LHA's.
Although these findings are negative in the sense that we cannot
recommend conclusively any policy actions that would increase the cost-
effectiveness with which housing services are provided, they are useful
in that they suggest that decisions on these matters can be made without

4
worrying about cost-effectiveness. For example, it may be desirable
to limit the percentage of units in a building that an LHA may lease
if this produces a mixing of income groups or maintains the anonymity
of the families receiving subsidies. It may also be a social goal to take
better Care of the elderly than of other low-income groups. Finally,
it is probably good public policy to allow families to find their own
housing rather than being assigned units/given that there is apparently
no cost~effectiveness difference in the two approaches.
The next section details the rather involved process that we used
to estimate the cost-effectiveness of the various ways that leased
public housing is provided in the United States. The last section
discusses our results and their policy implications.
Methods and Data
The definition of cost-effectiveness adopted for this study is the
ratio of the total cost of providing a leased public housing unit to
its market rent. Total cost includes the rent paid to the owner, tenant
paid utilities, and expenses of the LHA attributable to the unit. The
market rent of a unit is the amount that it could be rented for in the
private market. We view market rent as an index of the desirability
of units within a single housing market.
In principle, we would like to have an accurate measure of this
ratio and data on the operation of the program as it pertains to each
of a large number of leased public housing units. For example, is the
unit in a building which was built especially for the program? What
percentage of t~e units in the building are occupied by subsidized
families? Who is responsible for maintenance? This data would be used
to calculate the mean cost-effectiveness ratio for the major variants
)
5
of leased public. housing (Le., new, existing; and rehab) ahd then
to estimate a statistical relationship between this ratio and program
characteristics which would show how the former varies with each of the
latter after taking account of the influence of other program charac
teristics.
In fact, our estimates of the cost-effectiveness ratio are not
completely accurate because (i) we were not able to allocate LHA expenses
(other than rent paid to owners) to individual units exactly and (2)
we had to predict market rents. There are reasons to believe that the
resulting errors in measuring the cost-effectiveness ratio are correlated
with the program characteristics and hence will lead to biased estimates
of the. coefficients in the relationship between the cost-effectiveness
ratio and these characteristics. We responded to this problem in two
ways. First, we included variables in the regression which could be
expected to reduce the biases. Second, we discuss the likely directions
of the biases in our discussion of the results.
We did have the answers to more than a hundred questions for a
sample of 1155 occupants of leased public housing. The interviews and
inspections were conducted by personnel from HUD Area Offices during
June and July of 1974. Table 1 shows the number of leased pUblic housing
units of each type in each city in the original sample. The empirical
results are based on a subset of the original sample because crucial
questions were not answered in many cases. These interviews and in
spections provided us with information on the rent paid to owners~
program characteristics as they pertain to individual units, and charac
teristics of the occupants and their housing. We will now describe
how we used these data to estimate the total cost and market rent of

6
Table 1
Number of Leased Public Housing Units in Original Sample

")
leased public housing units.
Total Cost
The total cost of providing a leased public housing unit is the
sum of the rent paid to the owner, tenant-paid utilities, and the expenses
of the LHA attributable to the unit. We know the former two magnitudes
from the interviews. We do not know the latter, but have used data from
the interviews and each authority's Statement of Operating Receipts
and Expenditures to approximate it. We will discuss these approximations
under three headings:
operating expenses.
(1) utilities, (2) maintenance, and (3) other
Utilities. From the interview, we learned which utilities were included
in rent. If a utility was not included, then either it was not used
or the tenant paid for it. In these cases, we could exactly account
for the cost of the utility because this information was obtained during
the interview. If the utility was included in rent, then either the
landlord pays the bill, in which case the rent that he receives from the
LHA accounts for this part of the total 'cost, or the LHA pays it directly.
In the latter case, something should be added to the rent received by
the owner and tenant-paid utilities to get total cost. Unfortunately,
we failed to learn which of the two possibilities prevailed for the
individual units in our samp~e.Therefore, we allocated to each unit
which had a utility included in rent an equal share of the total LHA
expenses for that utility. On this account, total cost will be overes-
timated in cases where the landlord paid for the utility and underes-
timated on average if the LHA paid.
~laintenance. We also learned from the inverview who maintained

8
the unit. If the landlord made the repairs, then their cost is included
in the rent that he received. If the LHA made the repairs and billed
the owner, then the rent paid to the owner accounts for the cost of
maintenance. If the LHA made and paid for repairs, then the cost should
be added to other costs in calculating the total. Unfortunately, we
failed to learn who paid for the maintenance of the individual units
in cases where the LHA made the repairs. Therefore, we allocate to each
unit maintained by the LHA an equal share of LHA expenses for ordinary
maintanance and operation.
Other Operating Expenses. All units were allocated an equal share
of other LHA operating expenses. We attempted to improve upon this
al1'oca~ion by assuming that such expenses per unit per month in real
terms depend only on program type. With this assumption, the per-unit
expenses of each program type can be estimated by regressing other operating
expenses per unit in real terms in the nine cities on the proportion
of units of any two of the three types. The results imply that the
other operating expenses of existing and new are virtually identical
and are about 46 percent less than that of rehab. However, the R-squared
and t-scores were so small that we abandoned this approach.
Market Rents
Since leased public housing units are not rented in the private
market, we must predict their market rents. We considered two ways
of making these predictions: (1) hiring appraisers and (2) using es-
timated relationships between rent and housing characteri.stics for units
in the private market. 6 If cost were not a consideration, the second
approach would involve collecting information on the rent and charac-

9
teristics of several hundred unsubsidized dwelling units In each city,··
regressing rent 'on characteristics for each city separately, and substi
tuting the characteristics of each leased public housing unit into the
appropriate estimated relationship in order to predict its market rent.
This approach would be roughly as expensive as using appraisers. In
the interest of economy, we chose a much less costly version of the
7second approach.
First, we used previously collected data to estimate relationships
between the rent and characteristics of unsubsidized housing. Spe
cifically, we used data on 215 dwellings in New Haven collected in the
fall of 1968 by A. Thomas King and Peter Mieszkowski for their study
of racial discrimination. 8 We also used data on 469 units in Phoenix
and 470 in Pittsburgh collected by Abt Associates in the summer of
1973 as a part of the Experimental Housing Allowance Program. The
equations estimated using these data are presented in Tables 2 and
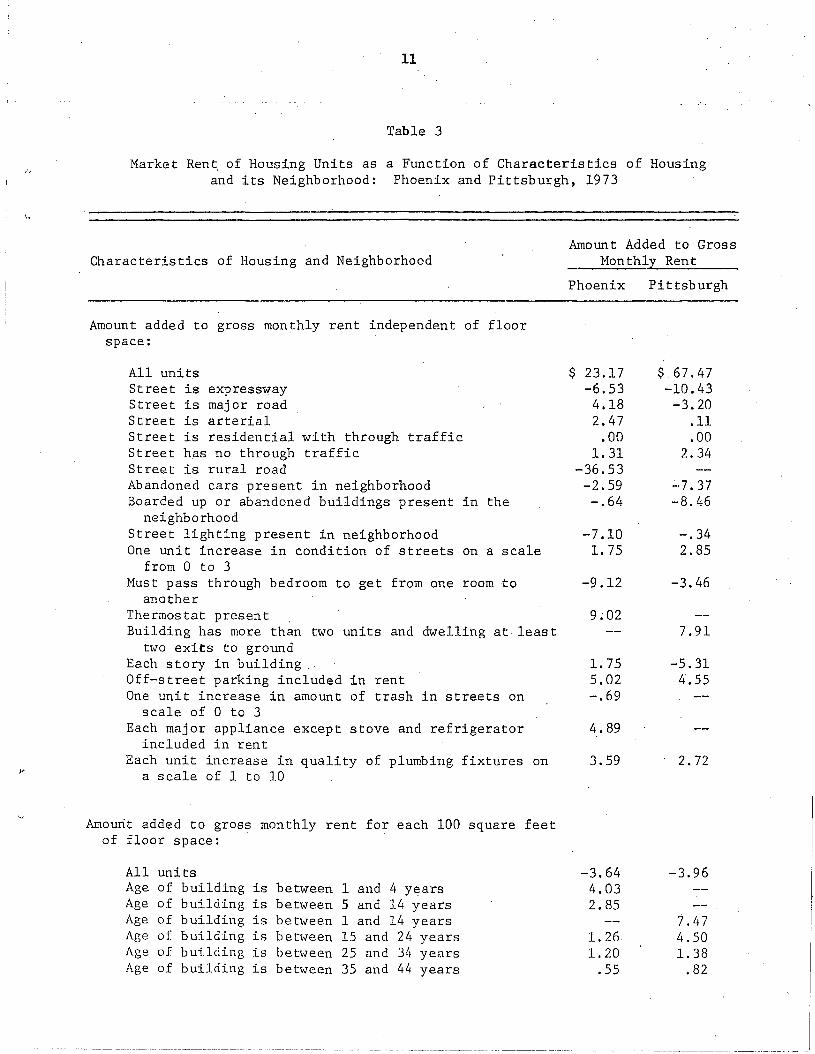
3. Two points are worthy of note. We assumed that the effect of some
characteristics (e.g., quality of plumbing) on rent is independent
of floor space while the effect of others (e.g., quality of floors,
walls, and ceilings) depends on the size of the apartment. Also, in
using these equations to predict the market rents of leased units,
we assumed that the landlord was not a relative because we want market
rent to measure the desirability of the housing and we do not believe
that a landlord will give the government a discount for a subsidized
tenant who is a relative. The only apparent anomaly in the results
is that apartments in areas with street lighting have a lower market
rent. We attribute this to a concentration of lighting in areas with
high crime rates.

10
Table 2
Market Rent of Housing Units as a Function of Characteristicsof the Housing and its Occupants: New Haven, 1968
Characteristics of Housing and Occupants
Amount added to gross monthly rent independent of floor space:
All unitsThermostat presentOne unit increase in quality of plumbing fixtures on a scale
of 1 to 10Each stove or refrigerator included in rentEach other appliance included in rentEach extra feature from among balcony, fireplace, carpeting,
gff~street parktngEach· person per 100 square feet of floor spaceEach 100 square feet of floor space per room
Amount Addedto Gross
Monthly Rent
$45.09lJ064.56
3.528.60
.76
16.75-10.85
Amount added to gross monthly rent for each 100 square feet of floorspace:
All unitsOne unit increase in quality of floors, ceilings, and walls on
a scale of 1 to 10Each electrical outlet per roomFurniture included in rentFamily has lived in city for less than two yearsLandlord lives in building or immediate neighborhoodLandlord is relativeHead of household is femaleHead of household is black
3.84.22
.331.091.06-.83
-1. 71.48.95
Note: Prior to estimating these parameters, all variables were divided by floorspace measured in hundreds of square feet. In this sample of 215 h~using
. units, the explanatory variables accounted for 70 percent of the. variancein gross monthly rent per 100 square feet of floor space.
11
Table 3
Market Rent of Housing Units as a Function of Characteristics of Housingand its Neighborhood: Phoenix and Pittsburgh, 1973
Characteristics of Housing and NeighborhoodAmount Added to Gross
Monthly Rent
$ 23.17 $ 67.47-6.53 -10.434.18 -3.202.47 .11
.00 .001. 31 2.34
-36.53-2.59 ~·7. 37
in the -.64 -8.46
-7.10 -.34on a scale 1. 75 2.85
room to -9.12 -3.46
9;02
1. 755.02-.69
4.89
on 3.59J>
Amount added to gross monthly rent independent of floorspace:
All unitsStreet is expresswayStreet is major roadStreet is arterialStreet is residential with through trafficStreet has no through trafficStreet is rural roadAbandoned cars present in neighborhoodBoarded up or abandoned buildings present
neighborhoodStreet lighting present in neighborhoodOne unit increase in condition of streets
from 0 to 3Must pass through bedroom to get from one
anotherThermostat presentBuilding has more than two units and dwelling at least
two exits to groundEach story in buildingOff-street parking included in rentOne unit increase in amount of trash in streets on
scale of 0 to 3Each major appliance except stove and refrigerator
included in rentEach unit increase in quality of plumbing fixtures
a scale of 1 to 10
Phoenix Pittsburgh
7.91
-5.314.55
2.72
Amount added to gross monthly rent for each 100 square feetof floor space:
All units -3.64 -3.96Age of building is between I and 4 years 4.03Age of building is between 5 and 14 years 2.85Age of building is be t~veen 1 and 14 years 7.47Age of building is between 15 and 24 years 1. 26 4.50Age of building is between 25 and 311 years 1. 20 1. 38Age of building is bet~veen 35 and 411 years .55 .82

12
Table 3 (cant.)
Characteristics of Housing and NeighborhoodAmount Added to Gross
Monthly Rent
Age of building is between 45 and 54 yearsAge of building is more than 54 yearsOne unit increase in quality of floors, ceilings, and
walls on a scale of 1 to 10Landlord lives in building or immediate neighborhoodLandlord is relativeFurniture included in rentEach electrical outletBuilding has more than two unitsEach room
Coefficient of determination
Number of observations
Phoenix
$ .00.00.75
.03-4.04
2.30
1.121.38
.69
469
Pittsburgh
$ .59.00.50
-.56-1. 91
1.03.19
1..29.49
.53
470
.13
.These equations are appropriate for predicting the market rents .
of leased public housing in New Haven in 1968 and Phoenix and Pittsburgh
in 1973. However, we wish to predict the market rents of units in two
of these cities and others in 1974. For this purpose, we needed cross
sectional and time-ser~es indices of housing prices. The U.S. Bureau
of Labor Statistics (BLS) produces such indices, but not for New Haven,
Phoenix, and the cities in North Dakota. Furthermore, the BLS indices
have several known biases. Although the same units are priced over time,
the average quality of these units probably has been declining and,
hence, the rate of inflation in housing prices is probably understated.
Cross-sectionally the characteristics used to define identical housing
are fa~ from exhaustive. units which are identi~al with respect to these
characteristics are likely to be better in other respects in areas with
higher-income families. As a result, BLS indices probably overstate
housing prices in high-income areas relative to low-income areas.
The second part of our strategy for predicting the market rents
of leased public housing units was to produce our own indices of housing
prices which would allow us to use each equation to make predictions
in all cities. To produce these indices, we asked the personnel in HUD
Area Offices to collect data on the rent and characteristics of a small
sample of unsubsidized housing units. We had hoped for 50 units in each
city.
The way that we used these data to produce housing price indices is
best explained with an example. Suppose that we wanted an index to show
the difference in the price of identical housing between New Haven in
1968 and Chicago in 1974 and we wanted the index to have a value of one
if there were no difference. We would substitute the characteristics of
14
each unsubsidized unit in Chicago in 1974 into the New Haven equation
thus predicting how much these units would have rented for in New Haven
in 1968. Our index is the ratio of the mean of the actual rents of these
units in Chicago in 1974 to the mean of the predictions of what they would
have rented for in New Haven in 1968. Unfortunately, we were not able
to obtain data on unsubsidized units in all cities and we could not use
all of the data collected because crucial questions were not answered
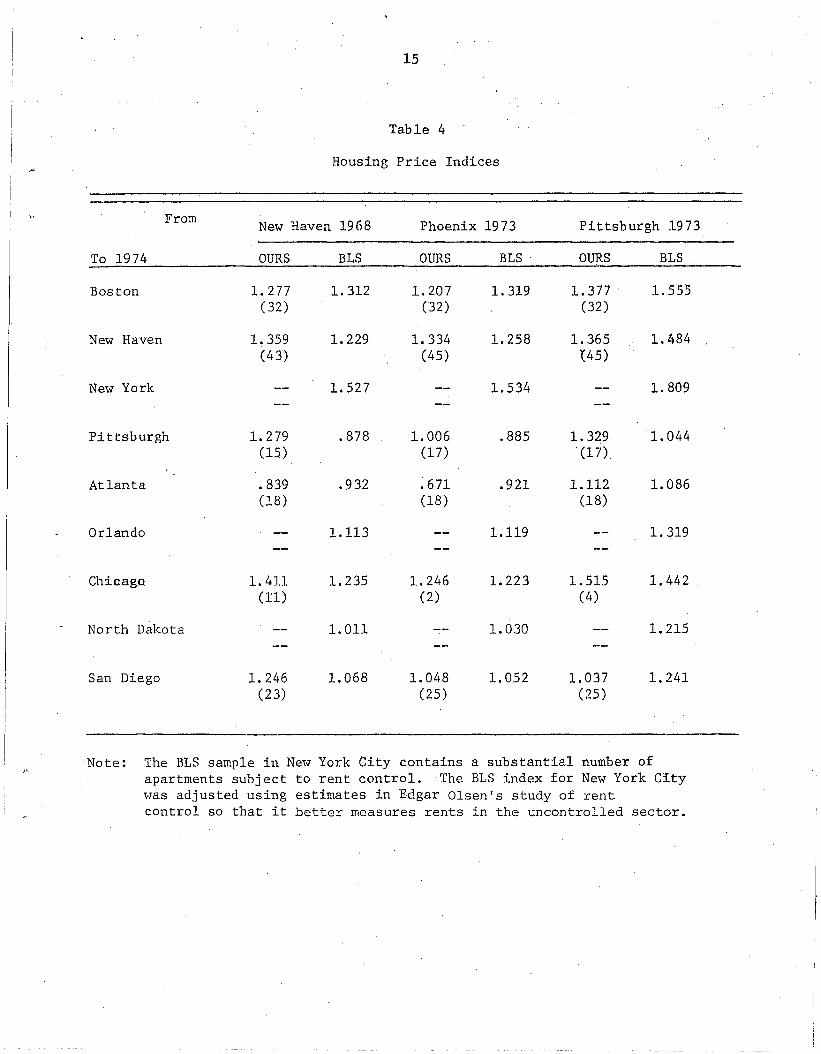
in some cases. Our housing price indices along with the BLS indices
are presented in Table 4. The numbers in parentheses are the numbers
of observations on unsubsidized units on which our indices are based.
The BLS indices involving New Haven, Phoenix, and the cities in North
Dakota are based on, the assumptions that housing prices are the same
in New Haven and Hartford, Phoenix and San Diego, and the cities in
North Dakota and the average of nonmetropolitan north-central cities,
respectively.
To show how the numbers in this table are used, we continue with
the preceding example. Suppose that we want to predict the market
rent of a leased public housing unit in Chicago in 1974 using the New
Haven equation. We substitute the characteristics of this unit into
the New Haven equation to predict how much this unit would have rented
for in New Haven in 1968 and then, to convert to 1974 Chicago prices,
we multiply by either 1.411, our index, or 1.235, the BLS index.
This leads to the question of which index we chose in cases where
we had a choice. In fact, we used four alternative sets of indices:
(1) OURS where available, BLS otherwise; (2) OURS where based on more
than 20 observations, BLS otherwise; (3) Means of OURS and BLS; and
(4) BLS alone. The results relevant to pOlicy making are insensitive
/'
15
Table 4
Housing Price Indices
From New Haven 1968 Phoenix 1973 Pittsburgh 1973
To 1974 OURS BLS OURS BLS OURS BLS
Boston 1.277 1. 312 1. 207 1.319 1.377 1. 555(32) (32) (32)
New Haven 1.359 1. 229 1. 334 1. 258 1. 365 1.484(43) (45) ~45)
New York 1. 527 1.534 1. 809
Pittsburgh 1. 279 .878 1. 006 .885 1.329 1. 044(15) (17) (l7).
Atlanta .839 .932 ;671 .921 1.112 1.086(18) (18) (18)
Orlando 1.113 1.119 1.319
Chicago 1.411 1. 235 1.246 1.223 1.515 1.442(11) (2) (4)
North Dakota 1. 011 1.030 1. 215
San Diego 1.246 1.068 1.048 1. 052 1.037 1.241(23) (25) (25)
Note: The BLS sample in New York City contains a substantial number ofapartments subject to rent control. The BLS index for New York CityvTas adjusted using estimates in Edgar Olsen's study of rentcontrol so that it better measures rents in the uncontrolled sector.
16
to this choice and those reported are based on the first set of indices.
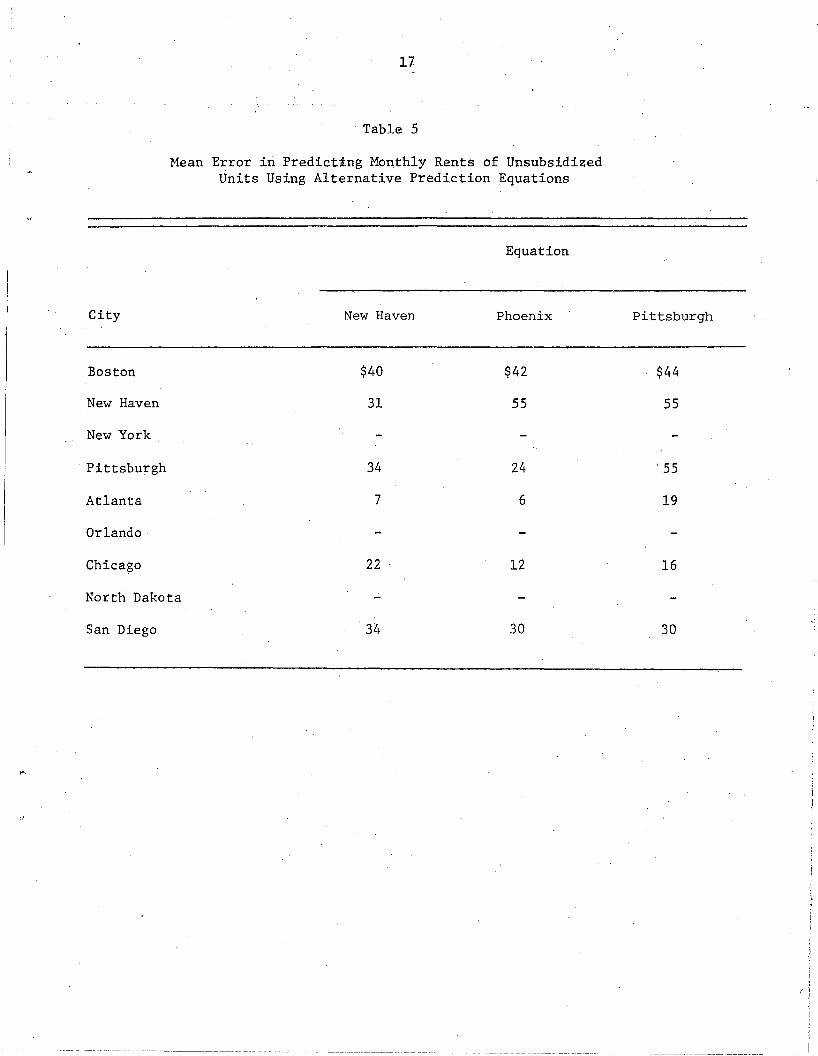
Finally, we had to decide which equation to use to make predictions
in each city. In the cases of cities for which we had data on unsub
sidized units, we chose the equation which when multiplied by the price
index best predicted the actual rents of unsubsidized units. The New
Haven equation is the best predictor of market rents for our sample
of unsubsidized units in Boston and New Haven; the Phoenix equation
for units in Pittsburgh (an outcome that we cannot explain), Atlanta,
Chicago, and San Diego. Based on these results, it seemed best to use
the New Haven equation for New York and the Phoenix equation for Orlando
and cities in North Dakota. The mean prediction error of each equation
in each city is presented in Table 5.
Empirical Results and Policy Implications
Since it is possible to reallocate funds among the variants of
leased public housing, it is desirable to know the cost-effectiveness
of these variants. The first part of this section is devoted to this
issue. Within each variant of leased public housing, there are many
ways of operating the program. The second part of this section presents
results concerning how cost-effectiveness varies with parameters which
can be controlled by HUD or the LHA.
Differences in Cost-Effectiveness by Program Type
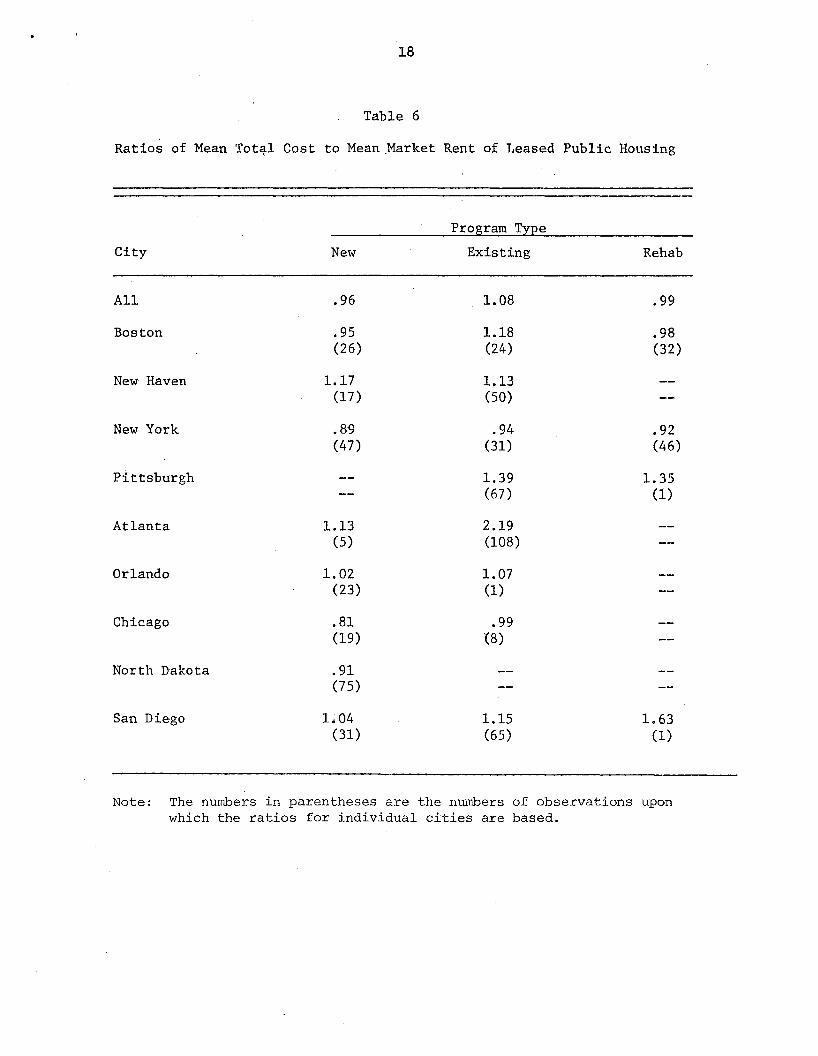
Table 6 presents the cost-effectiveness measures for all cities
combined and for each city separately. This table is based on only
698 of the 1155 units in our original sample because the information
needed to estimate total cost and predict market rent was not reported
in many cases. In estimating the ratios for all cities combined, the
17
. Table 5
Mean Error in Predicting Monthly Rents of UnsubsidizedUnits Using Alternative Prediction Equations
Equation
City New Haven Phoenix Pittsburgh
..J
Boston $40 $42 $44
New Haven 31 55 55
New York
Pittsburgh 34 24 ' 55
Atlanta 7 6 19
Orlando
Chica~o 22 12 16
North Dakota
San Diego 34 30 30
18
Table 6
Ratios of Mean Tot~l Cost to Mean.Market Rent of Leased Public Housing
Program Type
City New Existing Rehab
All .96 1.08 .99
Boston .95 1.18 .98(26) (24) (32)
New· Haven 1.17 1.13(17) (50)
New York .89 .94 .92(47) (31) (46)
Pittsburgh 1.39 1.35(67) (1)
Atlanta 1.13 2.19(5) (108)
Orlando 1.02 1.07(23) (1)
Chicago .81 .99(19) (8)
North Dakota .91(75)
San Diego 1.04 1.15 1. 63(31) (65) (1)
Note: The numbers in parentheses are the numbers of observations uponwhich the ratios for individual cities are based.
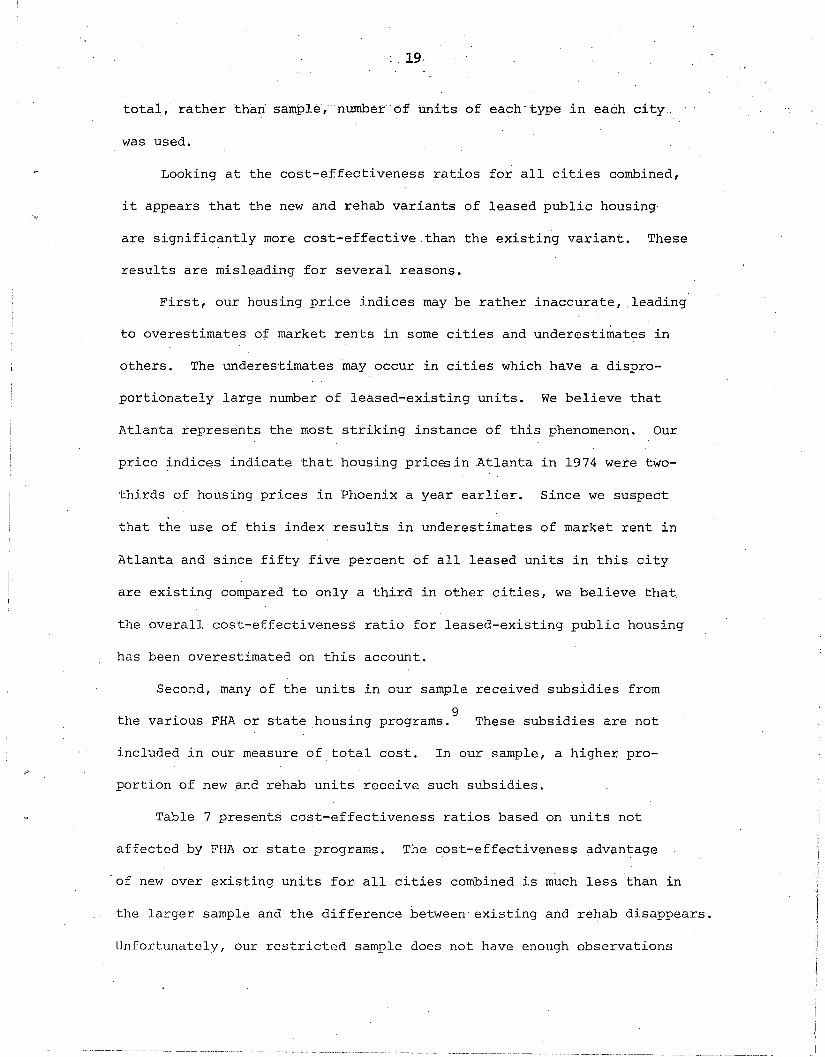
total, rather thi:m- sample,-number of units of each type in each city.
was used.
Looking at the cost-effectiveness ratios for all cities combined,
it appears that the new and rehab variants of leased public housing
are significantly more cost-effective than the existing variant. These
results are misleading for several reasons.
First, our housing price indices may be rather inaccurate, leading
to overestimates of market rents in some cities and underestimates in
others. The underestimates may occur in cities which have a dispro-
portionately large number of leased-existing units. We believe that
Atlanta represents the most striklng instance of this phenomenon. Our
price ~ndices indicate that housing prices in .Atlanta in 1974 were two-
thirds of housing prices in Phoenix a year earlier. Since we suspect
that the use of this index results in underestimates of market rent in
Atlanta and since fifty five percent of all leased units in this city
are existing compared to only a third in other cities, we believe that
the overall cost-effectiveness ratio for leased-existing public housing
has been overestimated on this account.
Second, many of the units in our sample received subsldies from
9the various FHA or state housing programs. These subsidies are not
included in our measure of total cost. In our sample, a higher pro-
portion of new and rehab units receive such subsidies.
Table 7 presents cost-effectiveness ratios based on units not
affected by FHA or state programs. The cost-effectiveness advantage
of new over existing units for all cities combined is much less than in
the larger sample and the difference between existing and rehab disappears.
Unfortunately, our restricted sample does not have enough observations
i)
I

20
Table 7
Ratios of Mean Total Cost to Mean Market Rent of Leased Public HousingExcluding Units Under FHA or State Programs
P'rogram TypeCity
New Existing Rehab
All 1.02 1.06 1.06
Boston 1.18 1.08(24) (8)
New Haven 1.17 1.12(17) (43)
New. York 1.02 .93 .96(2) (29) (lg)
Pittsburgh 1.34 1.35(57) (1)
At1ant.a 2.13(43
Orland;o 1.02 1.07(23.) (1)
Chicag.o .86 .95 1.01(2) (7) (9)
North Dakota .91(74)
San Diego 1.05 1.15 1.63(30) (65 (1)
Note: The numbers in parentheses are the numbers of observationsupon which the ratios for individual cities are based.
21
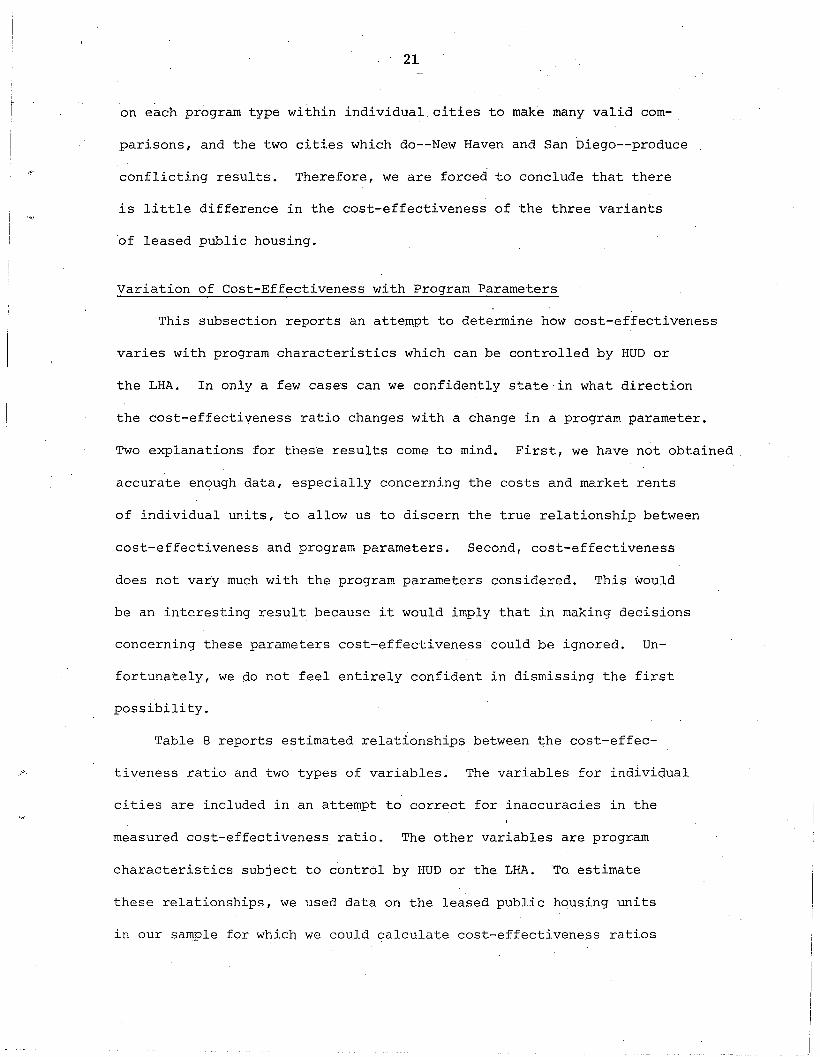
on each program type within individual cities to make many valid com
parisons, and the two cities which do--New Haven and San Diego--produce
conflicting results. Therefore, we are forced to conclude that there
is little difference in the cost-effectiveness of the three variants
of leased public housing.
Variation of Cost-Effectiveness with Program Parameters
This subsection reports an attempt to determine how cost-effectiveness
varies with program characteristics which can be controlled by HUD or
the LHA. In only a few case's can we confidently state' in what direction
the cost-effectiveness ratio changes with a change in a program parameter.
Two explanations for these results come to mind. First, we have not obtained
accurate en9ugh data, especially concerning the costs and market rents
of individual units, to allow us to discern the true relationship between
cost-effectiveness and program parameters. Second, cost-effectiveness
does not vary much with the program parameters considered. This would
be an interesting result because it would imply that in making decisions
concerning these parameters cost-effectiveness could be ignored. Un
fortunately, we 00 not feel entirely confident in dismissing the first
possibili ty.
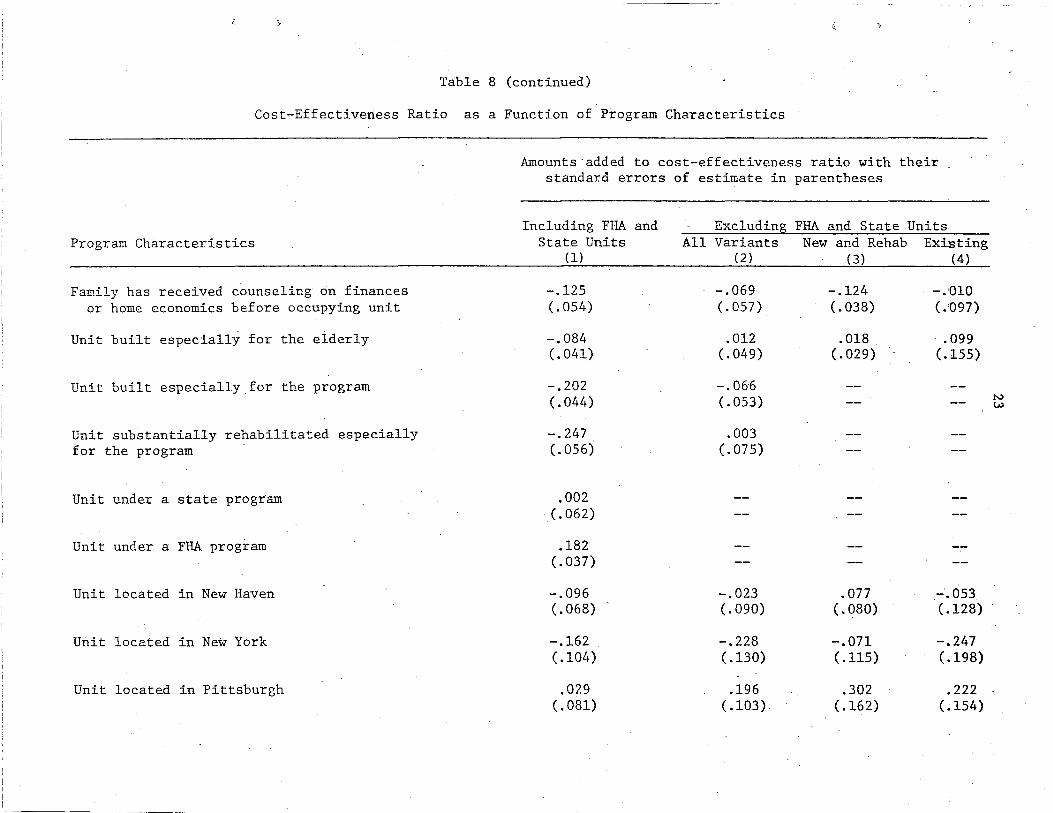
Table 8 reports estimated relationships between the cost-effec
tiveness ratio and two types of variables. The variables for individual
cities are included in an attempt to correct for inaccuracies in the
measured cost-effectiveness ratio. The other variables are program
characteristics subject to control by HUD or the LHA.To estimate
these relationships, we used data on the leased public housing units
in our sample for which we could calculate cost-effectiveness ratios

Table 8
Cost-Effectiveness Ratio as a Function of Program Characteristics.-.._ ........
Amounts'added to' cost-effectiveness ratio with theirstandard errors of estimate in parentheses
Program CharacteristicsIncluding FHA and
State Bnits(1J'.
Excluding FHA and State UnitsAll Variants New and Rehab Existing
(2) (3) (4)
All Units
Each ten unit increase in percentage ofunits leased by LHA in multiple dwelling
Unit is single family house
Family was living in unit before LHAleased it
Family found unit and called it toattention of LHA
Family found unit by other meansexcluding also LHA assignment
Family pays its portion of rentto landlord
Landlord makes repairs
Each year unit has been leased underSection 23 program
.,.1.001
.041(.006)
.337(.070)
.035(.050}
-.033(.047)
-.055(.052)
.055(.090)
-.140(.040)
.025(.00'7)
1.116
.005(.009)
.130(.09l)
.009(.057)
.025(.058)
-.076(.075)
.024( .107)
.018(.044)
-.001(.008)
1.143
.000(.009)
.160(.096)
-.003(.063)
-.048(.061)
-.015(.048)
-.013(.097)
-.051(.037)
-.007(.006)
1.084
.003(.013)
.102(.133)""
"'"-.000(.081)
.043(.085)
-.089(.140)
.014(.159)
.055(.069)
.004(.014)
y
Table 8 (continued)
Cost-Effectiveness Ratio as a Function of Program Characteristics
~
Amounts·added to cost-effectiveness ratio with theirstandard errors of estimate in parentheses
Including FHA and Excluding FHA and State UnitsProgram Characteristics State Units All Variants New and Rehab Existing
(1) (2) (3) (4)
Family has received counseling on finances -.125 -.069 -.124 -.010or home economics before occupying unit (.054) (.057) (.038) ( .097)
Unit built especially for the elderly -.084 .012 .018 .099(.041) (.049) (.029) (.155)
Unit built especially for the program -.202 ~.066
(.044) (.053) -- -- NW
Unit substantially rehabilitated especially -.247 .003for the program (.056) (.075)
Unit under a state program .002(.062)
Unit under a FHA program .182(.037)
Unit located in New Haven -.096 -.023 .077 -.053(.068) (.090) (.080) (.128)
Unit located in New York -.162 -.228 -.071 -.247(.104 ) ( .130) (.115) ( .198)
Unit located in Pittsburgh .029 .196 .302 .222(.081) (.103) (.162) (.154)

Table 8 (continue.a.»
Cost-Effectiveness Ratio as a Function ~off'Progratn ·Charac.teristics
Amountsmrldedto.cost-effectiveness ratio with theirstand-73.i:'derrorsof estimate in parentheses
Program CharacteristicsIncludI~FHA and
State. IDnits(1)
Excluding FHA and State UnitsAll Variance New 'and Rehab Existing
(2) (3) (4)
Unit located in Atlanta
Ur-it located in Orlando
Unit located in Chicago
Unit located in North Dakota
Unit located in San Diego
Coefficient of determination
Number of cases
.762 1.065(. 07~6» ( .108)
-.260 -.087 -.103'(..10Q\) (.122) (.083)
-.137 -.152 -.174(.081) (.115) (.109)
-.289 -.188 -.206( •.091) (.112) (.082.)
-.136 .022 .. 038:(.070) (.092) (.074)
.75 .64 .41
6'64 '441 176
1.082(.159)
-.059(.387)
-.151I\J
(.175) .j::-
.049
.138
.59
265
and for which the. values of all explanatory variables were reported..
An estimated relationship based on all such cases is reported in
the first column. Since the standard errors of estimate of many of its
coefficients are small relative to the estimates of the coefficients,
it appears that we can be confident concerning how cost-effectiveness
varies with program parameters. Furthermore, many estimated coefficients
are large, suggesting that how the program is operated makes a considerable
difference. For example, it appears that it will cost about 33¢ (100 x 8 x
.041) more for each dollar of housing services if the LHA rents all
of the units in a building rather than only twenty percent of these
units.
We believe that neither of these general conclusions is really
supported by our data. About a third of the units underlying the
estimated relationship in column 1 received subsidies under FHA or state
housing programs. We do not know the magnitude of these subsidies
and hence could not include them in the' cost. Therefore, the cost-ef
fectiveness ratio is underestimated in these cases. If the ratio of this
additional cost to market rent were the same for all FHA units, then
the inclusion of a qummy variable indicating whether the unit is under
an FHA program would compensate for this measurement error. Similarly
for units under state programs. Unfortunately, there are many different
FHA and state programs, and even under one such program there is no reason
to expect this ratio to be the same for all units. Since these programs
may differ greatly in terms of the average values of the program
parameters and the ratio of additional subsidy to market rent, the errors
in measuring the cost-effectiveness ratio may be correlated with the
program parumeters, leading to large biases in estimating the effect
·-------·----------------- 1

· 26
of these parameters on cost-effectiveness. For this reason, we believe
that our most reliable results are obtained by excluding units under
FHA and state programs. These results are reported in columns 2 through
4. The great differences between the coefficients in column I and 2
are consistent with the preceding argument.
Before discussing the results in column 2, we note an important
result from the first estimated relationship. Even without adding the
FHA subsidy, it appears to cost on average 18¢ more to provide a dollar's
worth of housing services in FHA projects. That is, LHA's appear to pay
significantly more for illlits in such projects than for comparable units
that receive no other subsidies. Since the standard error of estimate of
this coefficient is'> small relative to the estimate of the coefficient,
this result provides strong evidence in support of the hypothesis that
housing services are inefficiently produced under FHA programs such as
Section 236 and Section 22l(d) (3) which sUbsidize the housing of low-
income families.
We will now discuss our estimates of the effects of program para
meters on cost-effectiveness, based on units not in FHA or state projects.
The numerical results mentioned in the discussion are taken from column
2. We attach little significance to the differences between the coefficients
in columns 3 and 4 because they are small relative to their standard
errors and we have no strong reason to expect differences having par-
ticula.r signs.
Percentage of units Leased by LHA in Multiple Dwelling. We had
thought that, if the LHA rents only a few of the apartments in a building,
it would be unlikely to pay more for an apartment than unsubsidized families
in the building pay for similar apartments. These rents are determined
27
by market forces.· If the LHA rents all apartments in a building, this
indirect discipline of the market is removed. Therefore, we expected
the cost-effectiveness ratio to be higher for units in buildings with
a high percentage of units leased by the LHA. The results are consistent
with this expectation. They suggest that it will cost 4 cents more for
each dollar of housing services if the LHA rents all of the units in
a building rather than only twenty percent of these units. This result
mu?t be qualified in two ways. First, it seems reasonable to believe that
LHA administrative cost will be less if c;;. given number of units are located
in a smaller number of buildings. If this is the case, then we have
overestimated total cost for apartments in buildings with a high per
centag~ of units leased by the LHA because we allocated administrative
cost equally over all leased units in each city. As a result, we have
probably overestimated the coefficient of this variable. Second, the
standard error of estimate of this coefficient is so large that we cannot
confidently rule out the possibility that the true cost-effectiveness
ratio varies inversely with the percentage of units leased by the LHA.
We conclude that cost-effectiveness provides no strong argument either
for or against limiting the percentage of units that an LHA may lease
in a building.
Single Family. Reasoning similar to that concerning the preceding
variable led us to expect the renting of single family houses to be as
cost-effective as renting all of the units in a multiple dwelling. The
results suggest that it costs 8 cents [100(.130 - 10 x .005)] more for
.each dollar of housing services to rent a single family house rather than
an apartment in a building where all of the units are rented by theLHA.
Since we presume that it is more expensive to administer a leased public
--------------------------------------------- ~-------
'28
housing program with N single family dwellings than with N apartments
located in fewer than N buildings and since our estimated cost-effectiveness
ratio was calculated on the assumption that the administrative, cost is
the same for all units in a city, we haVe overestimated the cost-ef
fectiveness of single family units on this account. Given this bias,
we are moderately confident that i,t is more cost-effective to rent an
apartment in a building with few subsidized units than to rent a single
family house.
Method~ of Obtaining Units.. and Assigning Families. Typically,
local hQusing authorities rent units and assign families t6 them. The
next three variables represent other methods of obtaining units for the
program. Sam~ P~6P~~ have argued that it is more cost-effective to let
eligible families find their own apartments subject to a constraint on
rent because the family would have more of an incentive than an LHA
employee to find the best available unit renting for less than the maximum.
Others have argued that the LHA employee would do better because he
has superior bargaining ability and knowledge of the market. The coef
ficients reported in Table 8 show the cost-effectiveness of three al
ternatives compared with the typical method (i.e., the LHA finding
and assigning families to a unit).
If the family was living in the unit before the LHA leased it
or found the unit and called it to the attention of the LIm, we presume
that the LHA incurs slightly less cost in searching for the unit. Hence,
we believe that these estimated coefficients are probably too large.
Since their standard errors of estimate are large, we conclude that
there is no difference between the cost-effectiveness of these approaches
to obtaining units and assigning families and the cost-effectiveness

\!::I
29.
of the typical approach. If this is true, then there is a good case for
allowing families to find their own units. Apartments with th~ same
market rent differ greatly with respect to their characteristics. For
this reason, a family will not be indifferent among all units with the
same market rent. Under a finders-keepers policy, a family eligible for
leased public housing can choose from among all vacant units in a certain
rent range and will usually be better off and never be worse off than
if it is arbitrarily' assigned to one of these units.
In some cases, welfare and urban renewal agencies find apartments
for families eligible for leased public housing. These are the principal
other means referred to in Table 8. Since the cost incurred by these
agenci.es is not included in our measure of total cost,' our results
probably make this method appear more cost-effective than it is. Since
the standard error is large, we cannot be confident that this method is
more cost-effective than the typical method and, in any event, HUD and
the LHA can do little to stimulate its use.
Responsibility for Collecting Rent.. In some cases the landlord
is responsible for collecting rent from the tenant. In other cases the
LHA collects rent from the tenant and pays the full rent to his landlord.
Landlords undoubtedly charge a greater total rent in the former case because
greater effort is required of them, and we know this amount. The LHA
undoubtedly incurs a greater administrative cost on behalf of families
in the latter case. However, we were forced to assume that administrative
cost is the same in both cases. Thus, our results will probably make
landlord collection of the rent appear less cost-effective than it is.
Table 8 indicates that landlord collection of rent is slightly cost
ineffective. However, t.aking account of the bias and the substantial

30'
standard error, W~ conclude that this variable has no perceptible effect
on the cost-effectiveness ratio.
ResPonsib~lity for Maintenance an9 Repairs. In some cases employees
of the LHA make ~epairs on leased public hou$ing units. In other cases
landlords make the repairs.IO
The results in Table 8 suggest that it
costs slightly more for each dollar of housing service if the landlord
makes repairs. However, since the standard error of estimate is so
large, we conclude that maintenance responsibility has no perceptible ~
effect on cost-effectiveness.
Years in the Leased Public Housing Program. It has been conjectured
that after a unit enters the program its owner will allow the unit
t~ deteri©fate mpre~~a~idly than otherwise because he reali4es that a
subsidi~ed family will not move as quiCkly a? an uns~sidized family
in response to the decreased maintenance and that the LHA will not
monitor the condition of the unit as closely as an unsubsidized occupant
would monitor it. As a result, market rent falls over time relative
to the rent received by the owner. The evidence in this study does not
support this hypothesis. The estimated coefficient is essentially zero
and is probably biased upward since it surely costs less to renew a contract
than to initiate a new one.
Counseling. Table 8 suggests that families that receive counseling
on finances or home economics experience a lower ratio of cost to market
rent. Unfortunately, our method of calculating total cost biases the
result in this direction because we spread the entire LHA cost of counseling
evenly over all units in the city. Since LHA expenses on counseling are
not listed separately on the Statement of Operating Receipts and EJcpen
ditures, we cannot do what we did for L~iA maintenance expenses, namely,

31-··
allocate to each family that received counseling an equal share of LHA
expenses on this item. Furthermore, the LHA probably does not provide
all of the counseli~g reported and the cost incurred by other agencies
is not included in our measure of total cost. Due to the direction of
bias and the size of the standard error, we conclude that counseling
does not have an important effect on cost-effectiveness.
units Built for the Elderly. Table 8 indicates that units in
buildings built especially for the elderly are slightly more cost
effective than units in other buildings. In this case, there are perhaps
offsetting biases. On the one hand, such units contain a few special
features which woulq add to true market rent but which are not captured
by our. prediction equations. On the other hand, the elderly may be
regarded as particularly desirable tenants and, in the private market,
pay less than others for identical housing. If so, then we have overes
timated market rent on this account. Since the standard error of estimate
is large, we are inclined to believe that buildings built especially
for the elderly have no particular advantage on cost-effectiveness grounds.
Program Type. The three types of leased public housing differ with
respect to the average values of the preceding variables. The next two
coefficients show the difference in cost-effectiveness of new and rehab
compared to existing on account of all other ways in which these program
types differ. The results suggest that there is essentially no difference
between the cost-effectiveness of the rehab and existing variants attri
butable to ·the combined effect of all of these other differences between
the programs but that new is more cost-effective than existing on these
accounts. Care should be taken in deriving policy implications from the
latter result which may be restated as follows. If a new leased public
-~----~~-- - ---------. ~~~-
32
housing program were operated in the same way as a leased existing
program with respect to all of the preceding variables and both were
operated as at present with respect to all other variables, then new
would cost 6.6 cents less than existing for each dollar's worth of housing
services. However, the standard error of this coefficient is large enough
that there is a non-negligible possibility that existing is more cost
effective than new.
Cities. The remaining coefficients indicate the difference between
the measured cost-effectiveness ratio in Boston and that in the other
eight cities, after taking account of the effects of the other variables.
It is tempting to interpret these coefficients as reflecting differences
in managerial effi~iency. However, we believe that these coefficients
also capture three other influences on the measured cost-effectiveness
ratio. First, the city variables correct for inaccuracies in the price
indices used in predicting market rent. For example, we believe that
the Atlanta coefficient is so large because we have underestimated market
rents in this city. Second, the city variables take account of differences
in administrative cost attributable to differences in the number of
units under each of the variants. Third, the differences may be explained
in part by differences in LHA accounting methods, specifically, the way
that they allocate expenses between the leased and LHA-owned public
housing programs. Since these coefficients capture at least three other
factors, nothing about managerial efficiency alone can be inferred from
their relative magnitudes.

33
Footnotes
1. See Henry Aaron for a good introduction to publicly subsidized
housing.
2. During the first ~art of this period the units were under the Section
23 leased housing program while during the latter part the units
were under the new Section 8 program of the Housing and Community
Development Act of 1974.
3. See U.S. Department of Housing and Urban Development (pp. 126-127).
4. Ibid.
5. Ibid., p. 117.
6. Such relationships are playing an increasingly important role in economic
analyses of government housing .programs. See, for example, the studies
by Edgar Olsen, Michael Murray, and John Kraft and Edgar Olsen.
7. In retrospect, given the amount of money spent on these programs,
this may have been false economy.
8. We are indebted to Tom King for estimating the equation reported in
Table 2.
9. For leases signed prior to November 1973, the LHA's paid "market
rents" for units in Section 236 projects. HUD defines market rent
as the sum of operating· expenses,amortization of that portion of the
mortgage associated with the unit at the FHA ceiling interest rate,
anu the mortgage insurance payment. 'l'herefore, . sample units in such
Footnotes (cont'd) 34
projects received no additional subsidy under the 236 program unless
the FHA interest ceiling was below the market interest rate and the
project received an additional subsidy under the GNMA Tandem Plan.
We are grateful to Joseph Malloy for bringing this matter to our
attention.
10. This discussion concerns who makes the repairs, not who pays for them.

[)
., )
35
References
Aaron, Henry J. Shelter and Subsidies. Washington, D.C.: Brookings
Institution, 1972.
King, A. Thomas, and Mieszkowski, Peter. "Racial Discrimination, Seg-
regation, and the Price of Housing," Journal of Political Economy,
LXXX (May/June 1973), 590-606.
Kraft, John,and Olsen, Edgar O. "The Distribution of Benefits from
Public Housing." In The Distribution of Economic Well-Being,
edited by F. Thomas Juster. New York: Columbia Uniyersity Press,
forthcoming.
Murray, Michael P. "The Distribution of Tenant Benefits in Public Housing."
Econometrica, XLIII ,July 1975, 771-788.
Olsen, Edgar O. "An Econometric Analysis of Rent Control." Journal of
Political Economy, LXXX ,November/December 1972, 1081-1100.
u.s. Department of Housing and Urban Development. Housing in the Seventies:
~ Report of the ~ational Housing Policy Review. Washington, D.C.:
u.s. Government Printing Office, 1974.


