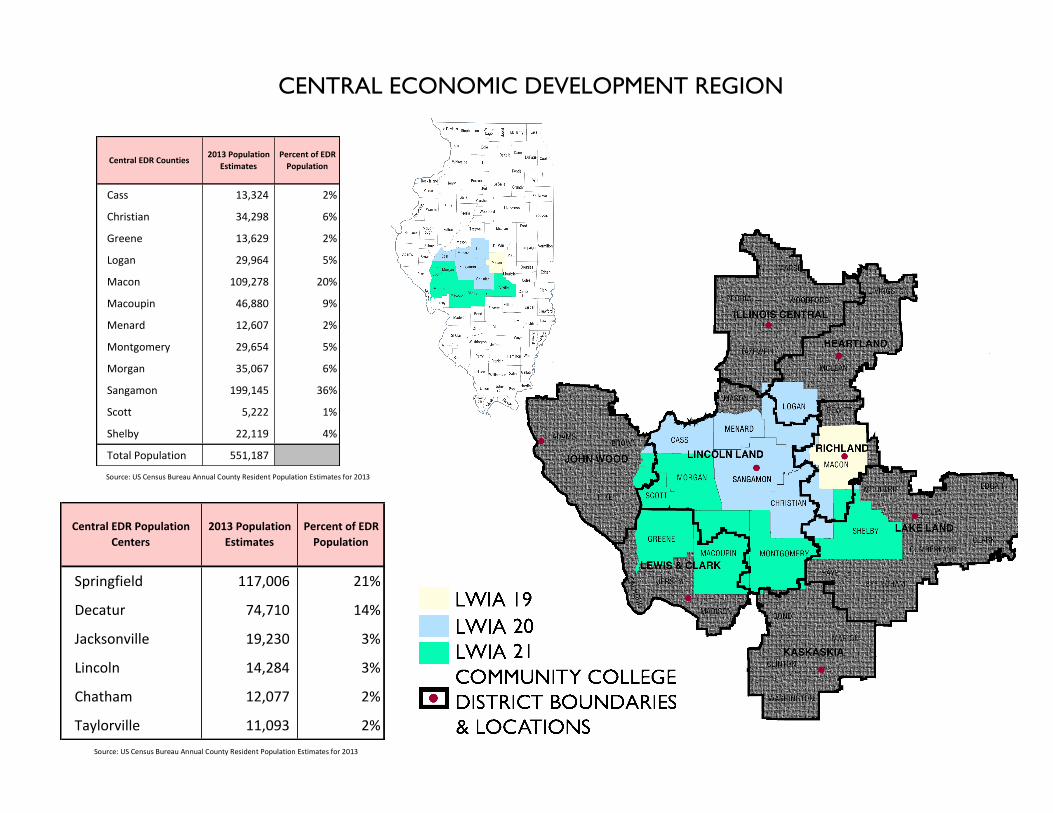
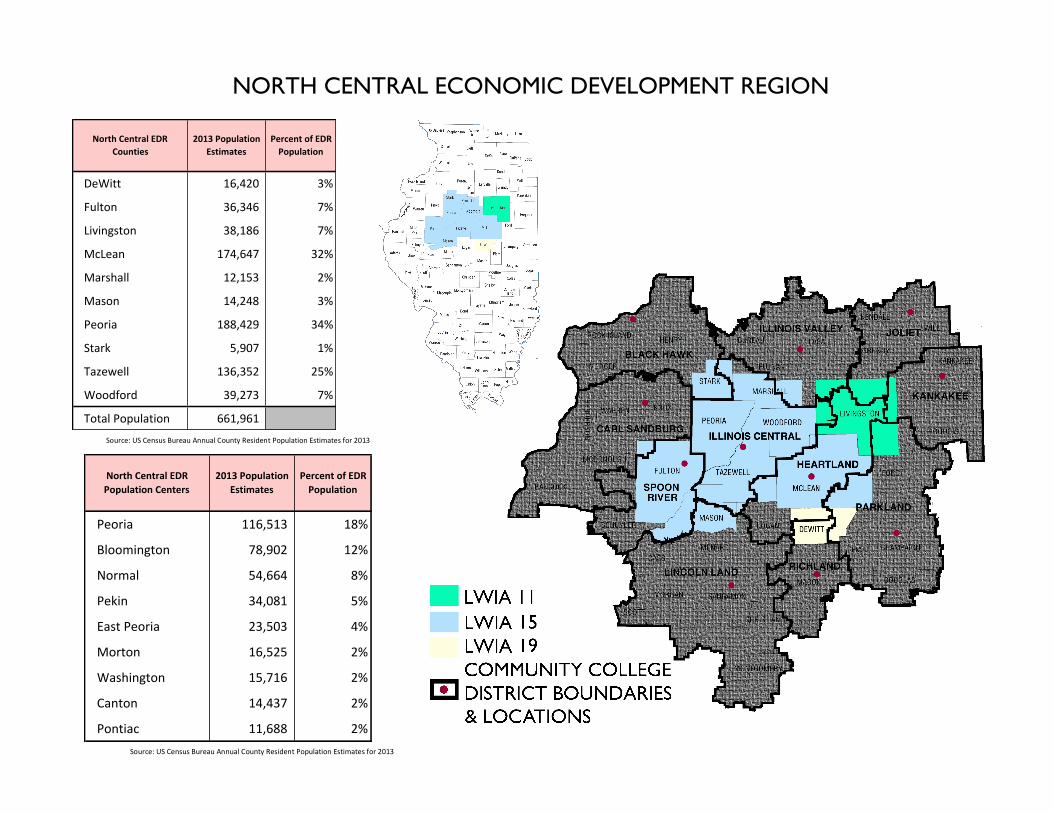
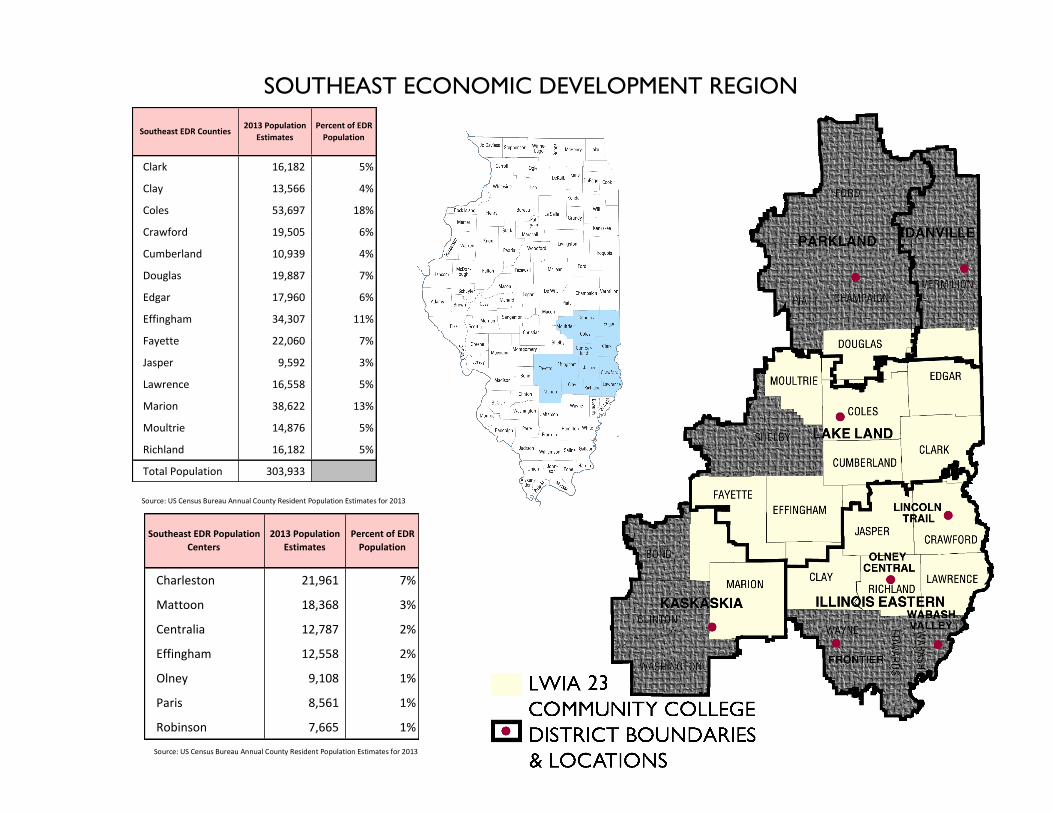
Central EDR Counties 2013 Population Estimates Percent of EDR Population Cass 13,324 2% Christian 34,298 6% Greene 13,629 2% Logan 29,964 5% Macon 109,278 20% Macoupin 46,880 9% Menard 12,607 2% Montgomery 29,654 5% Morgan 35,067 6% Sangamon 199,145 36% Scott 5,222 1% Shelby 22,119 4% Total Population 551,187 Central EDR Population Centers 2013 Population Estimates Percent of EDR Population Springfield 117,006 21% Decatur 74,710 14% Jacksonville 19,230 3% Lincoln 14,284 3% Chatham 12,077 2% Taylorville 11,093 2% CENTRAL ECONOMIC DEVELOPMENT REGION Source: US Census Bureau Annual County Resident Population Estimates for 2013 Source: US Census Bureau Annual County Resident Population Estimates for 2013
Central Economic Development Region - Illinois Community College System Fiscal Year 2014 Summary of Career and Technical Education Degree and Certificate Graduates
Dist. No. College
Associate in Applied Science
Certificates of One Year or
More
Certificates of Less Than One
Year Total 536 Lewis & Clark 320 153 514 987 526 Lincoln Land 239 210 908 1,357 537 Richland 179 155 209 543 Central Total 738 518 1,631 2,887 State Total 11,555 6,876 28,142 46,573 % of State Total 6.4% 7.5% 5.8% 6.2% !
Central Economic Development Region - Illinois Community College System Fiscal Year 2014 Summary of Transfer and General Studies Degree and Certificate Graduates
Dist. No. College
Associate in Arts
Associate in
Science
Associate in Arts and
Science
Associate of Arts in Teaching
Associate in
Engineering Science
Associate in Fine
Arts
Associate in Liberal Studies & General
Ed
Gen Studies
Certificates Total 536 Lewis & Clark 81 300 0 0 7 11 12 0 411 526 Lincoln Land 359 243 0 0 2 1 195 0 800 537 Richland 86 82 0 0 1 0 29 2 200 Central Total 526 625 0 0 10 12 236 2 1,411 State Total 11,569 6,952 642 13 217 131 3,706 9 23,239 % of State Total 4.5% 9.0% 0.0% 0.0% 4.6% 9.2% 6.4% 22.2% 6.1% !
Central Economic Development Region - Illinois Community College System Fiscal Year 2014 Summary of Unduplicated Headcount Enrollment by Program Classification
Dist. No. College
Bacc / Transfer Vocational
Career and Technical Ed. *ABE *ASE *ESL
General Studies
General Associates Total
**Noncredit Total
536 Lewis & Clark 3,266 292 6,158 238 188 35 5 1,143 11,325
3,272 526 Lincoln Land 7,248 1,016 3,050 181 158 304 6 1,534 13,497
2,624 Central Total 12,957 2,708 11,172 548 427 381 176 4,189 32,558
10,531
State Total 287,076 70,776 172,630 27,441 11,382 36,994 2,789 50,624 659,712
187,083 % of State Total 4.5% 3.8% 6.5% 2.0% 3.8% 1.0% 6.3% 8.3% 4.9%
5.6%
*ABE = Adult Basic Education; ASE = Adult Secondary Education; ESL = English-as-a-Second Language. ** Noncredit instruction provides activities that do not meet ICCB Rules for credit courses, such as those designed for specific employers, professional development, or others offered for hobby, leisure, or recreational purposes.
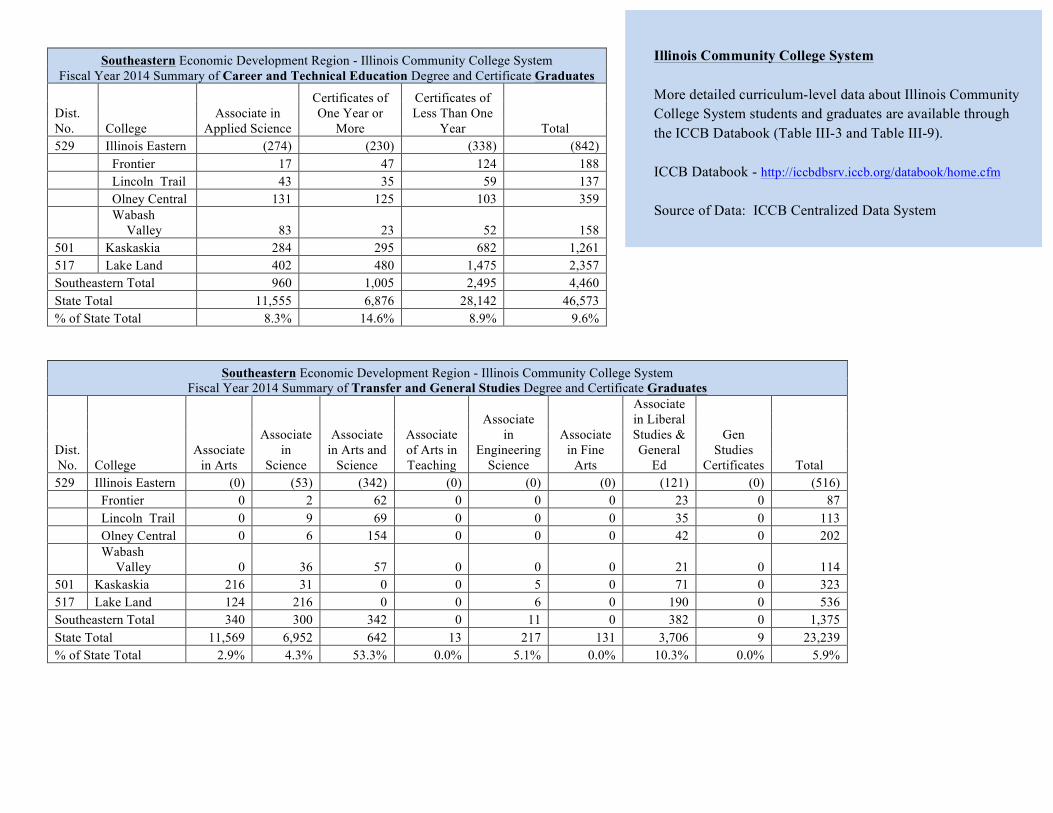
Illinois Community College System More detailed curriculum-level data about Illinois Community College System students and graduates are available through the ICCB Databook (Table III-3 and Table III-9). ICCB Databook - http://iccbdbsrv.iccb.org/databook/home.cfm Source of Data: ICCB Centralized Data System !
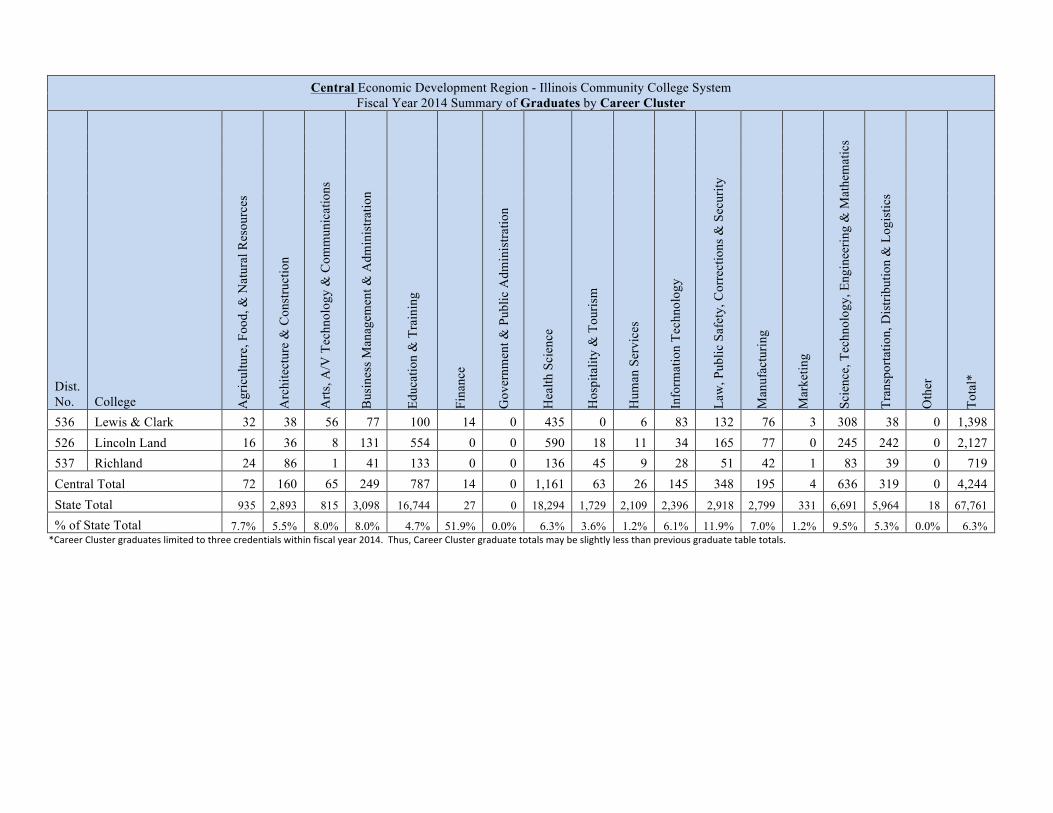
Central Economic Development Region - Illinois Community College System Fiscal Year 2014 Summary of Graduates by Career Cluster
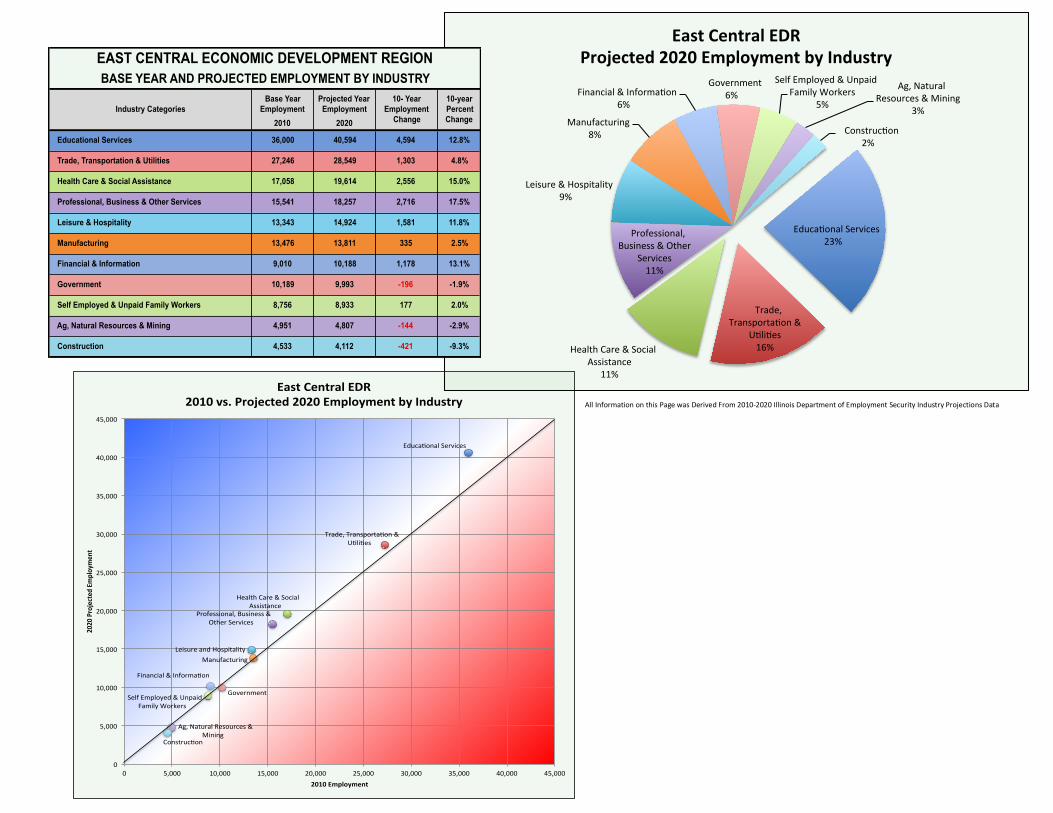
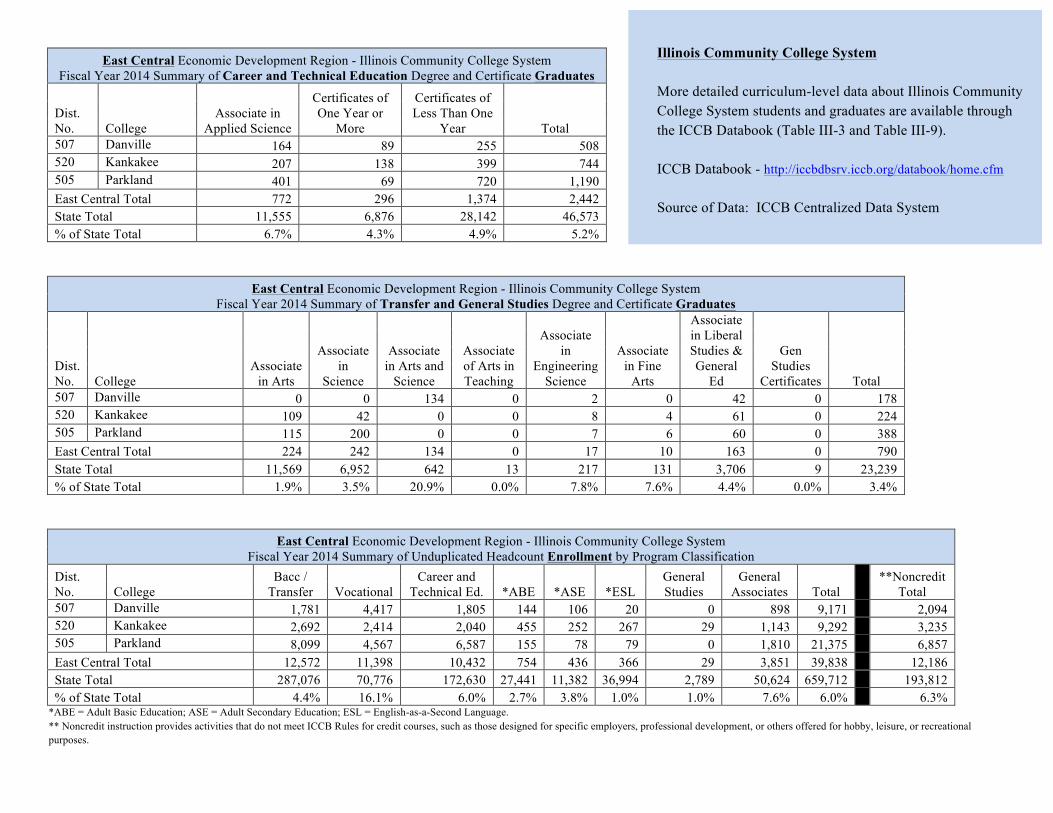
East Central Economic Development Region - Illinois Community College System Fiscal Year 2014 Summary of Career and Technical Education Degree and Certificate Graduates
Dist. No. College
Associate in Applied Science
Certificates of One Year or
More
Certificates of Less Than One
Year Total 507 Danville 164 89 255 508 520 Kankakee 207 138 399 744 505 Parkland 401 69 720 1,190 East Central Total 772 296 1,374 2,442 State Total 11,555 6,876 28,142 46,573 % of State Total 6.7% 4.3% 4.9% 5.2% !
East Central Economic Development Region - Illinois Community College System Fiscal Year 2014 Summary of Transfer and General Studies Degree and Certificate Graduates
Dist. No. College
Associate in Arts
Associate in
Science
Associate in Arts and
Science
Associate of Arts in Teaching
Associate in
Engineering Science
Associate in Fine
Arts
Associate in Liberal Studies & General
Ed
Gen Studies
Certificates Total 507 Danville 0 0 134 0 2 0 42 0 178 520 Kankakee 109 42 0 0 8 4 61 0 224 505 Parkland 115 200 0 0 7 6 60 0 388 East Central Total 224 242 134 0 17 10 163 0 790 State Total 11,569 6,952 642 13 217 131 3,706 9 23,239 % of State Total 1.9% 3.5% 20.9% 0.0% 7.8% 7.6% 4.4% 0.0% 3.4% !
East Central Economic Development Region - Illinois Community College System Fiscal Year 2014 Summary of Unduplicated Headcount Enrollment by Program Classification
6,857 East Central Total 12,572 11,398 10,432 754 436 366 29 3,851 39,838
12,186
State Total 287,076 70,776 172,630 27,441 11,382 36,994 2,789 50,624 659,712
193,812 % of State Total 4.4% 16.1% 6.0% 2.7% 3.8% 1.0% 1.0% 7.6% 6.0%
6.3%
*ABE = Adult Basic Education; ASE = Adult Secondary Education; ESL = English-as-a-Second Language. ** Noncredit instruction provides activities that do not meet ICCB Rules for credit courses, such as those designed for specific employers, professional development, or others offered for hobby, leisure, or recreational purposes.
Illinois Community College System More detailed curriculum-level data about Illinois Community College System students and graduates are available through the ICCB Databook (Table III-3 and Table III-9). ICCB Databook - http://iccbdbsrv.iccb.org/databook/home.cfm Source of Data: ICCB Centralized Data System !
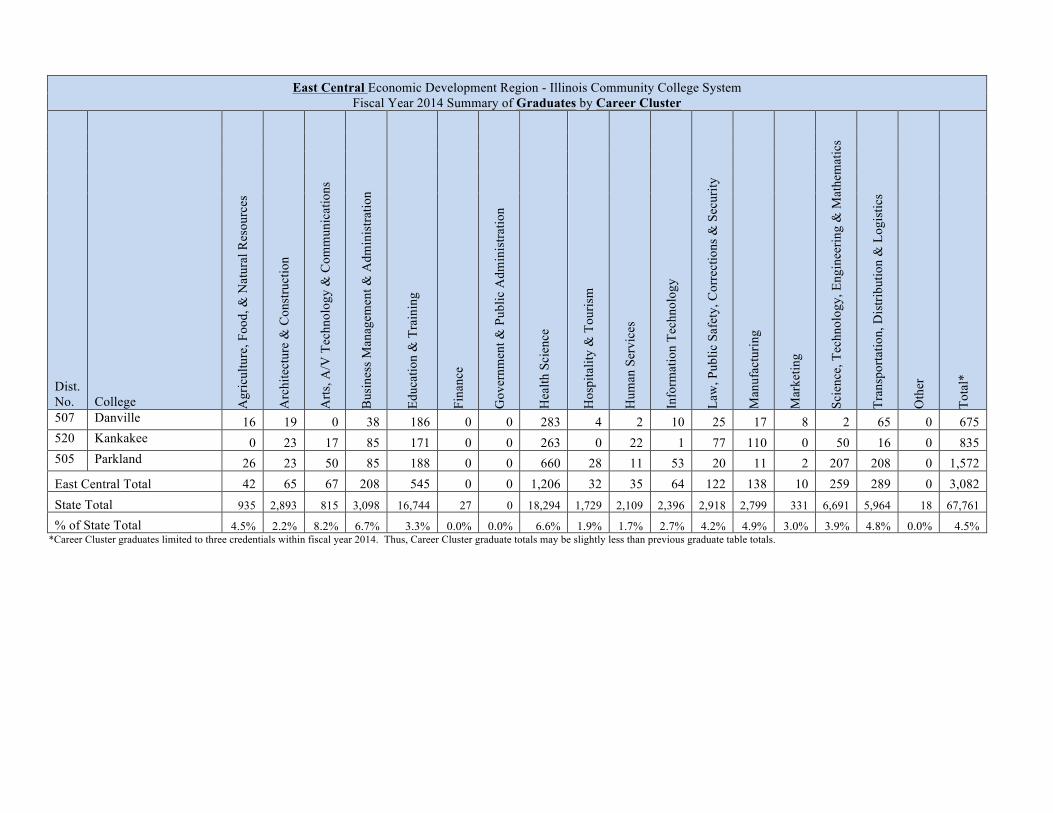
East Central Economic Development Region - Illinois Community College System Fiscal Year 2014 Summary of Graduates by Career Cluster
% of State Total 4.5% 2.2% 8.2% 6.7% 3.3% 0.0% 0.0% 6.6% 1.9% 1.7% 2.7% 4.2% 4.9% 3.0% 3.9% 4.8% 0.0% 4.5% *Career Cluster graduates limited to three credentials within fiscal year 2014. Thus, Career Cluster graduate totals may be slightly less than previous graduate table totals.
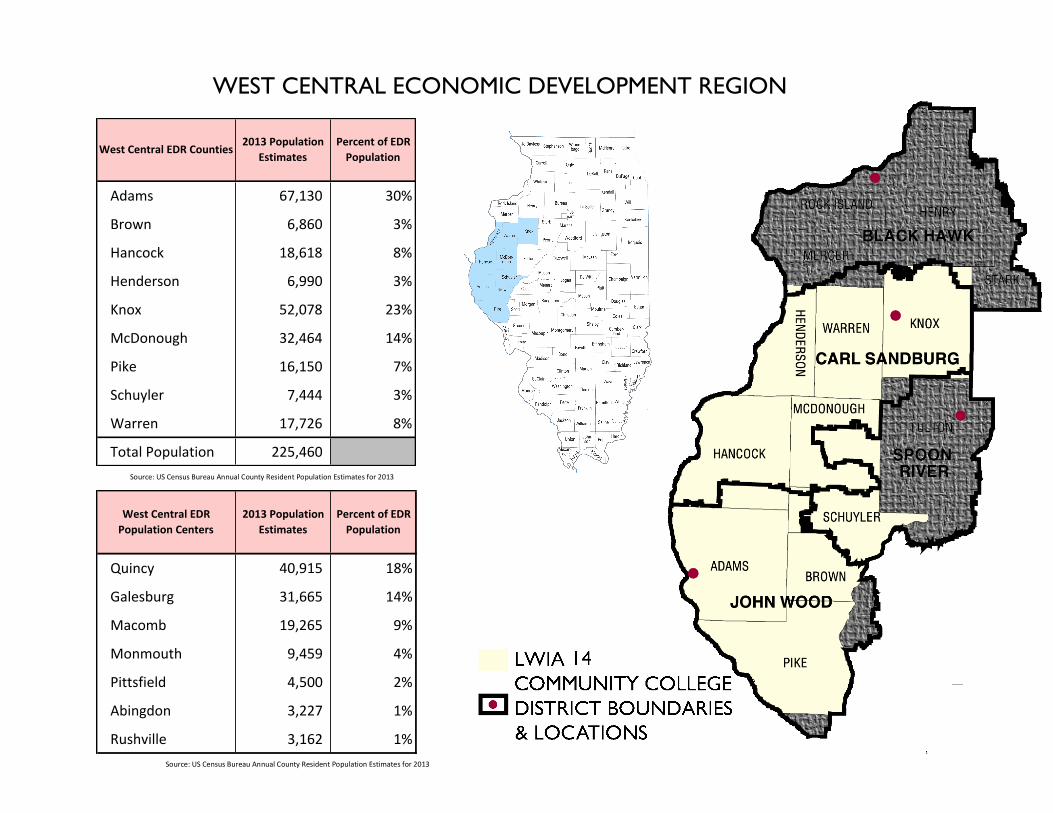
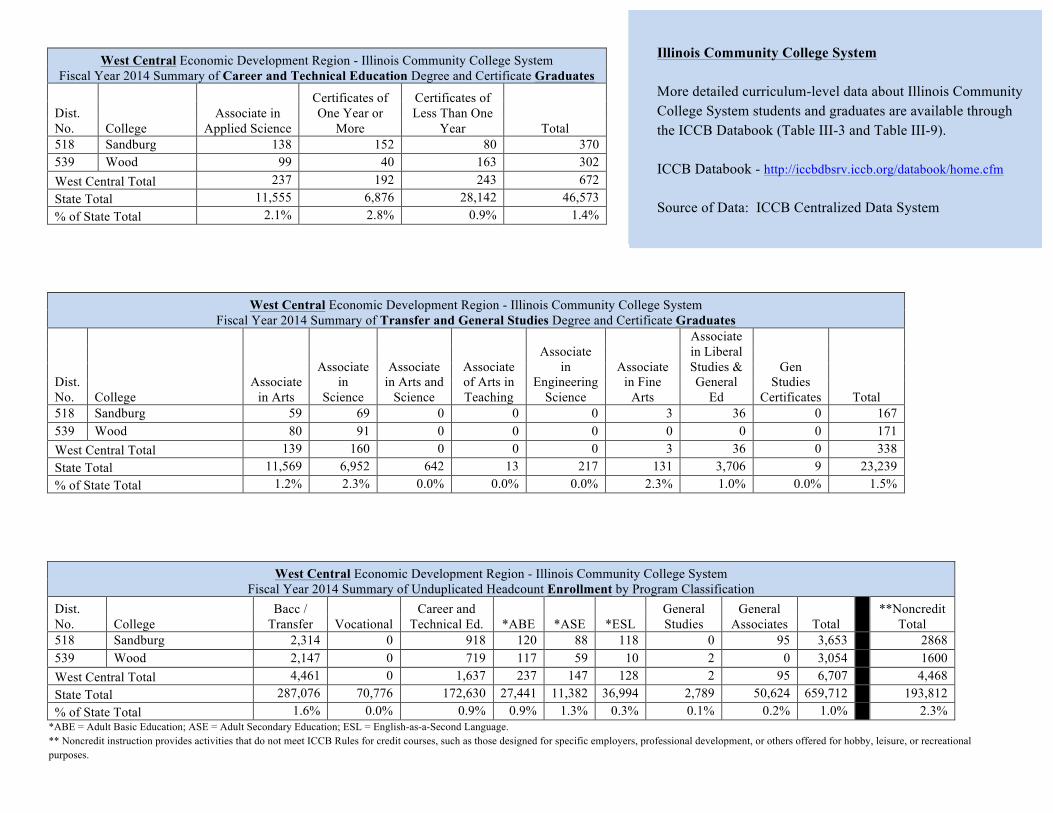
West Central Economic Development Region - Illinois Community College System Fiscal Year 2014 Summary of Career and Technical Education Degree and Certificate Graduates
Dist. No. College
Associate in Applied Science
Certificates of One Year or
More
Certificates of Less Than One
Year Total 518 Sandburg 138 152 80 370 539 Wood 99 40 163 302 West Central Total 237 192 243 672 State Total 11,555 6,876 28,142 46,573 % of State Total 2.1% 2.8% 0.9% 1.4% !
!
West Central Economic Development Region - Illinois Community College System Fiscal Year 2014 Summary of Transfer and General Studies Degree and Certificate Graduates
Dist. No. College
Associate in Arts
Associate in
Science
Associate in Arts and
Science
Associate of Arts in Teaching
Associate in
Engineering Science
Associate in Fine
Arts
Associate in Liberal Studies & General
Ed
Gen Studies
Certificates Total 518 Sandburg 59 69 0 0 0 3 36 0 167 539 Wood 80 91 0 0 0 0 0 0 171 West Central Total 139 160 0 0 0 3 36 0 338 State Total 11,569 6,952 642 13 217 131 3,706 9 23,239 % of State Total 1.2% 2.3% 0.0% 0.0% 0.0% 2.3% 1.0% 0.0% 1.5% !
!
West Central Economic Development Region - Illinois Community College System Fiscal Year 2014 Summary of Unduplicated Headcount Enrollment by Program Classification
Dist. No. College
Bacc / Transfer Vocational
Career and Technical Ed. *ABE *ASE *ESL
General Studies
General Associates Total
**Noncredit Total
518 Sandburg 2,314 0 918 120 88 118 0 95 3,653
2868 539 Wood 2,147 0 719 117 59 10 2 0 3,054
1600
West Central Total 4,461 0 1,637 237 147 128 2 95 6,707
4,468 State Total 287,076 70,776 172,630 27,441 11,382 36,994 2,789 50,624 659,712
193,812
% of State Total 1.6% 0.0% 0.9% 0.9% 1.3% 0.3% 0.1% 0.2% 1.0%
2.3% *ABE = Adult Basic Education; ASE = Adult Secondary Education; ESL = English-as-a-Second Language. ** Noncredit instruction provides activities that do not meet ICCB Rules for credit courses, such as those designed for specific employers, professional development, or others offered for hobby, leisure, or recreational purposes.
Illinois Community College System More detailed curriculum-level data about Illinois Community College System students and graduates are available through the ICCB Databook (Table III-3 and Table III-9). ICCB Databook - http://iccbdbsrv.iccb.org/databook/home.cfm Source of Data: ICCB Centralized Data System !
Illinois Community College System More detailed curriculum-level data about Illinois Community College System students and graduates are available through the ICCB Databook (Table III-3 and Table III-9). ICCB Databook - http://iccbdbsrv.iccb.org/databook/home.cfm Source of Data: ICCB Centralized Data System !
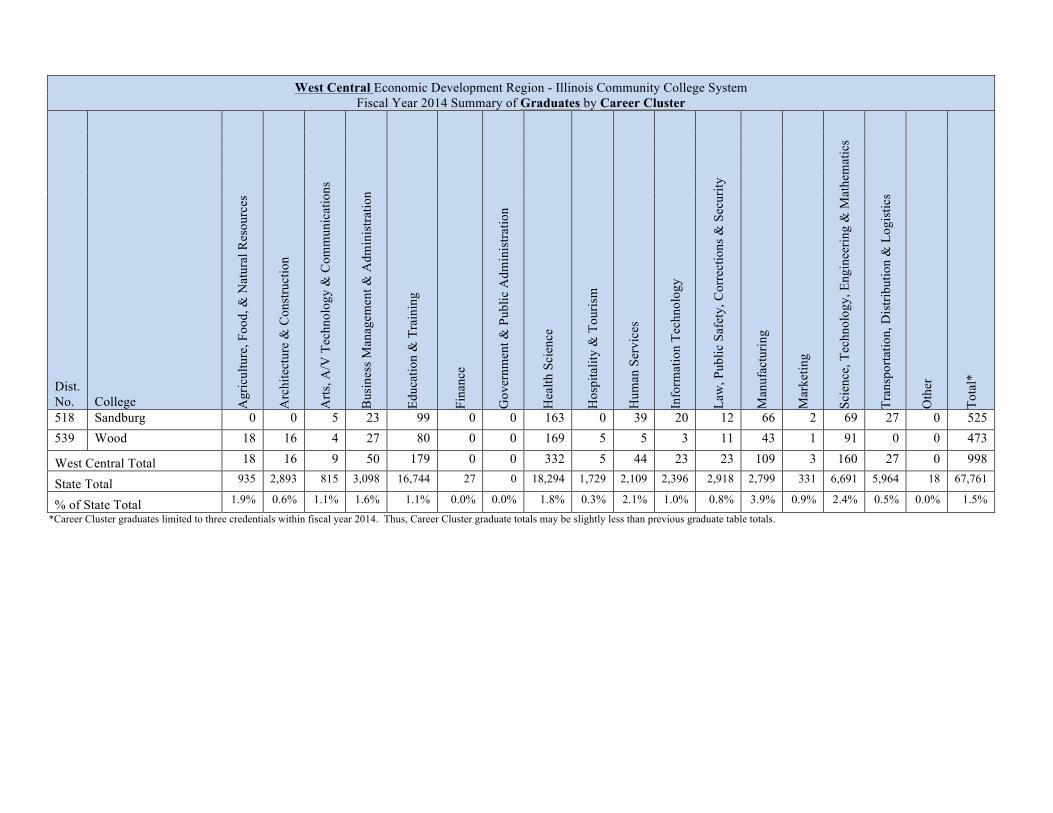
West Central Economic Development Region - Illinois Community College System Fiscal Year 2014 Summary of Graduates by Career Cluster
West Central Total 18 16 9 50 179 0 0 332 5 44 23 23 109 3 160 27 0 998
State Total 935 2,893 815 3,098 16,744 27 0 18,294 1,729 2,109 2,396 2,918 2,799 331 6,691 5,964 18 67,761
% of State Total 1.9% 0.6% 1.1% 1.6% 1.1% 0.0% 0.0% 1.8% 0.3% 2.1% 1.0% 0.8% 3.9% 0.9% 2.4% 0.5% 0.0% 1.5% *Career Cluster graduates limited to three credentials within fiscal year 2014. Thus, Career Cluster graduate totals may be slightly less than previous graduate table totals.
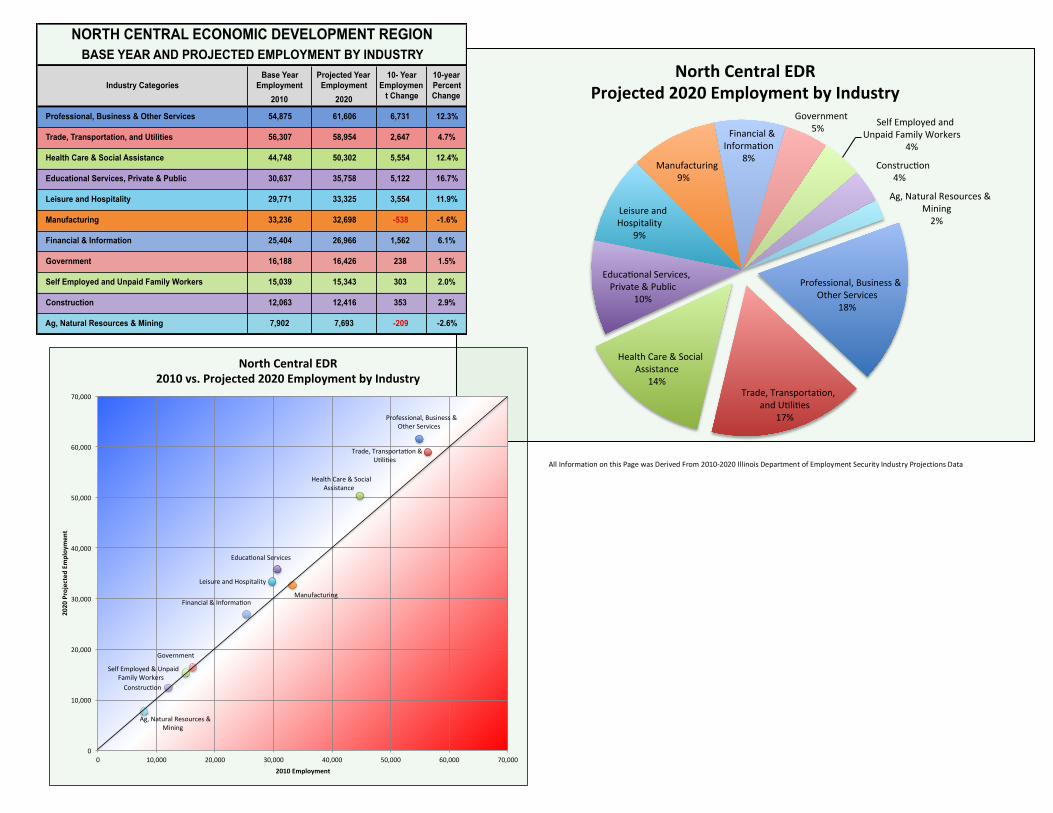
North Central Economic Development Region - Illinois Community College System Fiscal Year 2014 Summary of Career and Technical Education Degree and Certificate Graduates
Dist. No. College
Associate in Applied Science
Certificates of One Year or
More
Certificates of Less Than One
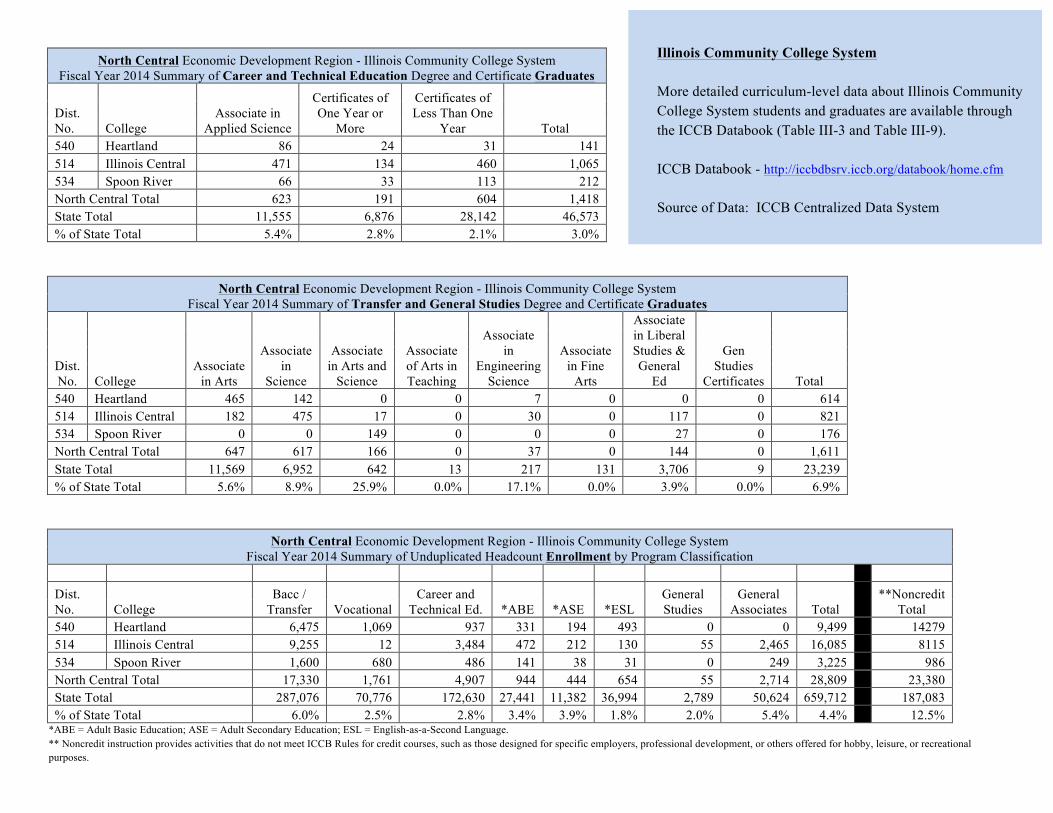
Year Total 540 Heartland 86 24 31 141 514 Illinois Central 471 134 460 1,065 534 Spoon River 66 33 113 212 North Central Total 623 191 604 1,418 State Total 11,555 6,876 28,142 46,573 % of State Total 5.4% 2.8% 2.1% 3.0% !
North Central Economic Development Region - Illinois Community College System Fiscal Year 2014 Summary of Transfer and General Studies Degree and Certificate Graduates
Dist. No. College
Associate in Arts
Associate in
Science
Associate in Arts and
Science
Associate of Arts in Teaching
Associate in
Engineering Science
Associate in Fine
Arts
Associate in Liberal Studies & General
Ed
Gen Studies
Certificates Total 540 Heartland 465 142 0 0 7 0 0 0 614 514 Illinois Central 182 475 17 0 30 0 117 0 821 534 Spoon River 0 0 149 0 0 0 27 0 176 North Central Total 647 617 166 0 37 0 144 0 1,611 State Total 11,569 6,952 642 13 217 131 3,706 9 23,239 % of State Total 5.6% 8.9% 25.9% 0.0% 17.1% 0.0% 3.9% 0.0% 6.9% !
North Central Economic Development Region - Illinois Community College System Fiscal Year 2014 Summary of Unduplicated Headcount Enrollment by Program Classification
986 North Central Total 17,330 1,761 4,907 944 444 654 55 2,714 28,809
23,380
State Total 287,076 70,776 172,630 27,441 11,382 36,994 2,789 50,624 659,712
187,083 % of State Total 6.0% 2.5% 2.8% 3.4% 3.9% 1.8% 2.0% 5.4% 4.4%
12.5%
*ABE = Adult Basic Education; ASE = Adult Secondary Education; ESL = English-as-a-Second Language. ** Noncredit instruction provides activities that do not meet ICCB Rules for credit courses, such as those designed for specific employers, professional development, or others offered for hobby, leisure, or recreational purposes.
Illinois Community College System More detailed curriculum-level data about Illinois Community College System students and graduates are available through the ICCB Databook (Table III-3 and Table III-9). ICCB Databook - http://iccbdbsrv.iccb.org/databook/home.cfm Source of Data: ICCB Centralized Data System !
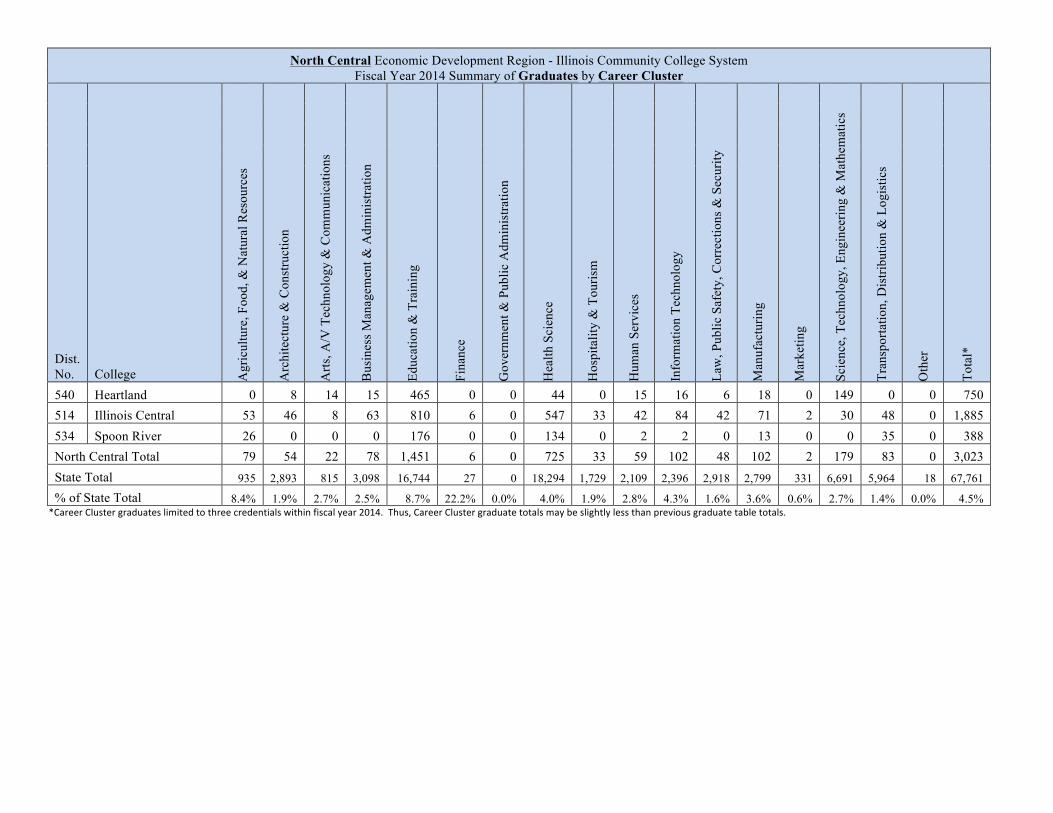
North Central Economic Development Region - Illinois Community College System Fiscal Year 2014 Summary of Graduates by Career Cluster
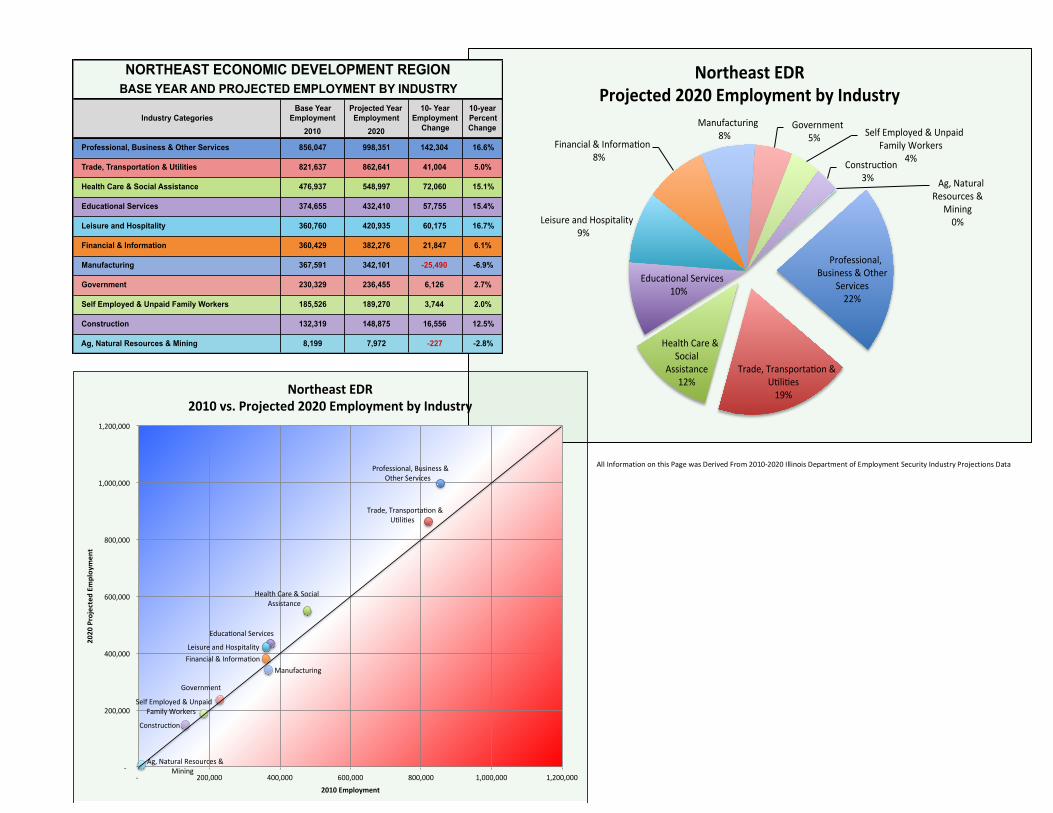
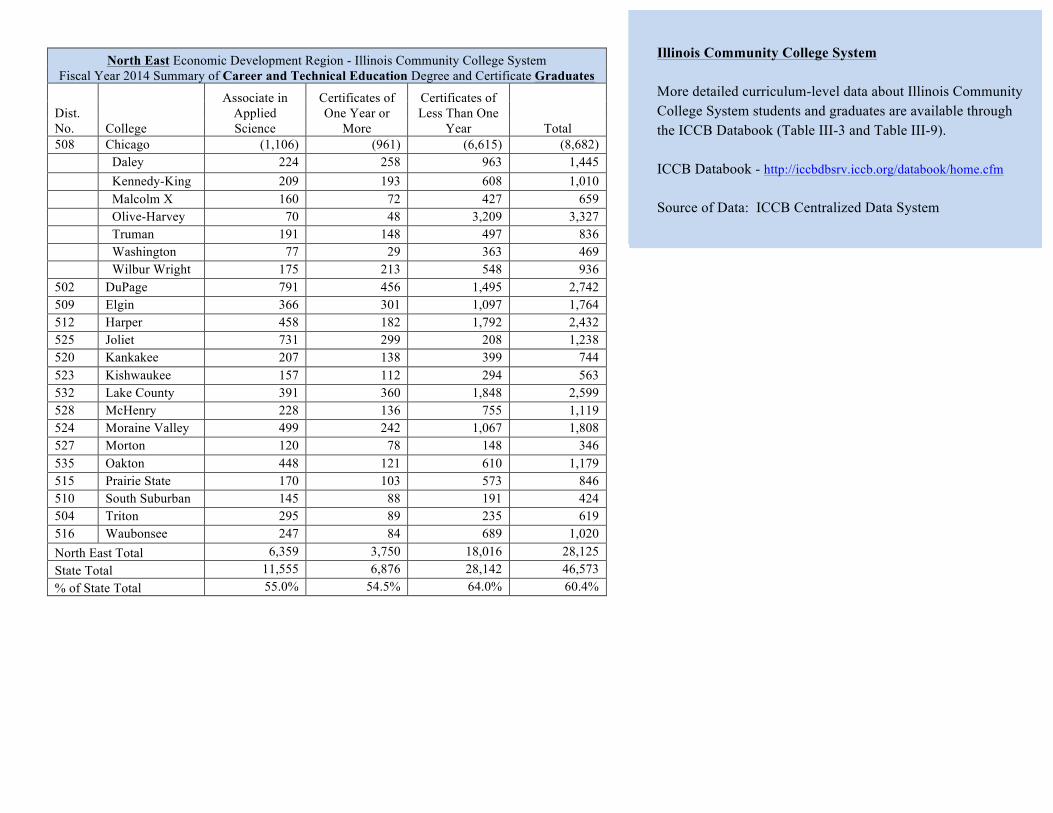
North East Economic Development Region - Illinois Community College System Fiscal Year 2014 Summary of Career and Technical Education Degree and Certificate Graduates
Dist. No. College
Associate in Applied Science
Certificates of One Year or
More
Certificates of Less Than One
Year Total 508 Chicago (1,106) (961) (6,615) (8,682) Daley 224 258 963 1,445 Kennedy-King 209 193 608 1,010 Malcolm X 160 72 427 659 Olive-Harvey 70 48 3,209 3,327 Truman 191 148 497 836 Washington 77 29 363 469 Wilbur Wright 175 213 548 936 502 DuPage 791 456 1,495 2,742 509 Elgin 366 301 1,097 1,764 512 Harper 458 182 1,792 2,432 525 Joliet 731 299 208 1,238 520 Kankakee 207 138 399 744 523 Kishwaukee 157 112 294 563 532 Lake County 391 360 1,848 2,599 528 McHenry 228 136 755 1,119 524 Moraine Valley 499 242 1,067 1,808 527 Morton 120 78 148 346 535 Oakton 448 121 610 1,179 515 Prairie State 170 103 573 846 510 South Suburban 145 88 191 424 504 Triton 295 89 235 619 516 Waubonsee 247 84 689 1,020 North East Total 6,359 3,750 18,016 28,125 State Total 11,555 6,876 28,142 46,573 % of State Total 55.0% 54.5% 64.0% 60.4% !
!
!
!
!
Illinois Community College System More detailed curriculum-level data about Illinois Community College System students and graduates are available through the ICCB Databook (Table III-3 and Table III-9). ICCB Databook - http://iccbdbsrv.iccb.org/databook/home.cfm Source of Data: ICCB Centralized Data System !
Illinois Community College System More detailed curriculum-level data about Illinois Community College System students and graduates are available through the ICCB Databook (Table III-3 and Table III-9). ICCB Databook - http://iccbdbsrv.iccb.org/databook/home.cfm Source of Data: ICCB Centralized Data System !
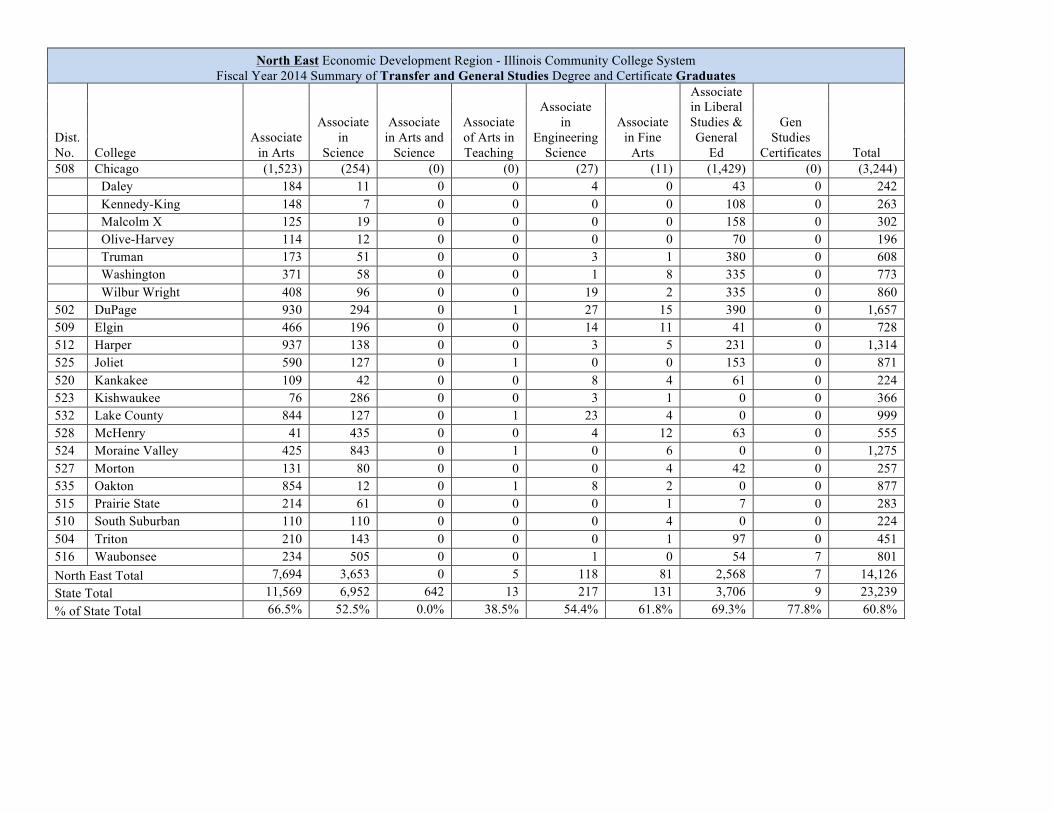
North East Economic Development Region - Illinois Community College System Fiscal Year 2014 Summary of Transfer and General Studies Degree and Certificate Graduates
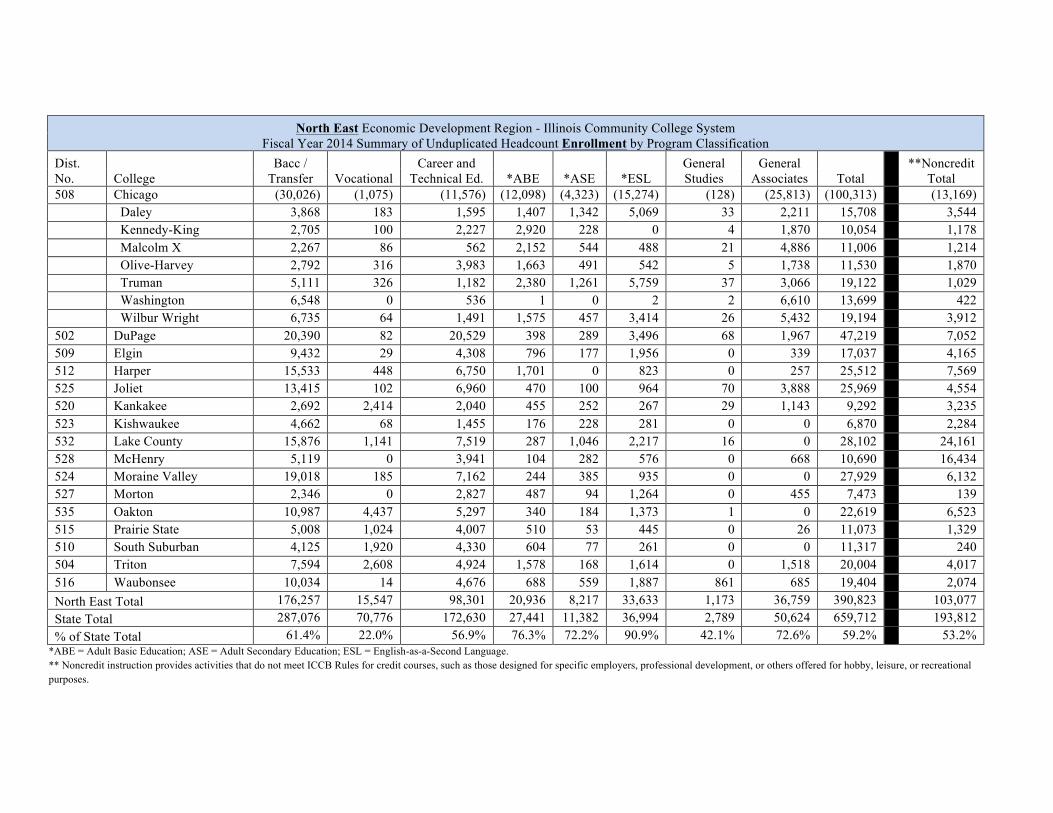
North East Economic Development Region - Illinois Community College System Fiscal Year 2014 Summary of Unduplicated Headcount Enrollment by Program Classification
2,074 North East Total 176,257 15,547 98,301 20,936 8,217 33,633 1,173 36,759 390,823
103,077
State Total 287,076 70,776 172,630 27,441 11,382 36,994 2,789 50,624 659,712
193,812 % of State Total 61.4% 22.0% 56.9% 76.3% 72.2% 90.9% 42.1% 72.6% 59.2%
53.2%
*ABE = Adult Basic Education; ASE = Adult Secondary Education; ESL = English-as-a-Second Language. ** Noncredit instruction provides activities that do not meet ICCB Rules for credit courses, such as those designed for specific employers, professional development, or others offered for hobby, leisure, or recreational purposes.
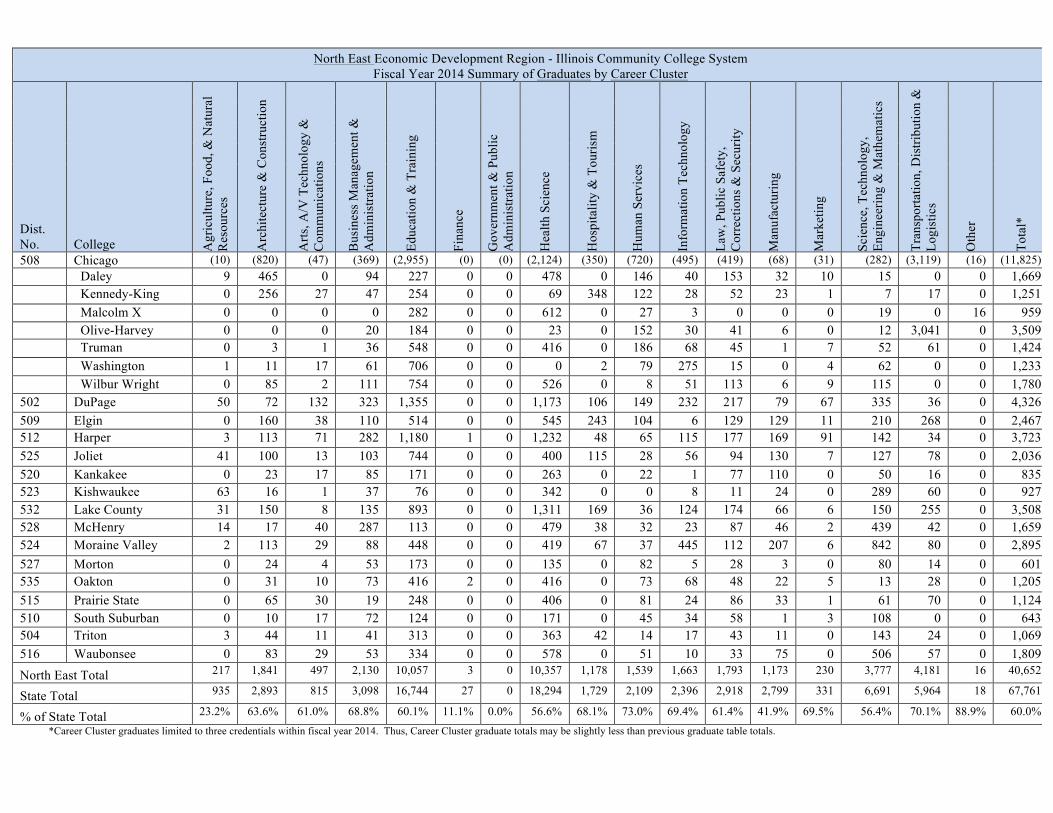
North East Economic Development Region - Illinois Community College System Fiscal Year 2014 Summary of Graduates by Career Cluster
State Total 935 2,893 815 3,098 16,744 27 0 18,294 1,729 2,109 2,396 2,918 2,799 331 6,691 5,964 18 67,761
% of State Total 23.2% 63.6% 61.0% 68.8% 60.1% 11.1% 0.0% 56.6% 68.1% 73.0% 69.4% 61.4% 41.9% 69.5% 56.4% 70.1% 88.9% 60.0% *Career Cluster graduates limited to three credentials within fiscal year 2014. Thus, Career Cluster graduate totals may be slightly less than previous graduate table totals.
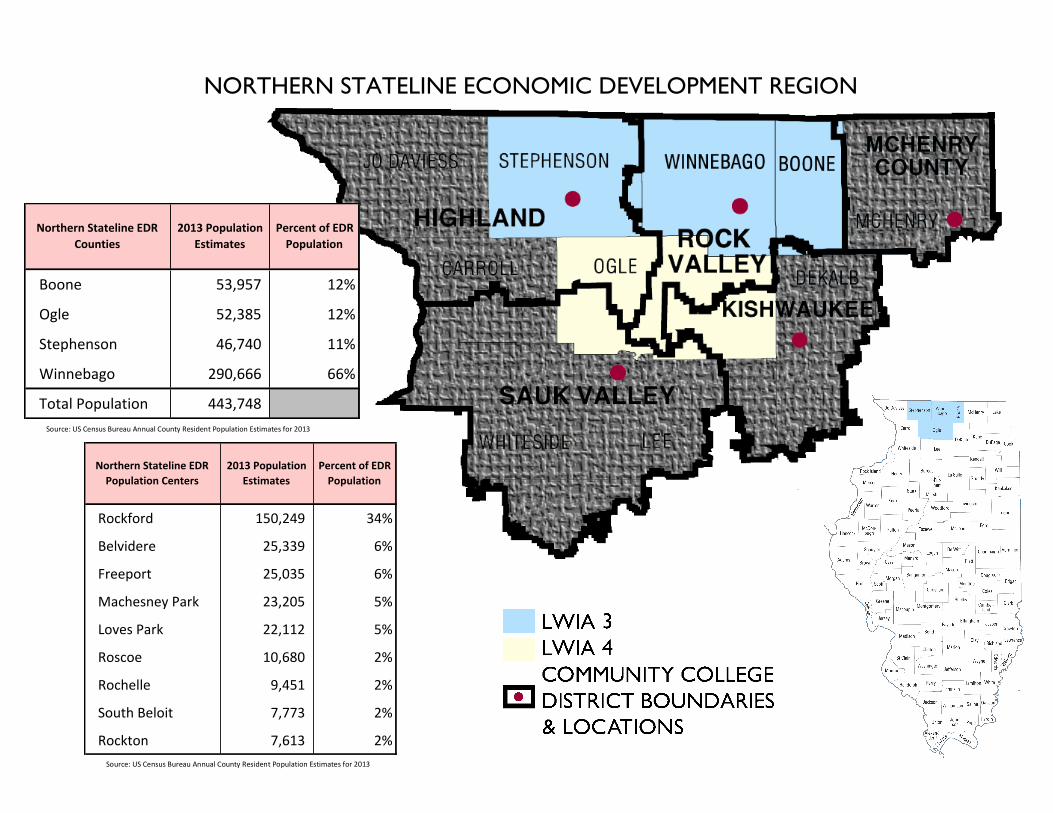
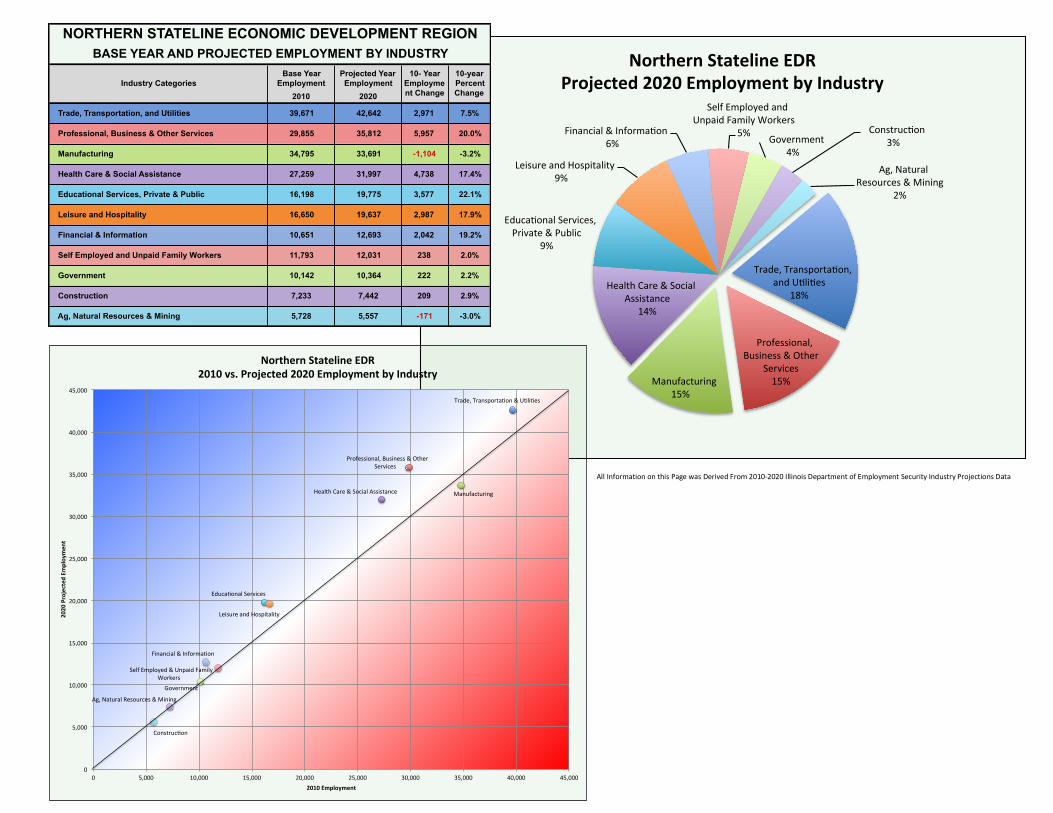
NORTHERN STATELINE ECONOMIC DEVELOPMENT REGION !!!! !
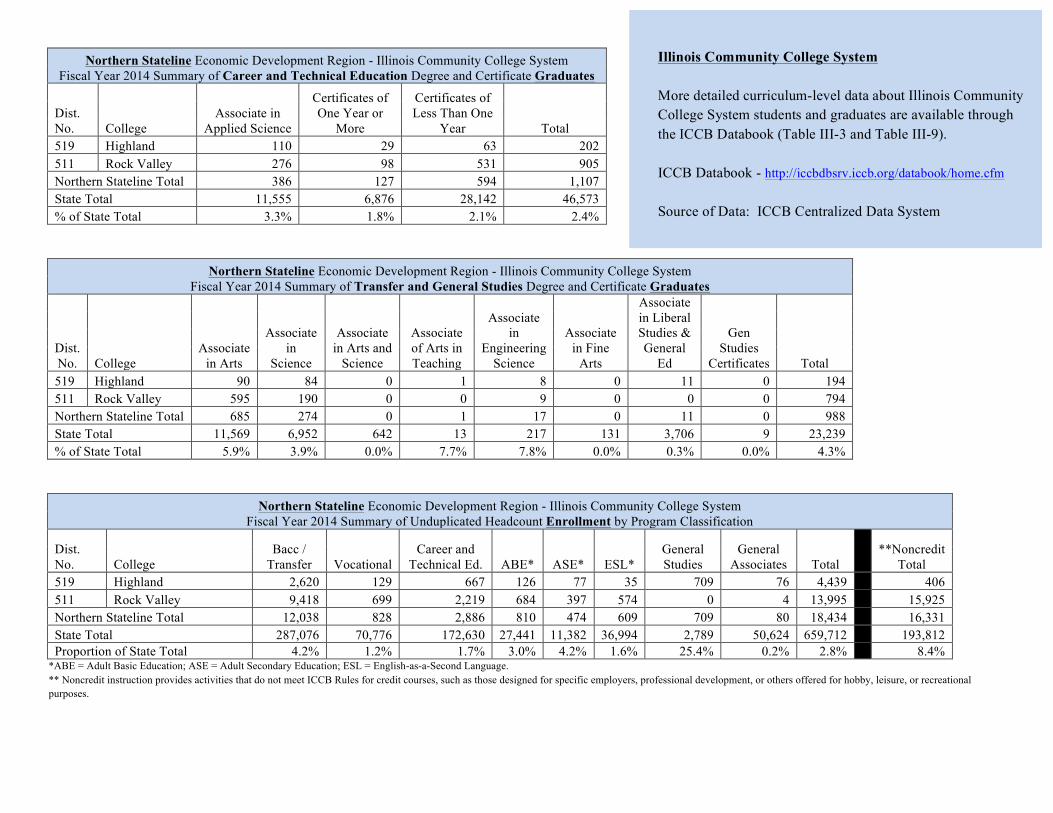
Northern Stateline Economic Development Region - Illinois Community College System Fiscal Year 2014 Summary of Career and Technical Education Degree and Certificate Graduates
Dist. No. College
Associate in Applied Science
Certificates of One Year or
More
Certificates of Less Than One
Year Total 519 Highland 110 29 63 202 511 Rock Valley 276 98 531 905 Northern Stateline Total 386 127 594 1,107 State Total 11,555 6,876 28,142 46,573 % of State Total 3.3% 1.8% 2.1% 2.4% !
Northern Stateline Economic Development Region - Illinois Community College System Fiscal Year 2014 Summary of Transfer and General Studies Degree and Certificate Graduates
Dist. No. College
Associate in Arts
Associate in
Science
Associate in Arts and
Science
Associate of Arts in Teaching
Associate in
Engineering Science
Associate in Fine
Arts
Associate in Liberal Studies & General
Ed
Gen Studies
Certificates Total 519 Highland 90 84 0 1 8 0 11 0 194 511 Rock Valley 595 190 0 0 9 0 0 0 794 Northern Stateline Total 685 274 0 1 17 0 11 0 988 State Total 11,569 6,952 642 13 217 131 3,706 9 23,239 % of State Total 5.9% 3.9% 0.0% 7.7% 7.8% 0.0% 0.3% 0.0% 4.3% !
Northern Stateline Economic Development Region - Illinois Community College System Fiscal Year 2014 Summary of Unduplicated Headcount Enrollment by Program Classification
Dist. No. College
Bacc / Transfer Vocational
Career and Technical Ed. ABE* ASE* ESL*
General Studies
General Associates Total
**Noncredit Total
519 Highland 2,620 129 667 126 77 35 709 76 4,439
406 511 Rock Valley 9,418 699 2,219 684 397 574 0 4 13,995
16,331 State Total 287,076 70,776 172,630 27,441 11,382 36,994 2,789 50,624 659,712
193,812
Proportion of State Total 4.2% 1.2% 1.7% 3.0% 4.2% 1.6% 25.4% 0.2% 2.8%
8.4% *ABE = Adult Basic Education; ASE = Adult Secondary Education; ESL = English-as-a-Second Language. ** Noncredit instruction provides activities that do not meet ICCB Rules for credit courses, such as those designed for specific employers, professional development, or others offered for hobby, leisure, or recreational purposes.
!
Illinois Community College System More detailed curriculum-level data about Illinois Community College System students and graduates are available through the ICCB Databook (Table III-3 and Table III-9). ICCB Databook - http://iccbdbsrv.iccb.org/databook/home.cfm Source of Data: ICCB Centralized Data System !
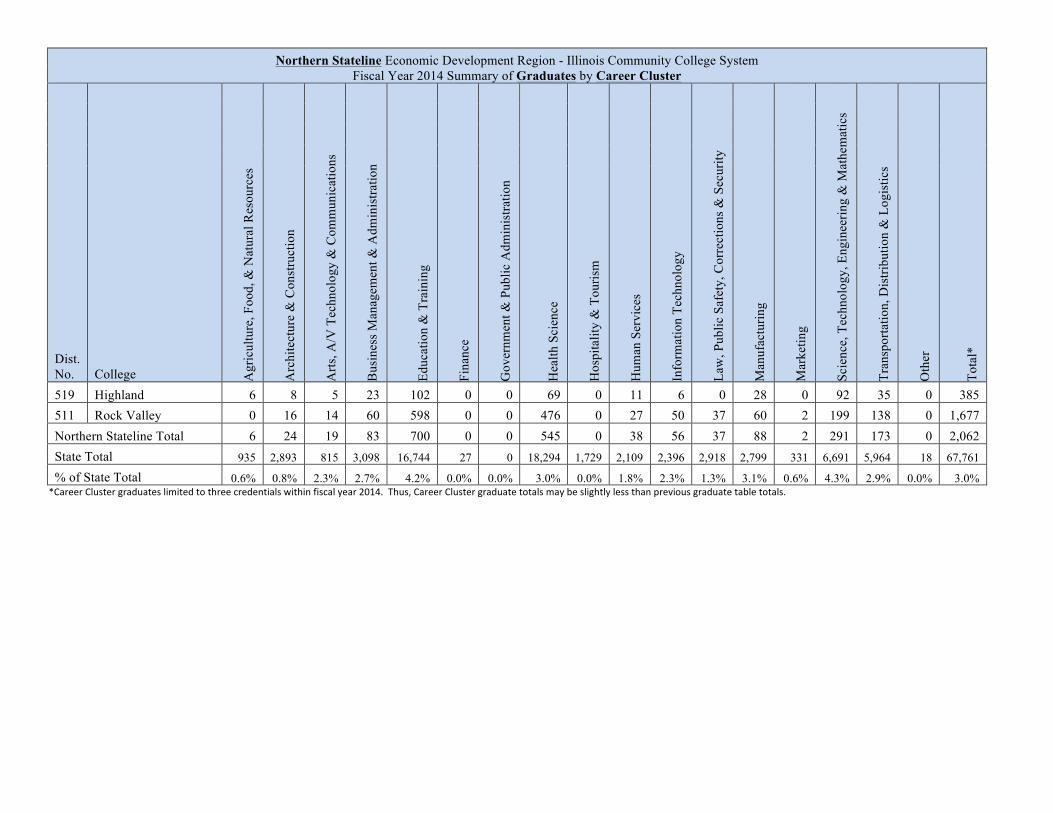
Northern Stateline Economic Development Region - Illinois Community College System Fiscal Year 2014 Summary of Graduates by Career Cluster
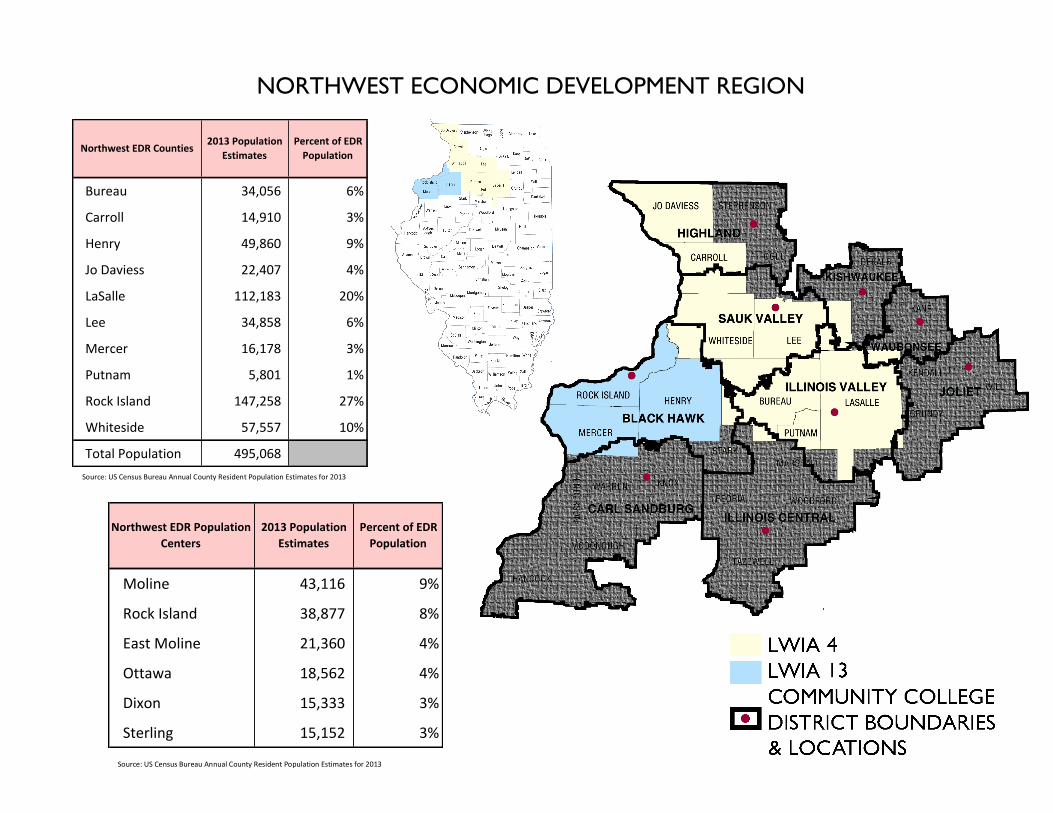
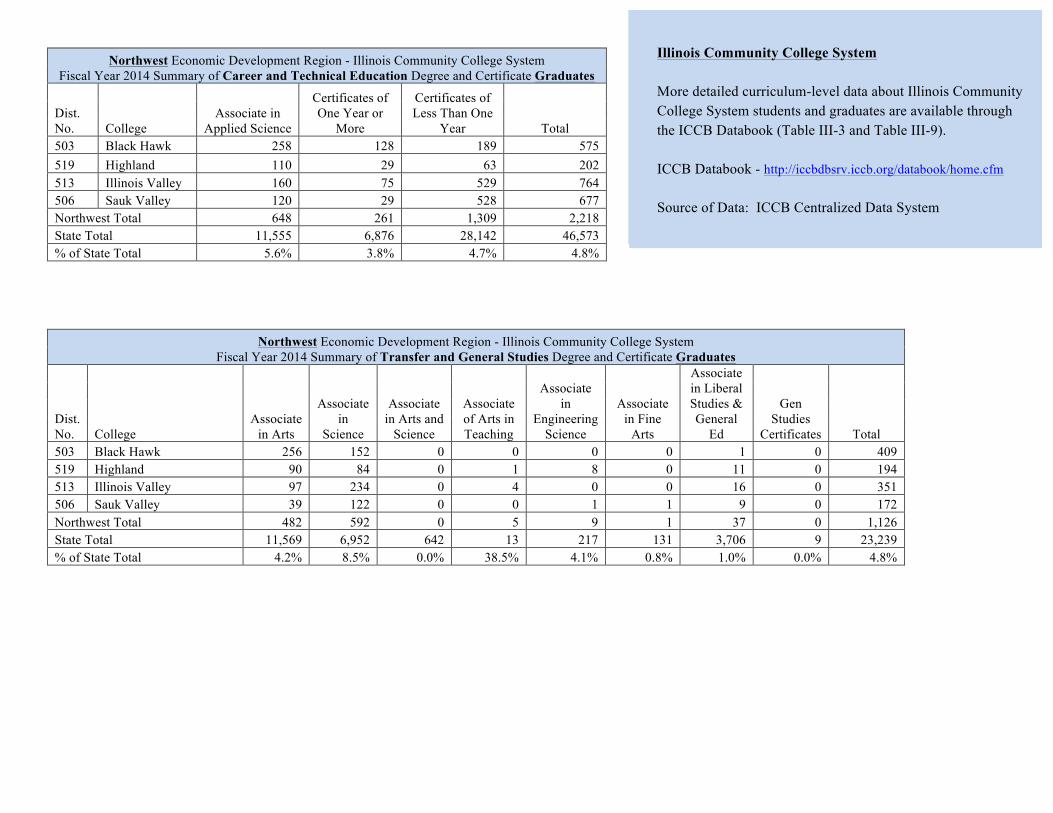
Northwest Economic Development Region - Illinois Community College System Fiscal Year 2014 Summary of Career and Technical Education Degree and Certificate Graduates
Dist. No. College
Associate in Applied Science
Certificates of One Year or
More
Certificates of Less Than One
Year Total 503 Black Hawk 258 128 189 575 519 Highland 110 29 63 202 513 Illinois Valley 160 75 529 764 506 Sauk Valley 120 29 528 677 Northwest Total 648 261 1,309 2,218 State Total 11,555 6,876 28,142 46,573 % of State Total 5.6% 3.8% 4.7% 4.8% !
!
Northwest Economic Development Region - Illinois Community College System Fiscal Year 2014 Summary of Transfer and General Studies Degree and Certificate Graduates
Dist. No. College
Associate in Arts
Associate in
Science
Associate in Arts and
Science
Associate of Arts in Teaching
Associate in
Engineering Science
Associate in Fine
Arts
Associate in Liberal Studies & General
Ed
Gen Studies
Certificates Total 503 Black Hawk 256 152 0 0 0 0 1 0 409 519 Highland 90 84 0 1 8 0 11 0 194 513 Illinois Valley 97 234 0 4 0 0 16 0 351 506 Sauk Valley 39 122 0 0 1 1 9 0 172 Northwest Total 482 592 0 5 9 1 37 0 1,126 State Total 11,569 6,952 642 13 217 131 3,706 9 23,239 % of State Total 4.2% 8.5% 0.0% 38.5% 4.1% 0.8% 1.0% 0.0% 4.8% !
!
!
!
!
!
Illinois Community College System More detailed curriculum-level data about Illinois Community College System students and graduates are available through the ICCB Databook (Table III-3 and Table III-9). ICCB Databook - http://iccbdbsrv.iccb.org/databook/home.cfm Source of Data: ICCB Centralized Data System !
Illinois Community College System More detailed curriculum-level data about Illinois Community College System students and graduates are available through the ICCB Databook (Table III-3 and Table III-9). ICCB Databook - http://iccbdbsrv.iccb.org/databook/home.cfm Source of Data: ICCB Centralized Data System !
Northwest Economic Development Region - Illinois Community College System Fiscal Year 2014 Summary of Unduplicated Headcount Enrollment by Program Classification
7,735 State Total 287,076 70,776 172,630 27,441 11,382 36,994 2,789 50,624 659,712
193,812
% of State Total 4.3% 2.6% 4.4% 3.4% 5.0% 3.2% 45.9% 0.7% 4.0%
4.0% *ABE = Adult Basic Education; ASE = Adult Secondary Education; ESL = English-as-a-Second Language. ** Noncredit instruction provides activities that do not meet ICCB Rules for credit courses, such as those designed for specific employers, professional development, or others offered for hobby, leisure, or recreational purposes.
Northwest Economic Development Region - Illinois Community College System Fiscal Year 2014 Summary of Graduates by Career Cluster
Southeastern Economic Development Region - Illinois Community College System Fiscal Year 2014 Summary of Career and Technical Education Degree and Certificate Graduates
Dist. No. College
Associate in Applied Science
Certificates of One Year or
More
Certificates of Less Than One
Year Total 529 Illinois Eastern (274) (230) (338) (842) Frontier 17 47 124 188 Lincoln Trail 43 35 59 137 Olney Central 131 125 103 359
Wabash
Valley 83 23 52 158 501 Kaskaskia 284 295 682 1,261 517 Lake Land 402 480 1,475 2,357 Southeastern Total 960 1,005 2,495 4,460 State Total 11,555 6,876 28,142 46,573 % of State Total 8.3% 14.6% 8.9% 9.6% !
Southeastern Economic Development Region - Illinois Community College System Fiscal Year 2014 Summary of Transfer and General Studies Degree and Certificate Graduates
Valley 0 36 57 0 0 0 21 0 114 501 Kaskaskia 216 31 0 0 5 0 71 0 323 517 Lake Land 124 216 0 0 6 0 190 0 536 Southeastern Total 340 300 342 0 11 0 382 0 1,375 State Total 11,569 6,952 642 13 217 131 3,706 9 23,239 % of State Total 2.9% 4.3% 53.3% 0.0% 5.1% 0.0% 10.3% 0.0% 5.9% !
!
!
Illinois Community College System More detailed curriculum-level data about Illinois Community College System students and graduates are available through the ICCB Databook (Table III-3 and Table III-9). ICCB Databook - http://iccbdbsrv.iccb.org/databook/home.cfm Source of Data: ICCB Centralized Data System !
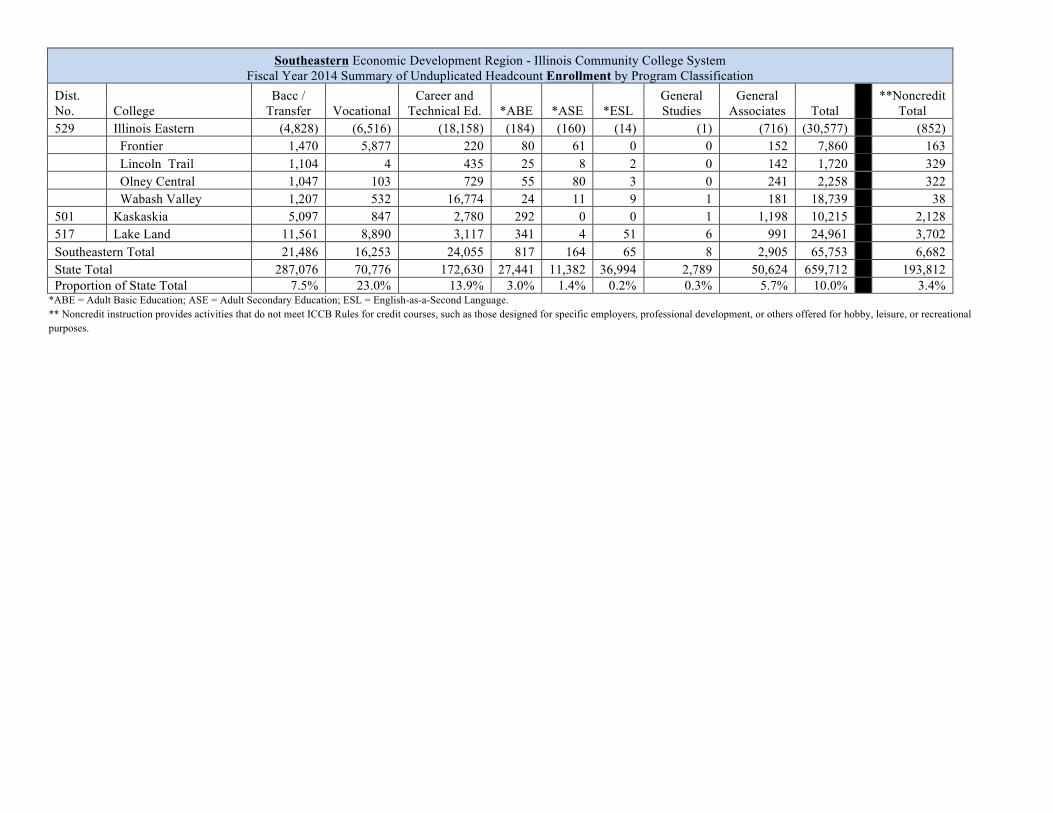
Southeastern Economic Development Region - Illinois Community College System Fiscal Year 2014 Summary of Unduplicated Headcount Enrollment by Program Classification
State Total 287,076 70,776 172,630 27,441 11,382 36,994 2,789 50,624 659,712
193,812 Proportion of State Total 7.5% 23.0% 13.9% 3.0% 1.4% 0.2% 0.3% 5.7% 10.0%
3.4%
*ABE = Adult Basic Education; ASE = Adult Secondary Education; ESL = English-as-a-Second Language. ** Noncredit instruction provides activities that do not meet ICCB Rules for credit courses, such as those designed for specific employers, professional development, or others offered for hobby, leisure, or recreational purposes.
! !
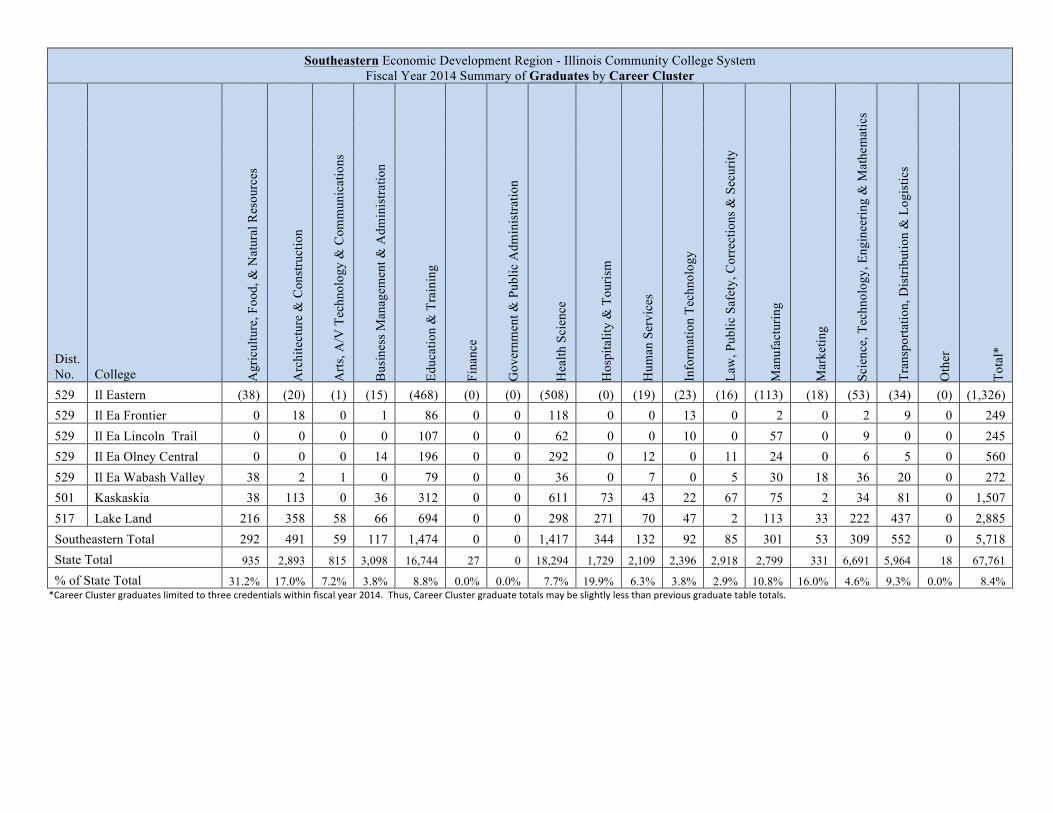
Southeastern Economic Development Region - Illinois Community College System Fiscal Year 2014 Summary of Graduates by Career Cluster
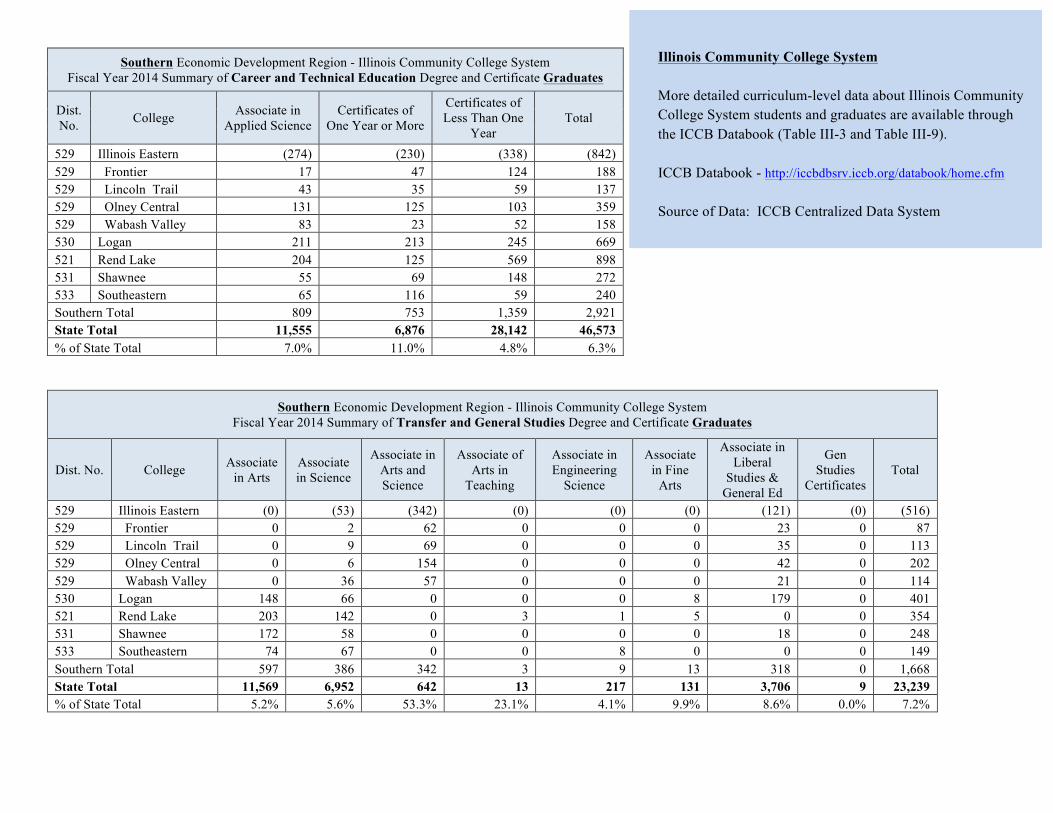
Southern Economic Development Region - Illinois Community College System Fiscal Year 2014 Summary of Career and Technical Education Degree and Certificate Graduates
Dist. No. College Associate in
Applied Science Certificates of
One Year or More
Certificates of Less Than One
Year Total
529 Illinois Eastern (274) (230) (338) (842) 529 Frontier 17 47 124 188 529 Lincoln Trail 43 35 59 137 529 Olney Central 131 125 103 359 529 Wabash Valley 83 23 52 158 530 Logan 211 213 245 669 521 Rend Lake 204 125 569 898 531 Shawnee 55 69 148 272 533 Southeastern 65 116 59 240 Southern Total 809 753 1,359 2,921 State Total 11,555 6,876 28,142 46,573 % of State Total 7.0% 11.0% 4.8% 6.3% !
Southern Economic Development Region - Illinois Community College System Fiscal Year 2014 Summary of Transfer and General Studies Degree and Certificate Graduates
Illinois Community College System More detailed curriculum-level data about Illinois Community College System students and graduates are available through the ICCB Databook (Table III-3 and Table III-9). ICCB Databook - http://iccbdbsrv.iccb.org/databook/home.cfm Source of Data: ICCB Centralized Data System !
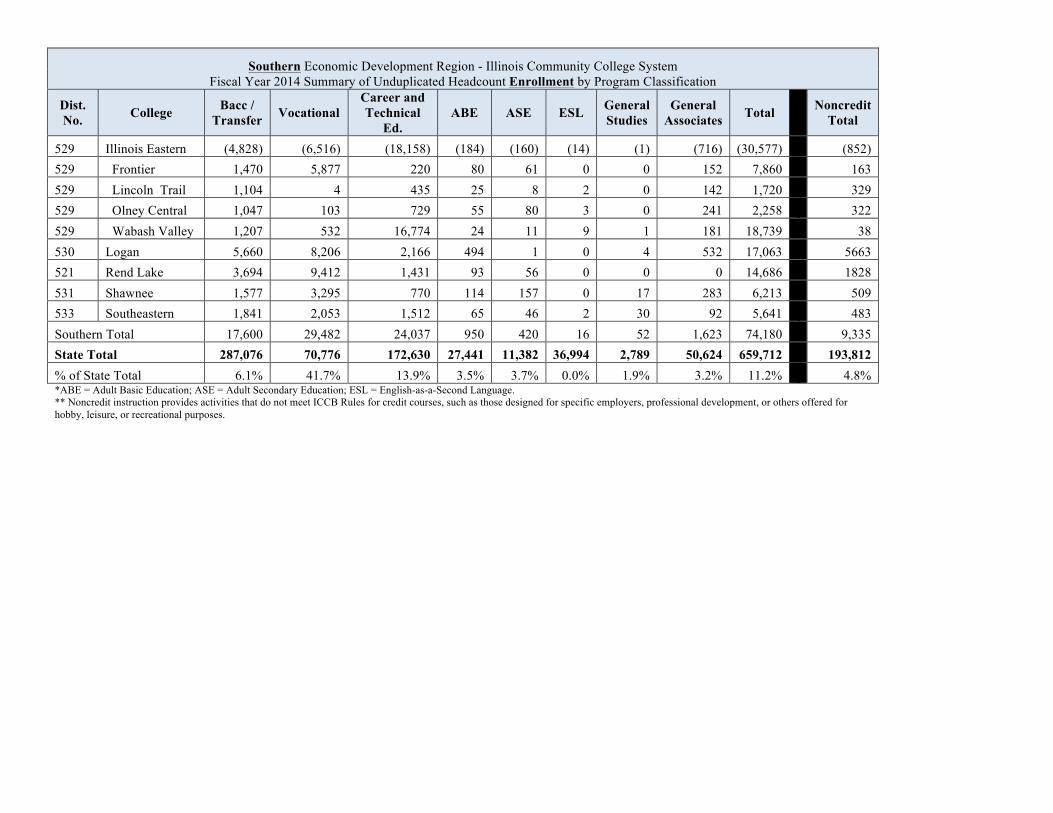
Southern Economic Development Region - Illinois Community College System Fiscal Year 2014 Summary of Unduplicated Headcount Enrollment by Program Classification
% of State Total 6.1% 41.7% 13.9% 3.5% 3.7% 0.0% 1.9% 3.2% 11.2% 4.8% *ABE = Adult Basic Education; ASE = Adult Secondary Education; ESL = English-as-a-Second Language. ** Noncredit instruction provides activities that do not meet ICCB Rules for credit courses, such as those designed for specific employers, professional development, or others offered for hobby, leisure, or recreational purposes.
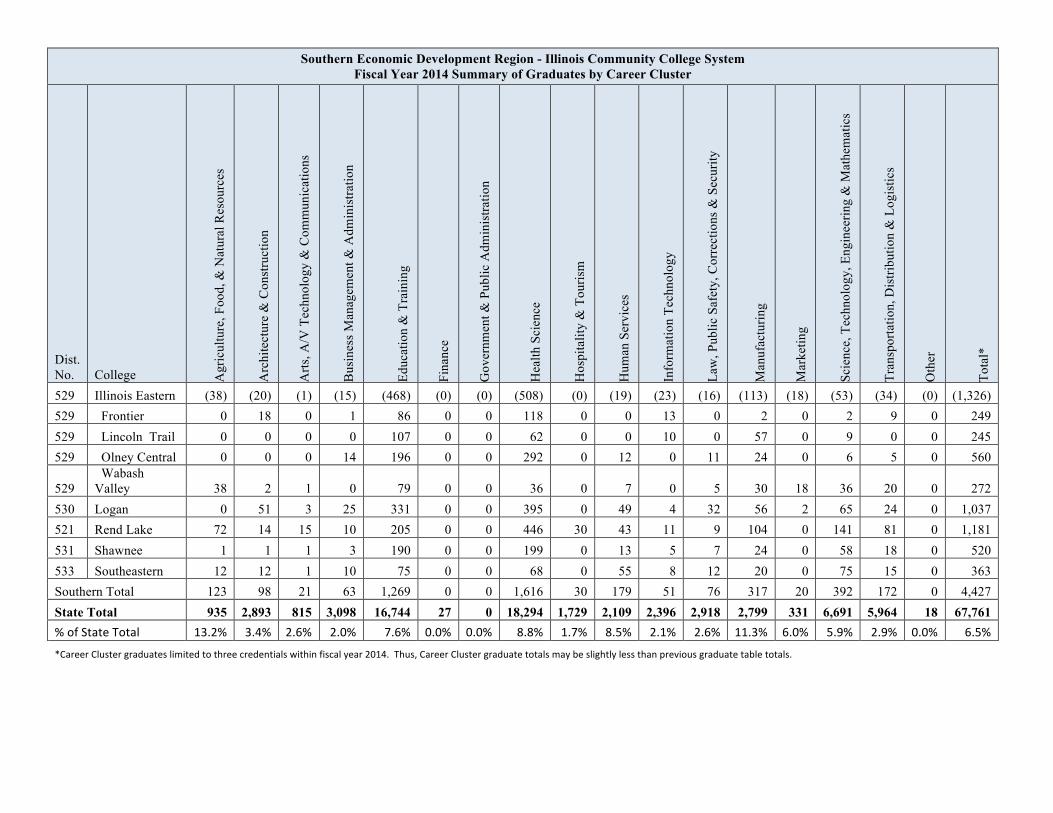
Southern Economic Development Region - Illinois Community College System Fiscal Year 2014 Summary of Graduates by Career Cluster
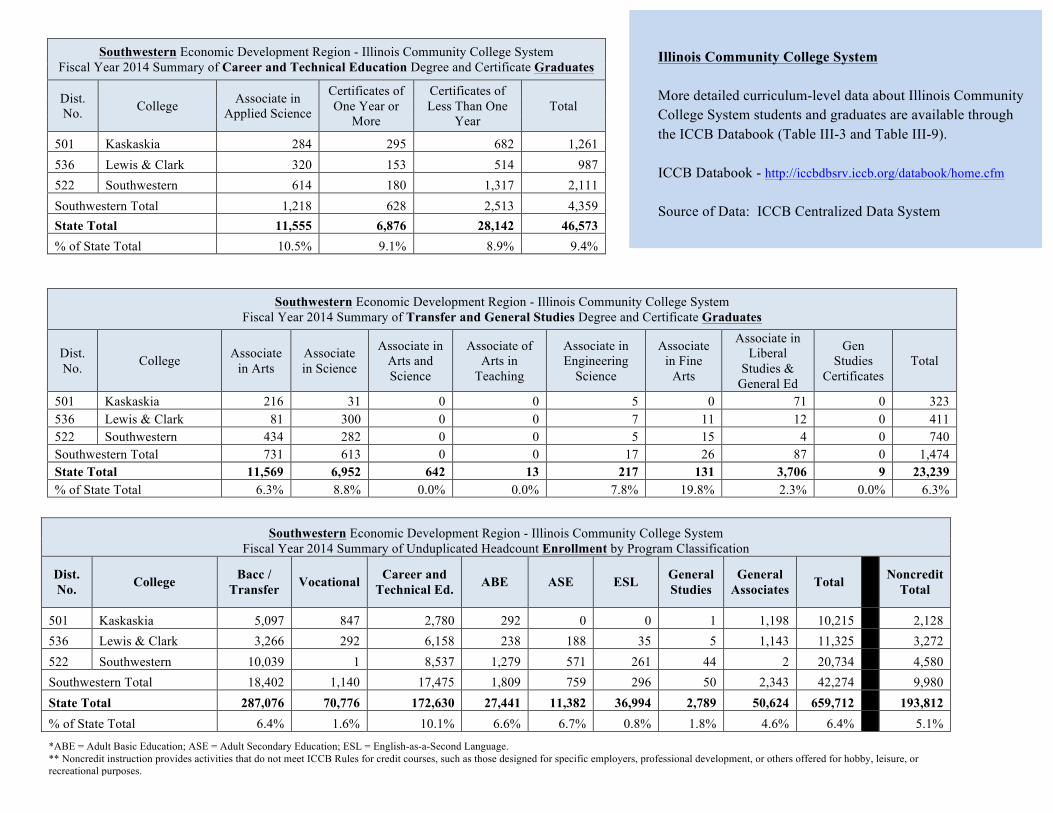
Southwestern Economic Development Region - Illinois Community College System Fiscal Year 2014 Summary of Career and Technical Education Degree and Certificate Graduates
Dist. No. College Associate in
Applied Science
Certificates of One Year or
More
Certificates of Less Than One
Year Total
501 Kaskaskia 284 295 682 1,261 536 Lewis & Clark 320 153 514 987 522 Southwestern 614 180 1,317 2,111 Southwestern Total 1,218 628 2,513 4,359 State Total 11,555 6,876 28,142 46,573 % of State Total 10.5% 9.1% 8.9% 9.4% !
Southwestern Economic Development Region - Illinois Community College System Fiscal Year 2014 Summary of Transfer and General Studies Degree and Certificate Graduates
Dist. No. College Associate
in Arts Associate in Science
Associate in Arts and Science
Associate of Arts in
Teaching
Associate in Engineering
Science
Associate in Fine
Arts
Associate in Liberal
Studies & General Ed
Gen Studies
Certificates Total
501 Kaskaskia 216 31 0 0 5 0 71 0 323 536 Lewis & Clark 81 300 0 0 7 11 12 0 411 522 Southwestern 434 282 0 0 5 15 4 0 740 Southwestern Total 731 613 0 0 17 26 87 0 1,474 State Total 11,569 6,952 642 13 217 131 3,706 9 23,239 % of State Total 6.3% 8.8% 0.0% 0.0% 7.8% 19.8% 2.3% 0.0% 6.3%
Southwestern Economic Development Region - Illinois Community College System
Fiscal Year 2014 Summary of Unduplicated Headcount Enrollment by Program Classification
Dist. No. College Bacc /
Transfer Vocational Career and Technical Ed. ABE ASE ESL General
% of State Total 6.4% 1.6% 10.1% 6.6% 6.7% 0.8% 1.8% 4.6% 6.4% 5.1%
*ABE = Adult Basic Education; ASE = Adult Secondary Education; ESL = English-as-a-Second Language. ** Noncredit instruction provides activities that do not meet ICCB Rules for credit courses, such as those designed for specific employers, professional development, or others offered for hobby, leisure, or recreational purposes.
Illinois Community College System More detailed curriculum-level data about Illinois Community College System students and graduates are available through the ICCB Databook (Table III-3 and Table III-9). ICCB Databook - http://iccbdbsrv.iccb.org/databook/home.cfm Source of Data: ICCB Centralized Data System !
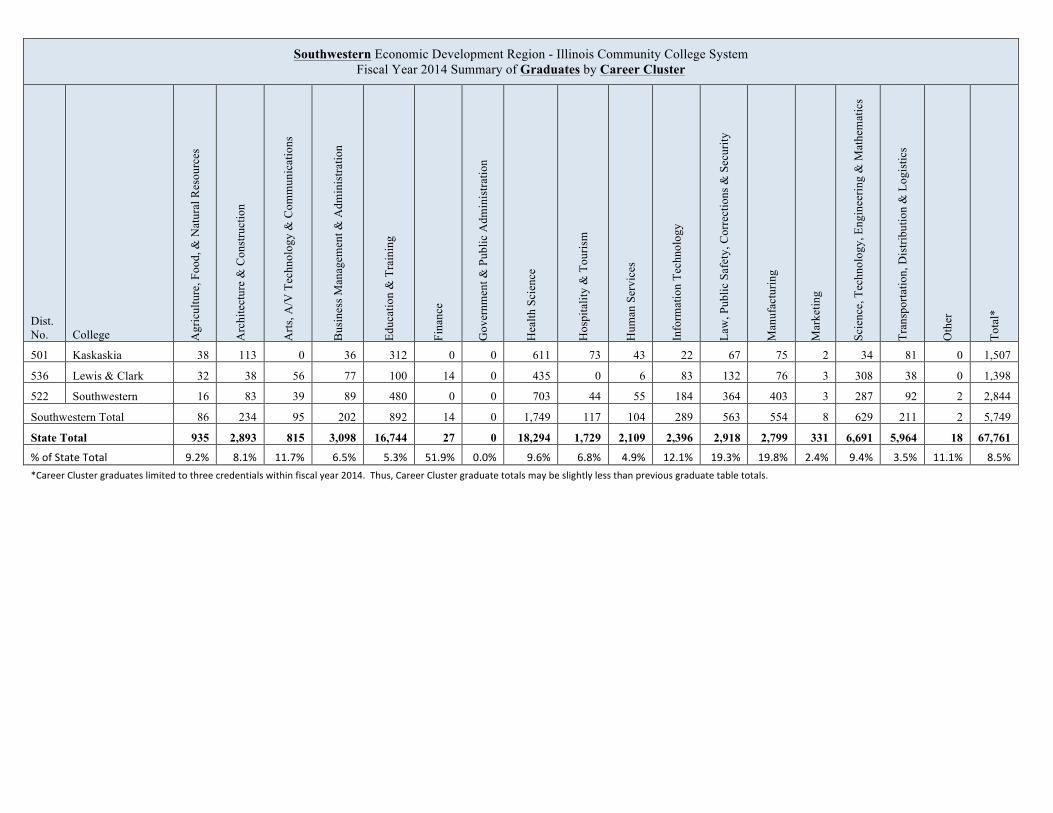
Southwestern Economic Development Region - Illinois Community College System Fiscal Year 2014 Summary of Graduates by Career Cluster