Buddhi Prakash Jangid, M.T. Bushair, S. Indira Rani, and John P. George National Centre for Medium Range Weather Forecasting (NCMRWF) Earth System Science Organization Ministry of Earth Sciences, Noida, INDIA Impact of hyperspectral radiances in 4D-VAR data assimilation system 22 nd International TOVS Study Conference (ITSC-22), Saint-Sauveur, Canada
Transcript
Buddhi Prakash Jangid, M.T. Bushair, S. Indira Rani, and John P. George
National Centre for Medium Range Weather Forecasting (NCMRWF)Earth System Science Organization
Ministry of Earth Sciences, Noida, INDIA
Impact of hyperspectral radiances in 4D-VAR data assimilation system
22nd International TOVS Study Conference (ITSC-22), Saint-Sauveur, Canada
Acknowledgements
NCMRWF , Ministry of Earth Sciences, India
ITWG to providing fund for attending the conference
Overview
1. Introduction2. Design of experiment3. Hyper-spectral sensors used in 4d-var assimilation4. Impact of Hyper-spectral radiances on other satellite instruments5. Global assimilation and forecast6. Comparison of Rainfall forecast with IMD gridded Rainfall7. Comparison with Radiosonde Observations 8. Summary
Introduction Multispectral remote sensing is defined as the collection of reflected, emitted, or backscattered energyfrom an object or area of interest in about 3 to 20 multiple bands of electromagnetic spectrum; whileHyperspectral remote sensing involves data collection in hundreds or thousands of bands.
Hyperspectral sensing improve both the spatial and spectral resolution.
Hyperspectral imaging measures contiguous spectral bands, as opposed to multispectral imaging whichmeasures spaced spectral bands.
Example of multispectral sensor: Landsat Multispectral Scanner, NOAA Advanced Very High resolutionradiometer, INSAT-3D Imager, etc.
Example of Hyperspectral sensors: Atmospheric Infrared Sounder (AIRS) on-board NASA-AQUAsatellite, Infrared Atmospheric Sounding Interferometer (IASI) aboard both MetOp-A and MetOp-B andCross track Infrared Sounder (CrIS) on-board Suomi-NPP satellite
Credit: www.markelowitz.com
weighting function of multispectral and hyper-spectral sensors
Weighting function ofMultispectral MicrowaveAMSUA for 15 channels andInfrared HIRS for 19 channelsWeighting function ofHyper-spectral AIRS for 2378channels and IASI for 8461channelsAll the channels are notused in assimilationOnly those channels whichcontribute in NWP are used inassimilation channels selection dependson the sensitivity of channel
source: https://slideplayer.com/slide/8002026/
Design of experiment
Two experiments are designed : Assimilation and forecast system – NCMRWF’s Unified Model (NCUM) Resolution- 17 kmExperiment run- Assimilation of hyper-spectral radiances along with otherconventional and satellite observations Hyper-spectral radiances from AIRS, IASI and CrIS.Wind from Satwind and Scatwind. Radiances from Polar orbiting satellite sensor AMSR, MTSAPHIR, ATOVS,GMILOW, GMIHIGH, MWSFY3C, SSMIS. Radiances from Geostationary satellite sensor INSAT-3D, SEVIRICLEAR,AHICLEAR, GOESCLEAR.GPSRO Conventional observations from AIRCRAFT, SONDE, SURFACE, GROUNDGPS.
Control run - Hyper-spectral radiances from AIRS, IASI and CrIS are denied. Other conventional and satellite observations are assimilated.
Period- 1st May to 31st May 2018 5-day forecasts are computed based on 00 UTC initial condition of each day.
Sensor Total No. of Channels Selected channels for data Assimilation
Assimilating Channels
IASI 8461 314 135
AIRS 2378 324 128
CrIS 2211 399 132
Hyper-spectral sensors used in 4d-var assimilation
Hyperspectral radiances from Atmospheric Infrared Sounder (AIRS) on-board NASA-AQUAsatellite, Infrared Atmospheric Sounding Interferometer (IASI) aboard both MetOp-A andMetOp-B and Cross track Infrared Sounder (CrIS) on-board Suomi-NPP satellite areassimilated. AIRS and CrIS have 2378 and 2211 spectral channels respectively, whereas IASIhas 8461
Out of thousands channels, only Few channels are selected for assimilation depending onthe sensitivity to humidity, temperature and NWP contribution.
Spatial coverage plot for particular assimilation cycle of AIRS, CrIS and IASI
Spatial coverage plot for hyper-spectral instruments
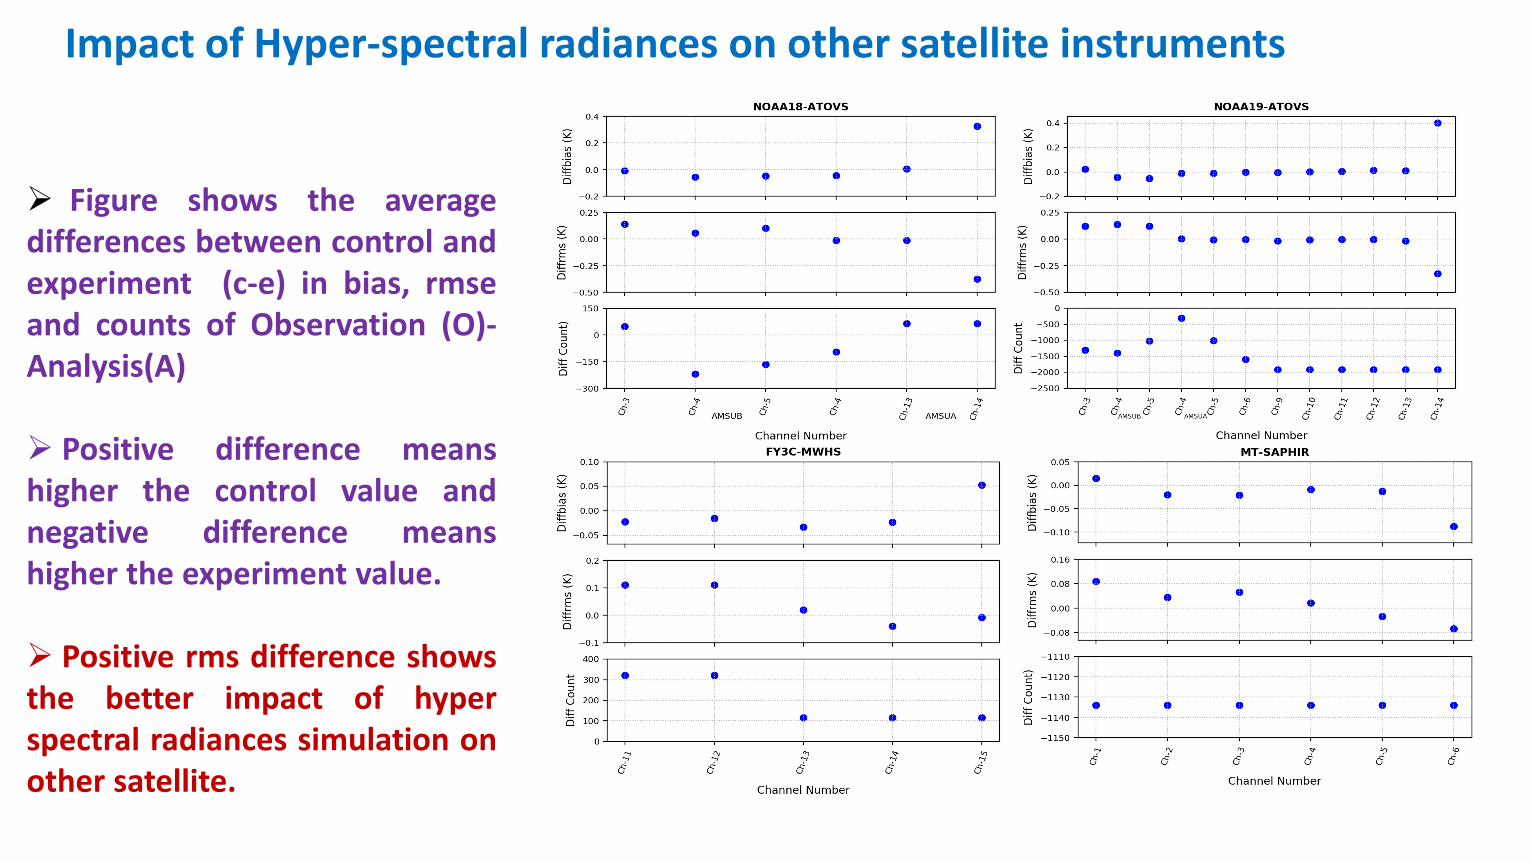
Impact of Hyper-spectral radiances on other satellite instruments
Figure shows the averagedifferences between control andexperiment (c-e) in bias, rmseand counts of Observation (O)-Analysis(A)
Positive difference meanshigher the control value andnegative difference meanshigher the experiment value.
Relative humidity and temperature forecast plot at100 hPa for day-1, day-3 and day-5 forecast
Top Figures show theforecast mean differences (c-e)in Relative Humidity (RH) andbottom figures show theforecast mean differences (c-e)in temperature at 100 hPa forDay-1, Day-3 and Day-5.
Forecast mean differencesin (i) RH are large positive overtropics, whereas, (ii)Temperature are positive overnear equatorial region andnear the Australia whilenegative above 300 N forday-1, day-3 and day-5 at 100hPa.
Relative humidity and temperature forecast plot at 500hPa forday-1, day-3 and day-5 forecast
Positive differences in RHover Indian Land Mass, ArabianSea and Bay of Bengal for day-1.
Mixed type of both positiveand negative differences can beseen in RH for day-3 and day-5.
Larger negative differences intemperature can be seen overextra tropics in southernhemisphere for day-1 whileboth positive and negativedifferences over extra tropicsin both the hemisphere for day-3 and day-5.
Relative humidity and temperature forecast plot at 850 hPafor day-1, day-3 and day-5 forecast
Largely positive differences inRH over Arabian sea at lowerlevel for Day-1 and Day-3forecast.
Mainly, Higher positivedifferences in temperature canbe seen for day-1, day-3 andday-5 forecasts.
Wind forecast plot at 100 hPa and 500 hPa for day-1, day-3 and day-5 forecast Figures show the
forecast mean differenceof control andexperiment (c-e) in windfield at 100 hPa and 500hPa
At 100 hPa, wind fieldchanges is more overtropics for day1, day3 .
At 500 hPa pressurelevel, wind field changesare less over tropics butmore over extra tropicsfor day1, day3 and day5.
Figures show the forecast mean difference of control and experiment (c-e) in wind field at 850hPA.
At 850 hPa presure level, wind field changes are less over tropics but more over the extra tropicsfor day1, day3 and day5.
Wind forecast plot at 850 hPa for day-1, day-3 and day-5 forecast
CNTL
EXP
Comparison of Rainfall forecast with IMD gridded Rainfall
OBS
IMD 0.25 degreegridded rainfallmonthly average overIndia
Monthly averageof EXP over India
Monthly averageof CNTL over India
S. No. Station Station ID LAT (°N) LON (°E)
1. Patiala 42101 30.33 76.47
2. Nagpur 42867 21.10 79.05
3. Thiruvananthapuram 43371 9.95 76.27
4. Karaikal 43346 10.92 79.83
5. Amini Divi 43311 11.12 72.73
Comparison with Radiosonde Observations
Patiala Nagpur Thiruvananthapuram Karaikal Amini Divi
EXP (F-O) CNT (F-O)
Validation of Specific Humidity with Radiosonde Observation at different locations
Patiala Nagpur Thiruvananthapuram Karaikal Amini Divi
Validation of Zonal wind and potential temperature with Radiosonde Observation at different locations
EXP (F-O) CNT (F-O)
Summary Channel-3,4,5 of AMSU-B in ATOVS NOAA-18 and NOAA-19 shows the more impactby the hyper-spectral radiances assimilations, whereas, Channel-4 and 13 of NOAA-18 AMSUA and channel 4-13 of NOAA-19 AMSUA has neutral impact and Channel-14of both NOAA-18 and NOAA-19 shows negative impact of hyperspectral assimilation.
Channel 11, 12, 13 of MWHS and channel 1-4 of MT-Saphir are positivelyinfluenced by hyperspectral assimilation, while channel 14,15 of MWHS and channel5,6 of MT-Spahir are negatively influenced.
At higher level, RH shows large positive differences over tropics means EXPforecasted dry weather for day-1, day-3 and day-5, whereas EXP forecasted coldtemperature over arabian sea and Southern India Ocean and warm temperature nearthe Australia.
At 500 hpa, EXP forecasted both dry and moist weather for all days, whereas EXPforecasted cold temperature over Indian ocean.
At lower level, EXP shows warm temperature and both dry and moist weather.
At higher level, changes in wind field are more over tropics for day-1 and day-3
At 500 and 850 hPa, difference in wind vector is less over tropics and more overextra tropics for day-1, day-3 and day-5.
CNT and EXP both shows over-prediction in rainfall forecast.