63
Investor Presentation January 2016 1

Investor Presentation
January 2016
1

2
Disclaimer and Warning About Language
This presentation has been prepared in order to inform investors.
All information in this document is classified and as such may not be disseminated, copied, altered or changed in any way, nor
may this information be printed for distribution purposes or forwarded as electronic attachments.
No representation or warranty, whether express or implied, as to the accuracy or completeness of this Company Presentation is
made or given by the Company, or any other person in relation to the Company. Any statement or commitment is not given in
verifying the feasibility and the reasonability of the projections, targets and estimates contained in this presentation.
In addition, the information contained in this presentation is not audited or independently verified by Ak Investment, the institution
that will perform management, arranging and sales operations in the sales to qualified investors. Ak Investment does not make
any commitment to verify this information, provide additional information to the buyer, update this presentation or make any
corrections in it. In this context, Ak Investment or its officers do not accept any responsibility on the accuracy, fairness and
completeness of the information given in this presentation.
This presentation does not contain every information needed in order to make an investment decision.

Contents
3
• Group Overview
• Financial Overview
• Divisions
− Construction
− Development
− Energy
• Bond Issue
• Appendix

Overview of the Rönesans Group Business
4
• Established in 1993
• Rönesans Holding is incorporated in Ankara
• Ultimate controlling party and major shareholder is the founder, Erman Ilıcak
• 35.7k employees (as of end-December 2015)
Rönesans Holding A.S.
Construction Development Energy
Provides contracting and construction
engineering services on commercial
buildings, industrial plants, and
infrastructure projects
Ranked #37 in 2015 worldwide, #10 in
Europe, Renaissance Construction in the
ENR Top 250 International Contractor’s
since 2006 in the top 100
Backlog of US$7.9bn as of end-September
2015
Develops commercial real estate such as
shopping malls, office buildings and
healthcare PPP projects
Leading player in Turkey and Russia with
20 income generating and 9 under real
estate properties
Net asset value (net of debt) of real estate
portfolio is US$2.3bn (2015E)
Hospital PPP projects of RSY with a total of
9,500 beds to be developed over 3.2m sqm
portfolio
Operational hydro portfolio size of 114 MW
and 313 GWhr of generation
Focused on electricity generation and
wholesale activities
Carries also a license development portfolio
at various phases
* Heavy Industries and Infrastructure businesses operate in all geographies and support the local businesses as specialized
units. Currently, Heavy Industries operates in Russia and Turkmenistan; Infrastructure operates in Germany, Switzerland,
Austria, Finland and Russia

TL110m
TL23m
Organization Chart
Rönesans Holding A.Ş.
5
RGHRCI REN
İpek Ilıcak (2.5%)
Bahar Ilıcak (2.5%)Erman Ilıcak
95% 5%
RGY RSYDESNA Other
Construction
• Residential
• Seaport
Energy
TL5,794m
TL1,273m
TL5,777m
TL2.408m
TL261m
TL187m
Revenues 2015E
Gross Profit 2015E
Turkey Real
Estate
Developme
nt
Russia Real
Estate
Developme
nt
Healthcare
PPPs Construction
Development
Energy
Rönesans Emlak
Geliştirme Holding
RC Ronesans
İnşaat Taahhüt A.Ş.Ronesans Enerji

Milestones in Group History – Celebrating 22 Years
6
Erman Ilıcak establishes
his fit-out contracting
business in St.Petersburg,
Russia
Moscow
office is
launched
The Group’s real estate
investment arm in Turkey
and Russia
Invests in a minority
stake at PORR
Enters ENR’s Top 100:
Ranks 61st in ENR225
Global and becomes 2nd
biggest contractor in
Russia
First out of 8 contracts
with IKEA for Mega
malls in Russia First contracts in Iraq
Heavy Industries
business is launched
First contracts in
Libya and
Turkmenistan
Ranks 64th on the ENR
Top 250 International
Contractors list, Top
Turkish contractor
Acquires Alpine’s stake in
Gotthard Tunnel and
launches transport
iinfrastructure business
Optimum Ankara,
the Group’s first
shopping mall opens
Optimum
Istanbul opens
4th office project
opens in
St.Petersburg
Group’s investment arm
in electricity generation
in Turkey
GIC Singapore
invests in 3
Optimum Malls
First
hydroplant
(HEPP)
becomes
operational
114MW operational HEPPs,
1,340MW license development
1st office project
opens in
St.Petersburg
3rd Piazza opens
1st office project
opens in Istanbul
3rd Aura opens in
Russia
MoscowCity project
launched
1st Aura shopping
mall opens in Russia
The group’s investment arm
in healthcare concessions
Portfolio of 5 projects, total
6,800 beds
Partnership on Adana PPP with
Meridiam
Piazza mall
developments
start in Turkey
4th Optimum
opens
Ranks 53rd on
the ENR Top 250
International
Contractors list
Acquires
Heitkamp of
Germany with
power sector
expertise
GIC takes
21% stake in
RGY, the
Turkish real
estate
platform
1993 2000 2001 2004 20092008200720062005 2010 2011 2012 2013 2014 2015
Acquisition of
Ballast
Nedam
Ranks
37th the
ENR Top
250,#10
in Europe

7
Russia and CIS
Employees: 24,634
Revenue: US$2,279m
Construction Backlog: US$4,813m
Real Estate Operational GLA: 228k m2
Russia
Türkmenistan
Azerbaijan
Kazakhistan
Belarus
Construction Investments
General
Building
Industry and
Infrastructure
Commercial
Real Estate Concessions Energy
Turkey and Europe
Employees: 4,895
Revenue: US$561m
Construction Backlog: US$2,798m
Real Estate Operational GLA: 495k m2
Note: Excluding Ballast Nedam acquisition
Turkey
Switzerland
Germany
Austria*
Finland
Middle East and Africa*
Employees: 1,523
Revenue: US$153m
Construction Backlog: US$288m
Iraq
Nigeria
Gabon
Mozambique
Qatar
*Only offices
Also, in addition, presence in KSA and new office in Algeria
Note: Employees (including subcontractors) as of Dec 2015, backlog and GLA (not stake adjusted) as of Sept’2015
Revenues as of Full Year 2014 after eliminations.
Geographical Focus of >35k Employees (end-2015)
*

8
Note: Reporting currency is TL, table reflects US$ values converted at the respective year’s central bank rates
* Revenue split before eliminations and asset split after eliminations
** IFRS EBITDA is based on equity pick-up method, Adjusted EBITDA reflecting proportionate consolidation is US$ 625mn
0,6 0,9 0,8
1,4
2,4
3,0
0,9
2,1
1,7 2,3
3,0
4,1
5,4 4,9 5,0
5,4
Revenues (US$ bn) Total Assets (US$ bn)
CAGR:
24%
CAGR:
21%
Financial Highlights (US$ m) 2008-2015E
Energy
94%
4%
1%1%
Construction
DevelopmentOther
Energy
Construction
Development
Other
36%
60%
4%
0%
2014 Revenue Breakdown by Segment* 2014 Asset Breakdown by Segment*
• IFRS EBITDA of US$523m**
• Net Debt of US$751m
0,5
1,2 1,3 1,5
2,0 2,0 2,1 2,0
Total Equity (US$ bn)
CAGR
26%
Key Figures for 2014

Partnerships at a glance
9
Platform level
Institution Info
GIC
(Government
of Singapore
Investment
Fund)
Became Minority
Shareholder with
21.4% through
capital increase
at Turkey real
estate platform,
RGY
4Q 2014
€250m injected
into RGY
Strategic benefits: Funding strategy, Equity raising, Risk diversification, Future exits
Some Consortium Partnerships
Institution Info
Sojitz
- Gazprom Salavat Acrylic
Acid Plant Project, Russia
- Ammonia&urea plant,
Turkmenistan
Gama - Yamal LNG (JV)
Mitsubishi
-Gazprom Salavat Acrylic Acid
Plant Project
-Phosagro Ammonia Plant
Kawasaki
Heavy
Industries
-Ammonia&urea plant,
-GTG plant Turkmenistan
YamataZapsib-2 Ethylene Cracker
Unit
Mitsui Turkmenhimiya Sulphuric Acid
Plant
Key Project/Asset level Partners
Institution Info
GIC
50% JV Partner in
Optimum malls:
Ankara, Istanbul,
Izmir
2012-2013
AGP
(Amstar
Growth
Properties)
Partnered at
development stage in 6
projects with 50%
(since 2009)
Meridiam
Partnered at
development stage with
joint management
rights in 4 projects;
Adana,Elazig, Yozgat,
Bursa
(2013-15)
10
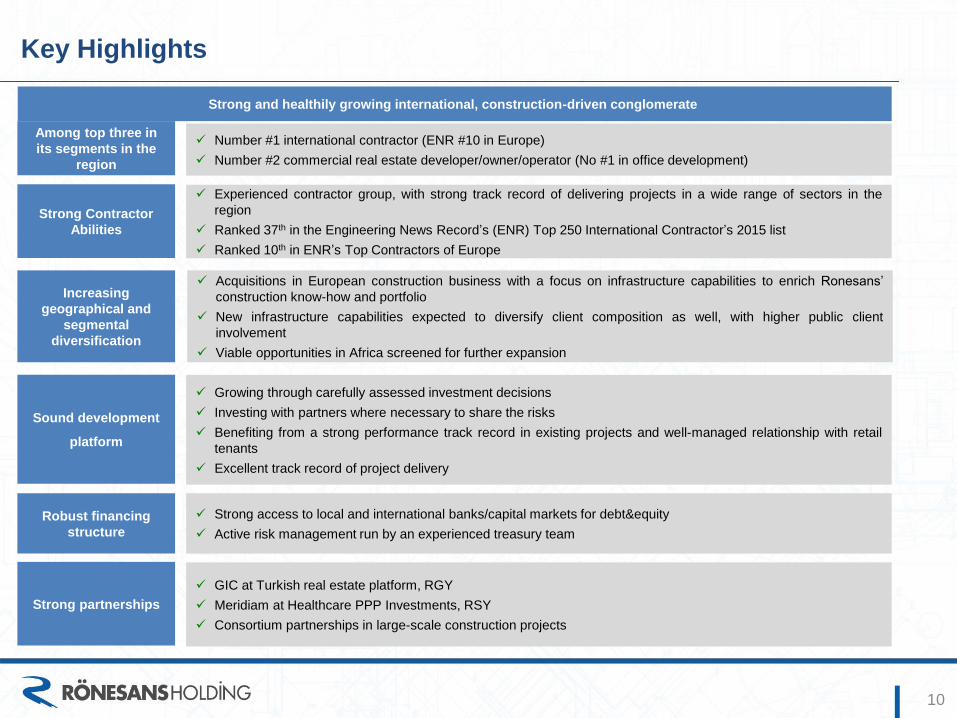
Key Highlights
Strong and healthily growing international, construction-driven conglomerate
Among top three in
its segments in the
region
Number #1 international contractor (ENR #10 in Europe)
Number #2 commercial real estate developer/owner/operator (No #1 in office development)
Strong Contractor
Abilities
Experienced contractor group, with strong track record of delivering projects in a wide range of sectors in the
region
Ranked 37th in the Engineering News Record’s (ENR) Top 250 International Contractor’s 2015 list
Ranked 10th in ENR’s Top Contractors of Europe
Increasing
geographical and
segmental
diversification
Acquisitions in European construction business with a focus on infrastructure capabilities to enrich Ronesans’
construction know-how and portfolio
New infrastructure capabilities expected to diversify client composition as well, with higher public client
involvement
Viable opportunities in Africa screened for further expansion
Sound development
platform
Growing through carefully assessed investment decisions
Investing with partners where necessary to share the risks
Benefiting from a strong performance track record in existing projects and well-managed relationship with retail
tenants
Excellent track record of project delivery
Robust financing
structure
Strong access to local and international banks/capital markets for debt&equity
Active risk management run by an experienced treasury team
Strong partnerships
GIC at Turkish real estate platform, RGY
Meridiam at Healthcare PPP Investments, RSY
Consortium partnerships in large-scale construction projects

11
Notes on Risks and Challenges
Operating in a turbulent region with robust market position and flexible maneuvering capabilities
Russia Exposure
Construciton
A wide range of clients with a private–driven client portfolio (rather than public) exposes Ronesans to a diversified
client exposure
Well-established presence and long history in Russia along with internalized know-how provide competitive
advantages: some worldwide big contractors cannot enter Russia due to difficulties of new entrance and lack of
quality-outsourcing possibilities
Strong alliances and consortiums further bring in complementary know-how and increase chances of winning in
big-ticket contracts
Increasing geographical and segmental diversification, where acquisitions enrich construction activities in Europe
as well as provide entry to new segments (i.e.infrastructure)
Rent re-negotiations well-managed: in some assets a mix of fixing of rent currencies/switch to Ruble contracts are
accepted to maintain tenants’ health in performance
The profitability margins are mainly preserved
Mall occupancy rates are well-preserved: Aura Surgut at 98% (2014:98%), Aura Yaroslavl at 95% (2014: 92%)
New leasing: Primarily in Aura Yaroslavl, a total of net 2k sqm occupied by new tenants
Office occupancy rates well-preserved: ~80% (2015=2014)
Successful cost management initiatives provide buffer to Ronesans for maneuvering through market downturns
Diligent real estate
development /
business
development in other
operations
Increasing inclination towards switching to pure-project finance : refinancing initiatives being taken where optimal
A natural hedge principle is in place, where operational cash flows are matched with financial outflows
Through centrally established Treasury Department overseeing all the Group’s receivables/payables, financial
hedge initiatives are executed on a wide and holistic scale
Financing
Investment decisions always follow market sanity checks including demand-consultancy as well as financing potential
Only well-financed projects go through with equity commitments at about 20-30% of total cost
Two major pipeline projects in Russia, Moscow City and Morskoy Façade, carry no investment obligation,
hence Ronesans has carefully slowed down the works on these projects until market conditions improve
Potential partnership possibilities are always explored to diversify risk
Russia Exposure
Real Estate

Contents
12
• Group Overview
• Financial Overview
• Divisions
− Construction
− Development
− Energy
• Bond Issue
• Appendix

Holding – Financial Overview (TL m)
13
Holding P&L (TLm) FY12 FY13 FY14 % y/y 1H13 1H14 1H15 % y/y
Revenues 2,588 4,480 6,544 46% 1,995 2,821 2,408 -15%
Cost of Revenues -2,177 -3,755 -5,629 50% -1,680 -2,419 -2,074.22 -14%
Gross Profit 411 726 914 26% 315 402 334 -17%
Gross Margin 15.9% 16.2% 14.0% - 15.8% 14.3% 13.9% -
G&A -156 -213 -253 18% -113 -126 -154 22%
S&M -6 -6 -5 -16% -4 -3 -2 -43%
Net Other Operating Income 168 1,648 1,084 -34% 1,004 158 367 132%
EBIT 417 2,154 1,741 -19% 1,202 431 545 27%
EBITDA 449 2,229 1,823 -18% 1,241 474 596 26%
EBITDA margin 17.3% 49.8% 27.9% - 62.2% 16.8% 24.7% -
EBITDA excluding net other oper.income 281 581 739 27% 237 316 229 -27%
margin 10.9% 13.0% 11.3% - 11.9% 11.2% 9.5% -
Net Income (Expense) from investing activities 1 106 35 -67% 6 11 5 -58%
Share on P&L of Inv's valued using Equity Pick-Up 91 279 224 -20% 97 134 166 24%
Net Financial Income (Expense) -125 -475 -1,261 166% -266 -217 -168 -23%
Tax expenses -41 -282 -119 -58% -160 -43 -107 150%
Net Income 342 1,782 619 421% 879 316 441 -64%
Net margin 13.2% 39.8% 9.5% - 44.0% 11.2% 18.3% -
Geographical Revenues (TL m) 1H14 1H15
Turkey 349 447
Russia 2,067 1,529
Middle East-Africa 122 167
Turkmenistan 187 46
Europe 65 119
Other 31 100
Total 2,821 2,408
Source: Financials audited by Deloitte

14
Note: Reporting currency is TL, table reflects US$ values converted at the respective year’s central bank rates
• Revenue split before eliminations and asset split after eliminations
• ** IFRS EBITDA is based on equity pick-up method, Adjusted EBITDA reflecting proportionate consolidation is US$265m
2,0
2,8 2,4
1H 2013 1H 2014 1H 2015
9,2
12,0 13,4
1H 2013 1H 2014 1H 2015
Revenues (TL bn) Total Assets (TL bn)
Financial Highlights (1H13-1H15)
Energy
89%
4%
2%5%
Construction
DevelopmentOther
Energy
Construction
Development
Other
34%
61%
4%
1%
1H 2015 Revenue Breakdown by Segment* 1H 2015 Asset Breakdown by Segment*
• IFRS EBITDA of US$200m**
• Net Debt of US$761m
3,6
4,7
5,7
1H 2013 1H 2014 1H 2015
Total Equity (TL bn)
Key Figures for 1H 2015

Holding 30.06.2015 - Financial Ratios
15
30 June 31 December
2015 2014 % Change
Current Ratio 1.27 1.28 (0.92%)
Quick Ratio 1.14 1.19 (4.10%)
Net Working Capital Ratio 0.08 0.09 (11.77%)
Debt Ratio 0.57 0.59 (2.84%)
Debt to Equity Ratio 1.35 1.45 (6.69%)
Asset Turnover 0.36 0.57 (36.90%)
30 June 31 December
2015 2014 % Change
Gross Profit Margin 13.87% 13.97% (0.1pp)
Operating Margin 22.64% 26.60% (4.0pp)
Net Profit Margin 18.33% 9.47% 8.9pp
Return on Assets (ROA) 6.61% 5.41% 1.2pp
Return on Equity (ROE) 15.53% 13.24% 2.3pp
Source: Financials audited by Deloitte

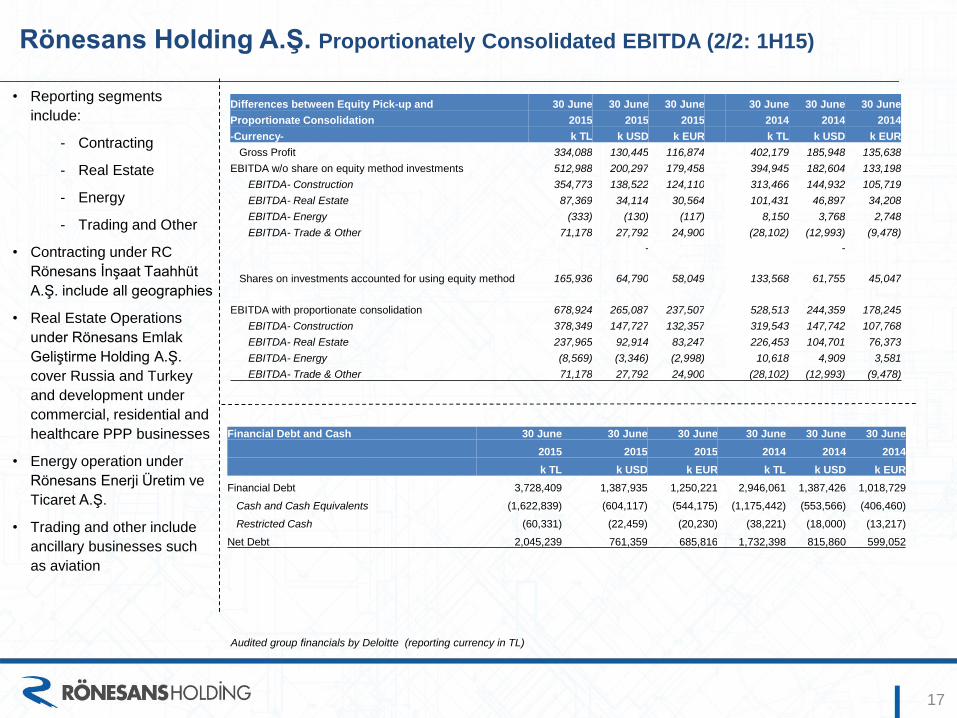
Rönesans Holding A.Ş. Proportionately Consolidated EBITDA (1/2: 2014)
16
• Reporting segments
include:
- Contracting
- Real Estate
- Energy
- Trading and Other
• Contracting under RC
Rönesans İnşaat Taahhüt
A.Ş. include all geographies
• Real Estate Operations
under Rönesans Emlak
Geliştirme Holding A.Ş.
cover Russia and Turkey
and development under
commercial, residential and
healthcare PPP businesses
• Energy operation under
Rönesans Enerji Üretim ve
Ticaret A.Ş.
• Trading and other include
ancillary businesses such
as aviation
Source: Audited group financials by Deloitte (reporting currency in TL)
31 December 31 December 31 December 31 December 31 December 31 December
2014 2014 2014 2013 2013 2013
k TL k USD k EUR k TL k USD k EUR
Gross Profit 914 418 315 726 381 287
EBITDA with equity pick-up method 1143 523 394 850 446 336
EBITDA- Construction 711 325 245 517 272 205
EBITDA- Real Estate 332 152 114 292 153 115
EBITDA- Energy 1 1 0 8 4 3
EBITDA- Trade & Other 99 45 34 33 17 13
Shares on investments acc. with equity method 224 103 77 279 147 110
EBITDA with proportionate consolidation 1367 625 471 1129 593 446
EBITDA- Construction 725 332 250 519 273 205
EBITDA- Real Estate 545 249 188 575 302 228
EBITDA- Energy -3 -1 -1 2 1 1
EBITDA- Trade & Other 99 45 34 33 17 13
Contracting Real estate Energy
Trading
and other Eliminations Total
Revenues 6,522 246 71 150 (445) 6,544
Gross Profit 746 186 -3 28 -43 914
Assets 4,056 6,879 483 2,492 (2,455) 11,455
31 December 2014
Rönesans Holding A.Ş. Proportionately Consolidated EBITDA (2/2: 1H15)
17
• Reporting segments
include:
- Contracting
- Real Estate
- Energy
- Trading and Other
• Contracting under RC
Rönesans İnşaat Taahhüt
A.Ş. include all geographies
• Real Estate Operations
under Rönesans Emlak
Geliştirme Holding A.Ş.
cover Russia and Turkey
and development under
commercial, residential and
healthcare PPP businesses
• Energy operation under
Rönesans Enerji Üretim ve
Ticaret A.Ş.
• Trading and other include
ancillary businesses such
as aviation
Audited group financials by Deloitte (reporting currency in TL)
Differences between Equity Pick-up and 30 June 30 June 30 June 30 June 30 June 30 June
Proportionate Consolidation 2015 2015 2015 2014 2014 2014
-Currency- k TL k USD k EUR k TL k USD k EUR
Gross Profit 334,088 130,445 116,874 402,179 185,948 135,638
EBITDA w/o share on equity method investments 512,988 200,297 179,458 394,945 182,604 133,198
EBITDA- Construction 354,773 138,522 124,110 313,466 144,932 105,719
EBITDA- Real Estate 87,369 34,114 30,564 101,431 46,897 34,208
EBITDA- Energy (333) (130) (117) 8,150 3,768 2,748
EBITDA- Trade & Other 71,178 27,792 24,900 (28,102) (12,993) (9,478)
- -
Shares on investments accounted for using equity method 165,936 64,790 58,049 133,568 61,755 45,047
EBITDA with proportionate consolidation 678,924 265,087 237,507 528,513 244,359 178,245
EBITDA- Construction 378,349 147,727 132,357 319,543 147,742 107,768
EBITDA- Real Estate 237,965 92,914 83,247 226,453 104,701 76,373
EBITDA- Energy (8,569) (3,346) (2,998) 10,618 4,909 3,581
EBITDA- Trade & Other 71,178 27,792 24,900 (28,102) (12,993) (9,478)
Financial Debt and Cash 30 June 30 June 30 June 30 June 30 June 30 June
2015 2015 2015 2014 2014 2014
k TL k USD k EUR k TL k USD k EUR
Financial Debt 3,728,409 1,387,935 1,250,221 2,946,061 1,387,426 1,018,729
Cash and Cash Equivalents (1,622,839) (604,117) (544,175) (1,175,442) (553,566) (406,460)
Restricted Cash (60,331) (22,459) (20,230) (38,221) (18,000) (13,217)
Net Debt 2,045,239 761,359 685,816 1,732,398 815,860 599,052

18
Ronesans Holding Debt & Commitment Breakdown (end-9M15)
RGH1.95445%
RCI95222%
REN3628%
HOL97523%
RHV842%
Holding Total Debt By Operation(TL m, %)
ST Bank Loan1.04424% Finance
lease992%
Corporate bonds43010%
LT Bank Loan2.75464%
Holding Total Debt By Type(TL m, %)
1.044
641
867
321
158
768
<1 year 1-2years
2-3years
3-4years
4-5years
5+years
Holding Bank Loan by Maturity(TL m)
USD2.097 55%
EURO1.543 41%
TL146 4%
Bank Loans by Currency (TL m, %)
Mortgages2.833 37%
Letter of guarantee
3.920 51%
Surety&Guarantee882
12%
Holding Commitments&Contingencies(TL m, %)
Total Financial Debt TL4,328m
Commitments&Contingencies TL6,606m

Rönesans Holding A.Ş. Financial Statements (1/2 : 2014)
19
Source: Audited group financials (reporting currency in TL)
31.12.2014 31.12.2013
ASSETS TL M TL M
Current Assets 4.722 4.493
Cash and cash equivalents 1.546 1.437
Trade receivables 1.208 1.176
Inventories 348 443
Prepaid expenses 260 423
Due from customers under construction contracts 535 304
Other current assets 287 345
Assets classified as held for sale 538 365
Non-Current Assets 6.733 7.007
Investments accounted for using the equity method 1.372 976
Investment properties 3.718 4.677
Property, plant and equipment 839 716
Intangible assets 164 157
- Goodwill 143 139
- Other intangible assets 21 18
Prepaid expenses 57 2
Deferred tax assets 96 139
Other non-current assets 641 341
TOTAL ASSETS 11.455 11.501
31.12.2014 31.12.2013
LIABILITIES TL M TL M
Current Liabilities 3.682 3.567
Short term financial debts 78 46
Short term portion of long term financial debts 863 415
Trade payables 562 565
Due to customers under construction contracts 178 217
Deferred revenue 1.220 1.627
Other short term liabilities 545 510
Liabilities directly associated with assets
classified as held for sale 236 187
Non-Current Liabilities 3.094 3.639
Long term financial debts 2.401 2.680
Other long term liabilities 693 959
SHAREHOLDERS' EQUITY 4.679 4.295
Equity Attributable to Owners of the Parent 4.183 4.069
Paid in capital 1.100 1.100
Retained earnings and other 3.031 1.270
Net profit for the period 548 1.699
TOTAL EQUITY AND LIABILITES 11.455 11.501

Rönesans Holding A.Ş. Financial Statements (1/2 : 2014)
20
Source: Audited group financials (reporting currency in TL)
31.12.2014 31.12.2013
P&L TL M TL M
- Revenue 6.544 4.480
- Cost of sales (-) (5.629) (3.755)
GROSS PROFIT 914 726
- General administrative expenses (-) (258) (219)
- Other operating income from main activities,net 1.084 1.648
OPERATING PROFIT 1.741 2.154
- Income from investing activities,net 35 106
- Share on profit / loss of investments valued - -
using equity method 224 279
- Financial expense (-) (1.261) (475)
PROFIT BEFORE TAXATION 739 2.064
Tax expenses (119) (282)
NET PROFIT FOR THE PERIOD 619 1.782
Allocation of net profit for the period
Non-controlling interest 71 83
Owners of the parents 548 1.699
619 1.782

Rönesans Holding A.Ş. Financial Statements (2/2 : 2015)
21
Source: Audited group financials (reporting currency in TL)
30.6.2015 31.12.2014
ASSETS TL M TL M
Current Assets 5.025 4.722
Cash and cash equivalents 1.623 1.546
Trade receivables 1.481 1.208
Inventories 519 348
Prepaid expenses 367 260
Due from customers under construction contracts 663 535
Other current assets 371 287
Assets classified as held for sale - 538
Non-Current Assets 8.338 6.733
Investments accounted for using the equity method 1.466 1.372
Investment properties 4.936 3.718
Property, plant and equipment 888 839
Intangible assets 261 164
- Goodwill 240 143
- Other intangible assets 21 21
Prepaid expenses 97 57
Deferred tax assets 122 96
Other non-current assets 787 641
TOTAL ASSETS 13.363 11.455
30.6.2015 31.12.2014
LIABILITIES TL M TL M
Current Liabilities 3.954 3.682
Short term financial debts 101 78
Short term portion of long term financial debts 842 863
Trade payables 457 562
Due to customers under construction contracts 197 178
Deferred revenue 1.803 1.220
Other short term liabilities 555 545
Liabilities directly associated with assets
classified as held for sale - 236
Non-Current Liabilities 3.725 3.094
Long term financial debts 2.786 2.401
Other long term liabilities 939 693
SHAREHOLDERS' EQUITY 5.683 4.679
Equity Attributable to Owners of the Parent 4.803 4.183
Paid in capital 1.100 1.100
Retained earnings and other 4.213 3.031
Net profit for the period 371 548
TOTAL EQUITY AND LIABILITES 13.363 11.455

Rönesans Holding A.Ş. Financial Statements (2/2 : 2015)
22
Source: Audited group financials (reporting currency in TL)
2015 (6-Month) 2014 (6-Month) 2014 (6-Month)
P&L TL M TL M TL M
- Revenue 2.408 2.821 6.544
- Cost of sales (-) (2.074) (2.419) (5.629)
GROSS PROFIT 334 402 914
- General administrative expenses (-) (155) (129) (258)
- Other operating income from main activities,net 367 158 1.084
OPERATING PROFIT 545 431 1.741
- Income from investing activities,net 5 11 35
- Share on profit / loss of investments valued
using equity method 166 134 224
- Financial expense (-) (168) (217) (1.261)
PROFIT BEFORE TAXATION 548 359 739
Tax expenses (107) (43) (119)
NET PROFIT FOR THE PERIOD 441 316 619
Allocation of net profit for the period
Non-controlling interest 71 12 71
Owners of the parents 371 304 548
441 316 619
Earnings per share 34% 28% 50%
Contents
23
• Group Overview
• Divisions
− Construction
− Development
− Energy
• Bond Issue
• Appendix

24
Growing competencies in heavy industries sector with projects like:
• Fertilizer and other gas chemicals plants
• One of a kind: gas to gasoline plant
• Polypropylene, PVC plants
• Acrylic acid, sulphuric acid plants
• Refineries
• Steel production facilities
• Other such as gas turbine test bench, oil extraction and processing
plants
Strategically increasing infrastructure exposure through acquisitions since
2009
3,0
3,8 4,3
6,5
7,5 7,9
2010 2011 2012 2013 2014 9M15
CAGR:
26%
ENR Listed Renaissance Construction with Steady Backlog Growth
Backlog, Period End (US$ bn)
Proven key competencies in building
construction as a leader in:
• Retail and business centers
• Public centers: education, government
• Hotels and recreation facilities
• Residential
• Infrastructure and transportation
• Light industry plants: automobile and
machinery, construction materials, food
industry, processing
Russia46%
Turkmenistan11%
Azerbaijan, Kazakhstan,
Belarus4%
Turkey33%
Europe2%
MEA4%
9M15 Backlog Distribution
40%
32%
20%
7% 2%
Commercial
Social & Government
Heavy Industry
Infrastructure
Light Industry

25
World Records
GBA= 330.000sqm
Height = 462 m
İstanbul İkitelli Integrated
Health Campus
• GBA= ~1.000.000sqm
Adana Integrated Health
Campus
• GBA= ~545.000sqm
In Lakhta Center’s main
tower
19,624m3 of concrete
pouring in 49 hours
Improving the world record
by 3,000m3
GBA= 464.700sqm
Completed in 23 months
İncludes the world’s highest
cylinder shaped aquarium (23
m)
Consisting of two
57‐kilometre‐long single‐track
tubes

26
Ronesans Construction Unit Overview
Ronesans Construction
General Buildings and
Light IndustryHeavy Industries Infrastructure
Medical and Healthcare
Campuses
• Since 1993
• Managed under three
distinct geographically
organized entities:
- Russia and CIS.
- Turkey
- Middle East and Africa
• Distinguishing focus:
- High rise buildings
- Retail, missed use and
commercial buildings
- Light industries and
processing plants
• Since 2011
• Active in Russia,
Turkmenistan
• Business development in
CIS, Turkey and Africa
• Distinguishing focus:
- Gas chemicals such as
fertilizer, polypropylene
plants
- Oil and gas processing
such as gas-to-gasoline
complexes
- Power plants
- Chemicals processing for
sulphuric, phosphoric acid
• Since 2009
• Active in Europe
• Built up of acquisitions by
- 2013: Hergiswil GmbH
from Alpine in Switzerland
- 2014: Heitkamp Ingenieur-
und Kraftwerksbau GmbH
in Germany
- 2015: Ballast Nedam NV
in the Netherlands
- 2009: minority share
purchase of Porr AG of
Austria
• Distinguishing focus:
- Transport infrastructure:
57km rail tunnel
- Energy infrastructure
• Since 2012
• Active in Turkey
• Dedicated to building large
integrated healthcare
projects
• Up to 3.2 million square
meters under contract

General Building and Light Industry: Selected Projects
27
Evolution Tower,
Moscow
GBA: 142k sqm
Contract: USD 291 mn
Client: Snegiri
Development
Avia Park, Moscow
GBA: 465k sqm
Contract: USD 450 mn
Client: AMMA Development
Telecom City, Moscow
Contract: USD 262 mn
Client: PPF Real Estate
Cement Plant, Kaluga
Contract: USD 145 mn
Client: LaFarge
Renaissance Tower,
Istanbul
GBA: 85k sqm
Contract: USD 88 mn
Client: Renaissance
Development: First LEED
Platinum office building
in Turkey
: Largest shopping mall in Europe
Unit1 Unit 2 Unit 3 Unit 4

General Building and Light Industry: High Rise Expertise
28
Federation Tower Renaissance Moscow Towers Evolution Tower Administrative & Trade Complex Renaissance TowerLakhta Center
Unit1 Unit 2 Unit 3 Unit 4

Mary Fertilizer Plant
Turkmenhimiya
JV with Kawasaki
Technology by KBR/Uhde/Stanicarbon
2011-2014
Heavy Industries: Selected Projects
29
* Excludes hydro electric power plant projects in Turkey and cement plant projects in Russia
ZapSib Neftekhim Petrochemical
Complex
Sibur
Technology by Linde
2015-2019 (all phases)
Togliatti Ammonia and Hydrogen
Plant
Linde Azot Togliatti
Subcontractor to Linde
Technology by Linde
2014-2016
Acrylic Acid Plant
Gazprom Neftekhim
JV with Sojitz and MHI
Technology by Mitsubishi Chemical
2013-2015
Stoilensky Gok Pelletizing Plant
NLMK Novolipetsk Steel
Siemens equipment, Outotec
processing technology
2014-2016
Gas Turbine Manufacturing Plant
GE
2013-2015
Ammonia Fertilize Plant
PhosAgro
JV with Sojitz and MHI
Technology by Haldor Topsoe
2014-2017
PVC Integrated Plant
RusVinyl: Sibur+Solvay JV
Subcontractor to Technip
2011-2014
Lebap Sulphric Acid Plant
Turkmenabat
JV with Mitsui
2013-2016
Gas to Gasoline Plant – Phase I
Turkmen Gas
JV with Kawasaki
Technology by Haldor Topsoe
2014-2018
Sunflower Oil Extraction Plant
Cargill
2013-2015
Vacuum Gasoil Deep Conversion
(Refinery Modernization)
LukOil
Subcontractor to Tecnicas Reunidas
2013-2015
Tobolsk Polypropylne Plant
Sibur
Subcontractor to Linde
2012-2014
Project Management and
Feasibility Studies
Turkey, Posco Steel Cold Rolling Mill
Facility, 2011-2012
Iraq, Ammonia Fertilizer Plant for
local private investor, 2012
Qatar, Low Density Polyethylene
Project Name
Client
JV partner if applicable
Technology provider if applicable
Project Start and End Dates
Unit 1 Unit 2 Unit 3 Unit 4

Infrastructure: Overview excl. Ballast Nedam
30
Porr Hergiswil Heitkamp
Renaissance acquired a stake
in Austrian Porr in 2009
Porr is Austria’s 2nd largest
construction company and a
full service provider in
infrastructure
Over 90% of workload
generated in five markets:
Austria, Germany,
Switzerland, Poland and the
Czech Republic
Ranked #72 in 2014 ENR
In 2013, Renaissance Construction
acquired 100% stake in the Alpine
Bau GmBH Hergiswil and its
participations in 3 JVs responsible for
the construction of the Gotthard Base
Tunnel with a total contract volume
above USD 1.1bn
The Gotthard Base Tunnel is a
railway tunnel that consists of two 57-
kilometre-long single-track tubes. The
total length of the tunnel system,
including all cross-passages, access
tunnels and shafts, is over 152 km.
In 2014, Renaissance Construction
acquired 100% stake in Heitkamp
Ingenieur- und Kraftwerksbau
GmbH (HIKB)
The company is specialized in
nuclear power and other thermal
power plants, cooling towers,
sewage treatment plants, and
industrial complexes
Unit 1 Unit 2 Unit 3 Unit 4

Infrastructure: Ballast Nedam 2015
31
1969: Merger of Ballast (founded in 1877) and Nedam (founded in 1899)
1994: Ballast Nedam listed at the Amsterdam Small Cap Index (AScX) of NYSE Euronext
2002: Sale of dredging division, focus on Dutch market with focus on integrated projects in transport
and social infrastructure, industrial sector
2015: One of the Netherlands' top six construction companies
Operating mainly in the Netherlands with approximately 2,500 employees
Ownership as of Dec 31, 2015: 98% Renaissance Infrastructure BV (a Renaissance company)
2% public free float
Zaanstad penitentiary A9 Gaasperdammerweg, AmsterdamA2 Maastricht A15 Maasvlakte - Vaanplein
Ministries of Security & Justice and the Interior, Den Haag Erasmus Medical Centre, RotterdamHigh-yield Waste Processing
Unit 1 Unit 2 Unit 3 Unit 4

Infrastructure: Ballast Nedam Divisions
32
Unit 1 Unit 2 Unit 3 Unit 4

Medical Construction Projects
33
Unit 1 Unit 2 Unit 3 Unit 4

34
Construction Backlog Overview
General Buildings and Light Industry
39%
Heavy Industries
23%Infrastructure
8%
Medical&Healthcare30%
2015E Backlog Breakdown by Unit
General Buildings and Light Industry
41%
Heavy Industries
20%
Infrastructure25%
Medical&Healthcare Concessions
14%
2016E Revenue Breakdown by Unit*
2016E Revenues more representative because of Ballast Nedam
Russia46%
Turkmenistan11%
Azerbaijan, Kazakhstan, Belarus
4%
Turkey33%
Europe2%
MEA4%
Latest (9M15-end) Backlog Breakdown by Region
Please see Appendix for detailed
Project Backlog as of 9M15-end

Contents
35
• Group Overview
• Financial Overview
• Divisions
− Construction
− Development
− Turkish Real Estate: RGY
− Russia Real Estate : Desna
− Healthcare PPPs : RSY
− Energy
• Bond Issue
• Appendix
36
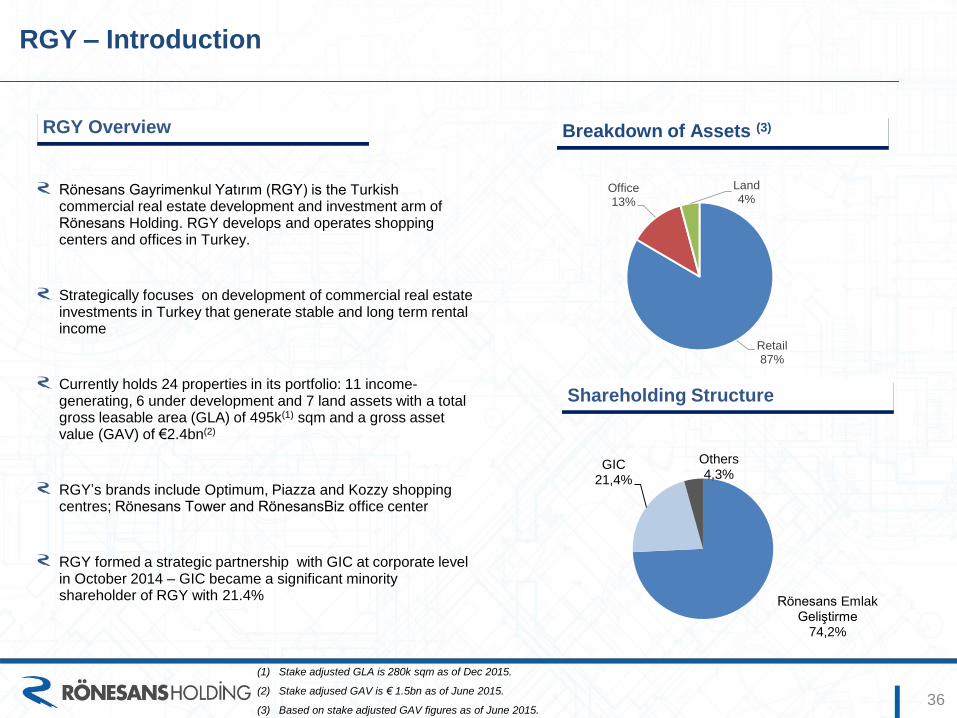
Shareholding Structure
Rönesans Gayrimenkul Yatırım (RGY) is the Turkish commercial real estate development and investment arm of Rönesans Holding. RGY develops and operates shopping centers and offices in Turkey.
Strategically focuses on development of commercial real estate investments in Turkey that generate stable and long term rental income
Currently holds 24 properties in its portfolio: 11 income-generating, 6 under development and 7 land assets with a total gross leasable area (GLA) of 495k(1) sqm and a gross asset value (GAV) of €2.4bn(2)
RGY’s brands include Optimum, Piazza and Kozzy shopping centres; Rönesans Tower and RönesansBiz office center
RGY formed a strategic partnership with GIC at corporate level in October 2014 – GIC became a significant minority shareholder of RGY with 21.4%
RGY Overview
(1) Stake adjusted GLA is 280k sqm as of Dec 2015.
(2) Stake adjused GAV is € 1.5bn as of June 2015.
(3) Based on stake adjusted GAV figures as of June 2015.
Breakdown of Assets (3)
RGY – Introduction
Retail87%
Office 13%
Land 4%
Rönesans EmlakGeliştirme
74,2%
GIC21,4%
Others4,3%

56 62
94
155
2015 2016 2017 2018
37
Dynamic shopping centre (SC) and office portfolio owner and developer; CAGR of GLA from 2008 to 2015 is %26.
Portfolio concentrated on retail assets with a
stake adjusted gross asset value of EUR
1.6 billion (100%: EUR 2.4 billion)
RGY covers all the stages of a real estate investment including initial land and
project development, leasing, property and asset management with its specialized
teams
Stake adjusted NOI in 2015 is expected as
€56m, it is expected to reach €155m in 2018
Investment
Development
Leasing
Property
Management
Asset Management
96196 211
281 336
502 495 495
2008 2009 2010 2011 2012 2013 2014 2015
GLA 000sqm
NOI €m
RGY – General Overview
Yielding60%
Under Development
34%
Land 6%
GAV Breakdown

38
Istanbul
Izmir
Ankara
Adana Gaziantep
Istanbul
Antalya
Samsun
Şanlıurfa
K. Maraş
Bursa
Location
İstanbul and Marmara R.
1. Optimum İstanbul
Ataşehir
2. Küçükyalı SC & Hotel
Maltepe
3. Kozzy
Kadıköy
4. Küçükyalı Office & School
Maltepe
5. Maltepe Mixed-Use Project
Maltepe
6.Mecidiyeköy Office
Mecidiyeköy
7.Ataşehir Office
Ataşehir
8.Ümraniye Land
Ümraniye
9. Park Bravo Land
Maslak
10. Silivri Land
Silvri
11. İzmit Land
İzmit
12. Bursa Land
Bursa
Ankara
13. Optimum Ankara
Eryaman
14. Mamak Land
İzmir
15. Optimum İzmir
Gaziemir
16. Konak Mixed-Use Project
Konak
17. Turan Mixed-Use Project
Bayraklı
18. Karşıyaka SC
Karşıyaka
Adana
19. Optimum Adana
Properties under development
Land
Retail
Office
Mixed use
Location
Antalya
20. Antalya Land
Gaziantep
21. Sanko Park
Samsun
22. Piazza Samsun & Anemon Hotel
Şanlıurfa
23. Piazza Şanlıurfa
K.Maraş
24. Piazza K. Maraş
A portfolio of 24 properties :
11 income generating
6 under development
7 in landbank
RGY – Portfolio Map

Top 10 Tenants by GLA (1) - Retail Top 10 Tenants by GLA (2) - Office
39
(1) Based on leased GLA as of end of Oct’15
(2) Rent from top 10 Tenants (Retail) corresponds to 20,4% of the total rent.
Tenant CategoryGLA
(Sqm)
% of total
GLA(1)# of
assets
Hypermarket 35.612 8,86% 8
DIY 21.527 5,36% 4
Electronics 19.812 4,93% 7
Clothing 17.915 4,46% 9
Clothing 15.131 3,76% 11
Cinema 14.821 3,69% 5
Entertainment 13.445 3,34% 8
Cinema 13.213 3,29% 4
Sportswear 9.391 2,34% 3
Clothing 8.210 2,04% 9
TOTAL (2)169.077 42,07 %
Lease maturity (% of leased GLA) Lease maturity (% of leased GLA)
Tenant CategoryGLA
(Sqm)
% of total
GLA(2)# of
assets
GSM 38.262 57,81% 1
Electronics 13.502 20,40% 1
Sportswear 5.310 8,02% 1
Clothing 3.168 4,79% 1
ult Insurance 2.434 3,68% 1
Food 688 1,04% 1
Electronics 631 0,95% 1
Agency 501 0,76% 1
Chemistry 370 0,56% 1
İk Food 267 0,40% 1
TOTAL 65.133 98,41 %
1
2
3
4
5
6
7
8
9
10
1
2
3
4
6
7
8
9
10
5
0,4%7,9% 2,4%
89,4%
0%
20%
40%
60%
80%
100%
2015 2016 2017 2018 2019 2020 2021>
1% 4% 2%13% 12% 8%
59%
0%
20%
40%
60%
80%
2015 2016 2017 2018 2019 2020 2021>
RGY – Tenant Base Lease Expiration Schedule (Oct’ 2015)

RGY – Rent Sustainability
40
12,3% 12,6%13,2%
11,6%
14,5%
15,4% 15,1%
16,2%
11,9%12,5%
10,7%
11,7%
13,3%14,2%
13,2%13,8%
14,4%
12,6%
0,0%
2,0%
4,0%
6,0%
8,0%
10,0%
12,0%
14,0%
16,0%
18,0%
İstanbul Ankara İzmir Kozzy Adana Samsun Maraş Urfa
Change in OCR (1) Actuals Last 12 Months End Q3 2015 Non LfL to Actuals Last 12 Months End Q3 2014 Non LfL
OCR Actuals Last 12 Months End Q3 2014Non LfLOCR Actuals Last 12 Months End Q3 2015Non LfLPortfolio Last 12 Months End Q3 2014 Non-LfL (k€)Portfolio Last 12 Months End Q3 2015 Non-LfL (k€)
Occ
up
ancy
Rat
es
(1) OCR is a method of the profitability calculation of a specific shop, as well as the overall performance of
the Shopping Center as a whole. Calculated by dividing the shops’ total cost into total turnover of the
shop, in the specific same period .
Mall 2015 Oct
İstanbul Optimum AVM 98,4%
Ankara Optimum AVM 94,6%
İzmir Optimum AVM 99,5%
Adana Optimum AVM 94,7%
Kozzy 98,4%
Samsun Piazza AVM 95,9%
Maraş Piazza AVM 92,6%
Urfa Piazza AVM 95,1%

Contents
41
• Group Overview
• Divisions
− Construction
− Development
− Turkish Real Estate: RGY
− Russia Real Estate : Desna
− Healthcare PPPs : RSY
− Energy
• Bond Issue
• Taxation
• Appendix

42
Shareholding Structure
Desna Gayrimenkul Yatirim A.S. (Desna) is the Russian commercial real estate development and investment arm of Rönesans Holding
Develops and operates offices, business centers.shopping centers and mixed type complexes in Russian Federation
Strategically focuses on development of commercial real estate investments that generate stable and long term rental income
Currently holds 14 properties in its portfolio: 9 income-generating, 3 under development and 2 land assets with a total operating gross leasable area (GLA) of 228(1) sqm and a gross asset value (GAV) of US$1.3bn(2)
Income generating properties: 2 shopping malls, 6 office buildings and 1 office/hotel complex
Desna’s shopping mall brand is Aura
Overview Breakdown of Assets in terms of GAV (2)
Desna – Introduction
RGH95%
5% Management
(1) Based on operating GLA and GAV are the same with total GLA and GAV as of Dec 2015.
(2) Based on stake adjusted GAV figures as of June 2015.
Operational; 65,2%
Under Dev.; 35%
Land Bank; 0,5%

Investment
Development
Leasing
Property
Management
Asset Management
43
Dynamic shopping centre (SC) and office portfolio owner and developer; CAGR of GLA from 2008 to 2015 is %26.
Portfolio concentrated on mall assets with a
stake adjusted gross asset value of
US$509m (100%: US$509m)
Desna covers all the stages of a real estate investment including initial land and
project development, leasing, property and asset management with its specialized
teams
Stake adjusted NOI in 2015 is expected as
US$49m, it is expected to reach US$66m in
2020
GAV Breakdown
NOI US$m
Desna – General Overview
43 43 52
127
193228 228 228
2008 2009 2010 2011 2012 2013 2014 2015
GLA 000sqm
Retail; 39%
Office; 26%
Under Dev.; 34%
Land; 0,5%
11 17 1529 27
58
77
49
2008 2009 2010 2011 2012 2013 2014 2015

44
Russia Portfolio: Office Overview
Pipeline (GLA of 13k sqm)
Construction (GLA of 21k sqm)
Opening and Operation (GLA of 100k sqm)
Renaissance Plaza
CBD
Renaissance Forum
CBD
Renaissance Hall
CBD
Renaissance Centre
Vyborgsky
Renaissance House
CBD
Renaissance Pravda
CBD
Renaissance Premium
CBD
Renaissance Business Park
Vyborgsky
Renaissance Crystal
CBD
Renaissance Fontanka
CBD
1
2
3
4
5
6
7
8
9
10
St. Petersburg
123
4
5
8
9 10 6
7

Russia Portfolio: Retail Overview
Moscow
Novosibirsk
Yaroslavl2
1
-
Surgut
3
St.Petersburg
Pipeline (85k sqm)
Opening and Operation
Exited
• Leading shopping malls in regional cities under Aura brand
- Novosibirsk: First Aura mall made operational in 2010, sold in 2013
- Surgut: Operational since 2012, GLA of 66k sqm
- Yaroslavl: Operational since 2013, GLA of 61k sqm
- St. Petersburg: Under development: Marine Façade Shopping Center, GLA of 85k sqm
Yaroslavl
St. Petersburg Marine Facade
45
Surgut

Top 10 Tenants by GLA (1) - Retail Top 10 Tenants by GLA (1) - Office
46
(1) Based on leased GLA as of end of Oct’15
(2) Rent from top 10 Tenants (Retail) corresponds to 20,4% of the total rent.
Lease maturity (% of leased GLA) Lease maturity (% of leased GLA)
1
2
3
4
6
7
8
9
10
5
DESNA Tenant Base Lease Expiration Schedule (Oct’ 2015)
Tenant CategoryGLA(
sqm )
% of total
GLA(1)
# of
Assets
Hypermarket 11 050 9% 1
Clothing 10 586 9% 2
Electronics 9 007 7% 2
Enternainment 5 261 4% 2
Clothing 5 047 4% 2
Clothing 4 884 4% 2
Cinema 4 586 4% 1
Sportswear 3 409 3% 2
Sportswear 3 345 3% 2
Clothing 3 268 3% 2
TOTAL 60 443 50%
Tenant CategoryGLA(
sqm )
% of total
GLA(1)
# of
Assets
Energy 11 364 15% 1
Construction 9 801 13% 1
Finance Ins. 5 983 8% 1
Finance Ins. 2 223 3% 1
Entertainment 2 154 3% 1
Technology 2 129 3% 1
Energy 1 477 2% 1
Transportation 1 178 2% 1
Healty 1 096 1% 1
Consulate 1 030 1% 1
TOTAL 38 435 51%
1
2
3
4
6
7
8
9
10
5
1%
10%4%
8%13%
64%
0%
10%
20%
30%
40%
50%
60%
70%
1Y 2Y 3Y 4Y 5Y +5Y
21%
7% 9%6%
23%
35%
0%
10%
20%
30%
40%
1Y 2Y 3Y 4Y 5Y +5Y
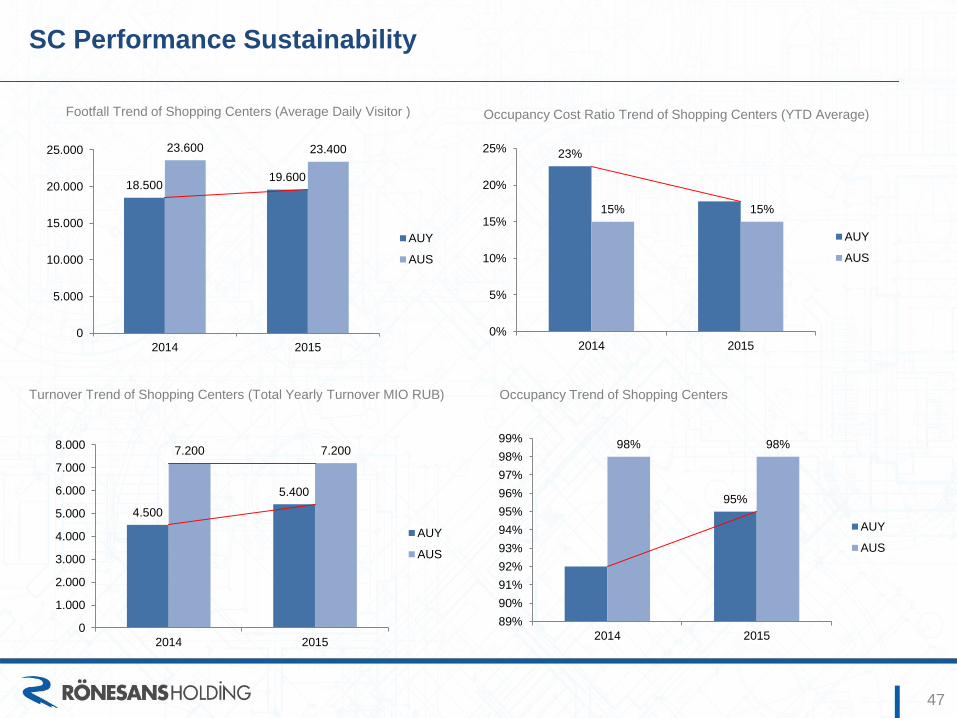
SC Performance Sustainability
47
Footfall Trend of Shopping Centers (Average Daily Visitor )
Turnover Trend of Shopping Centers (Total Yearly Turnover MIO RUB)
Occupancy Cost Ratio Trend of Shopping Centers (YTD Average)
Occupancy Trend of Shopping Centers
18.50019.600
23.600 23.400
0
5.000
10.000
15.000
20.000
25.000
2014 2015
AUY
AUS
4.500
5.400
7.200 7.200
0
1.000
2.000
3.000
4.000
5.000
6.000
7.000
8.000
2014 2015
AUY
AUS
23%
15% 15%
0%
5%
10%
15%
20%
25%
2014 2015
AUY
AUS
95%
98% 98%
89%
90%
91%
92%
93%
94%
95%
96%
97%
98%
99%
2014 2015
AUY
AUS

Contents
48
• Group Overview
• Divisions
− Construction
− Development
− Turkish Real Estate: RGY
− Russia Real Estate : Desna
− Healthcare PPPs : RSY
− Energy
• Bond Issue
• Appendix

Rönesans Healthcare Infrastructure Portfolio Overview
49
• Ministry of Health of Turkey launched its Build-Lease-Transfer program to enable private sector to build healthcare campuses and provide non-clinical services in return for yearly lease (availability) payments for an operational period of 25 years post construction term
• Close to 27,000 beds have been awarded via public tenders to pre-qualified bidders
• Ronesans Medical is the lead investor in 6 health campus projects reaching a portfolio of ~9,500 beds:
Project Name Number of beds Ronesans Share* (%)
Elazig 1,038 43.75%
Yozgat
(financial close)475
36.25%
(36.25% Meridiam Infrastructure)
Adana
(financial close)1,550
40.0%
(40% Meridiam Infrastructure)
Bursa 1,355 80.0%
Physical
Therapy Group2,400 80.0%
Ikitelli Istanbul 2,682 100.0%
Award Winning Financial Close
• Financial Close: Dec 2014
• Investment: EUR541m
• Loan: EUR433m (80/20 loan/equity ratio)
• Non recourse loan
• All subscribed by international lenders
• Development bank tranche with 18-year tenor total EUR230m
• Commercial bank tranche with 15-year tenor total EUR200m
* Remaining shares belong to minority Sıla Group and Şam unless
otherwise noted for Meridiam Infrastructure Fund

Rönesans Portfolio Above 3.2m sqm of Construction Area
50
Yozgat
(475)
Elazig
(1,038)
Locations (Number of beds)
Ankara
Bursa
(1,355)
Adana
(1,550)
Istanbul
Ikitelli
(2,682)
Physical
Therapy
Physical
Therapy
Physical
Therapy
Physical
Therapy
Physical
Therapy
Physical
Therapy
Physical
Therapy
Physical
Therapy
Location
Construction
Period
Building Area
(k sqm)
Parking
Area (k sqm)
Total
Construction Area (k sqm)
Elazig 3 years 202 93 365
Yozgat 2 years 85 45 141
Adana 3 years 297 140 545
Bursa 3 years 244 122 447
Physical Therapy 2 years 484 125 752
Ikitelli Istanbul 3 years 546 271 950

Rönesans Energy – Generation Overview
51
Rönesans Enerji, Rönesans Holding’s platform for energy, is focused on electricity generation and wholesale activities
Holds a portfolio of 2,074 MW at different stages of development (Ronesans’ stake adjusted capacity is 1,956 MW but may
increase during the course of development)
Yalnizca HEPP
16 MW
Kanyon CCGT
600 MW
Kale HEPP
30 MWOsmancik HEPP
9 MW
DC Hidro HEPP
700 MW
Sena HEPP
22 MW
Ozluce1 HEPP
37 MW
Operational 114 MW
License
Under Licensing development
1,960 MW
Klikya Impt. Coal2
660 MW
Run-off-river Dam Natural Gas Imported Coal
Rönesans Enerji
1 Ronesans stake 50% of 37 MW
2 Ronesans stake 85% of 660 MW
$2.6m
$20.8m
$2.7m
$53.2m$0.7m
$12.6m$1.3m
$29.5m
$4.0m
$42.5m2015E EBITDA :
End- 2015 Outstanding Debt :
Pre-License
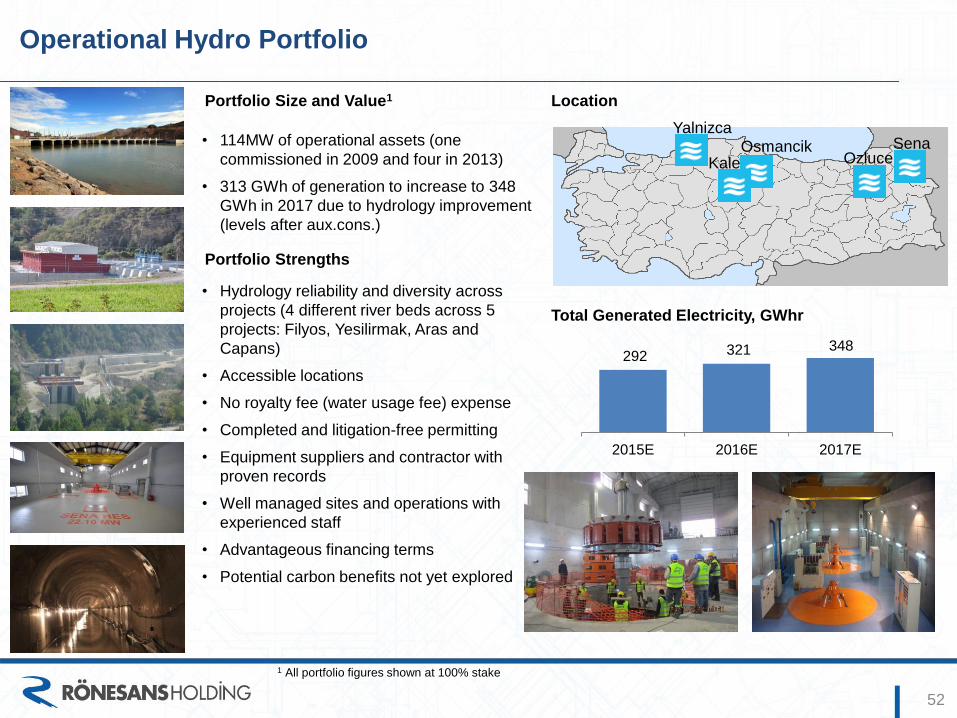
Operational Hydro Portfolio
52
• 114MW of operational assets (one
commissioned in 2009 and four in 2013)
• 313 GWh of generation to increase to 348
GWh in 2017 due to hydrology improvement
(levels after aux.cons.)
292 321 348
2015E 2016E 2017E
Total Generated Electricity, GWhr
1 All portfolio figures shown at 100% stake
Portfolio Strengths
• Hydrology reliability and diversity across
projects (4 different river beds across 5
projects: Filyos, Yesilirmak, Aras and
Capans)
• Accessible locations
• No royalty fee (water usage fee) expense
• Completed and litigation-free permitting
• Equipment suppliers and contractor with
proven records
• Well managed sites and operations with
experienced staff
• Advantageous financing terms
• Potential carbon benefits not yet explored
Portfolio Size and Value1
YalnizcaSena
OzluceKaleOsmancik
Location
53
• Group Overview
• Financial Overview
• Divisions
− Construction
− Development
− Energy
• Bond Issue
• Appendix
Contents

Summary Information
Issuer Rönesans Holding A.Ş.
Total Nominal Issue Size TL 100 million (may be increased according to the demand level)
Issue Type To be sold to Qualified Investors
Interest Type Floating
Term 1091 days
Coupon Payments Every 91th day (1st coupon payment to be paid on the 90th day)
Benchmark Rate for Coupon Rates 3-month TRLIBOR
Dates for Coupon Rate Calculation 3-month TRLIBOR two business days prior to each coupon payment date
Coupon Calculation Methodology (3-month TRLIBOR + Annual Spread) * Coupon Term (days) / 365
Annual Spread To be determined between 3.25% – 3.50%
Par Value TL 100
Bookbuilding Date 27 January 2016
Issue Date 29 January 2016
Maturity Date 24 January 2019
Quotation Outright Purchases and Sales Market under Borsa Istanbul’s Debt Securities Market
Intermediary Ak Investment
54

Timetable
Bookbuilding date 27.01.2016
Finalization of Allocation 27.01.2016
Settlement 29.01.2016
Commencement of Trading on BIST (Estimated) 01.02.2016
Investors must transfer the funds on 29 January 2016 by 12pm.
55

Coupon Payment Dates
Coupon Payment Dates Dates for Coupon Rate Calculation
1.coupon 28 April 2016 26 April 2016
2. coupon 28 July 2016 26 July 2016
3. coupon 27 October 2016 25 October 2016
4. coupon 26 January 2017 24 January 2017
5. coupon 27 April 2017 25 April 2017
6. coupon 27 July 2017 25 July 2017
7. coupon 26 October 2017 24 October 2017
8. coupon 25 January 2018 23 January 2018
9. coupon 26 April 2018 24 April 2018
10. coupon 26 July 2018 24 July 2018
11. coupon 25 October 2018 23 October 2018
12. coupon ve principal payment 24 January 2019 22 January 2019
56

57
• Group Overview
• Financial Overview
• Divisions
− Construction
− Development
− Energy
• Bond Issue
• Appendix
58
• Group Overview
• Financial Overview
• Divisions
− Construction
− Development
− Energy
• Bond Issue
• Appendix

JCR Rating As of July 2015
59

RGY – Asset List
60
(1) Amstar Global Partners. Real estate investment manager headquartered in Denver, USA, manages
approximately $ 2.0bn worth assets as of June 2015.
Project Type Location Status Ownership
# Assets RGY Stake Partner Stake
1 Optimum Ankara Shopping Centre Ankara Yielding 50% 50% (GIC)
2 Optimum Istanbul Shopping Centre İstanbul Yielding 50% 50% (GIC)
3 Optimum Izmir Shopping Centre İzmir Yielding 50% 50% (GIC)
4 Optimum Adana Shopping Centre Adana Yielding 50% 50% (AGP) (1)
5 Piazza Kahramanmaraş Shopping Centre Kahramanmaraş Yielding 50% 50% (AGP)
6 Piazza Samsun Shopping Centre Samsun Yielding 50% 50% (AGP)
7 Piazza Şanlıurfa Shopping Centre Şanlıurfa Yielding 50% 50% (AGP)
8 Kozzy Shopping Centre İstanbul Yielding 50% 50% (AGP)
9 Sankopark Shopping Centre Gaziantep Yielding 49% 51% (Sanko)
10 Mecidiyeköy Office İstanbul Yielding 100% -
11 Küçükyalı Office & School Office & School İstanbul Yielding 100% -
12 Maltepe Project Mixed-Use İstanbul Under-development 100% -
13 Küçükyalı SC & Hotel Mixed-Use İstanbul Under-development 100% -
14 Karşıyaka Shopping Centre İzmir Under-development 100% -
15 Bayraklı Project Mixed-Use İzmir Under-development 100% -
16 Konak Project Mixed-Use İzmir Under-development 50% 50% (Tekfen)
17 Ataşehir Office İstanbul Under-development 50% 50% (Acıbadem)
18 Tepeüstü Landbank İstanbul Landplot 50% 50% (Doğan)
19 Silivri Landbank İstanbul Landplot 100% -
20 Park Bravo Landbank İstanbul Landplot 100% -
21 Mamak Landbank Ankara Landplot 100% -
22 İzmit Landbank İzmit Landplot 100% -
23 Bursa Landbank Bursa Landplot 100% -
24 Antalya Landbank Antalya Landplot 100% -

RGY – Retail and Mixed Use Projects
61
Operational
Brands
Selected
New
Projects
• Leading outlet brand in major cities: Istanbul, Ankara, Izmir
and Adana
• Total number of Optimum visitors in 2015 is 42 million.
• Leading outlet brand in major cities: Samsun,
Kahramanmaraş, and Şanlıurfa
• Total number of Piazza visitors in 2015 is 40 million.
• Successful local malls prior to Piazza brands
Küçükyalı Shopping Centre &
Hotel
Maltepe İller Bankası Residence,
Office & Shopping Centre
İzmir Extension Project

RGY – Office Projects
62
• A-plus office development in Istanbul
• Mecidiyekoy project operational in 2013
• Kucukyali Office: leased to Bosch and Turkcell, operational in 2014
• Tower: Sold to Allianz in April 2015
Rönesans Tower –
sold to Allianz
RönesansBiz
Mecidiyeköy
Office
Ataşehir
Office
RönesansBiz
Küçükyalı
OfisPark
RönesansBiz
Mecidiyeköy
Office

Desna – Asset List
63
Name of Business Center Location Description of location Type Owned By Owner Company Segment
Renaissance Plaza Saint-Petersburg City Center Operating Desna Desna Development Office
Renaissance Forum Saint-Petersburg City Center Operating Desna Desna Development
Mixed Use Project (Office &
Hotel )
Renaissance Premium Saint-Petersburg Secondary Operating Desna Desna Moskovsky Office
Renaissance Pravda Saint-Petersburg City Center Operating Desna Desna Neva Office
Renaissance Center Saint-Petersburg Secondary Operating Desna Merkator Office
Renaissance House Saint-Petersburg City Center Operating Desna
Desna Gayrimenkul
Yatirim Petersburg
Branch Office
Renaissance Hall Saint-Petersburg City Center Operating Desna Desna Investment Office
Renaissance Business ParkSaint-Petersburg Secondary Under Consctruction Desna Desna Global Office
Renaissance Priyajka Saint-Petersburg Secondary Land Plot Desna Desna Real Estate Office
Renaissance Fontanka Saint-Petersburg City Center Land Plot Desna Desna Forum Office
Aura Yaroslavl Yaroslavl City Center Operating Desna YarRenInvest
Shopping and Entertainment
Center
Aura Surgut Surgut Secondary Operating Desna Rialren
Shopping and Entertainment
Center
Moscow City (Remo Towers) Moscow City Center Under Consctruction Desna ST Towers
Mixed Use Project (Office &
Residential & Commercial )
Marine Façade Saint-Petersburg Secondary Land Plot Desna YarRenPrestige
Shopping and Entertainment
Center


