IPCC Mitigation of Climate Change IPCC Working Group III contribution to the Fourth Assessment Report Bert Metz Co-chair IPCC WG III Risoe International Energy Conference, Roskilde, Denmark, May 22, 2007
Transcript
IPCC
Mitigation of Climate Change
IPCC Working Group III contribution to the
Fourth Assessment Report
Bert Metz
Co-chair IPCC WG III
Risoe International Energy Conference, Roskilde, Denmark, May 22, 2007
IPCC
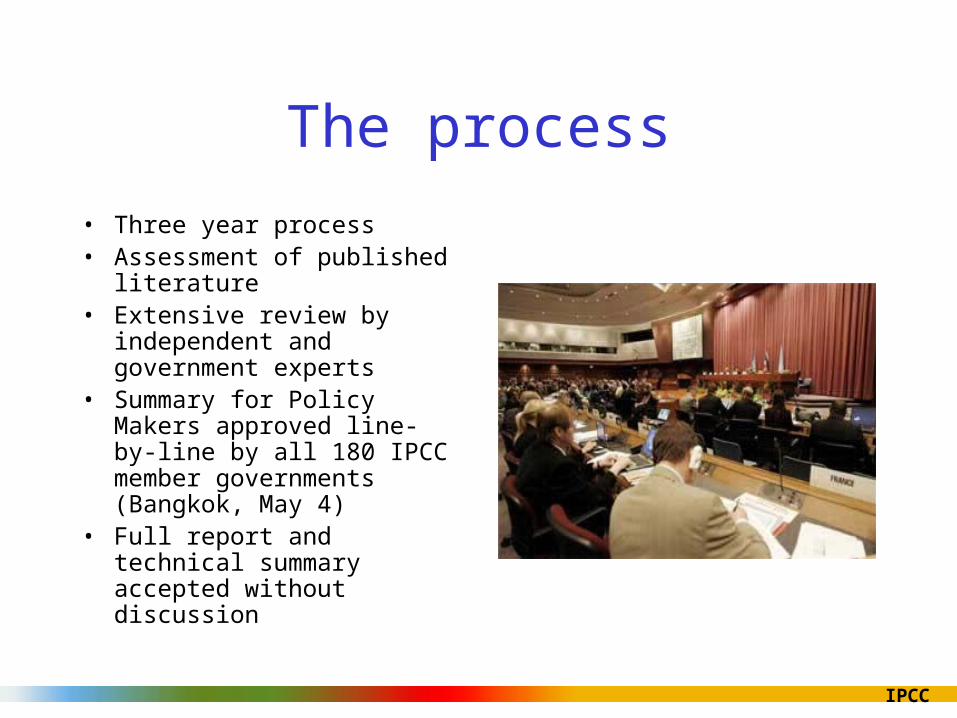
The process
• Three year process• Assessment of published
literature• Extensive review by
independent and government experts
• Summary for Policy Makers approved line-by-line by all 180 IPCC member governments (Bangkok, May 4)
• Full report and technical summary accepted without discussion
IPCC
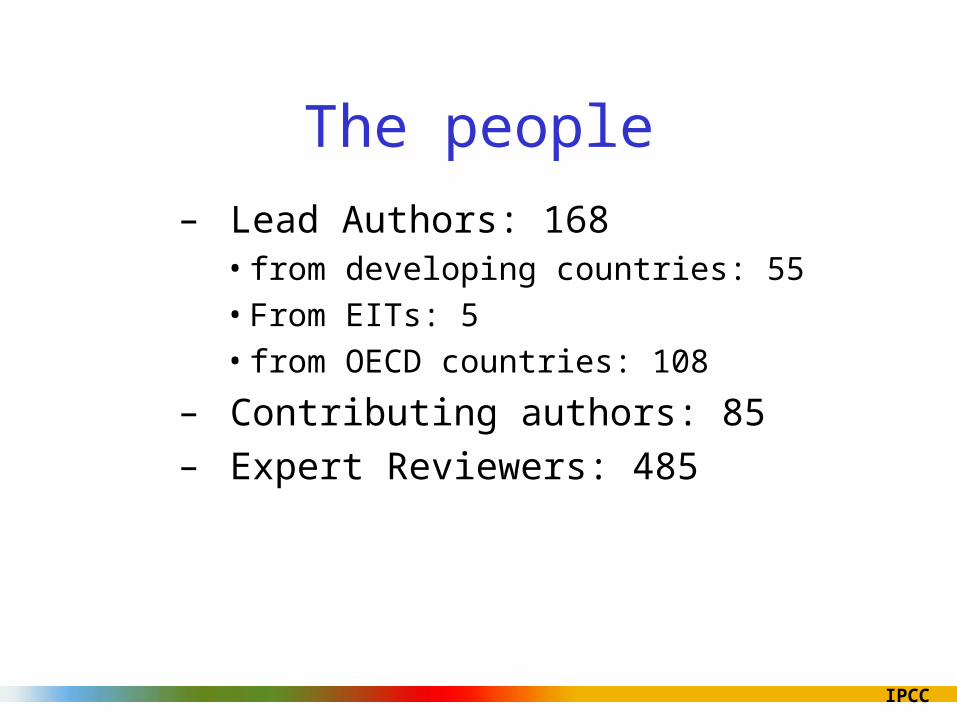
The people
– Lead Authors: 168 • from developing countries: 55
• From EITs: 5
• from OECD countries: 108
– Contributing authors: 85– Expert Reviewers: 485
IPCC
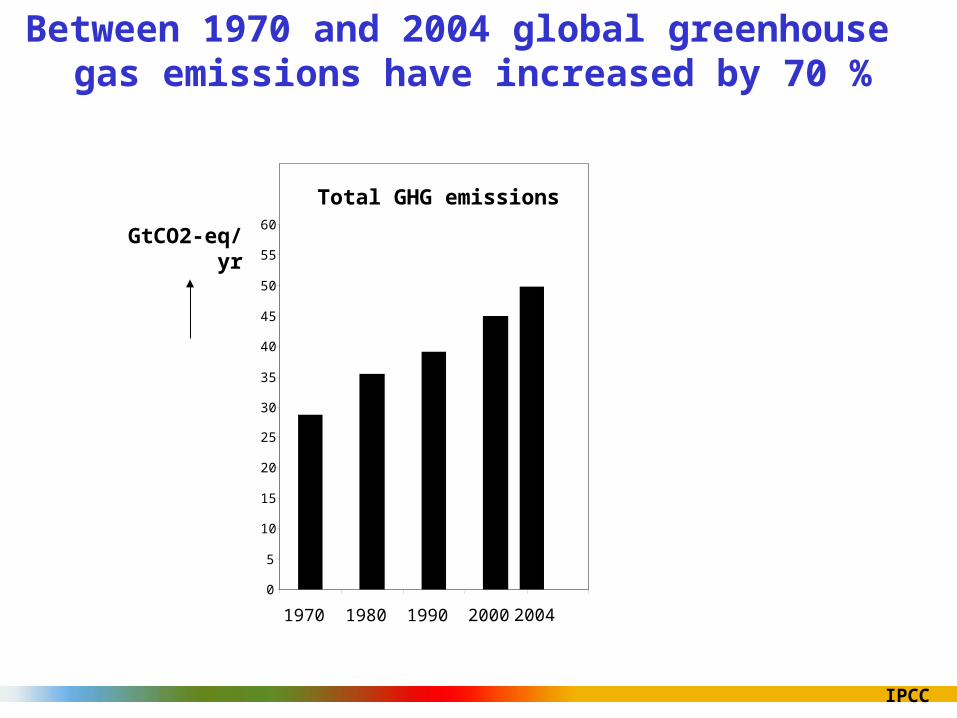
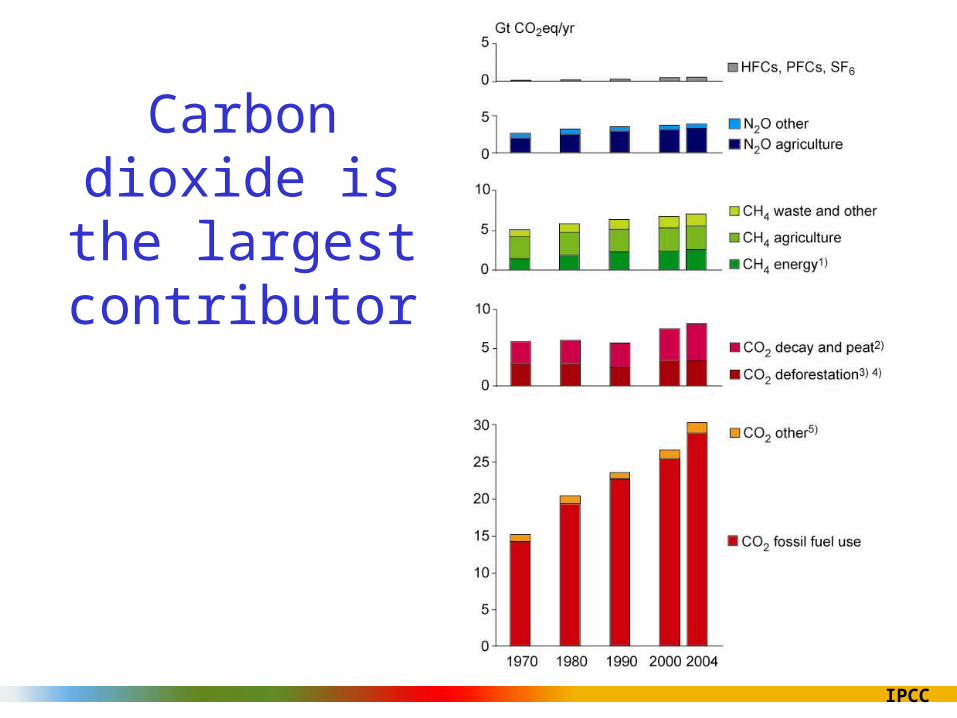
Between 1970 and 2004 global greenhouse gas emissions have increased by 70 %
Total GHG emissions
0
5
10
15
20
25
30
35
40
45
50
55
60
1970 1980 1990 2000 2004
GtCO2-eq/yr
IPCC
Carbon dioxide is the largest contributor
IPCC
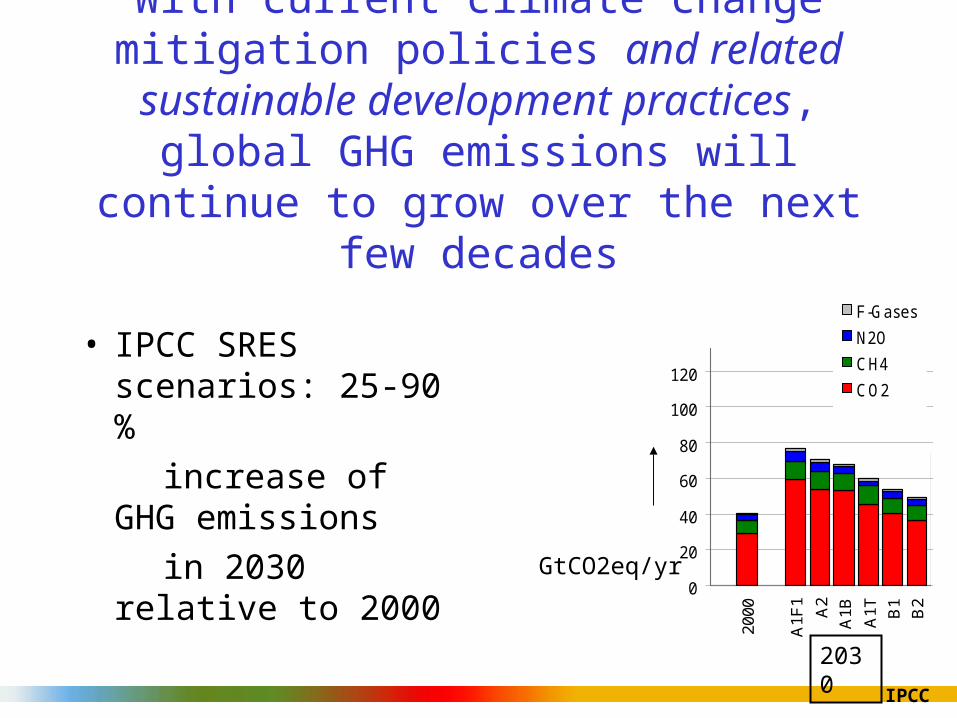
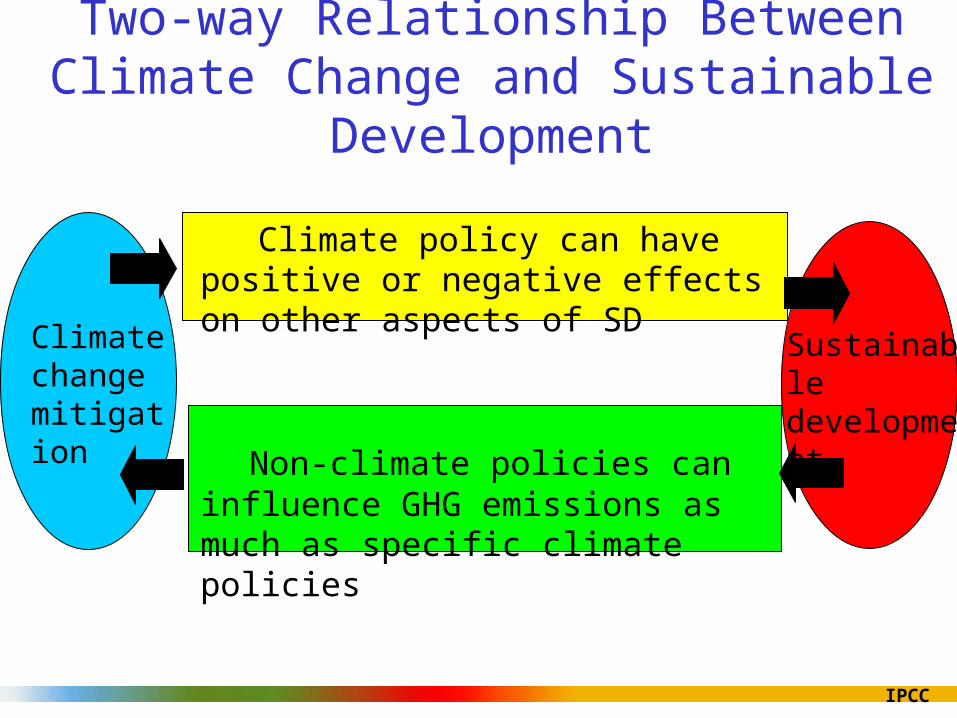
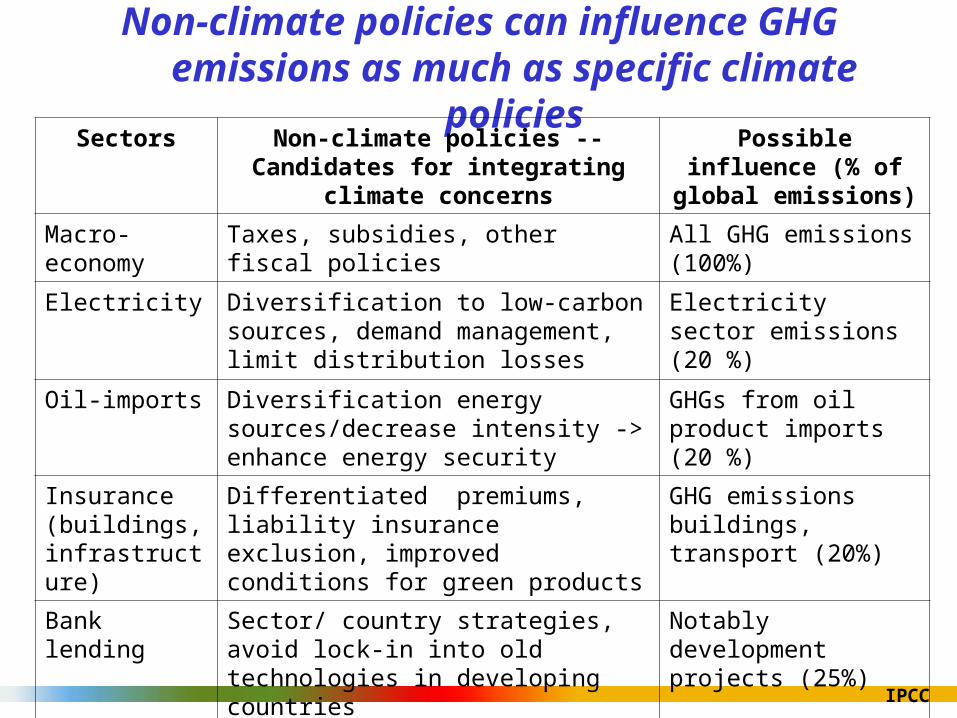
With current climate change mitigation policies and related sustainable development
practices, global GHG emissions will continue to grow over the next few decades
• IPCC SRES scenarios: 25-90 %
increase of GHG emissions
in 2030 relative to 2000 0
20
40
60
80
100
120
140
160
180
2000
A1F
1
A2
A1B
A1T B
1B
2
95th
75th
med
ian
25th 5th
A2
A1F
1
B2
A1B
A1T B
195
th
75th
med
ian
25th 5th
2030
GtCO2eq/yr
0
20
40
60
80
100
120
140
160
180
2000
A1F
1 A2
A1B A1T B
1B
295
th75
thm
edia
n25
th 5th A2
A1F
1B
2A
1B A1T B
195
th75
thm
edia
n25
th 5th
F-Gases
N2O
CH4
CO2
IPCC
Mitigation potential• Mitigation potential:
– Emission reduction, relative to emission baselines, that is economically attractive at a given “price of carbon”
• Market potential:– Based on private costs and private rates of return– Expected to occur under forecast market conditions – Including policies and measures currently in place – Barriers limit actual uptake
• Economic potential:– Takes into account social costs and benefits and social rates of return, – Assuming that market efficiency is improved by policies and measures
and– Barriers are removed
IPCC
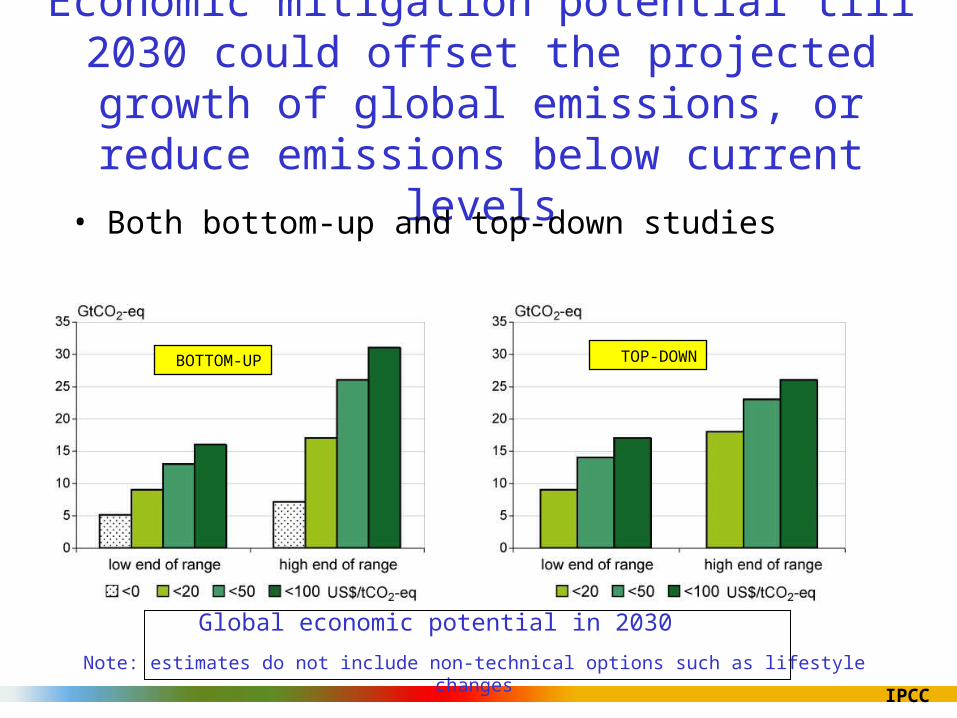
Economic mitigation potential till 2030 could offset the projected growth of global emissions, or reduce
emissions below current levels
• Both bottom-up and top-down studies
Note: estimates do not include non-technical options such as lifestyle changes
BOTTOM-UP TOP-DOWN
Global economic potential in 2030
IPCC
What does US$ 50/ tCO2eq mean?
• Crude oil: ~US$ 25/ barrel
• Gasoline: ~12 ct/ litre (50 ct/gallon)
• Electricity:– from coal fired plant: ~5 ct/kWh– from gas fired plant: ~1.5 ct/kWh
IPCC
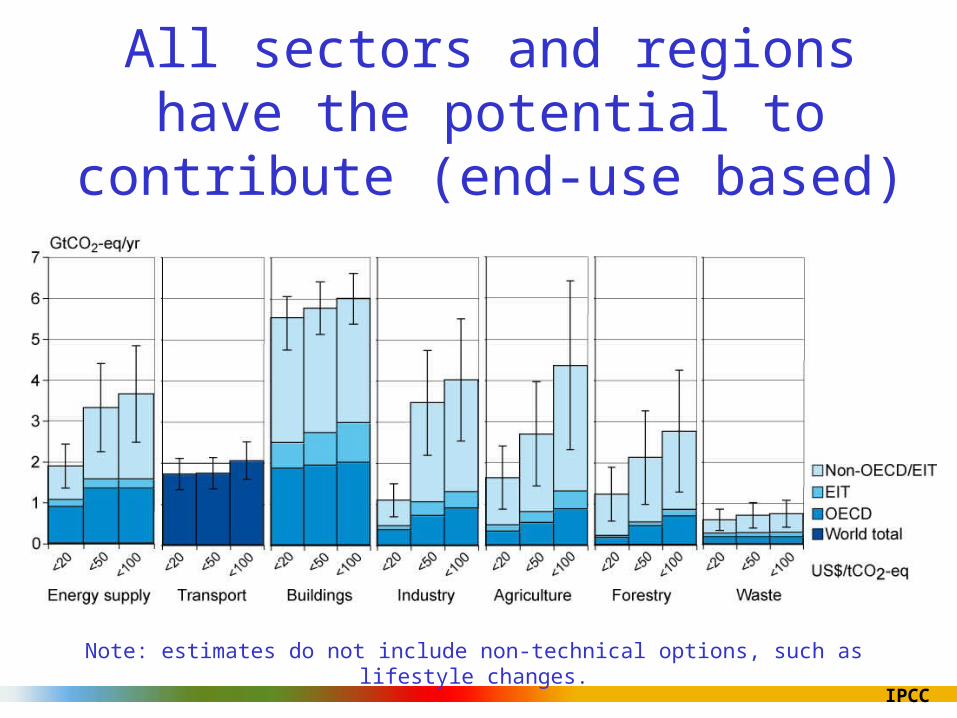
All sectors and regions have the potential to contribute (end-use based)
Note: estimates do not include non-technical options, such as lifestyle changes.
IPCC
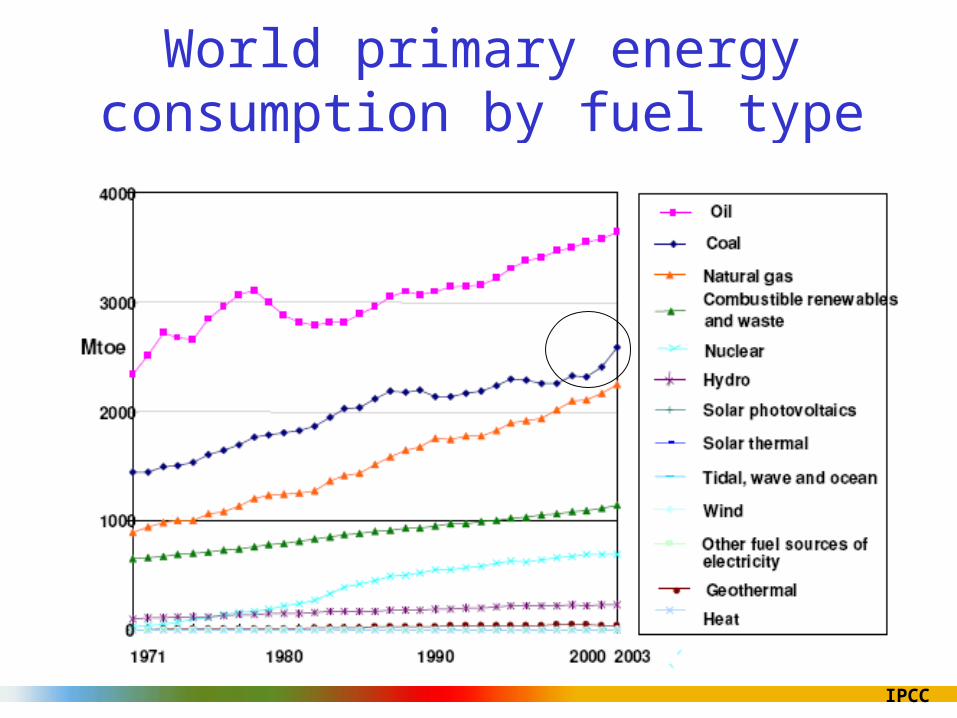
World primary energy consumption by fuel type
IPCC
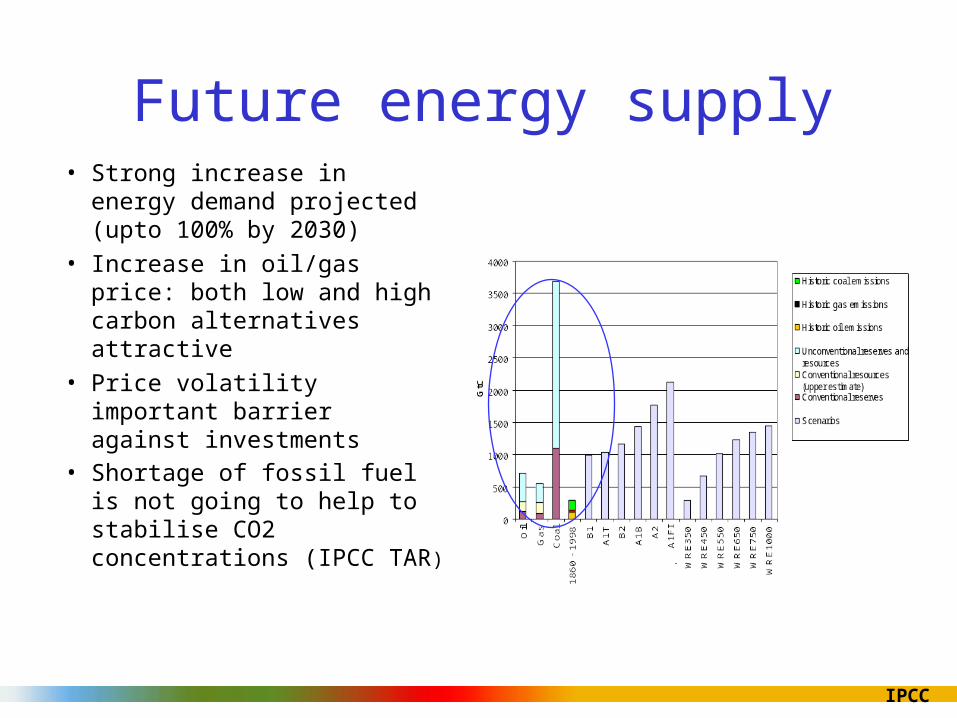
Future energy supply• Strong increase in energy
demand projected (upto 100% by 2030)
• Increase in oil/gas price: both low and high carbon alternatives attractive
• Price volatility important barrier against investments
• Shortage of fossil fuel is not going to help to stabilise CO2 concentrations (IPCC TAR)
IPCC
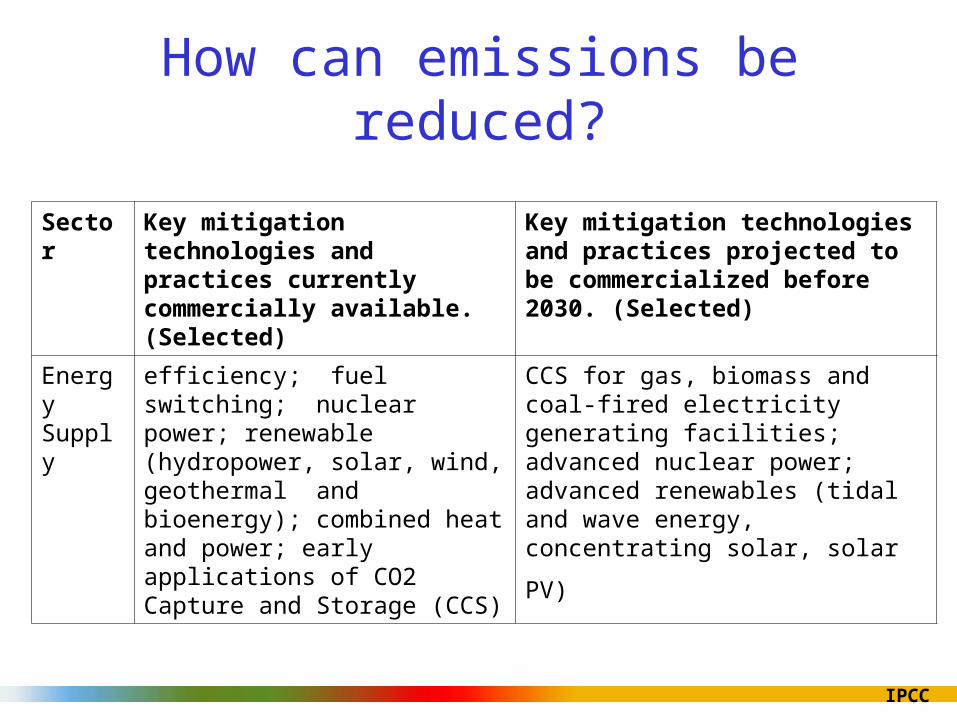
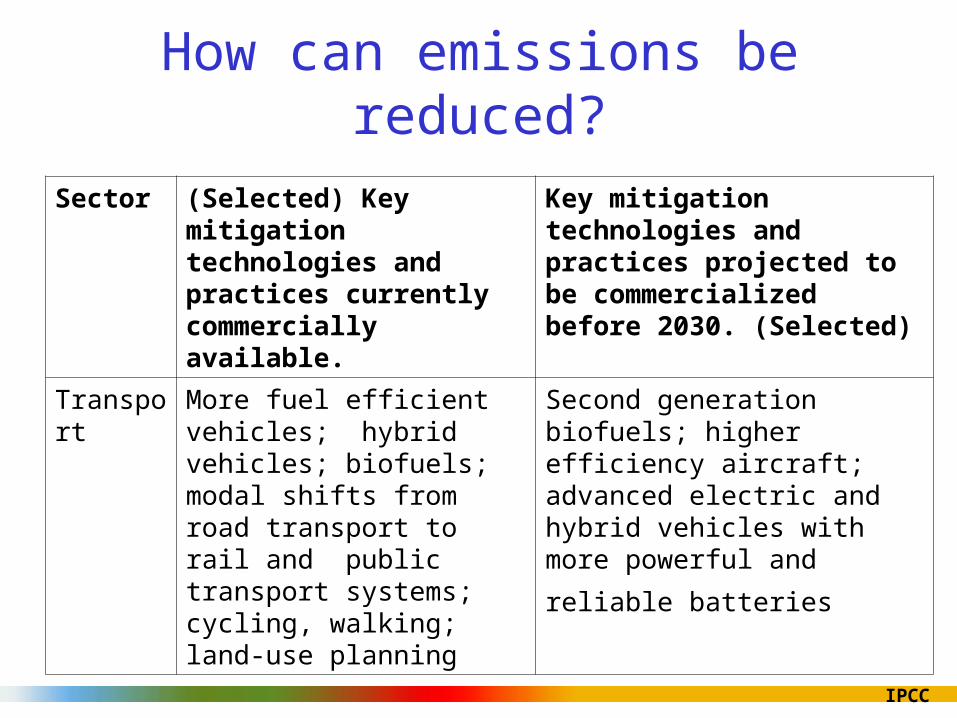
How can emissions be reduced?
Sector Key mitigation technologies and practices currently commercially available. (Selected)
Key mitigation technologies and practices projected to be commercialized before 2030. (Selected)
Energy Supply
efficiency; fuel switching; nuclear power; renewable (hydropower, solar, wind, geothermal and bioenergy); combined heat and power; early applications of CO2 Capture and Storage (CCS)
CCS for gas, biomass and coal-fired electricity generating facilities; advanced nuclear power; advanced renewables (tidal and wave
energy, concentrating solar, solar PV)
IPCC
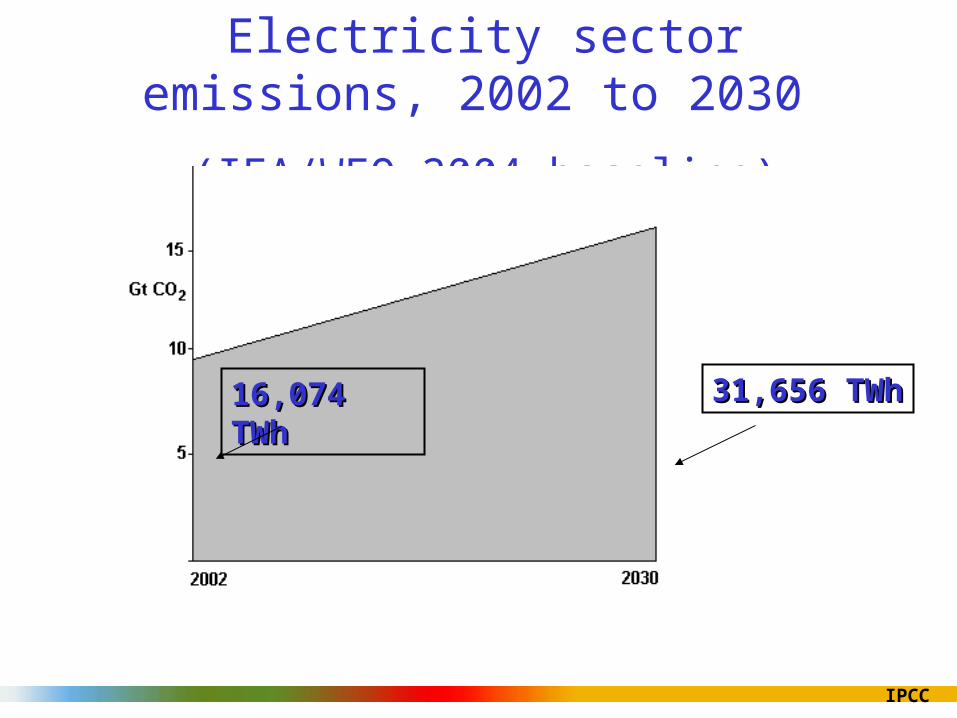
Electricity sector emissions, 2002 to 2030
(IEA/WEO 2004 baseline)
16,074 TWh16,074 TWh 31,656 TWh31,656 TWh
IPCC
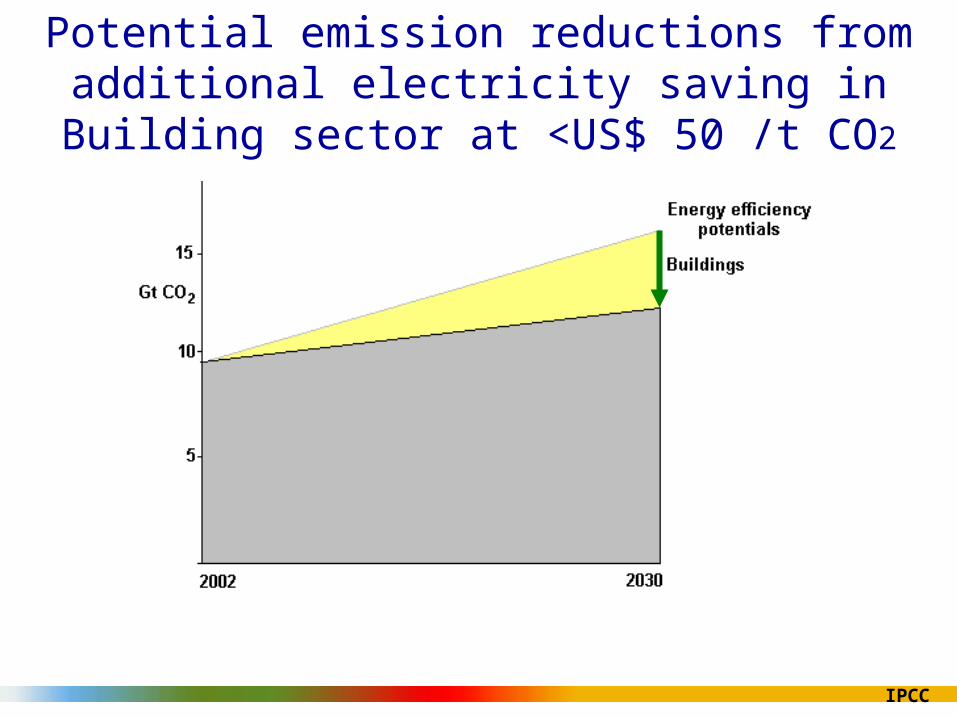
Potential emission reductions from additional electricity saving in Building sector at <US$ 50 /t CO2
IPCC
Potential emission reductions from additional electricity saving in the industrial sector at
<US$ 50 /t CO2
IPCC
Potential emission reductions from additional improved generation plant efficiency and fuel
switching at <US$50 /tCO2
IPCC
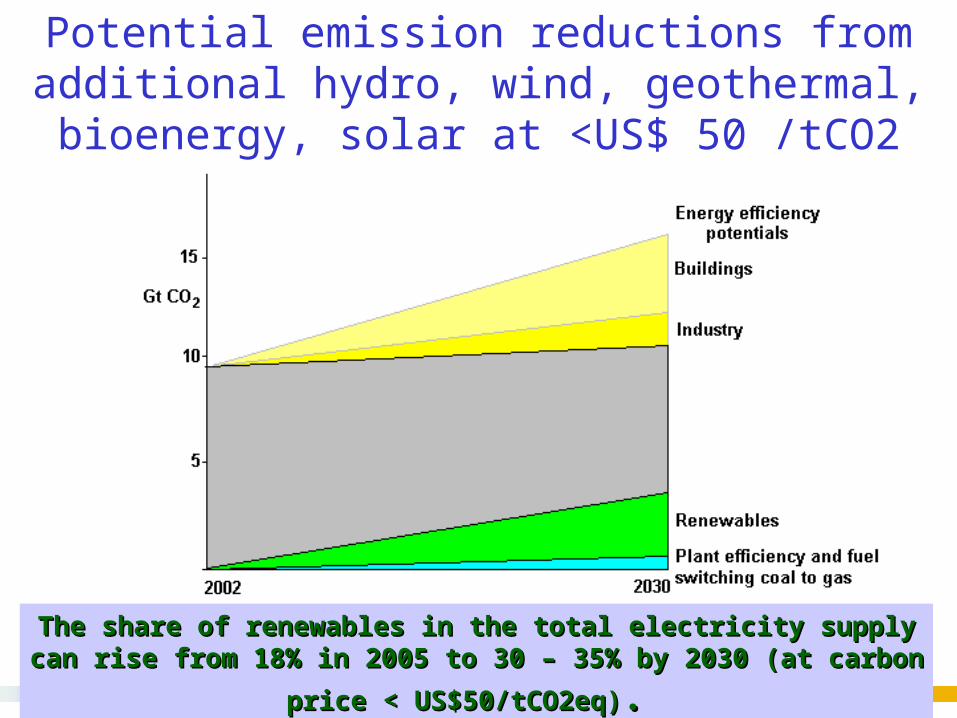
Potential emission reductions from additional hydro, wind, geothermal, bioenergy, solar at <US$ 50 /tCO2
The share of renewables in the total electricity supply can rise from The share of renewables in the total electricity supply can rise from
18% in 2005 to 30 – 35% by 2030 (at carbon price < US$50/tCO2eq)18% in 2005 to 30 – 35% by 2030 (at carbon price < US$50/tCO2eq). .
IPCC
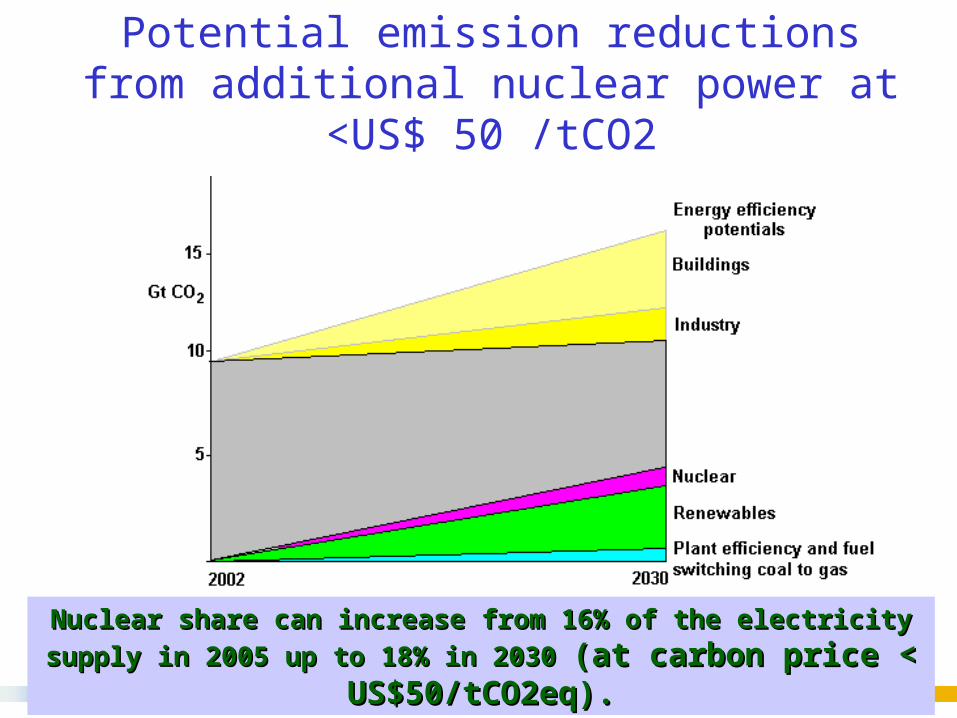
Potential emission reductions from additional nuclear power at <US$ 50 /tCO2
Nuclear share can increase from 16% of the electricity supply in 2005 Nuclear share can increase from 16% of the electricity supply in 2005
up to 18% in 2030 up to 18% in 2030 (at carbon price < US$50/tCO2eq).(at carbon price < US$50/tCO2eq).
IPCC
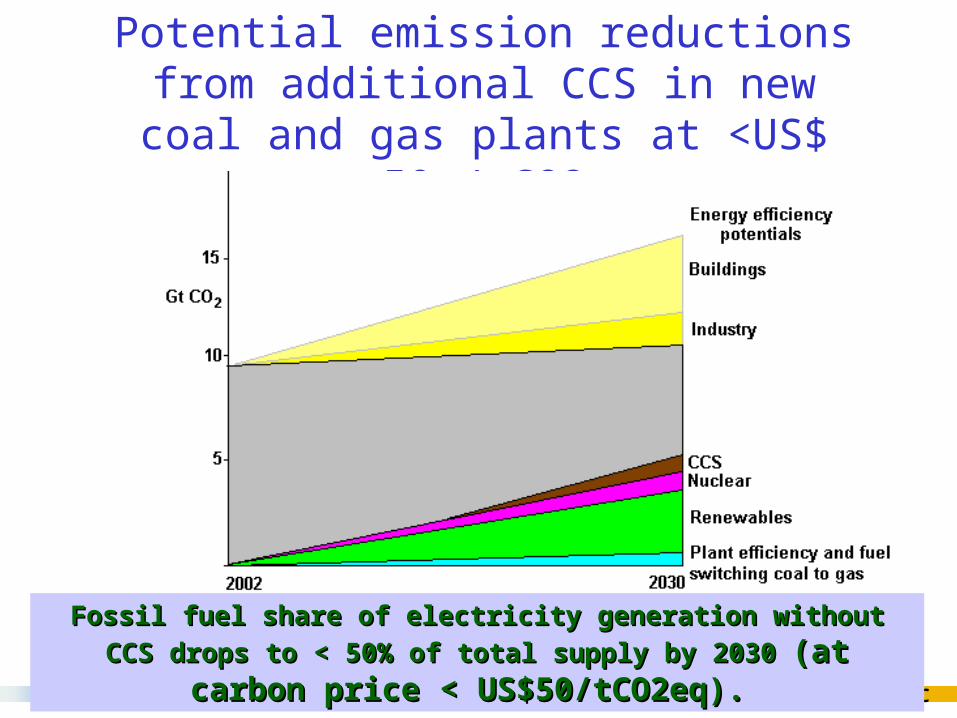
Potential emission reductions from additional CCS in new coal and gas plants
at <US$ 50 /tCO2
Fossil fuel share of electricity generation without CCS drops to < Fossil fuel share of electricity generation without CCS drops to <
50% of total supply by 2030 50% of total supply by 2030 (at carbon price < US$50/tCO2eq).(at carbon price < US$50/tCO2eq).
IPCC
How can emissions be reduced?
Sector (Selected) Key mitigation technologies and practices currently commercially available.
Key mitigation technologies and practices projected to be commercialized before 2030. (Selected)
Transport More fuel efficient vehicles; hybrid vehicles; biofuels; modal shifts from road transport to rail and public transport systems; cycling, walking; land-use planning
Second generation biofuels; higher efficiency aircraft; advanced electric and hybrid vehicles with more powerful and reliable
batteries
IPCC
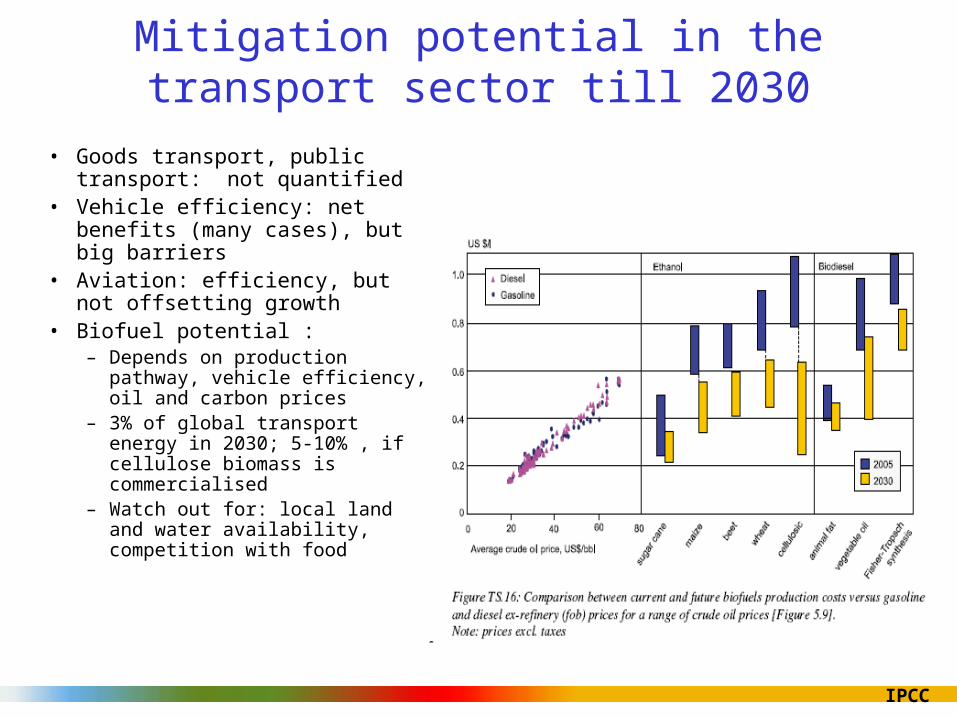
Mitigation potential in the transport sector till 2030
• Goods transport, public transport: not quantified
• Vehicle efficiency: net benefits (many cases), but big barriers
• Aviation: efficiency, but not offsetting growth
• Biofuel potential :– Depends on production pathway,
vehicle efficiency, oil and carbon prices
– 3% of global transport energy in 2030; 5-10% , if cellulose biomass is commercialised
– Watch out for: local land and water availability, competition with food
IPCC
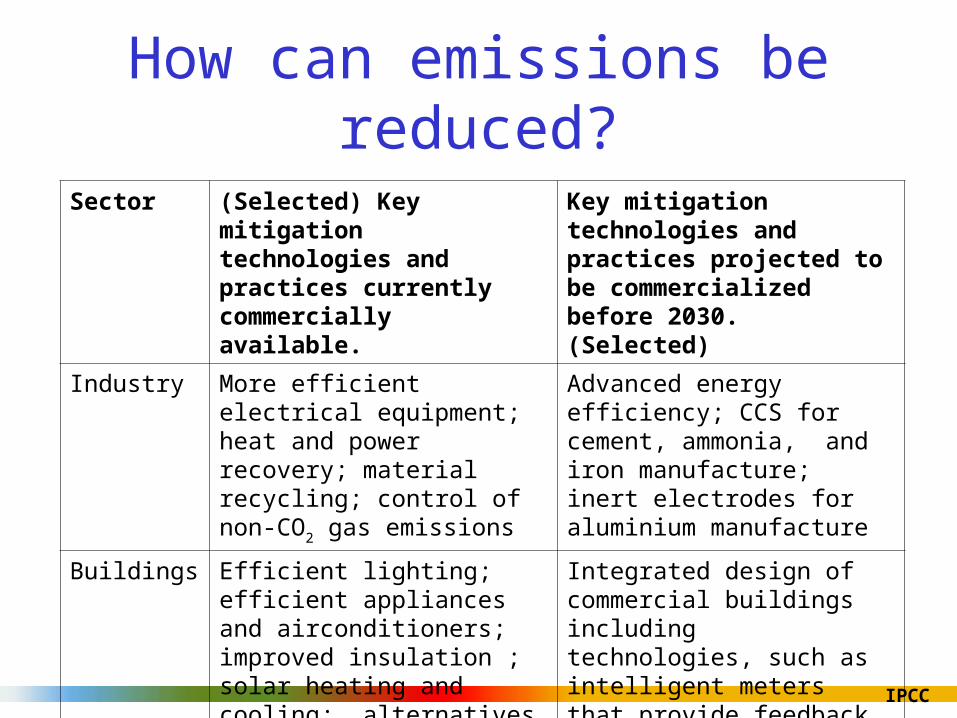
Sector (Selected) Key mitigation technologies and practices currently commercially available.
Key mitigation technologies and practices projected to be commercialized before 2030. (Selected)
Industry More efficient electrical equipment; heat and power recovery; material recycling; control of non-CO2 gas emissions
Advanced energy efficiency; CCS for cement, ammonia, and iron manufacture; inert electrodes for aluminium manufacture
Buildings Efficient lighting; efficient appliances and airconditioners; improved insulation ; solar heating and cooling; alternatives for fluorinated gases in insulation and appliances
Integrated design of commercial buildings including technologies, such as intelligent meters that provide feedback and control; solar PV integrated in buildings
How can emissions be reduced?
IPCC
Mitigation potential in the industry and buildings sector till 2030
• Industry:– Potential predominantly in energy intensive industries.– Many efficient installations in developing countires– Barriers include slow stock turnover and (for SMEs) lack of financial
resources, inability to absorb technical information
• Buildings:– About 30% of projected GHG emissions by 2030 can be avoided with
net economic benefit.– New buildings: >75% savings compared to current (at low to zero
additional cost)– Barriers include availability of technologies, financing, cost of reliable
information and limitations in building designs
IPCC
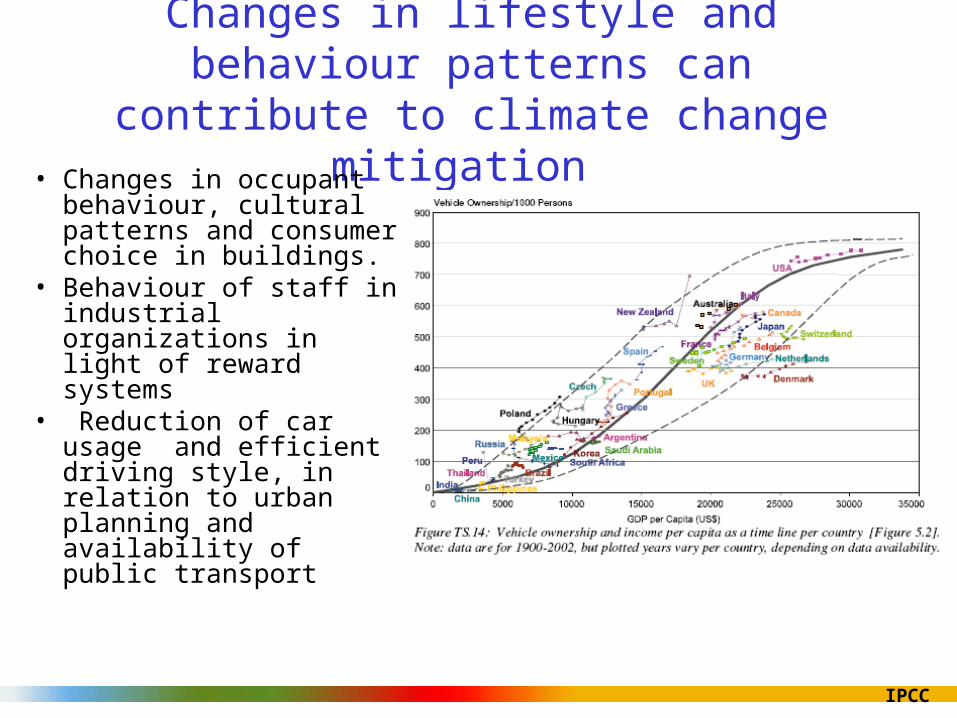
Changes in lifestyle and behaviour patterns can contribute to climate change mitigation
• Changes in occupant behaviour, cultural patterns and consumer choice in buildings.
• Behaviour of staff in industrial organizations in light of reward systems
• Reduction of car usage and efficient driving style, in relation to urban planning and availability of public transport
IPCC
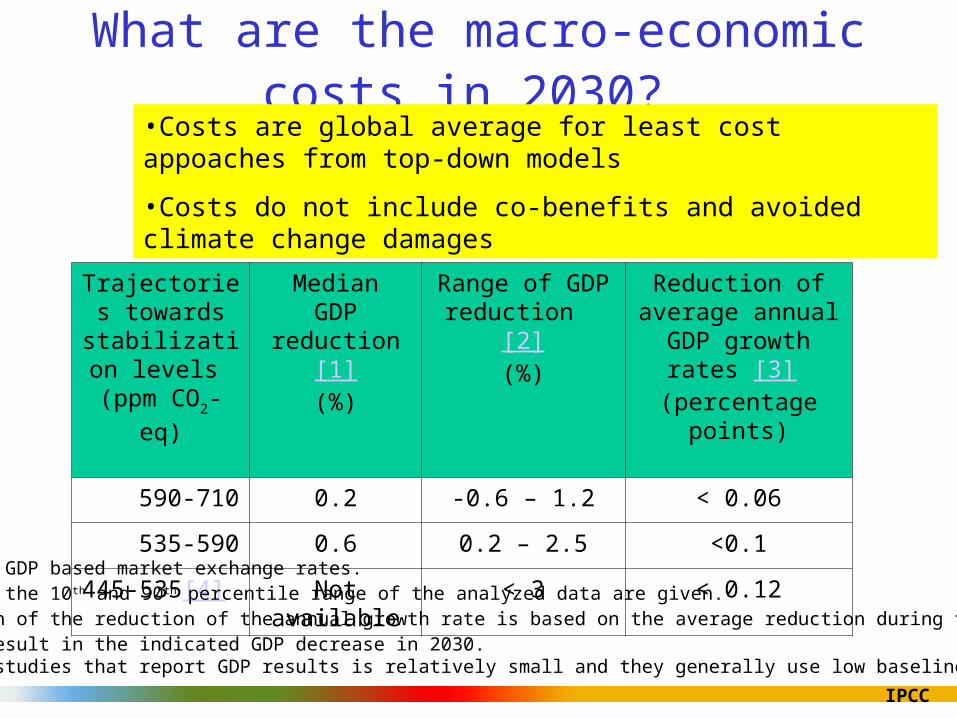
What are the macro-economic costs in 2030?
Trajectories towards
stabilization levels
(ppm CO2-eq)
MedianGDP reduction
[1](%)
Range of GDP reduction [2]
(%)
Reduction of average annual GDP growth
rates [3] (percentage points)
590-710 0.2 -0.6 – 1.2 < 0.06
535-590 0.6 0.2 – 2.5 <0.1
445-535[4] Not available < 3 < 0.12
[1] This is global GDP based market exchange rates.[2] The median and the 10th and 90th percentile range of the analyzed data are given.[3] The calculation of the reduction of the annual growth rate is based on the average reduction during the period till 2030 that would result in the indicated GDP decrease in 2030.[4] The number of studies that report GDP results is relatively small and they generally use low baselines.
•Costs are global average for least cost appoaches from top-down models
•Costs do not include co-benefits and avoided climate change damages
IPCC
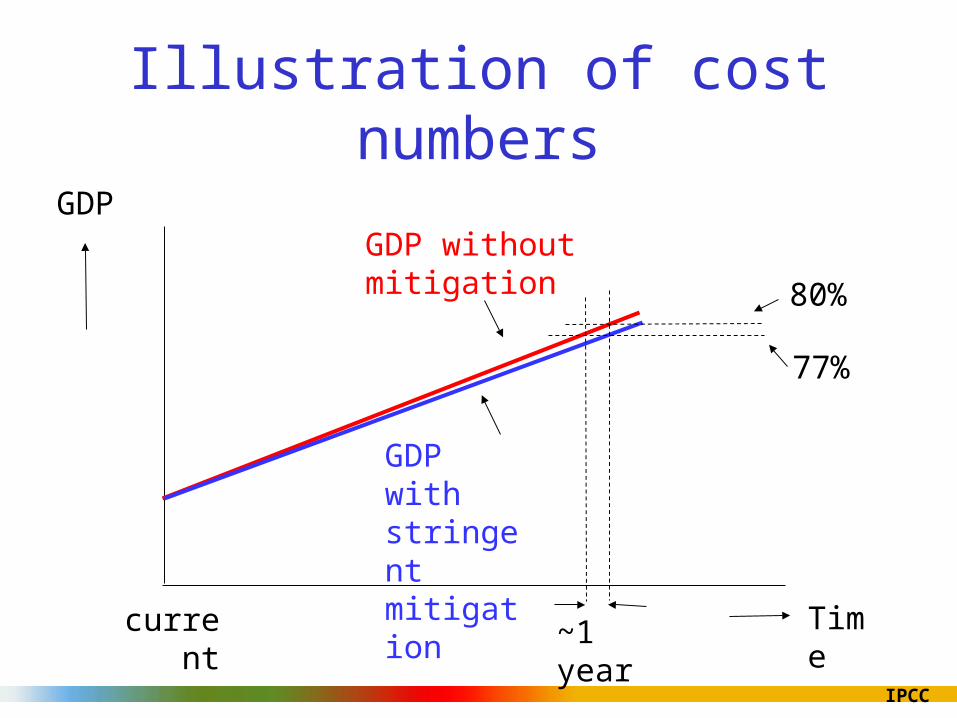
Illustration of cost numbers
GDP without mitigation
GDP with stringent mitigation
GDP
Time
80%
current
77%
~1 year
IPCC
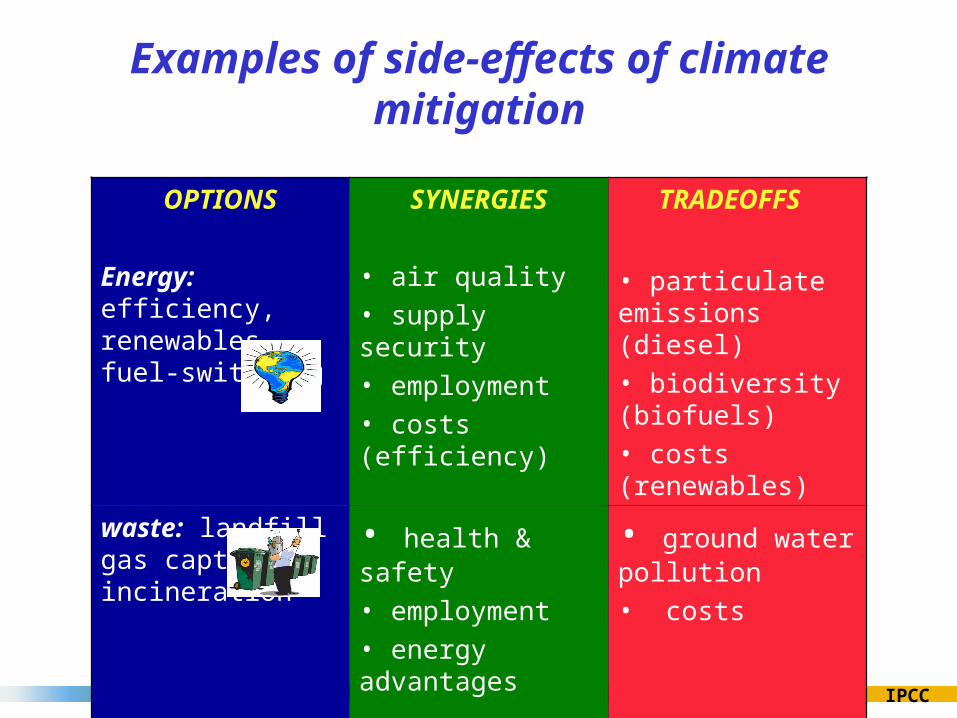
There are also co-benefits of mitigation
• Near–term health benefits from reduced air pollution may offset a substantial fraction of mitigation costs
• Mitigation can also be positive for: energy security, balance of trade improvement, provision of modern energy services to rural areas, sustainable agriculture and employment
IPCC
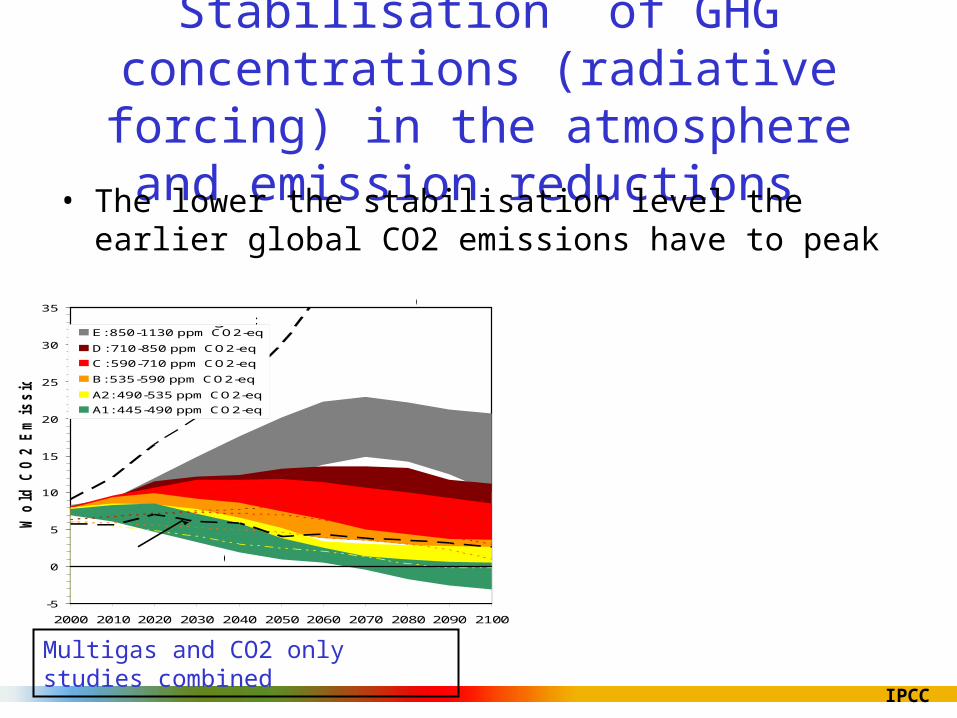
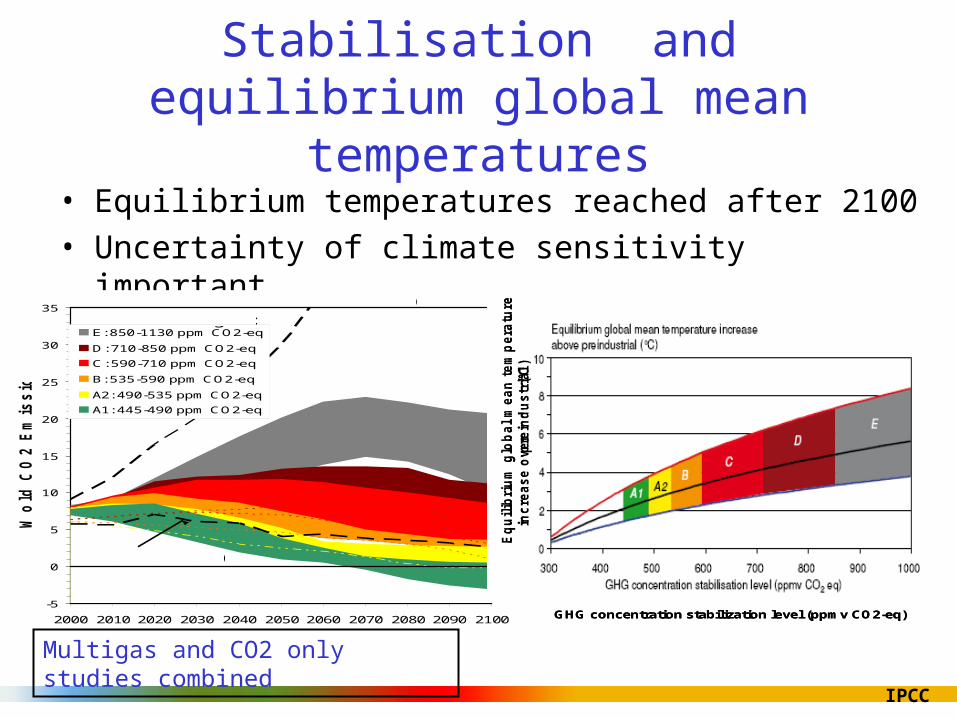
Stabilisation of GHG concentrations (radiative forcing) in the atmosphere and
emission reductions • The lower the stabilisation level the earlier global CO2
•Mitigation efforts over the next two to three decades will have a large impact on opportunities to achieve lower stabilization levels
IPCC
Technology• The range of stabilization levels can be achieved by
– deployment of a portfolio of technologies that are currently available and
– those that are expected to be commercialised in coming decades.
• This assumes that appropriate and effective incentives are in place for development, acquisition, deployment and diffusion of technologies and for addressing related barriers
IPCC
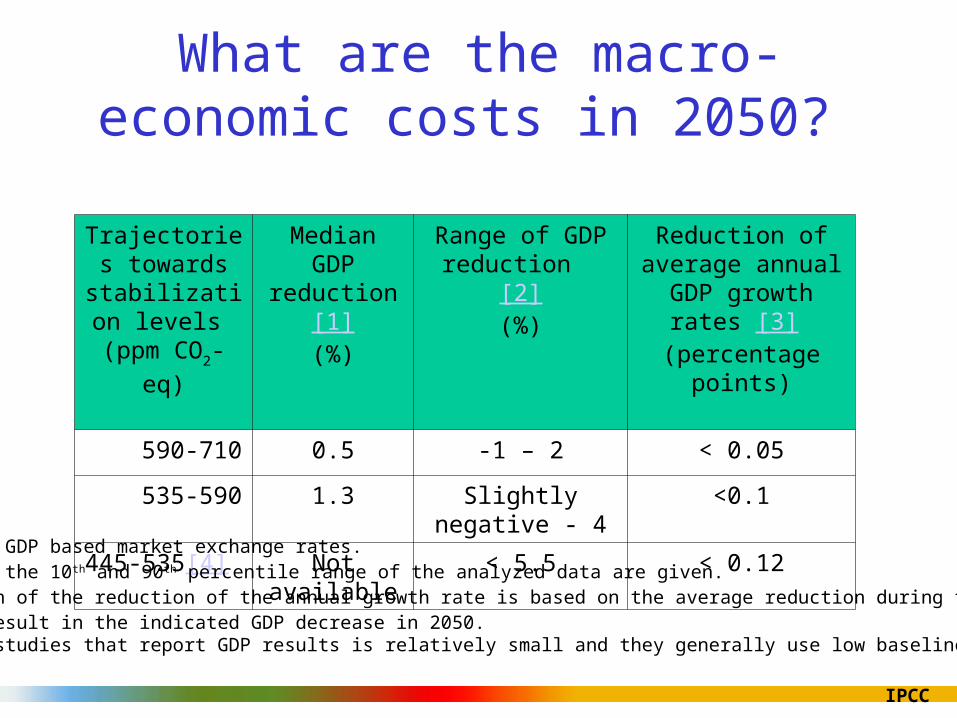
What are the macro-economic costs in 2050?
Trajectories towards
stabilization levels
(ppm CO2-eq)
MedianGDP
reduction[1](%)
Range of GDP reduction [2]
(%)
Reduction of average annual GDP growth
rates [3] (percentage points)
590-710 0.5 -1 – 2 < 0.05
535-590 1.3 Slightly negative - 4 <0.1
445-535[4] Not available < 5.5 < 0.12
[1] This is global GDP based market exchange rates.[2] The median and the 10th and 90th percentile range of the analyzed data are given.[3] The calculation of the reduction of the annual growth rate is based on the average reduction during the period till 2050 that would result in the indicated GDP decrease in 2050.[4] The number of studies that report GDP results is relatively small and they generally use low baselines.
IPCC
Policies are available to to governments to realise mitigation of climate change
• Effectiveness of policies depends on national circumstances, their design, interaction, stringency and implementation
– Integrating climate policies in broader development policies – Regulations and standards – Taxes and charges – Tradable permits – Financial incentives– Voluntary agreements – Information instruments – Research and development
IPCC
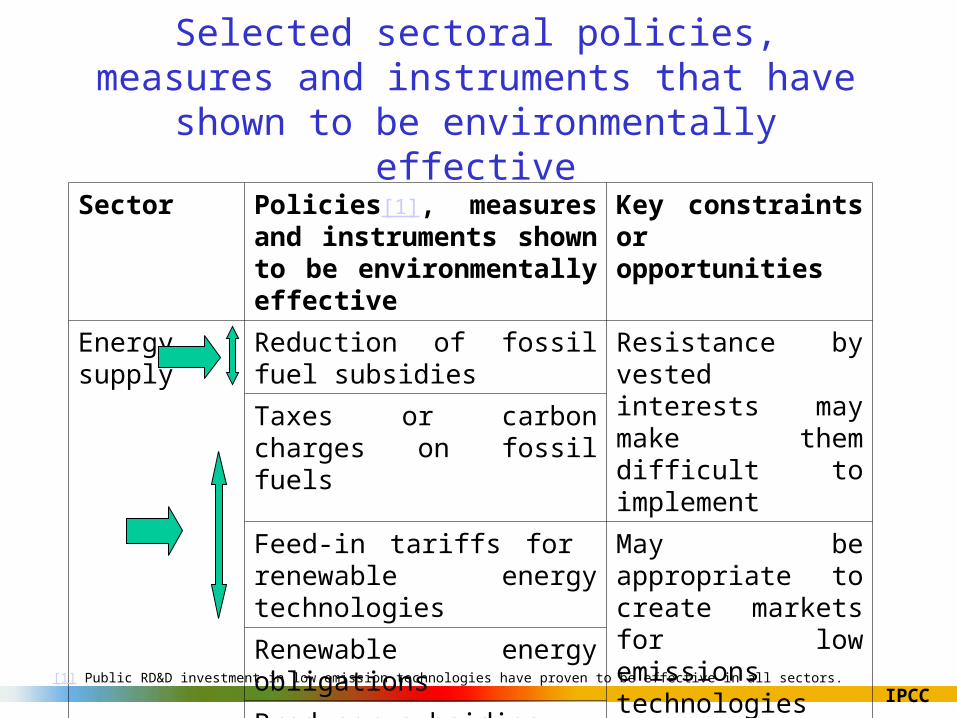
Selected sectoral policies, measures and instruments that have shown to be environmentally effective
Sector Policies[1], measures and instruments shown to be environmentally effective
Key constraints or opportunities
Energy supply Reduction of fossil fuel subsidies
Resistance by vested interests may make them difficult to implement
Taxes or carbon charges on fossil fuels
Feed-in tariffs for renewable energy technologies
May be appropriate to create markets for low emissions technologies
Renewable energy obligations
Producer subsidies
[1] Public RD&D investment in low emission technologies have proven to be effective in all sectors.
IPCC
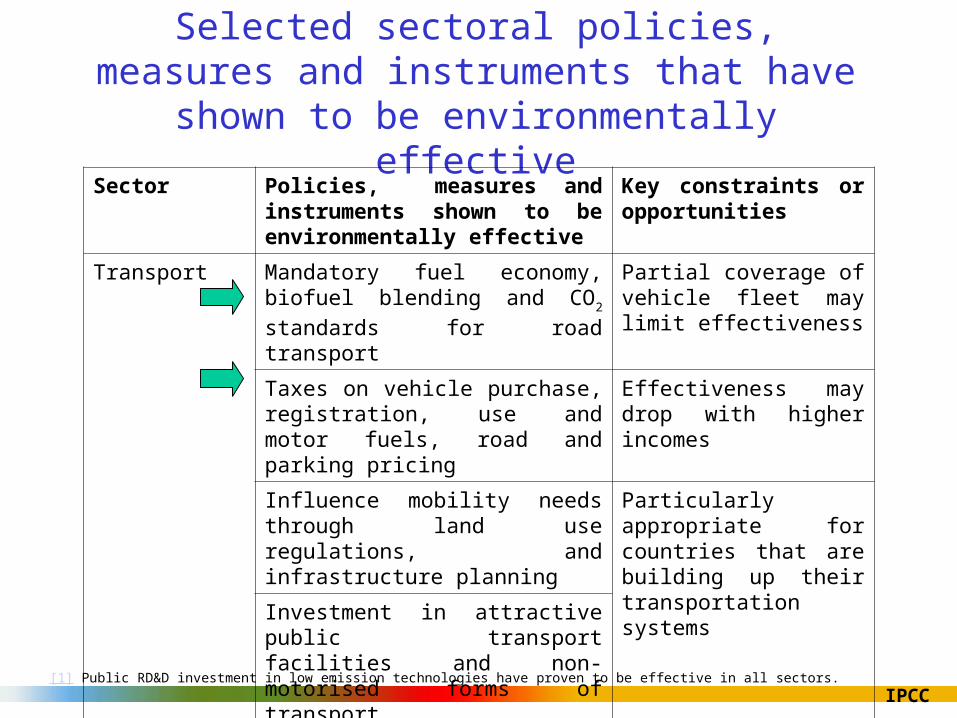
Selected sectoral policies, measures and instruments that have shown to be environmentally effective
Sector Policies, measures and instruments shown to be environmentally effective
Key constraints or opportunities
Transport Mandatory fuel economy, biofuel blending and CO2 standards for road
transport
Partial coverage of vehicle fleet may limit effectiveness
Taxes on vehicle purchase, registration, use and motor fuels, road and parking pricing
Effectiveness may drop with higher incomes
Influence mobility needs through land use regulations, and infrastructure planning
Particularly appropriate for countries that are building up their transportation systemsInvestment in attractive public
transport facilities and non-motorised forms of transport
[1] Public RD&D investment in low emission technologies have proven to be effective in all sectors.
IPCC
An effective carbon-price signal could realise
significant mitigation potential in all sectors • Policies that provide a real or implicit price of carbon could
create incentives for producers and consumers to significantly invest in low-GHG products, technologies and processes.
• Such policies could include economic instruments, government funding and regulation
• For stabilisation at around 550 ppm CO2eq carbon prices should reach 20-80 US$/tCO2eq by 2030
(5-65 if “induced technological change” happens)
• At these carbon prices large shifts of investments into low carbon technologies can be expected
IPCC
Investments• Energy infrastructure investment decisions, (20 trillion US$ till 2030)
will have long term impacts on GHG emissions.
• The widespread diffusion of low-carbon technologies may take many decades, even if early investments in these technologies are made attractive.
• Returning global energy-related CO2 emissions to 2005 levels by 2030 would require a large shift in the pattern of investment, although the net additional investment required ranges from negligible to 5-10%
• It is often more cost-effective to invest in end-use energy efficiency improvement than in increasing energy supply
IPCC
The importance of technology policies
• The lower the stabilization levels (550 ppm CO2-eq or lower) the greater the need for more efficient RD&D efforts and investment in new technologies during the next few decades
• Government support is important for effective technology development, innovation and deployment through
• financial contributions,
• tax credits,
• standard setting
• market creation.
• BUT, government funding for most energy research programmes has been declining for nearly two decades: now about half of 1980 level.
IPCC
International agreements• Notable achievements of the UNFCCC/Kyoto Protocol that may provide the
foundation for future mitigation efforts: – global response to the climate problem,– stimulation of an array of national policies,– the creation of an international carbon market and – new institutional mechanisms
• Future agreements:– Greater cooperative efforts to reduce emissions will help to reduce global costs for
achieving a given level of mitigation, or will improve environmental effectiveness– Improving, and expanding the scope of, market mechanisms (such as emission
trading, Joint Implementation and CDM) could reduce overall mitigation costs– Assessed literature on future agreements on basis of criteria for enevironmental/