Page 1
King’s Research Portal
DOI:10.1016/j.etap.2013.09.004
Document VersionPeer reviewed version
Link to publication record in King's Research Portal
Citation for published version (APA):Hodek, P., Koblihová, J., Kizek, R., Frei, E., Arlt, V. M., & Stiborová, M. (2013). The relationship between DNAadduct formation by benzo[a]pyrene and expression of its activation enzyme cytochrome P450 1A1 in rat.Environmental Toxicology and Pharmacology, 36(3), 989-996. 10.1016/j.etap.2013.09.004
Citing this paperPlease note that where the full-text provided on King's Research Portal is the Author Accepted Manuscript or Post-Print version this maydiffer from the final Published version. If citing, it is advised that you check and use the publisher's definitive version for pagination,volume/issue, and date of publication details. And where the final published version is provided on the Research Portal, if citing you areagain advised to check the publisher's website for any subsequent corrections.
General rightsCopyright and moral rights for the publications made accessible in the Research Portal are retained by the authors and/or other copyrightowners and it is a condition of accessing publications that users recognize and abide by the legal requirements associated with these rights.
•Users may download and print one copy of any publication from the Research Portal for the purpose of private study or research.•You may not further distribute the material or use it for any profit-making activity or commercial gain•You may freely distribute the URL identifying the publication in the Research Portal
Take down policyIf you believe that this document breaches copyright please contact [email protected] providing details, and we will remove access tothe work immediately and investigate your claim.
Download date: 18. Feb. 2017
Page 2
The relationship between DNA adduct formation by
benzo[a]pyrene and expression of its activation enzyme
cytochrome P450 1A1 in rat
Petr Hodeka, Jitka Koblihová
a, René Kizek
b, Eva Frei
c, Volker M. Arlt
d, Marie
Stiborováa*
aDepartment of Biochemistry, Faculty of Science, Charles University, Albertov 2030, 128 40
Prague 2, Czech Republic
bDepartment of Chemistry and Biochemistry, Faculty of Agronomy, Mendel University in
Brno, Zemedelska 1, CZ-61300 Brno, Czech Republic
cDivision of Preventive Oncology, National Center for Tumor Diseases, German Cancer
Research Center (DKFZ), Im Neuenheimer Feld 280, 69120 Heidelberg, Germany
dAnalytical and Environmental Sciences Division, King’s College London, MRC-PHE Centre
for Environmental & Health, 150 Stamford Street, London SE1 9NH, United Kingdom
*Corresponding authors: Marie Stiborová, Department of Biochemistry, Faculty of Science,
Charles University, Albertov 2030, 128 40 Prague 2, Czech Republic; Tel.: +420
22195121285; fax: +420 221951283; E-mail: [email protected]
Page 3
ABSTRACT
Benzo[a]pyrene (BaP) is a human carcinogen requiring metabolic activation prior to reaction
with DNA. Cytochrome P450 (CYP) 1A1 is the most important hepatic and intestinal enzyme
in both BaP activation and detoxification. CYP1A2 is also capable of oxidizing BaP, but to a
lesser extent. The induction of CYP1A1/2 by BaP and/or β-naphthoflavone in liver and small
intestine of rats was investigated. Both BaP and β-naphthoflavone induced CYP1A expression
and increased enzyme activities in both organs. Moreover, the induction of CYP1A enzyme
activities resulted in an increase in formation of BaP-DNA adducts detected by 32P-
postlabeling in rat liver and in the distal part of small intestine in vivo. The increases in
CYP1A enzyme activity were also associated with bioactivation of BaP and elevated BaP-
DNA adduct levels in ex vivo incubations of microsomes of both organs with DNA and BaP.
These findings indicate the stimulation effects of both compounds on BaP-induced
carcinogenesis.
Keywords: Benzo[a]pyrene; Metabolic Activation and Detoxification; Cytochrome P450
1A1/2; Induction; DNA adducts; 32P-postlabeling
Abbreviations: AHR, aryl hydrocarbon receptor; BaP, benzo[a]pyrene; BCIP, 5-bromo-4-
chloro-3'-indolyphosphate p-toluidine salt; BNF. β-naphthoflavone; BPDE, BaP-7,8-
dihydrodiol-9,10-epoxide; CYP, cytochrome P450; dG-N2-BPDE, 10-(deoxyguanosin-N2-
yl)-7,8,9-trihydroxy-7,8,9,10-tetrahydrobenzo[a]pyrene; DMSO, dimethyl sulfoxide; EROD,
7-ethoxyresorufin O-deethylation; NBT, nitro-blue tetrazolium chloride; mEH, microsomal
epoxide hydrolase; MROD, 7-methoxyresorufin O-deethylation; PAH, polycyclic aromatic
hydrocarbon; RAL, relative adduct labeling; TLC, thin-layer chromatography ; SDS, sodium
dodecyl sulfate.
Page 4
1. Introduction
Benzo[a]pyrene (BaP) is a polycyclic aromatic hydrocarbon (PAH) and has been classified as
human carcinogen (Group 1) by the International Agency for Research on Cancer (IARC,
2010). BaP and other PAHs are produced mainly by incomplete combustion of organic matter
and are ubiquitous in the environment, leading to measurable background levels of exposure
in the general population (IARC, 2010). Beside the inhalation of polluted air, the main
sources of exposure are tobacco smoke and diet (Baird et al., 2005; Hamouchene et al., 2011;
Phillips and Venitt, 2012). Chronic exposure of laboratory animals to BaP has been associated
with the development of cancer, primarily in the skin, stomach and lungs (IARC, 2010).
BaP requires metabolic activation catalyzed by cytochrome P450 (CYP) enzymes prior to
reaction with DNA (Baird et al., 2005). Of the CYP enzymes, CYP1A1 is one of the most
important enzymes in the metabolic activation of BaP to species forming DNA adducts (Baird
et al., 2005; Hamouchene et al., 2011), in combination with microsomal epoxide hydrolase
(mEH). First, CYP1A1 oxidizes BaP to an epoxide that is then converted to a dihydrodiol by
mEH (i.e. BaP-7,8-dihydrodiol); then further bioactivation by CYP1A1 leads to the ultimately
reactive species, BaP-7,8-dihydrodiol-9,10-epoxide (BPDE) that can react with DNA,
forming adducts preferentially at guanine residues (Fig. 1). The 10-(deoxyguanosin-N2-yl)-
7,8,9-trihydroxy-7,8,9,10-tetrahydrobenzo[a]pyrene (dG-N2-BPDE) adduct is the major
product of BPDE reaction with DNA in vitro and in vivo (Phillips and Venitt, 2012).
BaP is, however, oxidized also to other metabolites such as the other dihydrodiols, BaP-
diones and hydroxylated metabolites (Bauer et al., 1995; Chun et al., 1996; Kim et al., 1998;
Jiang et al., 2001; Zhu et al., 2008). Even though most of these metabolites are detoxification
products, BaP-9-ol is a precursor of 9-hydroxy-BaP-4,5-epoxide which can form another
adduct with deoxyguanosine (Fig. 1) (Schoket et al., 1989; Nesnow et al., 1993; Fang et al.,
2003). Thus, the levels and activities of CYP1A1 seem to be crucial for the initiation of BaP-
mediated carcinogenesis.
Page 5
The expression of CYP1A1 is known to be up-regulated by the aryl hydrocarbon receptor
(AHR) and BaP can bind to and activate AHR thereby enhancing its own metabolic activation
(Nebert et al., 2004). Furthermore, beside BaP itself, additional AHR ligands that induce
CYP1A1 can modulate BaP activation. Therefore, here we investigated the effect of the
flavonoid β-naphthoflavone (BNF), an inducer of this enzyme, and another member of the
CYP1A subfamily, CYP1A2, which can to some degree also participate in BaP activation
(Bauer et al., 1995), on BaP-derived DNA adduct formation in rat liver and small intestine.
Expression levels and activities of both CYP1A enzymes in these organs were also examined.
The electrochemical method of Western blotting was used to evaluate CYP1A1 and/or 1A2
expression, whereas DNA adduct formation was investigated by the thin-layer
chromatography (TLC)-32P-postlabeling method.
Page 6
2. Materials and methods
2.1. Animal experiments and isolation of microsomes
All animal experiments were conducted in accordance with the Regulations for the Care and
Use of Laboratory Animals (311/1997, Ministry of Agriculture, Czech Republic), which is in
compliance with the Declaration of Helsinki. Male Wistar rats (150 g, AnLab, Czech
Republic), were housed in groups of 3 in wire cages at 22°C with a 12 hr light/dark period
and ad libitum diet (ST-1 diet from Velaz, Czech Republic) and water access. Tested
compounds dissolved in sunflower oil (1 ml), BNF (60 mg/kg b.w.) and BaP (150 mg/kg
b.w.) were administered p.o. by gastric gavages in a single dose. BaP was applied 72 hr after
administration of a single dose of BNF. The control group was treated with 1 ml of sunflower
oil only. The rats were sacrificed 24 hr after the last treatment. Microsomes were prepared
from sections of small intestine and the whole liver immediately after sacrificing the rats, as
described previously (Krizkova et al., 2008; Hodek et al., 2011). Small intestine was removed
~2 cm under the stomach, divided into two parts (proximal and distal), each 15-20 cm long.
Tissues of 3 rats were pooled to isolate microsomes. Microsomal fractions were stored at
−80°C until analysis. Protein concentrations in the microsomal fractions were assessed using
the bicinchoninic acid protein assay with bovine serum albumin as a standard (Weichelman et
al., 1988). The concentration of CYP was estimated according to Omura and Sato (1964)
based on the absorption of the complex of reduced CYP with carbon monoxide.
2.2. Determination of CYP1A protein levels by Western blotting
CYP1A1 and 1A2 were detected by the electrochemical method of Western blotting on
Immobilon-P membrane (Millipore, Bedford, MA) using specific chicken anti-CYP1A1/2 and
anti-CYP1A2 antibodies prepared as described previously (Stiborová et al., 2002; Hodek et
al., 2013). For sodium dodecyl sulfate (SDS)-electrophoresis (8% polyacrylamide gel) 30 µg
Page 7
and 15 µg protein/well of small intestine and liver microsomes, respectively, was applied.
Western blotting was carried out as described earlier (Krizkova et al., 2008; Hodek et al.,
2011; Stiborová et al., 2002; Hodek et al., 2013; Stiborová et al., 2002; Hodek et al., 2013;
Macova et al., 2013; Vranova et al., 2013). Visualization was performed using an anti-chicken
IgG alkaline phosphatase-conjugated antibody and nitro-blue tetrazolium chloride (NBT)/5-
bromo-4-chloro-3'-indolyphosphate p-toluidine salt (BCIP) tablets containing 10 mg substrate
for alkaline phosphatase.
2.3. Measurement of CYP1A1 and 1A2 enzyme activities
Each microsomal sample was analyzed for specific CYP1A1 and 1A2 activities by
monitoring the following reactions: 7-ethoxyresorufin O-deethylation (EROD) (CYP1A1/2)
and 7-methoxyresorufin O-deethylation (MROD) (CYP1A2), according to the method
described by Burke and Mayer (1974). Briefly, incubation mixtures, containing the final
volume of 150 µl, consisted of 100 mM potassium phosphate buffer (pH 7.4), 0.5 mM
NADPH, 0.5 mg of microsomal protein and 2.2 µM 7-ethoxyresorufin (7-methoxyresorufin)
(dissolved in 1.5 µl dimethyl sulfoxide, DMSO). The reaction was initiated by adding
NADPH. The formation of resorufin was continuously measured on luminescence
spectrometer (PerkinElmer LS-55 equipped with 96-well plate reader) for 10 minutes at room
temperature by monitoring its fluorescence (excitation and emission wavelengths of 530 and
585 nm, respectively) (Stiborová et al., 2006; Krizkova et al., 2008; Hodek et al., 2011;
Vranova et al., 2013). The dealkylation rate was estimated on the basis of a resorufin standard
curve.
2.4. BaP-DNA adduct analysis by 32P-postlabeling
The DNA was isolated from liver and small intestine by standard phenol/chloroform
extraction (Stiborová et al., 2006). DNA adducts formed by BaP were determined by 32P-
Page 8
postlabeling analysis using the nuclease P1 enrichment version (Stiborová et al., 2006;
Poljakova et al., 2013), and thin-layer chromatography (TLC) was performed as described
(Arlt et al., 2008; 2012). After chromatography, TLC sheets were scanned using a Packard
Instant Imager (Dowers Grove, USA) and DNA adduct levels (RAL, relative adduct labeling)
were calculated as described (Stiborová et al., 2006; Poljakova et al., 2013). Results were
expressed as DNA adducts/108 nucleotides.
2.5 BaP-DNA adduct formation in vitro and their analysis
Incubation mixtures used to assess DNA adduct formation by BaP activated with microsomes
isolated from rat liver and small intestine consisted of 50 mM potassium phosphate buffer (pH
7.4), 1 mM NADPH, 0.5 mg of microsomal proteins and 0.5 mg of calf thymus DNA in a
final volume of 750 µl. The reaction was initiated by adding 0.1 mM BaP (dissolved in 7.5 µl
DMSO). Incubations at 37°C were carried out for 90 min; BaP-DNA adduct formation was
linear up to 120 min (Arlt et al., 2008). Control incubations were carried out either without
microsomes, without NADPH, without DNA, or without BaP. After the incubation, DNA was
isolated from the residual water phase by the phenol/chloroform extraction method and BaP-
DNA adducts analyzed with the nuclease P1 version of the 32P-postlabeling technique as
described (Stiborová et al., 2006; Arlt et al., 2008; 2012; Poljakova et al., 2013).
2.6 Statistical analyses
For statistical data analysis we used Student’s t-test. All P-values are two-tailed and
considered significant at the 0.05 level.
Page 9
3. Results and Discussion
3.1. The effect of BaP and BNF on expression of CYP1A1/2 in rat liver and small intestine
When rats were treated with BNF or BaP, an increase in expression levels of CYP1A1 and
1A2 proteins determined with Western blotting was found in microsomes isolated from rat
liver (Fig. 2), and this increase corresponded to EROD and MROD activities in these
microsomes (Table 1). Pretreatment of rats with BNF prior to their treatment with BaP also
resulted in elevated EROD and MROD activities in microsomes of this organ, however only
the increase in CYP1A2 protein, but not CYP1A1, correlated with higher enzyme activity
(see Fig. 2 and Table 1). Now, we cannot explain this phenomenon. The measurement of
CYP1A1 activity seems to be more suitable to investigate the changes in CYP1A1 than
determination of the CYP1A1 protein levels by Western blotting.
In microsomes of the proximal and distal parts of small intestine, BaP and BNF also
induced expression of CYP1A1 and its activity, but treatment of rats with BaP had a higher
induction effect on this enzyme than their pretreatment with BNF prior to treatment with BaP.
The CYP1A1 expression levels and its specific activity (EROD) in small intestine were
higher in its proximal part than in its distal part (Fig. 3 and Table 2).
3.2. The effect of BaP and BNF on BaP-DNA adduct formation in rat liver and small intestine
Treatment of rats with a single dose of BaP resulted in formation of three BaP-derived DNA
adducts (assigned as adduct spots 1-3 in Fig. 4A and 4B) detectable by 32P-postlabeling in the
liver and the proximal and distal parts of the small intestine. Two of these adducts were
tentatively identified to be dG-N2-BPDE (adduct spot 2) (Arlt et al., 2008; 2012) and the
adduct derived from a reaction of deoxyguanosine in DNA with 9-hydroxy-BaP-4,5-epoxide
(adduct spot 1) (Fig. 1) (Schoket et al., 1989; Nesnow et al., 1993; Fang et al., 2003). This
BaP metabolite is bound to the exocyclic amino group of a guanine residue, and the site of
Page 10
attachment is most likely either the 4 or the 5 position on the BaP-4,5-epoxide (Fang et al.,
2003). A structure of another BaP-DNA adduct (adduct spot 3) has not been characterized as
yet.
Up to 4.6-fold higher levels of BaP-DNA adducts were found in the small intestine than
in the liver (Table 3). Furthermore, significantly higher levels of BaP-DNA adducts 2 and 3
were found in the proximal part of the small intestine than in its distal part, whereas levels of
BaP-DNA adduct 1 in these parts of small intestine did not change. Pretreatment of rats with
the CYP1A inducer BNF led to an increase in all BaP-DNA adduct levels in the liver and, to a
lesser extent, in the distal part of the small intestine. However, almost no effect of this
pretreatment was found on BaP-DNA adduct formation in the proximal part of small intestine
(Table 3). The increase in levels of BaP-DNA adducts in the liver correlated with CYP1A1
and 1A2 enzyme activities in this organ (compare Tables 1 and 3).
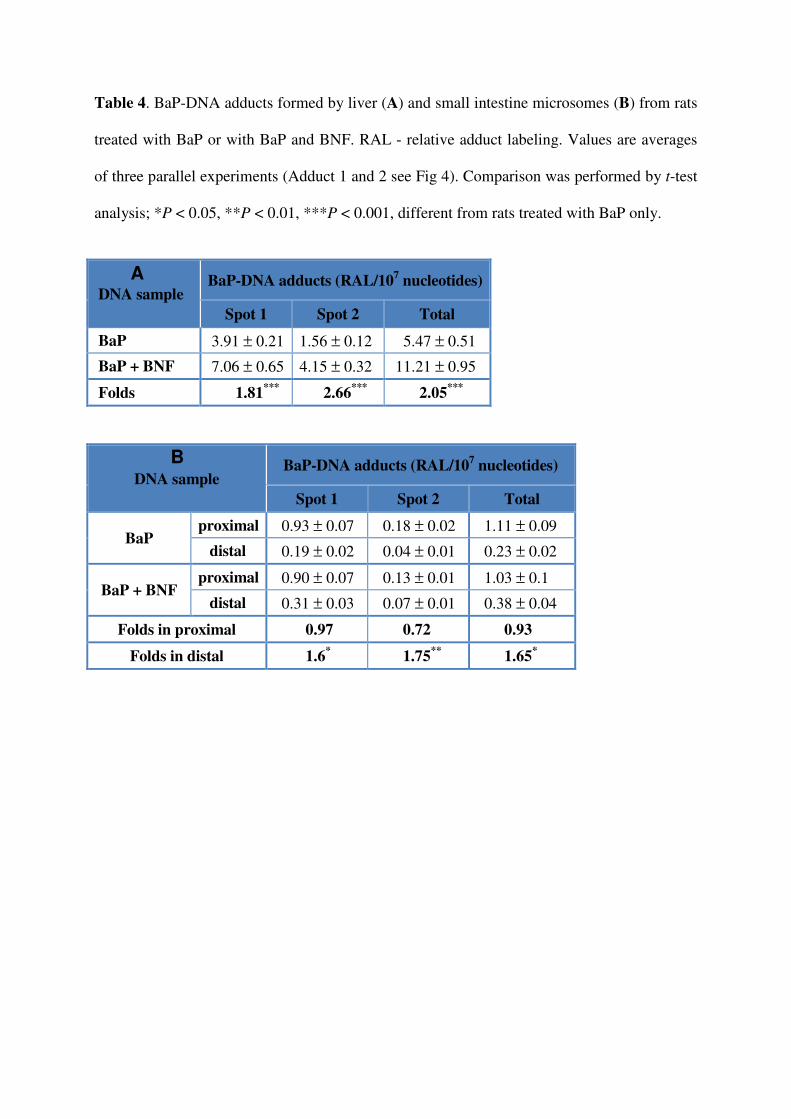
Interestingly, when BaP was incubated with microsomes isolated from liver and small
intestine of rats treated with BaP or with BNF prior to BaP treatment, only two BaP-DNA
adducts were generated (see adduct spots 1 and 2 in Fig. 4C and 4D). Hence, formation of
BaP-DNA adduct 3 found in vivo should be mediated not only by BaP activation with CYP
enzymes present in the membrane of endoplasmic reticulum, but probably also by additional
enzymes. Moreover, in contrast to results found in vivo, higher levels of BaP-DNA adducts
were formed in ex vivo incubations of BaP and DNA with hepatic microsomes relative to
microsomes of the small intestine (Table 4). Pretreatment of rats with BNF increased
efficiencies of hepatic microsomes to generate BaP-DNA adducts (up to 2.7-fold), but either
no or a low increase in efficacy of small intestine microsomes to form BaP-DNA adducts was
found.
The levels of BaP-DNA adducts formed in DNA incubated with BaP and microsomes of
liver corresponded to CYP1A1/2 activities (EROD and MROD) found in these microsomes
(Tables 1 and 4). Likewise, higher amounts of BaP-DNA adducts formed in microsomes of
Page 11
the proximal than in distal part of the small intestine correlated with expression levels of
CYP1A1 and its enzyme activities in these microsomes (Fig. 3, Tables 2 and 3). However,
whereas a minor, but significant, increase in BaP-DNA adduct formation was found in
microsomes of the distal part of small intestine caused by pretreatment of rats with BNF prior
to BaP exposure, no increase in expression of CYP1A1 and its enzyme activity was detected
in these microsomes (Fig. 3, Tables 1, 2 and 4). In addition, the higher levels of BaP-DNA
adducts found in the small intestine than in the liver in vivo contrasted with almost 70-fold
higher CYP1A1 activities in liver microsomes relative to microsomes of the small intestine
(Figures 1 and 2 and Table 4).
All these results suggest that not only the activity of CYP1A1 (and/or CYP1A2 in the
liver) and their induction by BaP or BNF, but also additional factors influence BaP-DNA
adduct formation in vivo in rats. This finding is consistent with suggestions of Uno et al.
(2001; 2004; 2006) that the level of BaP-DNA adducts in cells depends not only on the
metabolism of BaP by phase I enzymes (activation) to reactive DNA-binding species and/or
on BaP-induced expression of the enzymes involved in BaP activation (i.e. CYP1A1). Several
studies demonstrated a rather enigmatic role of CYP 1A1 in BaP activation metabolism in
vivo. The controversial results have been found, showing a more important role of CYP1A1 in
vivo in BaP detoxification than in its activation (Uno et al., 2001; 2004; 2006; Arlt et al.,
2008; 2012). Indeed, Uno et al. (2001) showed that absence of the Cyp1a1 enzyme protects
the intact animal from BaP-mediated liver toxicity and death, by decreasing the formation of
large amounts of toxic metabolites, whereas much slower metabolic clearance of BaP in
Cyp1a1(-/-) mice leads to greater formation of BaP-DNA adducts. Using the Hepatic P450
Reductase Null (HRN) and the Reductase Conditional Null (RCN) mouse model we also
showed that hepatic CYP enzymes appear to be more important for detoxification of BaP in
vivo (Arlt et al., 2008; 2012). In HRN and RCN mice NADPH:CYP oxidoreductase, the
essential electron donor to CYPs is deleted specifically in hepatocytes, resulting in a decrease
Page 12
in hepatic CYP function (Henderson et al., 2003; Finn et al., 2007). We found however that
the levels of dG-N2-BPDE adducts in livers of these mice treated with BaP were higher than
in WT mice (Arlt et al., 2008; 2012). Therefore, these and other factors such as: (i)
detoxification of reactive BaP metabolites by both phase I and phase II enzymes
(conjugation), (ii) rate of repair of BaP-DNA adducts, and (iii) BaP-induced expression of
genes of enzymes involved in BaP detoxification or in DNA damage response (Uno et al.,
2004; 2006), might also influence BaP-DNA adduct levels in vivo. However, the impacts of
those factors on BaP-DNA adduct formation in the present study in vivo remain to be
explored.
The results of this study demonstrate that the administration of BNF, BaP or BNF
prior to BaP treatment induces CYP1A enzymes in rat liver and the distal part of the small
intestine which leads to increased BaP-DNA adduct formation. The results also indicate that
the electrochemical method of Western blotting is a suitable tool in evaluating the expression
of CYP1A enzymes which, besides other factors, contributes to the risk of BaP-induced
cancer development in various organisms including humans.
Conflict of interest
The authors declare that there are no conflicts of interest.
Acknowledgements
Financial support from Grant Agency of Czech Republic (grant P303/12/G163) is highly
acknowledged.
Page 13
REFERENCES
Arlt, V.M., Stiborová, M., Henderson, C.J., Thiemann, M., Frei, E., Aimová, D., Singhs, R.,
da Costa, G.G., Schmitz, O.J., Farmer, P.B., Wolf, C.R., Philips, D.H., 2008. Metabolic
activation of benzo[a]pyrene in vitro by hepatic cytochrome P450 contrasts with
detoxification in vivo: experiments with hepatic cytochrome P450 reductase null mice.
Carcinogenesis 29, 656-665.
Arlt, V.M., Poirier, M.C., Sykes, S.E., Kaarthik, J., Moserova, M., Stiborova, M., Wolf, R.,
Henderson, C.J., Phillips D.H., 2012. Exposure to benzo[a]pyrene of hepatic cytochrome
P450 reductase null (HRN) and P450 reductase conditional null (RCN) mice: detection
of benzo[a]pyrene diol epoxide-DNA adducts by immunohistochemistry and 32P-
postlabelling. Toxicol. Lett. 213, 160-166.
Baird, W.M., Hooven, L.A., Mahadevan, B., 2005. Carcinogenic polycyclic aromatic
hydrocarbon-DNA adducts and mechanism of action. Environ. Mol. Mutagen. 45, 106–
114.
Bauer, E., Guo, Z., Ueng, Y.F., Bell, L.C., Zeldin, D., Guengerich, F.P. 1995. Oxidation of
benzo[a]pyrene by recombinant human cytochrome P450 enzymes. Chem. Res. Toxicol.
8, 136-142.
Burke, M.D., Mayer, R.T., 1974. Ethoxyresorufin: direct fluorimetric assay of a microsomal
O-dealkylation which is preferentially inducible by 3-methylcholanthrene. Drug Metab.
Dispos. 2, 583-588.
Fang, A.H., Smith, W.A., Vouros, P., Gupta, R.C., 2001. Identification and characterization
of a novel benzo[a]pyrene-derived DNA adduct. Biochem. Biophys. Res. Commun. 281,
383-389.
Finn, R.D., McLaughlin, L.A., Ronseaux, S., Rosewell, I., Houston, J.B., Henderson, C.J.,
Wolf, C.R., 2008. Defining the in vivo role for cytochrome b5 in cytochrome P450
Page 14
function through the conditional hepatic deletion of microsomal cytochrome b5. J. Biol.
Chem. 283, 31385-31393.
Chun, Y.J. Shimada, T., Guengerich, F.P., 1996. Construction of a human cytochrome P450
1A1: rat NADPH-cytochrome P450 reductase fusion protein cDNA and expression in
Escherichia coli, purification, and catalytic properties of the enzyme in bacterial cells
and after purification. Arch. Biochem. Biophys. 330, 48-58.
Hamouchene, H., Arlt, V.M., Giddings, I., Phillips, D.H., 2011. Influence of cell cycle on
responses of MCF-7 cells to benzo[a]pyrene. BMC Genomics 12, 333.
Henderson, C.J., Otto, D.M., Carrie, D., Magnuson, M.A., McLaren, A.W., Rosewell, I.,
Wolf, C.R., 2003. Inactivation of the hepatic cytochrome P450 system by conditional
deletion of hepatic cytochrome P450 reductase. J. Biol. Chem. 278, 13480-13486.
Hodek, P., Krizkova, J., Frei, E., Singh, R., Arlt, V.M., Stiborova, M., 2011. Impact of beta-
naphthoflavone on genotoxicity of food-derived carcinogens. Neuro Endocrinol. Lett.
32 Suppl 1, 25-34.
Hodek, P., Trefil, P., Šimůnek, J., Hudeček, J., Stiborova, M., 2013. Optimized protocol of
chicken antibody (IgY) purification providing electrophoretically homogenous
preparations. Int. J. Electrochem. Sci. 8, 113-124.
IARC Monogr. Eval. Carcinog. Risk Chem. Hum. 2010. Some non-heterocyclic polycyclic
aromatic hydrocarbons and some related exposures. IARC Monogr. Eval. Carcinog.
Risks Hum. 92, 1-853.
Jiang, H., Gelhaus, S.L., Mangal, D., Harvey, R.G., Blair, I.A., Penning, T.M., 2007.
Metabolism of benzo[a]pyrene in human bronchoalveolar H358 cells using liquid
chromatography-mass spectrometry. Chem. Res. Toxicol. 20, 1331-1341.
Kim, J.H., Stansbury, K.H., Walker, N.J,, Trush, M.A., Strickland, P.T., Sutter, T.R. 1998.
Metabolism of benzo[a]pyrene and benzo[a]pyrene-7,8-diol by human cytochrome P450
1B1. Carcinogenesis 19, 1847-1853.
Page 15
Krizkova, J., Burdova, K., Hudecek, J., Stiborova, M., Hodek, P., 2008. Induction of
cytochromes P450 in small intestine by chemopreventive compounds. Neuro Endocrinol,
Lett. 29, 717-721.
Macova, I., Krizkova, J., Frankova, J., Sulc, M., Stiborova, M., Hodek, P., 2013. Keratin
cross-reactivity in electro-transfer (Western blot): how to suppress it. Int. J. Electrochem.
Sci. 8, 1551-1558.
Nebert, D.W., Dalton, T.P., Okey, A.B., Gonzalez, F,J., 2004. Role of aryl hydrocarbon
receptor-mediated induction of the CYP1 enzymes in environmental toxicity and cancer.
J. Biol. Chem. 279, 23847-23850.
Nesnow, S., Ross, J., Nelson, G., Holden, K., Erexson, G., Kligerman, A., Gupta, R.C., 1993.
Quantitative and temporal relationships between DNA adduct formation in target and
surrogate tissues: implications for biomonitoring. Environ. Health Perspect. 101 Suppl 3,
37-42.
Omura, T., Sato, R., 1964. The carbon monoxide-binding pigment of liver microsomes. I.
Evidence fot its hemoprotein nature. J. Biol. Chem. 239, 2370-2378.
Poljakova, J., Eckschlager, T., Kizek, R., Frei, E., Stiborová, M., 2013. Electrochemical
determination of enzymes metabolizing ellipticine in thyroid cancer cells - a tool to
explain the mechanism of ellipticine toxicity to these cells. Int. J. Electrochem. Sci. 8,
1573-1585.
Phillips, D.H., Venitt, S., 2012. DNA and protein adducts in human tissues resulting from
exposure to tobacco smoke. Int. J. Cancer 131, 2733-2753.
Schoket, B., Lévay, K., Philips, D.H., Vincze, I., 1989. 32P-postlabelling analysis of DNA
adducts of benzo[a]pyrene formed in complex metabolic activation systems in vitro.
Cancer Lett. 48, 67-75.
Page 16
Stiborová, M., Martínek, V., Rýdlová, H., Hodek, P., Frei, E., 2002. Sudan I is a potential
carcinogen for humans: Evidence for its metabolic activation and detoxication by human
recombinant cytochrome P450 1A1 and liver microsomes. Cancer Res. 62, 5678–5684.
Stiborová, M., Dracinska, H., Hajkova, J., Kaderabkova, P., Frei, E., Schmeiser, H. H.,
Soucek, P., Phillips, D. H., Arlt, V.M., 2006. The environmental pollutant and
carcinogen 3-nitrobenzanthrone and its human metabolite 3-aminobenzanthrone are
potent inducers of rat hepatic cytochromes P450 1A1 and -1A2 and NAD(P)H:quinone
oxidoreductase. Drug Metab. Disp. 34, 1398-1405.
Vranova, I., Moserova, M., Hodek, P., Kizek, R., Frei, E., Stiborová, M., 2013. The anticancer
drug ellipticine induces cytochromes P450 1A1, 1A2 and 3A, cytochrome b5 and
NADPH:cytochrome P450 in rat liver, kidney and lung. Int. J. Electrochem. Sci. 8, 1586-
1597.
Uno, S., Dalton, T.P., Shertzer, H.G., Genter, M.B., Warshawsky, D., Talaska, G., Nebert, D.
W., 2001. Benzo[a]pyrene-induced toxicity: paradoxical protection in Cyp1a1(-/-)
knockout mice having increased hepatic BaP-DNA adduct levels. Biochem. Biophys.
Res. Commun. 289, 1049-1056.
Uno, S., Dalton, T.P., Derkenne, S., Curran, C.P., Miller, M.L., Shertzer, H.G., Nebert, D. W.,
2004. Oral exposure to benzo[a]pyrene in the mouse: detoxication by inducible
cytochrome P450 is more important than metabolic activation. Mol. Pharmacol. 65,
1225–1237.
Uno, S., Dalton, T.P., Dragin, N., Curran, C.P., Derkenne, S., Miller, M.L., Shertzer, H.G.,
Gonzalez, F.J., Nebert, D.W., 2006. Oral benzo[a]pyrene in Cyp1 knockout mouse lines:
CYP1A1 important in detoxication, CYP1B1 metabolism required for immune damage
independent of total-body burden and clearance rate. Mol. Pharmacol. 69, 1103–14.
Page 17
Wiechelman, K.J., Braun, R.D., Fitzpatrick, J.D., 1988. Investigation of the bicinchoninic
acid protein assay: identified cation of the groups responsible for color formation. Anal.
Biochem. 175, 231–237.
Zhu, S., Li, L., Thornton, C., Carvalho, P., Avery, B.A., Willett, K.L., 2008. Simultaneous
determination of benzo[a]pyrene and eight of its metabolites in Fundulus heteroclitus
bile using ultra-performance liquid chromatography with mass spectrometry. J.
Chromatogr. B Analyt. Technol. Biomed. Life Sci. 863, 141-149.
Page 18
Table 1. CYP1A1/2 (EROD) and 1A2 (MROD) activities in rat liver microsomes. Reaction
rates are means of three parallel experiments ± SD. Comparison was performed by t-test
analysis: *P < 0.05, **P < 0.01, ***P < 0.001, different to untreated (UT).
Liver microsomes
Resorufin formation (pmol resorufin/min/mg protein)
CYP1A1 - EROD CYP1A2 - MROD
UT 21.5 ± 1.3 38.3 ± 2.2
BNF 527.1 ± 41.2 ** 210.3 ± 12.5 *
BaP 840.6 ± 57.6 ** 337.5 ± 29.9 **
BaP + BNF 1742.5 ± 113.3 *** 1024.7 ± 37.1 **
Page 19
Table 2. CYP1A1 (EROD) activity in microsomes of rat small intestite. Reaction rates are
means of three parallel experiments ± SD. Comparison was performed by t-test analysis: *P
< 0.05, **P < 0.01, ***P < 0.001, different to untreated (UT).
Microsomes of small intestine
CYP1A1 - EROD (pmol resorufin/min/mg protein)
proximal distal
UT 1.0 ± 0.1 0.5 ± 0.05
BNF 120.5 ± 9.8 *** 20.0 ± 1.7 *
BaP 279.1 ± 22.3 *** 33.2 ± 2.9 **
BaP + BNF 243.2 ± 19.5 *** 23.7 ± 1.2 *
Page 20
Table 3. BaP-DNA adduct formation in liver (A) and small intestine (B) of rats treated with
BaP or with BaP and BNF. RAL - relative adduct labeling. Values are averages of three
parallel experiments ± SD (Adduct 1, 2 and 3 see Fig 4). Comparison was performed by t-test
analysis; *P < 0.05, **P < 0.01, ***P < 0.001, different from rats treated with BaP only.
DNA sample BaP-DNA adducts (RAL/10
7 nucleotides)
Spot 1 Spot 2 Spot 3 Total
BaP 0.61 ± 0.06 1.00 ± 0.10 0.79 ± 0.08 2.40 ± 0.24
BaP + BNF 1.28 ± 0.13 1.75 ± 0.17 2.75 ± 0.27 5.78 ±0.58
Folds 2.10***
1.75***
3.48***
2.40***
DNA sample BaP-DNA adducts (RAL/10
7 nucleotides)
Spot 1 Spot 2 Spot 3 Total
BaP proximal 3.85 ± 0.38 2.82 ± 0.28 4.39 ± 0.44 11.06 ± 1.10
distal 4.40 ± 0.44 1.56 ± 0.15 1.64 ± 0.16 7.60 ± 0.76
BaP + BNF proximal 5.15 ± 0.51 2.97 ± 0.30 3.96 ± 0.40 12.08 ± 1.21
distal 4.02 ± 0.40 1.85 ± 0.18 2.64 ± 0.26 8.51 ± 0.85
Folds in proximal 1.34**
1.05 0.90 1.09
Folds in distal 0.91 1.19**
1.61***
1.12*
A
B
Page 21
Table 4. BaP-DNA adducts formed by liver (A) and small intestine microsomes (B) from rats
treated with BaP or with BaP and BNF. RAL - relative adduct labeling. Values are averages
of three parallel experiments (Adduct 1 and 2 see Fig 4). Comparison was performed by t-test
analysis; *P < 0.05, **P < 0.01, ***P < 0.001, different from rats treated with BaP only.
DNA sample BaP-DNA adducts (RAL/10
7 nucleotides)
Spot 1 Spot 2 Total
BaP 3.91 ± 0.21 1.56 ± 0.12 5.47 ± 0.51
BaP + BNF 7.06 ± 0.65 4.15 ± 0.32 11.21 ± 0.95
Folds 1.81***
2.66***
2.05***
DNA sample BaP-DNA adducts (RAL/10
7 nucleotides)
Spot 1 Spot 2 Total
BaP proximal 0.93 ± 0.07 0.18 ± 0.02 1.11 ± 0.09
distal 0.19 ± 0.02 0.04 ± 0.01 0.23 ± 0.02
BaP + BNF proximal 0.90 ± 0.07 0.13 ± 0.01 1.03 ± 0.1
distal 0.31 ± 0.03 0.07 ± 0.01 0.38 ± 0.04
Folds in proximal 0.97 0.72 0.93
Folds in distal 1.6* 1.75
** 1.65
*
A
B
Page 22
Legends to Figures
Figure 1. Proposed pathways of biotransformation and DNA adduct formation of BaP
catalyzed by CYP1A1 and mEH. The two-step activation process by CYP1A1 leading to
the formation of the ultimately reactive species, 9-hydroxy-BaP-4,5-epoxide, that can
react with deoxyguanosine in DNA (adduct 1) is shown in the left part of the figure. The
typical three-step activation process with oxidation by CYP1A1 followed by hydrolysis
by mEH leads to the ultimately reactive species, BPDE, forming the dG-N2-BPDE adduct
(adduct 2) is shown in the right part of the figure.
Figure 2. Immunodetection of induced CYP1A1 and 1A2 in liver microsomes from untreated
(UT), or BNF, BaP or BaP and BNF (BaP+BNF) pretreated animals. Values are given as
means of three parallel experiments. Comparison was performed by t-test analysis: *P <
0.05, **P < 0.01, ***P < 0.001, different to UT.
Figure 3. Immunodetection of induced CYP1A1 in microsomes isolated from the proximal
and distal parts of small intestine of rat either untreated (UT), or treated with BNF, BaP or
BaP and BNF (BaP+BNF). Values are given as means of three parallel experiments.
Comparison was performed by t-test analysis: ***P < 0.001, different to UT.
Figure 4. BaP-DNA adduct formation in rat liver (A) and small intestine (B) in vivo and in
incubations of BaP and DNA with rat liver (C) and small intestine (D) microsomes ex
vivo. DNA adducts were analyzed by the 32P-postlabeling method.
Page 24
Figure 2
UT BNF BaP BaP+BNF
Arb
itra
ry u
nits
0
5000
10000
15000
20000
25000
30000
35000
UT BNF BaP BaP+BNF
CY
P1
A2
co
nte
nt (A
U/m
g p
rote
in)
0
5000
10000
15000
20000
25000
30000
35000
**
**
UT BNF BaP BaP+BNF
CY
P1
A1 c
onte
nt (A
U/m
g p
rote
in)
0
5000
10000
15000
20000
25000
30000
***
**
***
*
**
CYP1A1 CYP1A2
Page 25
Figure 3
UT
BN
F
BaP
Ba
P+
BN
F
UT
BN
F
BaP
Ba
P+
BN
F
0
10000
20000
30000
40000
50000
60000
BaP
+B
NF
BaP
+B
NF
CY
P1A
1 c
onte
nt (A
U/m
g p
rote
in)
***
***
***
***
***
***
CYP1A1
***
Page 26
Figure 4
in vivo
ex vivo


![Banarsidas Chandiwala Institute of Physiotherapy (BCIP)1].08.pdf · BCIP Today 2 Banarsidas Chandiwala Institute of Physiotherapy (BCIP) is one of the Institutes being run by the](https://static.documents.pub/doc/80x56/5fc4b4dd83871d271f008655/banarsidas-chandiwala-institute-of-physiotherapy-bcip-108pdf-bcip-today-2.jpg)


