1000 Park Forty Plaza Drive, Suite 120 Durham, North Carolina 27713 www.MetaMetricsInc.com www.Lexile.com Linking the R-CBM and MAZE with The Lexile Framework ® for Reading A Study to Link the Reading Curriculum-Based Measurement and Reading Maze with the Lexile Framework September 14, 2011 Prepared by MetaMetrics for: Pearson
Transcript
1000 Park Forty Plaza Drive, Suite 120 Durham, North Carolina 27713
www.MetaMetricsInc.com www.Lexile.com
Linking the R-CBM and MAZE with The Lexile Framework® for Reading
A Study to Link the Reading Curriculum-Based Measurement and Reading Maze with the Lexile Framework
Warning: No part of this publication may be reproduced or transmitted in any form or by any means, electronic or mechanical, including photocopy, recording, or any information storage and retrieval system without permission in writing from the copyright owner.
MetaMetrics®, the MetaMetrics® logo and tagline, Lexile®, Lexile Framework®, Lexile Analyzer® and the Lexile® logo are trademarks of MetaMetrics, Inc., and are registered in the United States and abroad. The trademarks and names of other companies and products mentioned herein are the property of their respective owners.
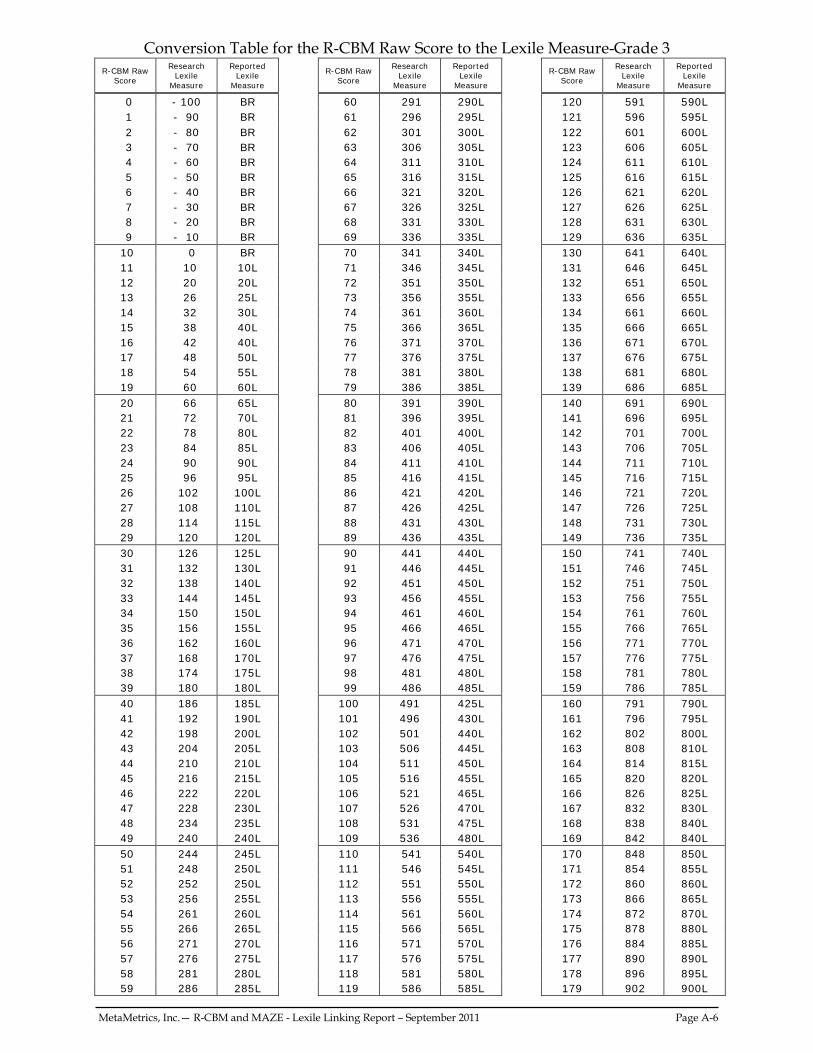
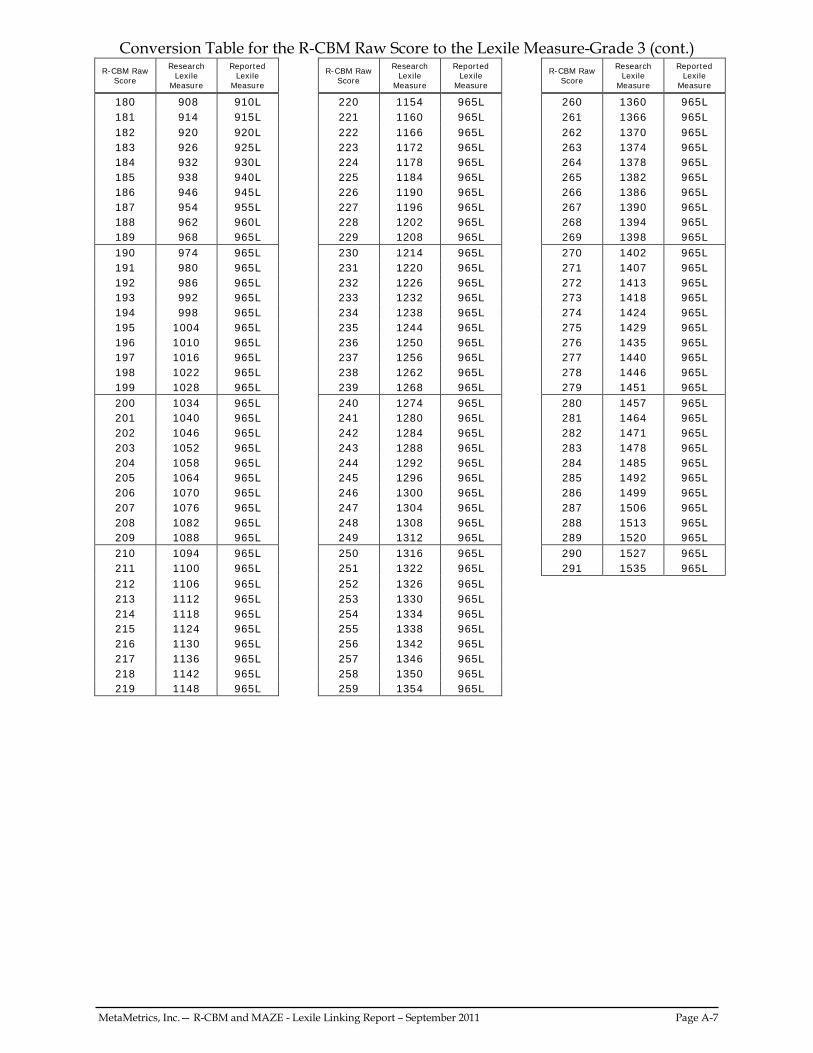
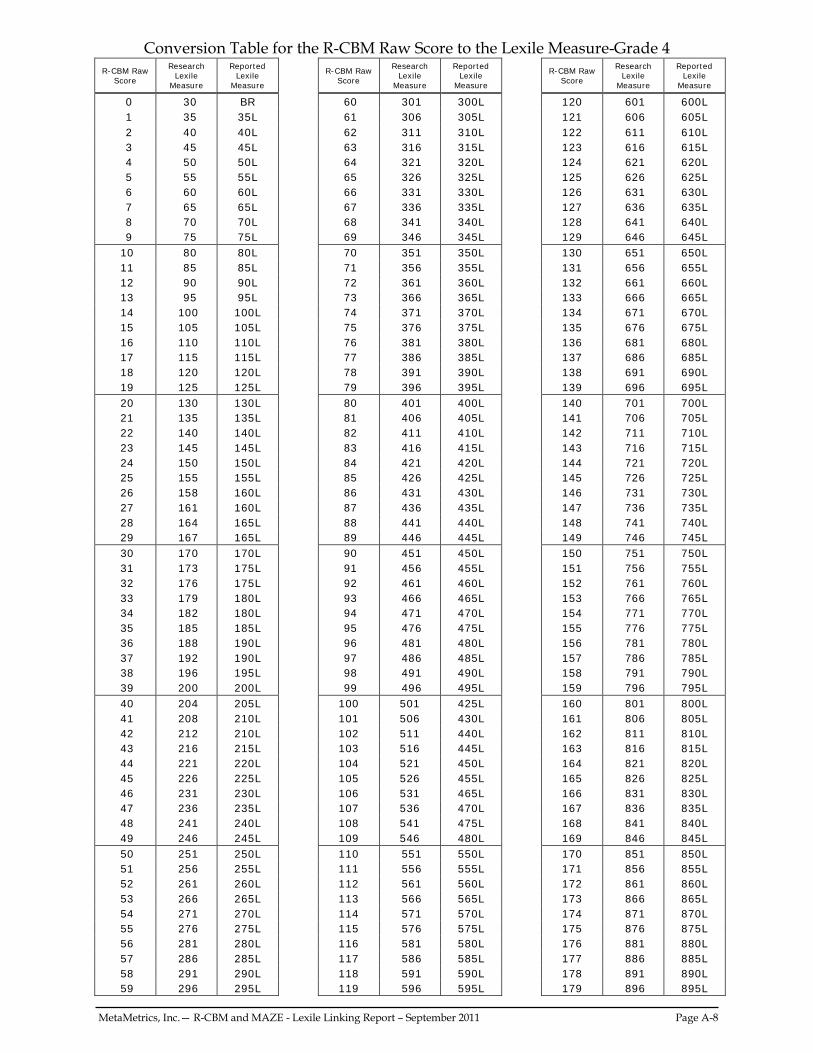
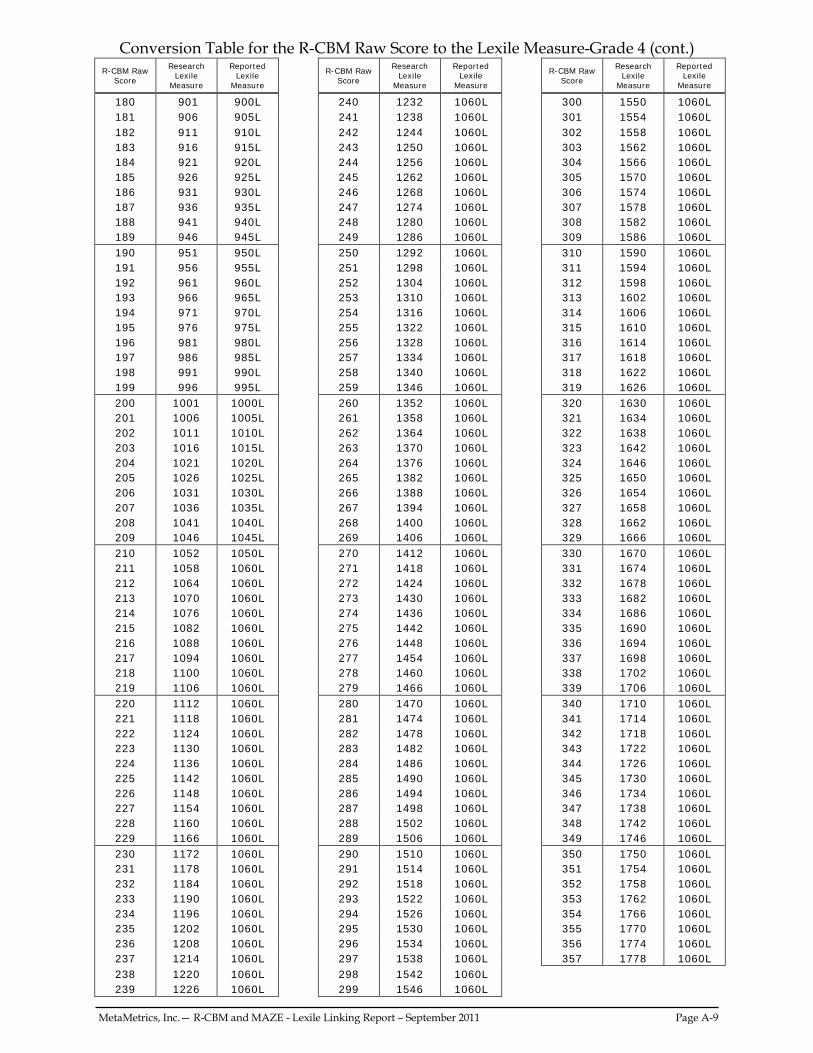
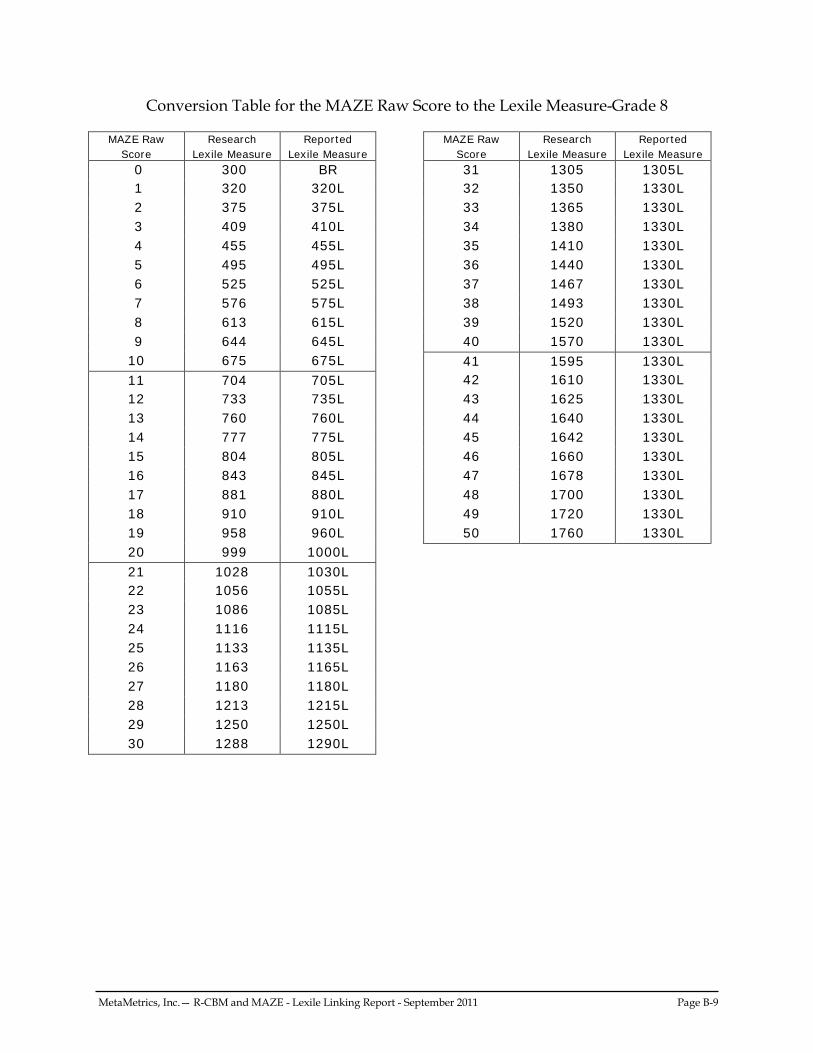
Appendix A: Conversion Tables for R-CBM.................................................................... A-1
Appendix B: Conversion Tables for MAZE ...................................................................... B-1
MetaMetrics, Inc.— R-CBM and MAZE - Lexile Linking Report – September 2011 Page 1
Introduction Often it is desirable to convey more information about test performance than can be incorporated into a single primary score scale. Two examples arise in large-scale assessment. In one situation, one test can provide a unique type of information (such as national comparisons available from NAEP) but is not administered very often. At the same time another test is administered more often, but is not able to provide the breadth of information (such as a state assessment). An auxiliary score scale for a test can be established to provide this additional information through assessment scale linkages. Once linkages are established between the two assessments, then the results of the more-frequently-administered assessment can be translated in terms of the scale for the other assessment. In another situation, the linkage between two score scales can be used to provide a context for understanding the results of one of the assessments. For example, sometimes it is hard to explain what a student can read based on the results of a reading comprehension test. Parents typically ask the questions “If my child is in the fourth grade and scores 140 on the Reading Curriculum-Based Measurement (R-CBM), what does this mean?” or “Based on my child’s test results, what can he or she read and how well?” or “Is my child well prepared to meet the reading demands of grade-level materials?” Once a linkage is established with an assessment that is related to specific book or text titles, then the results of the assessment can be explained and interpreted in the context of the specific titles that a student can read. Auxiliary score scales can be used to “convey additional normative information, test-content information, and information that is jointly normative and content based. For many test uses, an auxiliary scale conveys information that is more crucial than the information conveyed by the primary score scale. In such instances, the auxiliary score is the one that is focused on, and the primary scale can be viewed more as a vehicle for maintaining interpretability over time” (Petersen, Kolen, & Hoover, 1989, p. 222). One such auxiliary scale is The Lexile Framework for Reading, which was developed to appropriately target readers with text at a level that provides challenge but not frustration. Linking assessment results with the Lexile Framework provides a mechanism for targeting each student’s reading ability with text on a common scale. It serves as an anchor to which texts and assessments can be connected allowing parents, teachers, and administrators to speak the same language. By using the Lexile Framework, the same
MetaMetrics, Inc.— R-CBM and MAZE - Lexile Linking Report – September 2011 Page 2
metric is applied to the books the children read, the tests they take, and the results that are reported. Parents often ask questions like the following:
• How can I help my child become a better reader? • How do I challenge my child to read?
Questions like these can be challenging for parents and educators. By linking the R-CBM and MAZE with The Lexile Framework for Reading, educators and parents will be able to answer these questions and will be better able to use the results from the test to improve instruction and to develop each student’s level of reading comprehension. This research study was designed to determine a mechanism to provide reading levels that can be targeted to text based on the test scores. The study was funded by Pearson and conducted by the staff at MetaMetrics, Inc. in collaboration with the staff at Pearson. The primary purposes of this study were to:
present a solution for targeting readers with text; provide Pearson with Lexile measures on R-CBM and MAZE; release conversion tables for predicting Lexile measures from the R-CBM and
MAZE results; and produce a report that describes the linking analysis procedures.
MetaMetrics, Inc.— R-CBM and MAZE - Lexile Linking Report – September 2011 Page 3
The Lexile Framework for Reading All symbol systems share two features: a semantic component and a syntactic component. In language, the semantic units are words. Words are organized according to rules of syntax into thought units and sentences (Carver, 1974). In all cases, the semantic units vary in familiarity and the syntactic structures vary in complexity. The comprehensibility or complexity of a message is dominated by the familiarity of the semantic units and by the complexity of the syntactic structures used in constructing the message. The Semantic Component As far as the semantic component is concerned, it is clear that most operationalizations are proxies for the probability that an individual will encounter a word in a familiar context and thus be able to infer its meaning (Bormuth, 1966). This is the basis of exposure theory, which explains the way receptive or hearing vocabulary develops (Miller & Gildea, 1987; Stenner, Smith, & Burdick, 1983). Klare (1963) hypothesized that the semantic component varied along a familiarity-to-rarity continuum. This concept was further developed by Carroll, Davies, and Richman (1971), whose word-frequency study examined the reoccurrence of words in a five-million-word corpus of running text. Knowing the frequency of words as they are used in written and oral communication provided the best means of inferring the likelihood that a word would be encountered by a reader and thus become a part of that individual’s receptive vocabulary. Variables such as the average number of letters or syllables per word have been observed to be proxies for word frequency. There is a strong negative correlation between the length of words and the frequency of word usage. Polysyllabic words are used less frequently than monosyllabic words, making word length a good proxy for the likelihood that an individual will be exposed to a word. In a study examining receptive vocabulary, Stenner, Smith, and Burdick (1983) analyzed more than 50 semantic variables in order to identify those elements that contributed to the difficulty of the 350 vocabulary items on Forms L and M of the Peabody Picture Vocabulary Test—Revised (Dunn & Dunn, 1981). Variables included part of speech, number of letters, number of syllables, the modal grade at which the word appeared in school materials, content classification of the word, the frequency of the word from two different word counts, and various algebraic transformations of these measures. The first word frequency measure used was the raw count of how often a given word appeared in a corpus of 5,088,721 words sampled from a broad range of school materials (Carroll, Davies, & Richman, 1971). For example, the word “accident” appears
MetaMetrics, Inc.— R-CBM and MAZE - Lexile Linking Report – September 2011 Page 4
176 times in the 5,088,721-word corpus. The second word frequency measure used was the frequency of the “word family.” A word family included: (1) the stimulus word; (2) all plurals (adding “-s” or “-es” or changing “-y” to “-ies”); (3) adverbial forms; (4) comparatives and superlatives; (5) verb forms (“-s,” “-d,” “-ed,” and “-ing”); (6) past participles; and (7) adjective forms. For example, the word family for “accident” would include “accidental,” “accidentally,” “accidentals,” and “accidents,” and they would all have the same word frequency of 334. The frequency of a word family was based on the sum of the individual word frequencies from each of the types listed. Correlations were computed between algebraic transformations of these means (mean frequency of the words in the test item and mean frequency of the word families in the test item) and the rank order of the test items. Since the items were ordered according to increasing difficulty, the rank order was used as the observed item difficulty. The log of the mean word frequency provided the strongest correlation with item rank order
(r = –0.779) for the items on the combined form. The Lexile Framework currently employs a 330-million-word corpus when examining the semantic component of text. This corpus was assembled from the more than 15,000 texts that were measured by MetaMetrics for publishers from 1998 through 2002. When text is analyzed by MetaMetrics, all electronic files are initially edited according to established guidelines used with the Lexile Analyzer software. These guidelines include the removal of all incomplete sentences, chapter titles, and paragraph headings; running of a spell check; and re-punctuating where necessary to correspond to how the book would be read by a child (for example, at the end of a page). The text is then submitted to the Lexile Analyzer that examines the lengths of the sentences and the frequencies of the words and reports a Lexile measure for the book. When enough additional texts have been analyzed to make an adjustment to the corpus necessary and desirable, a linking study will be conducted to adjust the calibration equation such that the Lexile measure of a text based on the current corpus will be equivalent to the Lexile measure based on the new corpus. The Syntactic Component Klare (1963) provides a possible interpretation for how sentence length works in predicting passage complexity. He speculated that the syntactic component varied with the load placed on short-term memory. Crain and Shankweiler (1988), Shankweiler and Crain (1986), and Liberman, Mann, Shankweiler, and Westelman (1982) have also supported this explanation. The work of these individuals has provided evidence that sentence length is a good proxy for the demand that structural complexity places upon verbal short-term memory.
MetaMetrics, Inc.— R-CBM and MAZE - Lexile Linking Report – September 2011 Page 5
While sentence length has been shown to be a powerful proxy for the syntactic complexity of a passage, an important caveat is that sentence length is not the underlying causal influence (Chall, 1988). Researchers sometimes incorrectly assume that manipulation of sentence length will have a predictable effect on passage complexity. Davidson and Kantor (1982), for example, illustrated rather clearly that sentence length can be reduced and complexity increased and vice versa. Based on previous research, it was decided to use sentence length as a proxy for the syntactic component of reading complexity in the Lexile Framework. Calibration of Text Complexity The research study on semantic units (Stenner, Smith, & Burdick, 1983) was extended to examine the relationship of word frequency and sentence length to reading comprehension. In 1987(a), Stenner, Smith, Horabin, and Smith performed exploratory regression analyses to test the explanatory power of these variables. This analysis involved calculating the mean word frequency and the log of the mean sentence length for each of the 66 reading comprehension passages on the Peabody Individual Achievement Test (Dunn & Markwardt, 1970). The observed difficulty of each passage was the mean difficulty of the items associated with the passage (provided by the publisher) converted to the logit scale. A regression analysis based on the word-frequency and sentence-length measures produced a regression equation that explained most of the variance found in the set of reading comprehension tasks. The resulting correlation between the observed logit difficulties and the theoretical calibrations was 0.97 after correction for range restriction and measurement error. The regression equation was further refined based on its use in predicting the observed difficulty of the reading comprehension passages on 8 other standardized tests. The resulting correlation between the observed logit difficulties and the theoretical calibrations across the 9 tests was 0.93 after correction for range restriction and measurement error. Once a regression equation is established linking the syntactic and semantic features of text to the complexity of text, the equation can be used to calibrate test items and text. The Lexile Scale In developing the Lexile Scale, the Rasch model (Wright & Stone, 1979) was used to estimate the difficulties of the items and the abilities of the persons on the logit scale. The calibrations of the items from the Rasch model are objective in the sense that the relative difficulties of the items will remain the same across different samples of persons (specific objectivity). When two items are administered to the same group it can be
MetaMetrics, Inc.— R-CBM and MAZE - Lexile Linking Report – September 2011 Page 6
determined which item is harder and which one is easier. This ordering should hold when the same two items are administered to a second group. If two different items are administered to the second group, there is no way to know which set of items is harder and which set is easier. The problem is that the location of the scale is not known. General objectivity requires that scores obtained from different test administrations be tied to a common zero—absolute location must be sample independent (Stenner, 1990). To achieve general objectivity, the theoretical logit difficulties must be transformed to a scale where the ambiguity regarding the location of zero is resolved. The first step in developing a scale with a fixed zero was to identify two anchor points for the scale. The following criteria were used to select the two anchor points: they should be intuitive, easily reproduced, and widely recognized. For example, with most thermometers the anchor points are the freezing and boiling points of water. For the Lexile Scale, the anchor points are text from seven basal primers for the low end and text from The Electronic Encyclopedia (Grolier, Inc., 1986) for the high end. These points correspond to the middle of first grade text and the midpoint of workplace text. The next step was to determine the unit size for the scale. For the Celsius thermometer,
the unit size (a degree) is 1/100th of the difference between freezing (0 degrees) and boiling (100 degrees) water. For the Lexile Scale the unit size (a Lexile) was defined as
1/1000th of the difference between the mean complexity of the primer material and the mean complexity of the encyclopedia samples. Therefore, a Lexile by definition equals
1/1000th of the difference between the complexity of the primers and the complexity of the encyclopedia. The third step was to assign a value to the lower anchor point. The low-end anchor on the Lexile Scale was assigned a value of 200. Finally, a linear equation of the form [(Logit + constant) CF] + 200 = Lexile text measure Equation (1) was developed to convert logit difficulties to Lexile calibrations. The values of the conversion factor (CF) and the constant were determined by substituting in the low-end anchor point and then solving the system of equations. The Lexile Scale ranges from below zero to above 2000L. There is a not an explicit bottom or top to the scale, but rather two anchor points on the scale (described above) that describe different levels of reading comprehension. The Lexile Map, a graphic representation of the Lexile Scale from 200L to 1700L, provides a context for understanding reading comprehension.
MetaMetrics, Inc.— R-CBM and MAZE - Lexile Linking Report – September 2011 Page 7
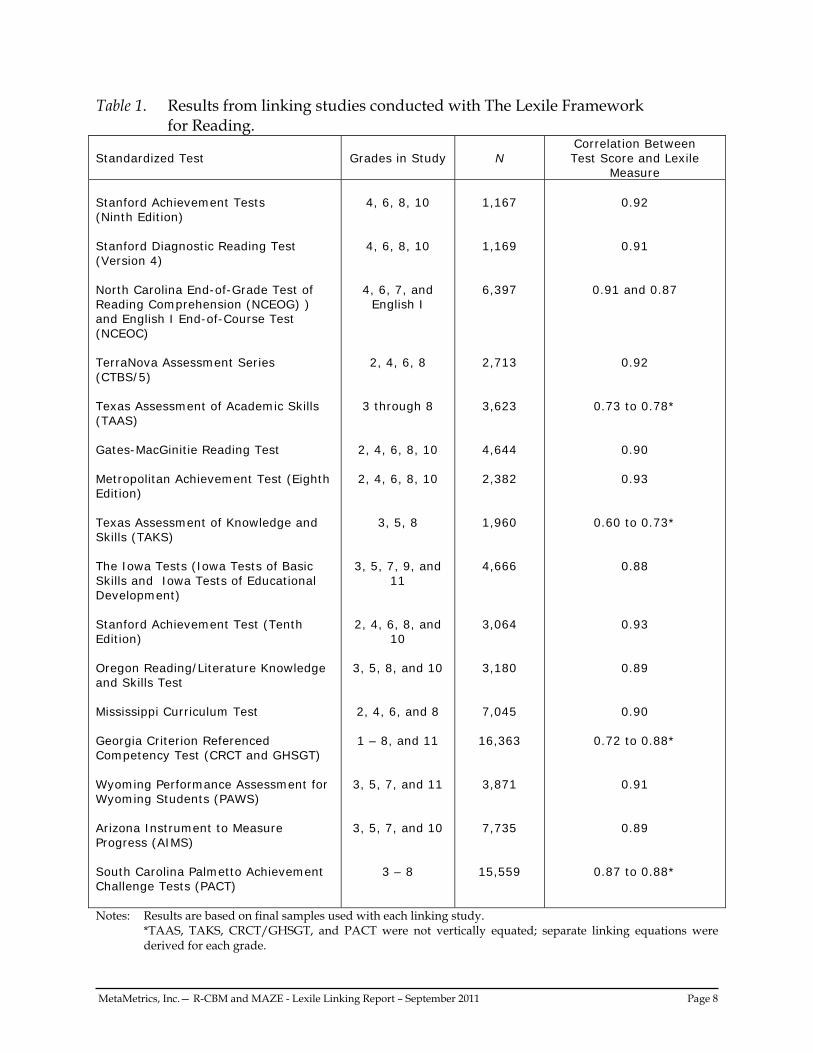
Validity of The Lexile Framework for Reading Validity refers to the “degree to which evidence and theory support the interpretations of test scores entailed by proposed uses of tests” (American Educational Research Association, American Psychological Association, & National Council on Measurement in Education, 1999). In other words, does the test measure what it is supposed to measure? For the Lexile Framework, which measures a skill, the most important aspect of validity that should be examined is construct validity. The validity of the Lexile Framework can be evaluated by examining how well Lexile measures relate to other measures of reading comprehension and text complexity. Lexile Framework and other Measures of Reading Comprehension. Table 1 presents the results from studies where students were administered a Lexile assessment and another assessment of reading comprehension. There is a strong relationship between reading comprehension ability as measured by the Lexile Framework and reading comprehension ability as measured by other assessments.
MetaMetrics, Inc.— R-CBM and MAZE - Lexile Linking Report – September 2011 Page 8
Table 1. Results from linking studies conducted with The Lexile Framework for Reading.
Standardized Test Grades in Study N Correlation Between Test Score and Lexile
Measure Stanford Achievement Tests (Ninth Edition) Stanford Diagnostic Reading Test (Version 4) North Carolina End-of-Grade Test of Reading Comprehension (NCEOG) ) and English I End-of-Course Test (NCEOC) TerraNova Assessment Series (CTBS/5) Texas Assessment of Academic Skills (TAAS) Gates-MacGinitie Reading Test Metropolitan Achievement Test (Eighth Edition) Texas Assessment of Knowledge and Skills (TAKS) The Iowa Tests (Iowa Tests of Basic Skills and Iowa Tests of Educational Development) Stanford Achievement Test (Tenth Edition) Oregon Reading/Literature Knowledge and Skills Test Mississippi Curriculum Test Georgia Criterion Referenced Competency Test (CRCT and GHSGT) Wyoming Performance Assessment for Wyoming Students (PAWS) Arizona Instrument to Measure Progress (AIMS) South Carolina Palmetto Achievement Challenge Tests (PACT)
4, 6, 8, 10
4, 6, 8, 10
4, 6, 7, and English I
2, 4, 6, 8
3 through 8
2, 4, 6, 8, 10
2, 4, 6, 8, 10
3, 5, 8
3, 5, 7, 9, and
11
2, 4, 6, 8, and
10
3, 5, 8, and 10
2, 4, 6, and 8
1 – 8, and 11
3, 5, 7, and 11
3, 5, 7, and 10
3 – 8
1,167
1,169
6,397
2,713
3,623
4,644
2,382
1,960
4,666
3,064
3,180
7,045
16,363
3,871
7,735
15,559
0.92
0.91
0.91 and 0.87
0.92
0.73 to 0.78*
0.90
0.93
0.60 to 0.73*
0.88
0.93
0.89
0.90
0.72 to 0.88*
0.91
0.89
0.87 to 0.88*
Notes: Results are based on final samples used with each linking study. *TAAS, TAKS, CRCT/GHSGT, and PACT were not vertically equated; separate linking equations were derived for each grade.
MetaMetrics, Inc.— R-CBM and MAZE - Lexile Linking Report – September 2011 Page 9
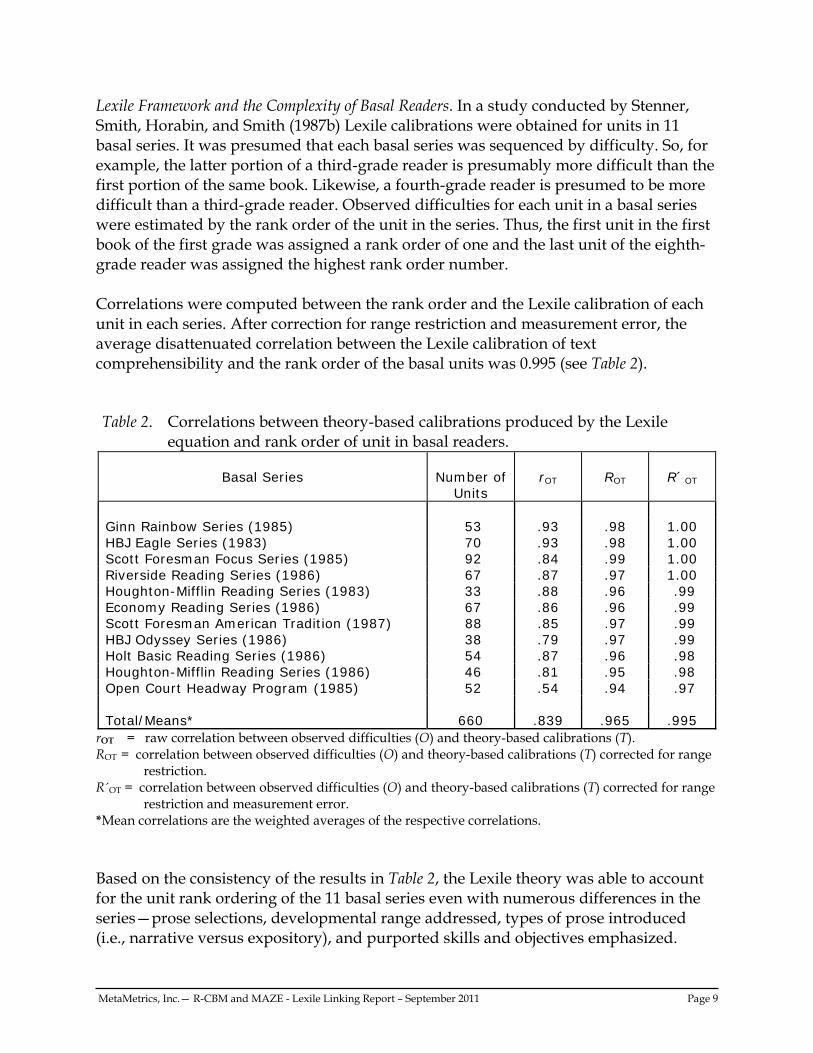
Lexile Framework and the Complexity of Basal Readers. In a study conducted by Stenner, Smith, Horabin, and Smith (1987b) Lexile calibrations were obtained for units in 11 basal series. It was presumed that each basal series was sequenced by difficulty. So, for example, the latter portion of a third-grade reader is presumably more difficult than the first portion of the same book. Likewise, a fourth-grade reader is presumed to be more difficult than a third-grade reader. Observed difficulties for each unit in a basal series were estimated by the rank order of the unit in the series. Thus, the first unit in the first book of the first grade was assigned a rank order of one and the last unit of the eighth-grade reader was assigned the highest rank order number. Correlations were computed between the rank order and the Lexile calibration of each unit in each series. After correction for range restriction and measurement error, the average disattenuated correlation between the Lexile calibration of text comprehensibility and the rank order of the basal units was 0.995 (see Table 2). Table 2. Correlations between theory-based calibrations produced by the Lexile
equation and rank order of unit in basal readers.
Basal Series
Number of Units
rOT
ROT
R´OT
Ginn Rainbow Series (1985) 53 .93 .98 1.00 HBJ Eagle Series (1983) 70 .93 .98 1.00 Scott Foresman Focus Series (1985) 92 .84 .99 1.00 Riverside Reading Series (1986) 67 .87 .97 1.00 Houghton-Mifflin Reading Series (1983) 33 .88 .96 .99 Economy Reading Series (1986) 67 .86 .96 .99 Scott Foresman American Tradition (1987) 88 .85 .97 .99 HBJ Odyssey Series (1986) 38 .79 .97 .99 Holt Basic Reading Series (1986) 54 .87 .96 .98 Houghton-Mifflin Reading Series (1986) 46 .81 .95 .98 Open Court Headway Program (1985) 52 .54 .94 .97 Total/Means* 660 .839 .965 .995
rOT = raw correlation between observed difficulties (O) and theory-based calibrations (T). ROT = correlation between observed difficulties (O) and theory-based calibrations (T) corrected for range
restriction. R´OT = correlation between observed difficulties (O) and theory-based calibrations (T) corrected for range
restriction and measurement error. *Mean correlations are the weighted averages of the respective correlations. Based on the consistency of the results in Table 2, the Lexile theory was able to account for the unit rank ordering of the 11 basal series even with numerous differences in the series—prose selections, developmental range addressed, types of prose introduced (i.e., narrative versus expository), and purported skills and objectives emphasized.
MetaMetrics, Inc.— R-CBM and MAZE - Lexile Linking Report – September 2011 Page 10
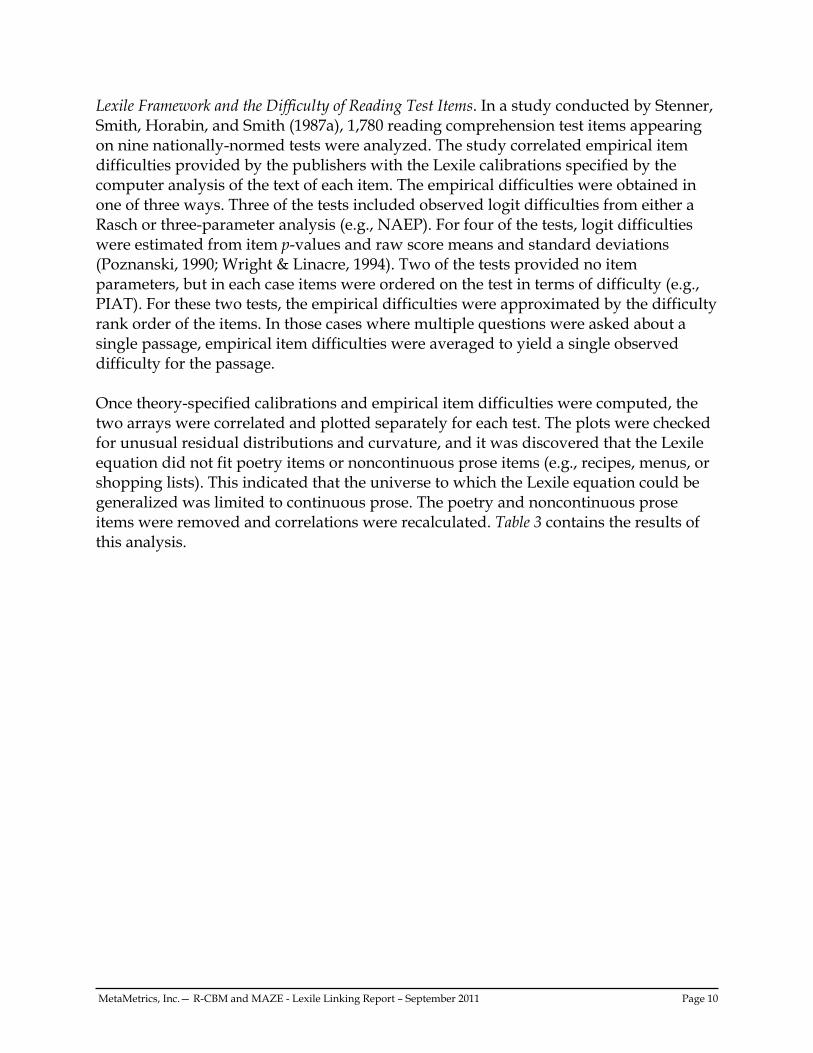
Lexile Framework and the Difficulty of Reading Test Items. In a study conducted by Stenner, Smith, Horabin, and Smith (1987a), 1,780 reading comprehension test items appearing on nine nationally-normed tests were analyzed. The study correlated empirical item difficulties provided by the publishers with the Lexile calibrations specified by the computer analysis of the text of each item. The empirical difficulties were obtained in one of three ways. Three of the tests included observed logit difficulties from either a Rasch or three-parameter analysis (e.g., NAEP). For four of the tests, logit difficulties were estimated from item p-values and raw score means and standard deviations (Poznanski, 1990; Wright & Linacre, 1994). Two of the tests provided no item parameters, but in each case items were ordered on the test in terms of difficulty (e.g., PIAT). For these two tests, the empirical difficulties were approximated by the difficulty rank order of the items. In those cases where multiple questions were asked about a single passage, empirical item difficulties were averaged to yield a single observed difficulty for the passage. Once theory-specified calibrations and empirical item difficulties were computed, the two arrays were correlated and plotted separately for each test. The plots were checked for unusual residual distributions and curvature, and it was discovered that the Lexile equation did not fit poetry items or noncontinuous prose items (e.g., recipes, menus, or shopping lists). This indicated that the universe to which the Lexile equation could be generalized was limited to continuous prose. The poetry and noncontinuous prose items were removed and correlations were recalculated. Table 3 contains the results of this analysis.
MetaMetrics, Inc.— R-CBM and MAZE - Lexile Linking Report – September 2011 Page 11
Table 3. Correlations between theory-based calibrations produced by the Lexile equation and empirical item difficulties.
rOT = raw correlation between observed difficulties (O) and theory-based calibrations (T). ROT = correlation between observed difficulties (O) and theory-based calibrations (T) corrected for range
restriction. R´OT =correlation between observed difficulties (O) and theory-based calibrations (T) corrected for range
restriction and measurement error. *Means are computed on Fisher Z transformed correlations. The last three columns in Table 3 show the raw correlation between observed (O) item difficulties and theoretical (T) item calibrations, with the correlations corrected for restriction in range and measurement error. The Fisher Z mean of the raw correlations (r
OT) is 0.84. When corrections are made for range restriction and measurement error, the
Fisher Z mean disattenuated correlation between theory-based calibration and empirical difficulty in an unrestricted group of reading comprehension items (R´
OT) is
0.93. These results show that most attempts to measure reading comprehension, no matter what the item form, type of skill objectives assessed, or response requirement used, measure a common comprehension factor specified by the Lexile theory. Text Measure Error Associated with the Lexile Framework To determine a Lexile measure for a text, the standard procedure is to process the entire text. All pages in the work are concatenated into an electronic file that is processed by a software package called the Lexile Analyzer (developed by MetaMetrics, Inc.). The analyzer “slices” the text file into as many 125-word passages as possible, analyzes the set of slices, and then calibrates each slice in terms of the logit metric. That set of calibrations is then processed to determine the Lexile measure corresponding to a 75% comprehension rate. The analyzer uses the slice calibrations as test item calibrations and
MetaMetrics, Inc.— R-CBM and MAZE - Lexile Linking Report – September 2011 Page 12
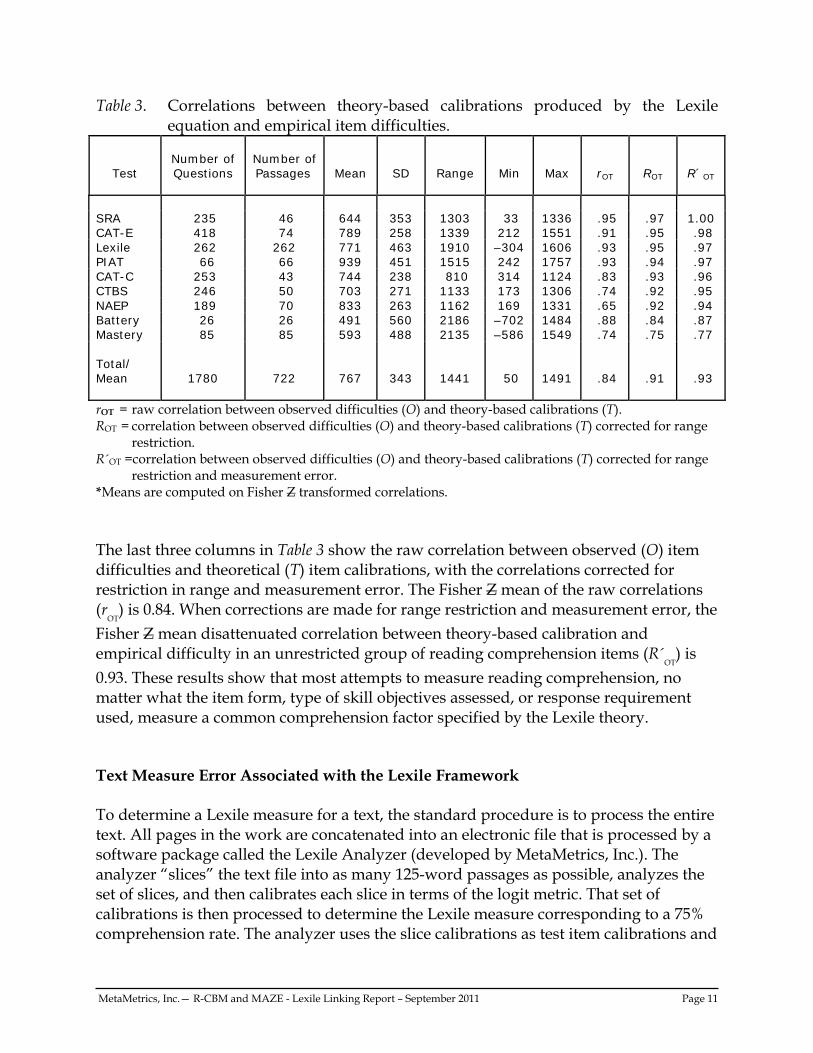
then solves for the measure corresponding to a raw score of 75% (e.g., 30 out of 40 correct, as if the slices were test items). The Lexile Analyzer automates this process, but what “certainty” can be attached to each text measure? Using the bootstrap procedure to examine error due to the text samples, the above analysis could be repeated (Efron, 1981; Sitter, 1992). The result would be an identical text measure to the first because there is no sampling error when a complete text is calibrated. There is, however, another source of error that increases the uncertainty about where a text is located on the Lexile Map. The Lexile Theory is imperfect in its calibration of the complexity of individual text slices. To examine this source of error, 200 items that had been previously calibrated and shown to fit the model were administered to 3,026 students in Grades 2 through 12 in a large urban school district. For each item the observed item difficulty calibrated from the Rasch model was compared with the theoretical item difficulty calibrated from the regression equation used to calibrate texts. A scatter plot of the data is presented in Figure 1. Figure 1. Scatter plot between observed item difficulty and theoretical item difficulty.
The correlation between the observed and the theoretical calibrations for the 200 items was 0.92 and the root mean square error was 178L. Therefore, for an individual slice of text the measurement error is 178L. The standard error of measurement associated with a text is a function of the error associated with one slice of text (178L) and the number of slices that are calibrated from a text. Very short books have larger uncertainties than longer books. A book with only
-500
0
500
1000
1500
2000
-500 0 500 1000 1500 2000
Obs
erve
d Ite
m D
iffic
ulty
Theoretical Item Difficulty
MetaMetrics, Inc.— R-CBM and MAZE - Lexile Linking Report – September 2011 Page 13
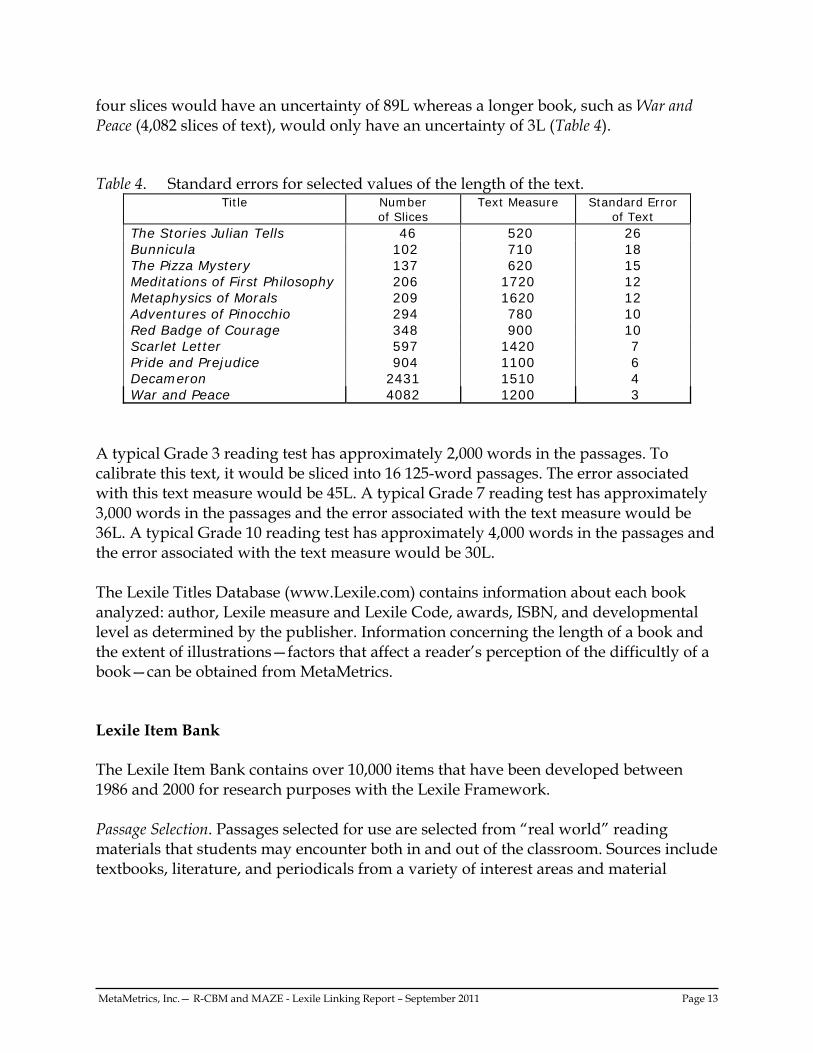
four slices would have an uncertainty of 89L whereas a longer book, such as War and Peace (4,082 slices of text), would only have an uncertainty of 3L (Table 4). Table 4. Standard errors for selected values of the length of the text.
Title Number of Slices
Text Measure Standard Error of Text
The Stories Julian Tells 46 520 26 Bunnicula 102 710 18 The Pizza Mystery 137 620 15 Meditations of First Philosophy 206 1720 12 Metaphysics of Morals 209 1620 12 Adventures of Pinocchio 294 780 10 Red Badge of Courage 348 900 10 Scarlet Letter 597 1420 7 Pride and Prejudice 904 1100 6 Decameron 2431 1510 4 War and Peace 4082 1200 3
A typical Grade 3 reading test has approximately 2,000 words in the passages. To calibrate this text, it would be sliced into 16 125-word passages. The error associated with this text measure would be 45L. A typical Grade 7 reading test has approximately 3,000 words in the passages and the error associated with the text measure would be 36L. A typical Grade 10 reading test has approximately 4,000 words in the passages and the error associated with the text measure would be 30L. The Lexile Titles Database (www.Lexile.com) contains information about each book analyzed: author, Lexile measure and Lexile Code, awards, ISBN, and developmental level as determined by the publisher. Information concerning the length of a book and the extent of illustrations—factors that affect a reader’s perception of the difficultly of a book—can be obtained from MetaMetrics. Lexile Item Bank The Lexile Item Bank contains over 10,000 items that have been developed between 1986 and 2000 for research purposes with the Lexile Framework. Passage Selection. Passages selected for use are selected from “real world” reading materials that students may encounter both in and out of the classroom. Sources include textbooks, literature, and periodicals from a variety of interest areas and material
MetaMetrics, Inc.— R-CBM and MAZE - Lexile Linking Report – September 2011 Page 14
written by authors of different backgrounds. The following criteria are used to select passages: • the passage must develop one main idea or contain one complete piece of
information; • understanding of the passage is independent of the information that
comes before or after the passage in the source text; and • understanding of the passage is independent of prior knowledge not
contained in the passage. With the aid of a computer program, item writers examine blocks of text (minimum of three sentences) that are calibrated to be within 100L of the source text. From these blocks of text item writers are asked to select four to five that could be developed as items. If it is necessary to shorten or lengthen the passage in order to meet the criteria for passage selection, the item writer can immediately recalibrate the text to ensure that it is still targeted within 100L of the complete text (source targeting). Item Format. The native Lexile item format is embedded completion. The embedded completion format is similar to the fill-in-the-blank format. When properly written, this format directly assesses the reader’s ability to draw inferences and establish logical connections between the ideas in the passage (Haladyna, 1994). The reader is presented with a passage of approximately 30 to 150 words in length. The passages are shorter for beginning readers and longer for more advanced readers. The passage is then response illustrated (a statement is added at the end of the passage with a missing word or phrase followed by four options). From the four presented options, the reader is asked to select the “best” option that completes the statement. With this format, all options are semantically and syntactically appropriate completions of the sentence, but one option is unambiguously the “best” option when considered in the context of the passage. The statement portion of the embedded completion item can assess a variety of skills related to reading comprehension: paraphrase information in the passage, draw a logical conclusion based on the information in the passage, make an inference, identify a supporting detail, or make a generalization based on the information in the passage. The statement is written to ensure that by reading and comprehending the passage the reader is able to select the correct option. When the embedded completion statement is read by itself, each of the four options is plausible. Item Writer Training. Item writers are classroom teachers and other educators who have had experience with the everyday reading ability of students at various levels. The use of individuals with these types of experiences helps to ensure that the items are valid measures of reading comprehension. Item writers are provided with training materials concerning the embedded completion item format and guidelines for selecting passages, developing statements, and selecting options. The item writing materials also
MetaMetrics, Inc.— R-CBM and MAZE - Lexile Linking Report – September 2011 Page 15
contain incorrect items that illustrate the criteria used to evaluate items and corrections based on those criteria. The final phase of item writer training is a short practice session with three items. Item writers are provided vocabulary lists to use during statement and option development. The vocabulary lists were compiled from spelling books one grade level below the level the item would typically be used with. The rationale was that these words should be part of a reader’s “working” vocabulary since they had been learned the previous year. Item writers are also given extensive training related to “sensitivity” issues. Part of the item writing materials address these issues and identify areas to avoid when selecting passages and developing items. The following areas are covered: violence and crime, depressing situations/death, offensive language, drugs/alcohol/tobacco, sex/attraction, race/ethnicity, class, gender, religion, supernatural/magic, parent/family, politics, animals/environment, and brand names/junk food. These materials were developed based on material published by McGraw-Hill (Guidelines for Bias-Free Publishing). This publication discusses the equal treatment of the sexes, fair representation of minority groups, and the fair representation of disabled individuals. Item Review. All items are subjected to a two-stage review process. First, items are reviewed and edited by an editor according to the 19 criteria identified in the item writing materials and for sensitivity issues. Approximately 25% of the items developed are deleted for various reasons. Where possible items were edited and maintained in the item bank. Items are then reviewed and edited by a group of specialists that represent various perspectives—test developers, editors, and curriculum specialists. These individuals examine each item for sensitivity issues and for the quality of the response options. During the second stage of the item review process, items are either “approved as presented,” “approved with edits,” or “deleted.” Approximately 10% of the items written are “approved with edits” or “deleted” at this stage. When necessary, item writers receive additional on-going feedback and training. Item Analyses. As part of the linking studies and research studies conducted by MetaMetrics, items in the Lexile Item Bank are evaluated in terms of difficulty (relationship between logit [observed Lexile measure] and theoretical Lexile measure), internal consistency (point-biserial correlation), and bias (ethnicity and gender where possible). Where necessary, items are deleted from the item bank or revised and recalibrated. During the spring of 1999, 8 levels of a Lexile assessment were administered in a large urban school district to students in grades 1 through 12. The 8 test levels were
MetaMetrics, Inc.— R-CBM and MAZE - Lexile Linking Report – September 2011 Page 16
administered in grades 1, 2, 3, 4, 5, 6, 7-8, and 9-12 and ranged from 40 to 70 items depending on the grade level. A total of 427 items were administered across the 8 test levels. Each item was answered by at least 9,000 students (the number of students per level ranged from 9,286 in grade 2 to 19,056 in grades 9-12). The item responses were submitted to a Winsteps IRT analysis. The resulting item difficulties (in logits) were assigned Lexile measures by multiplying by 180 and anchoring each set of items to the mean theoretical difficulty of the items on the form.
MetaMetrics, Inc.— R-CBM and MAZE - Lexile Linking Report – September 2011 Page 17
AIMSweb - Lexile Framework Linking Process Description of the Assessments AIMSweb. AIMSweb® is an assessment, data organization, and reporting system that provides the framework and data necessary for response to intervention (RTI) and multitiered instruction. Designed specifically to benchmark and monitor progress, AIMSweb uses Curriculum-Based Measurement (CBM) practices: brief, reliable, and valid measures of basic reading skills, language arts, and mathematics (Howe & Shinn, 2002). These standardized tests are based on general outcome measurement principles so they can be efficiently and accurately used to evaluate student progress relative to a year-end target, regardless of curriculum or intervention. Two such standardized tests are Reading Curriculum-Based Measurement and Reading Maze.
Reading Curriculum-Based Measurement (R-CBM). Reading Curriculum-Based Measurement is based on listening to students read graded passages aloud for 1 minute and calculating the number of words read correctly per minute (Shinn & Shinn, 2002). This measure of oral reading fluency provides a highly reliable and valid measure of general reading achievement, including comprehension, for most students. Passages that represent the general curriculum were field tested to determine their grade-level appropriateness. Based on this research, selected passages were used for R-CBM.
Reading Maze (MAZE). Reading Maze is a multiple-choice cloze task that students complete while reading silently (Shinn & Shinn, 2002). The first sentence of a 150-400 word passage is left intact. Thereafter, every 7th word is replaced with three words inside parenthesis. One of the words is the exact one from the original passage. The two others are distractors. These distractors are not random. One of the distractors is a near distractor, a word of the same “type” (e.g., noun, verb, adverb), that does not make sense or preserve meaning. The other distractor is a far distractor, a word not of the same type but a word that is selected randomly from the story that does not make sense. Science-based research has shown that this provides a reliable and valid measure of reading comprehension. The Lexile Framework for Reading. The Lexile Framework is a tool that can help teachers, parents, and students locate challenging reading materials. Text complexity and reader ability are measured in the same unit—the Lexile. Text complexity is determined by examining such characteristics as word frequency and sentence length. Items and text are calibrated using the Rasch model. The typical range of the Lexile Scale is from 200 to 1700 Lexiles, although actual Lexile measures can range from below zero (BR) to above 2000 Lexiles (see the discussion on pages 5-6 for more information).
MetaMetrics, Inc.— R-CBM and MAZE - Lexile Linking Report – September 2011 Page 18
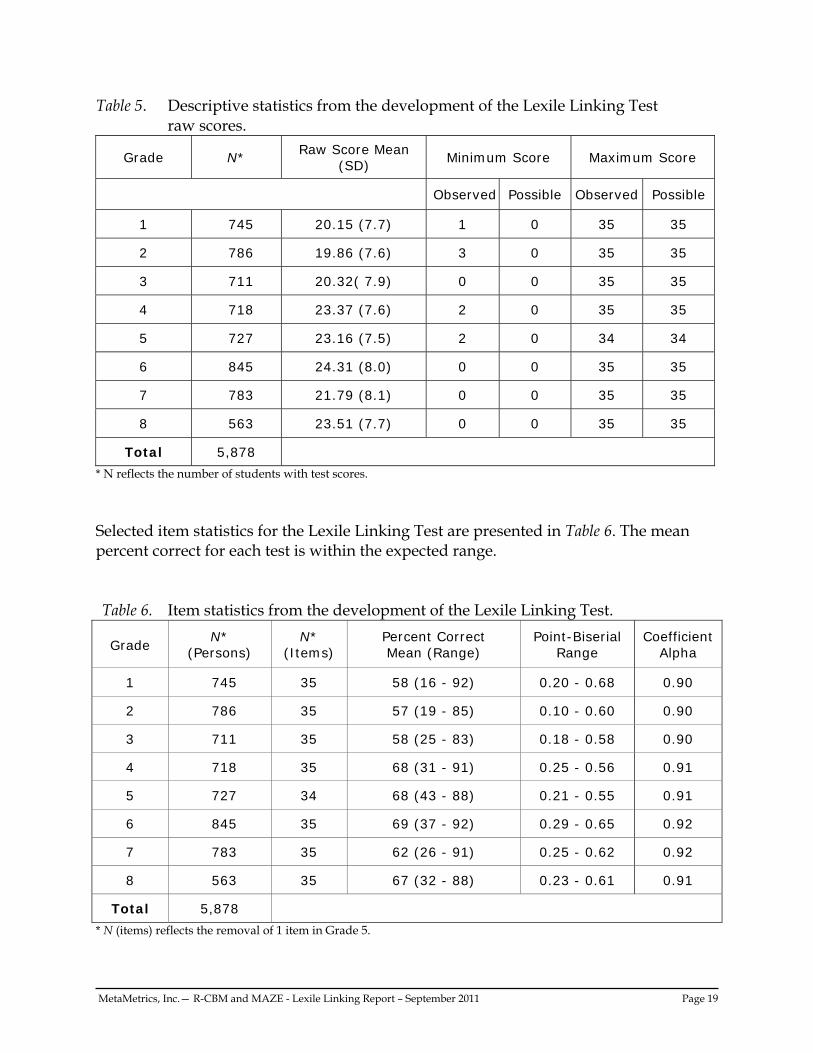
Using multiple-choice items, the Lexile Framework measures reading comprehension by focusing on skills readers use when studying written materials sampled from various content areas. Each test item consists of a passage that is response-illustrated (a statement is added at the end of the passage with a missing word or phrase followed by four options, or distractors). The skills measured by these items include referring to details in the passage, drawing conclusions, and making comparisons and generalizations. Lexile items do not require prior knowledge of ideas outside of the passage, vocabulary taken out of context, or formal logic. Linking tests for the AIMSweb in reading were developed for administration to students in Grades 1 through 8. Each test contained 35 four-choice multiple-choice items that had been previously field-tested and had known statistics. For grade 1, the first 10 items were single sentence items with one word missing. The students selected the answer that best completed the sentence from a list of four word choices. The remaining items contained a short passage with a question stem at the end. This latter item type also comprised grades 2 through 8 tests. The items for the Lexile Linking Test were chosen to optimize the match to the target test passage difficulty, with an adjustment made to bring the Lexile Linking Test difficulty mean and range of items in alignment with Lexile Linking Tests previously administered in grades 1 through 8. Based on an analysis of passage difficulties of the target tests, normative grade-level means for each grade, and the item difficulties for previously fielded Lexile Linking tests, the following mean targets were set: Grade 1, 230L, Grade 2, 525L, Grade 3, 667L; Grade 4, 780L; Grade 5, 890L; Grade 6, 970L; Grade 7, 1050L; Grade 8, 1090L. Evaluation of Lexile Linking Test. After administration, the Lexile Linking Test items were reviewed. Based on this examination, one Lexile Linking Test item in Grade 5 was removed from the linking analyses. This decision was based on the distractor analysis. The descriptive statistics for the Lexile Linking Test raw scores are presented in Table 5.
MetaMetrics, Inc.— R-CBM and MAZE - Lexile Linking Report – September 2011 Page 19
Table 5. Descriptive statistics from the development of the Lexile Linking Test raw scores.
Grade N* Raw Score Mean
(SD) Minimum Score Maximum Score
Observed Possible Observed Possible
1 745 20.15 (7.7) 1 0 35 35
2 786 19.86 (7.6) 3 0 35 35
3 711 20.32( 7.9) 0 0 35 35
4 718 23.37 (7.6) 2 0 35 35
5 727 23.16 (7.5) 2 0 34 34
6 845 24.31 (8.0) 0 0 35 35
7 783 21.79 (8.1) 0 0 35 35
8 563 23.51 (7.7) 0 0 35 35
Total 5,878
* N reflects the number of students with test scores.
Selected item statistics for the Lexile Linking Test are presented in Table 6. The mean percent correct for each test is within the expected range. Table 6. Item statistics from the development of the Lexile Linking Test.
Grade
N* (Persons)
N* (Items)
Percent Correct Mean (Range)
Point-Biserial Range
Coefficient Alpha
1 745 35 58 (16 - 92) 0.20 - 0.68 0.90
2 786 35 57 (19 - 85) 0.10 - 0.60 0.90
3 711 35 58 (25 - 83) 0.18 - 0.58 0.90
4 718 35 68 (31 - 91) 0.25 - 0.56 0.91
5 727 34 68 (43 - 88) 0.21 - 0.55 0.91
6 845 35 69 (37 - 92) 0.29 - 0.65 0.92
7 783 35 62 (26 - 91) 0.25 - 0.62 0.92
8 563 35 67 (32 - 88) 0.23 - 0.61 0.91
Total 5,878
* N (items) reflects the removal of 1 item in Grade 5.
MetaMetrics, Inc.— R-CBM and MAZE - Lexile Linking Report – September 2011 Page 20
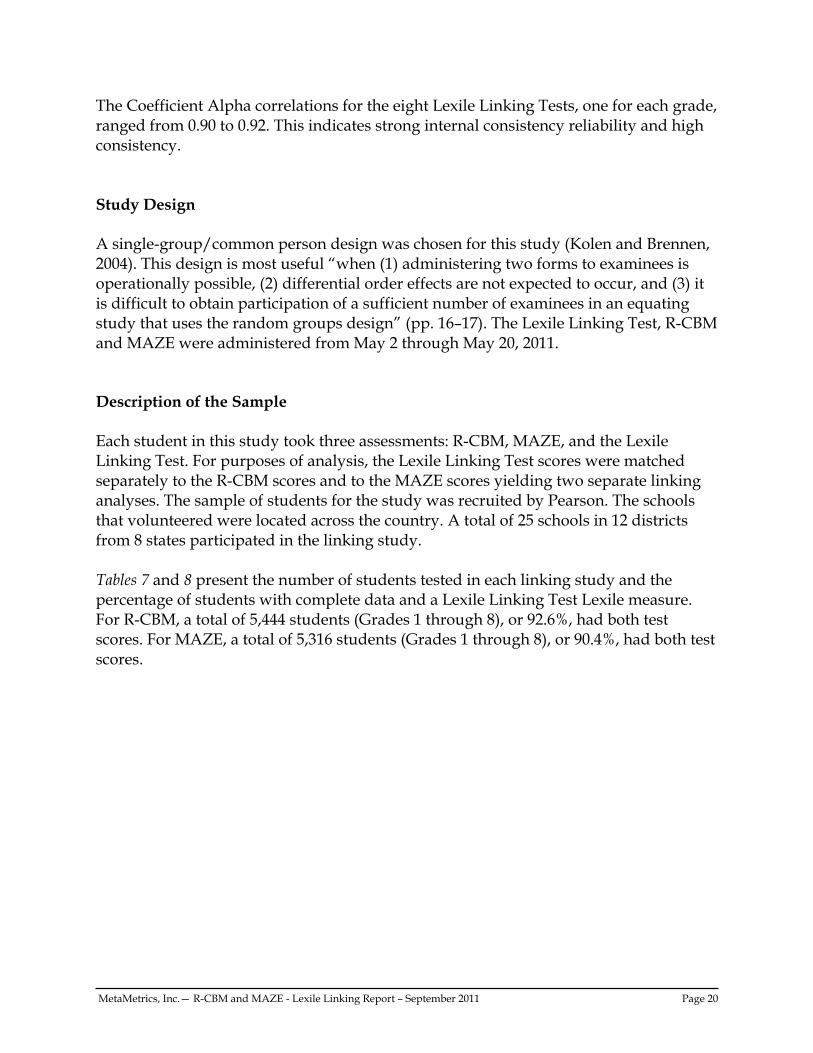
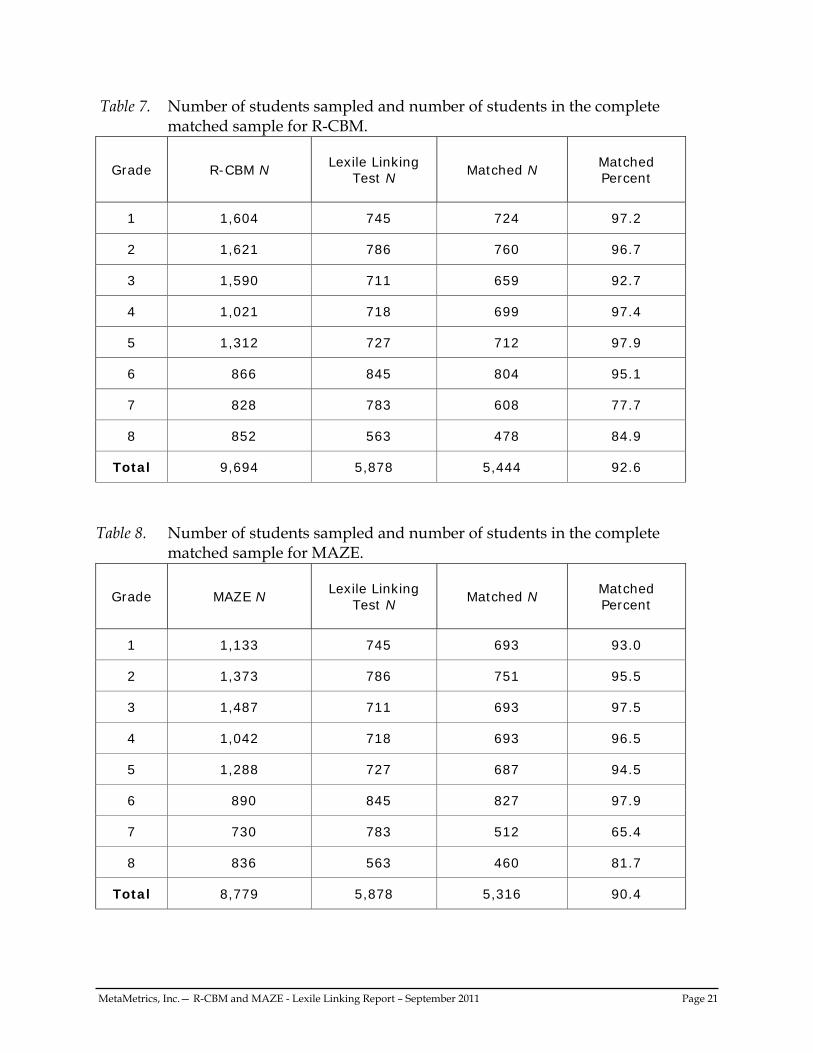
The Coefficient Alpha correlations for the eight Lexile Linking Tests, one for each grade, ranged from 0.90 to 0.92. This indicates strong internal consistency reliability and high consistency. Study Design A single-group/common person design was chosen for this study (Kolen and Brennen, 2004). This design is most useful “when (1) administering two forms to examinees is operationally possible, (2) differential order effects are not expected to occur, and (3) it is difficult to obtain participation of a sufficient number of examinees in an equating study that uses the random groups design” (pp. 16–17). The Lexile Linking Test, R-CBM and MAZE were administered from May 2 through May 20, 2011. Description of the Sample Each student in this study took three assessments: R-CBM, MAZE, and the Lexile Linking Test. For purposes of analysis, the Lexile Linking Test scores were matched separately to the R-CBM scores and to the MAZE scores yielding two separate linking analyses. The sample of students for the study was recruited by Pearson. The schools that volunteered were located across the country. A total of 25 schools in 12 districts from 8 states participated in the linking study. Tables 7 and 8 present the number of students tested in each linking study and the percentage of students with complete data and a Lexile Linking Test Lexile measure. For R-CBM, a total of 5,444 students (Grades 1 through 8), or 92.6%, had both test scores. For MAZE, a total of 5,316 students (Grades 1 through 8), or 90.4%, had both test scores.
MetaMetrics, Inc.— R-CBM and MAZE - Lexile Linking Report – September 2011 Page 21
Table 7. Number of students sampled and number of students in the complete matched sample for R-CBM.
Grade R-CBM N Lexile Linking
Test N Matched N
Matched Percent
1 1,604 745 724 97.2
2 1,621 786 760 96.7
3 1,590 711 659 92.7
4 1,021 718 699 97.4
5 1,312 727 712 97.9
6 866 845 804 95.1
7 828 783 608 77.7
8 852 563 478 84.9
Total 9,694 5,878 5,444 92.6
Table 8. Number of students sampled and number of students in the complete
matched sample for MAZE.
Grade MAZE N Lexile Linking
Test N Matched N
Matched Percent
1 1,133 745 693 93.0
2 1,373 786 751 95.5
3 1,487 711 693 97.5
4 1,042 718 693 96.5
5 1,288 727 687 94.5
6 890 845 827 97.9
7 730 783 512 65.4
8 836 563 460 81.7
Total 8,779 5,878 5,316 90.4
MetaMetrics, Inc.— R-CBM and MAZE - Lexile Linking Report – September 2011 Page 22
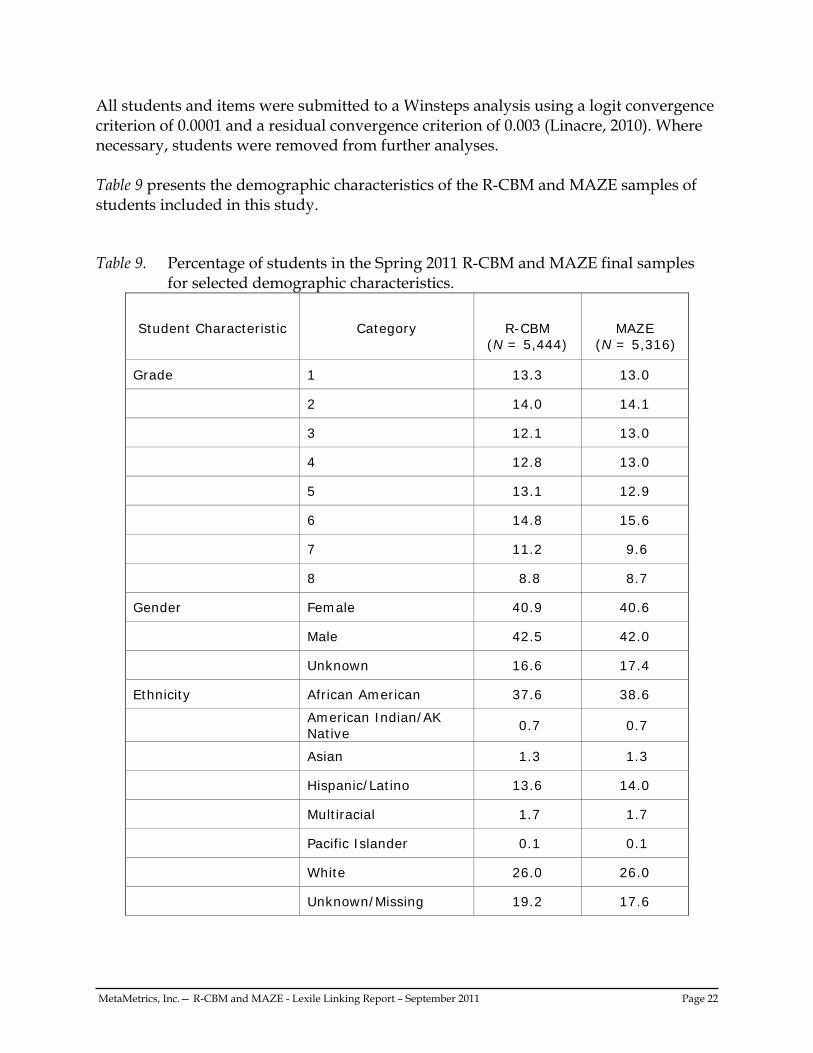
All students and items were submitted to a Winsteps analysis using a logit convergence criterion of 0.0001 and a residual convergence criterion of 0.003 (Linacre, 2010). Where necessary, students were removed from further analyses. Table 9 presents the demographic characteristics of the R-CBM and MAZE samples of students included in this study. Table 9. Percentage of students in the Spring 2011 R-CBM and MAZE final samples
for selected demographic characteristics.
Student Characteristic Category R-CBM (N = 5,444)
MAZE (N = 5,316)
Grade 1 13.3 13.0
2 14.0 14.1
3 12.1 13.0
4 12.8 13.0
5 13.1 12.9
6 14.8 15.6
7 11.2 9.6
8 8.8 8.7
Gender Female 40.9 40.6
Male 42.5 42.0
Unknown 16.6 17.4
Ethnicity African American 37.6 38.6
American Indian/AK Native
0.7 0.7
Asian 1.3 1.3
Hispanic/Latino 13.6 14.0
Multiracial 1.7 1.7
Pacific Islander 0.1 0.1
White 26.0 26.0
Unknown/Missing 19.2 17.6
MetaMetrics, Inc.— R-CBM and MAZE - Lexile Linking Report – September 2011 Page 23
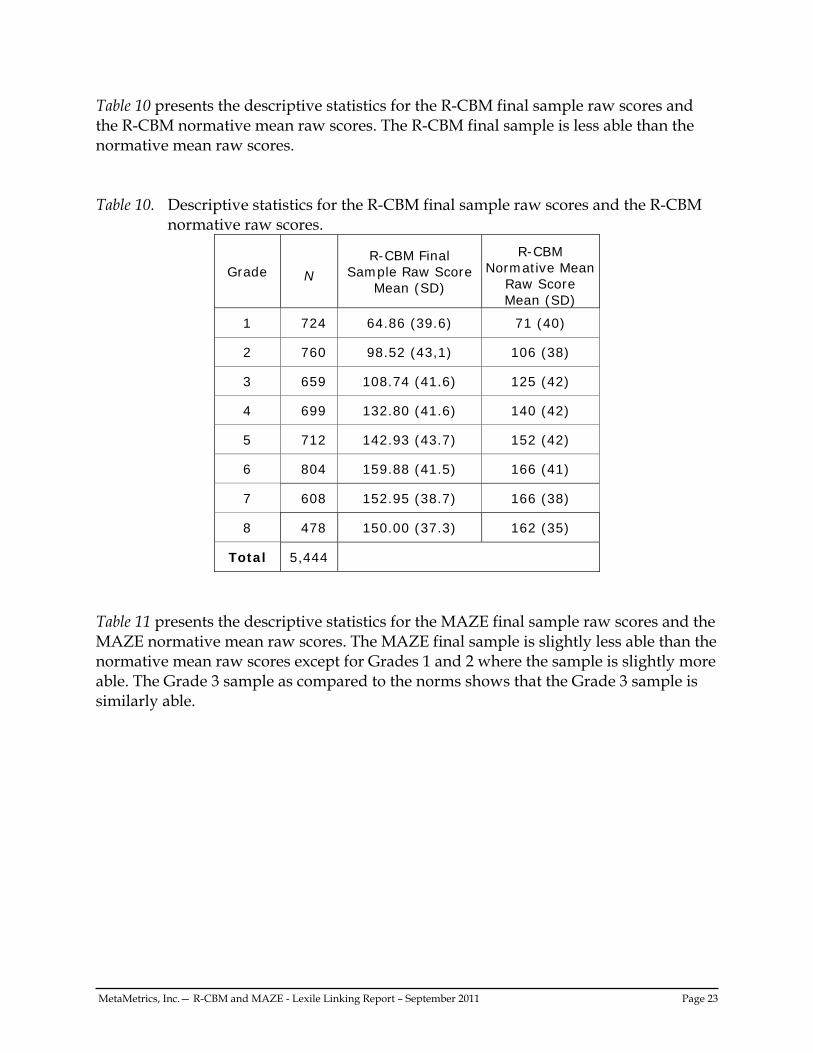
Table 10 presents the descriptive statistics for the R-CBM final sample raw scores and the R-CBM normative mean raw scores. The R-CBM final sample is less able than the normative mean raw scores. Table 10. Descriptive statistics for the R-CBM final sample raw scores and the R-CBM
normative raw scores.
Grade N
R-CBM Final Sample Raw Score
Mean (SD)
R-CBM Normative Mean
Raw Score Mean (SD)
1 724 64.86 (39.6) 71 (40)
2 760 98.52 (43,1) 106 (38)
3 659 108.74 (41.6) 125 (42)
4 699 132.80 (41.6) 140 (42)
5 712 142.93 (43.7) 152 (42)
6 804 159.88 (41.5) 166 (41)
7 608 152.95 (38.7) 166 (38)
8 478 150.00 (37.3) 162 (35)
Total 5,444
Table 11 presents the descriptive statistics for the MAZE final sample raw scores and the MAZE normative mean raw scores. The MAZE final sample is slightly less able than the normative mean raw scores except for Grades 1 and 2 where the sample is slightly more able. The Grade 3 sample as compared to the norms shows that the Grade 3 sample is similarly able.
MetaMetrics, Inc.— R-CBM and MAZE - Lexile Linking Report – September 2011 Page 24
Table 11. Descriptive statistics for the MAZE final sample raw scores and the MAZE normative raw scores.
Grade N
MAZE Final Sample Raw Score Mean (SD)
MAZE Normative Mean
Raw Score Mean (SD)
1 693 11.30 (8.3) 9 (6)
2 751 19.12 (10.4) 15 (7)
3 693 17.44 (9.2) 17 (8)
4 693 20.31 (8.9) 21 (9)
5 687 22.47 (8.2) 26 (9)
6 827 26.37 (10.1) 29 (10)
7 512 26.55 (9.9) 31 (10)
8 460 23.72 (8.6) 29 (10)
Total 5,316
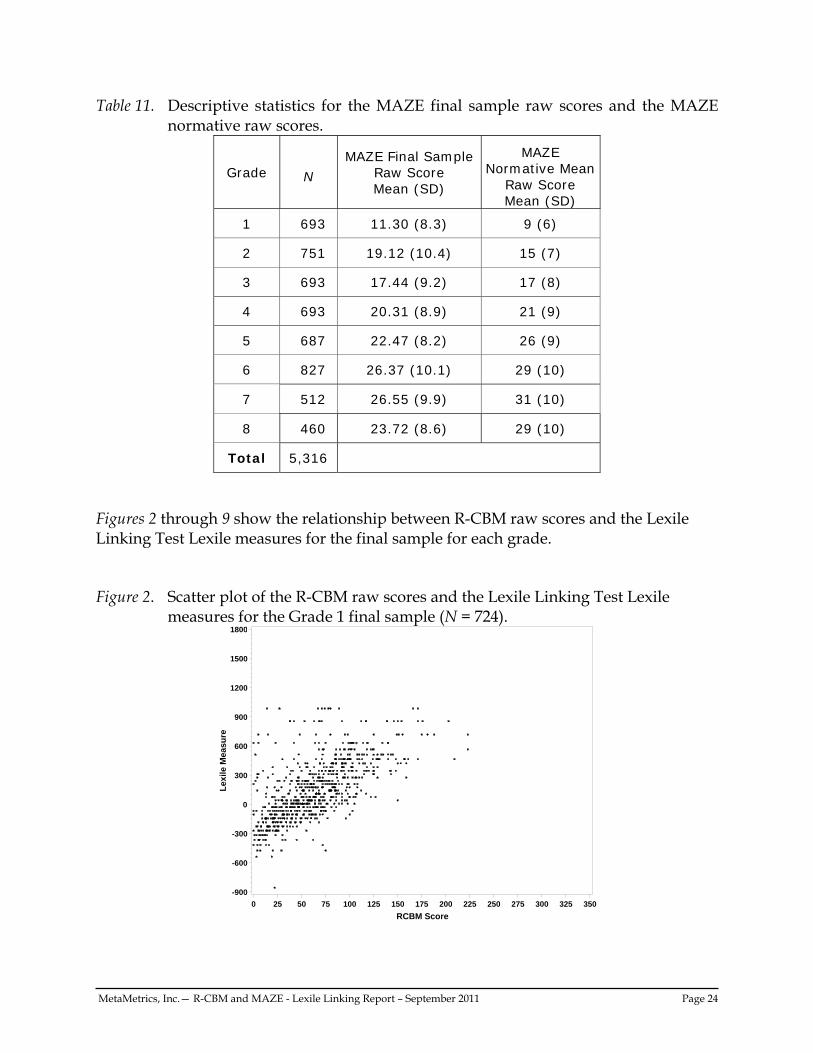
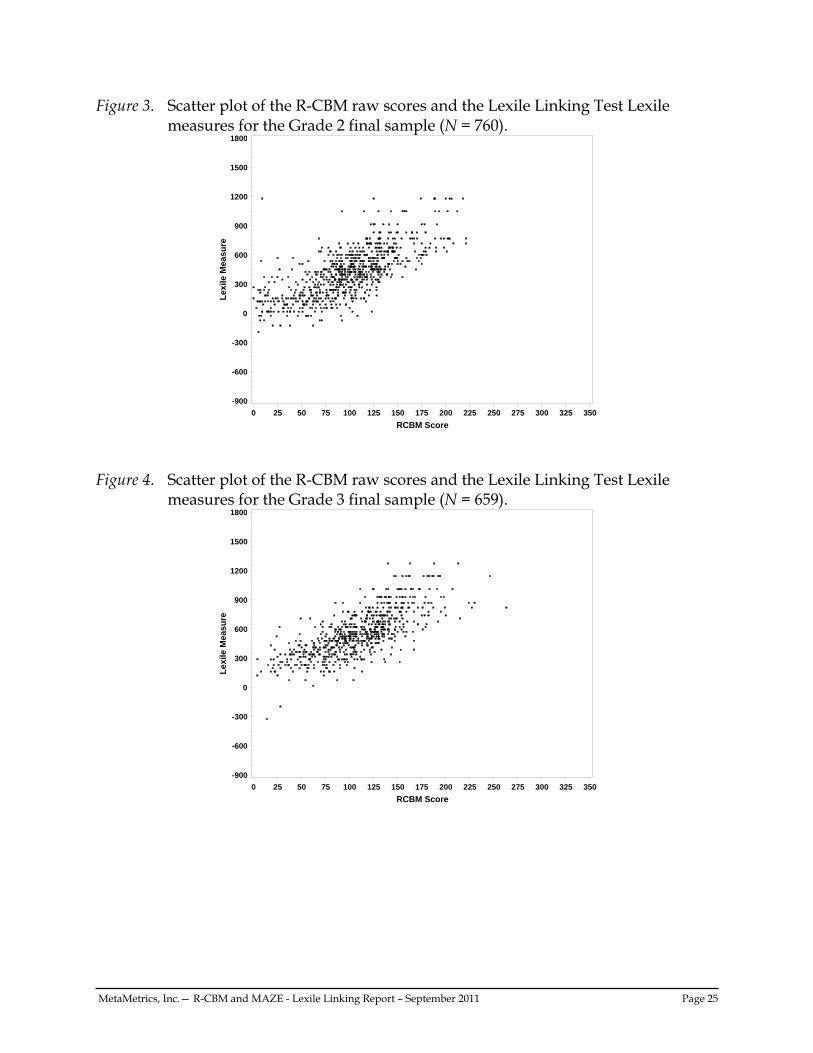
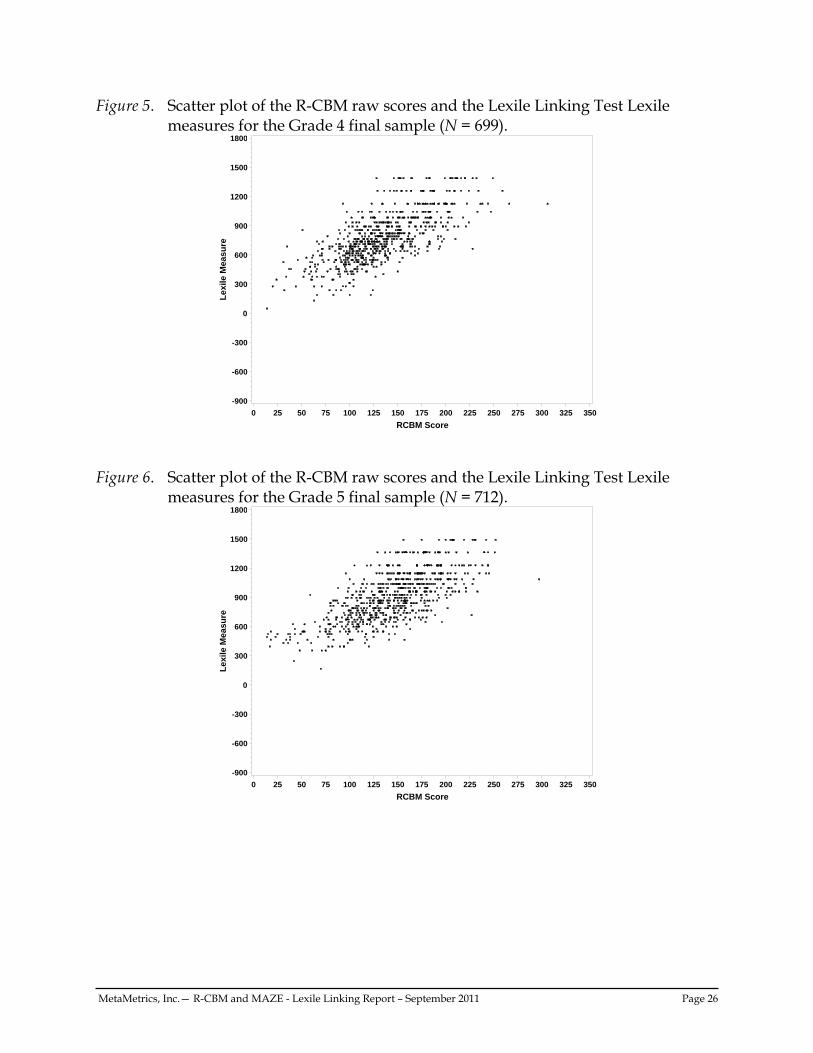
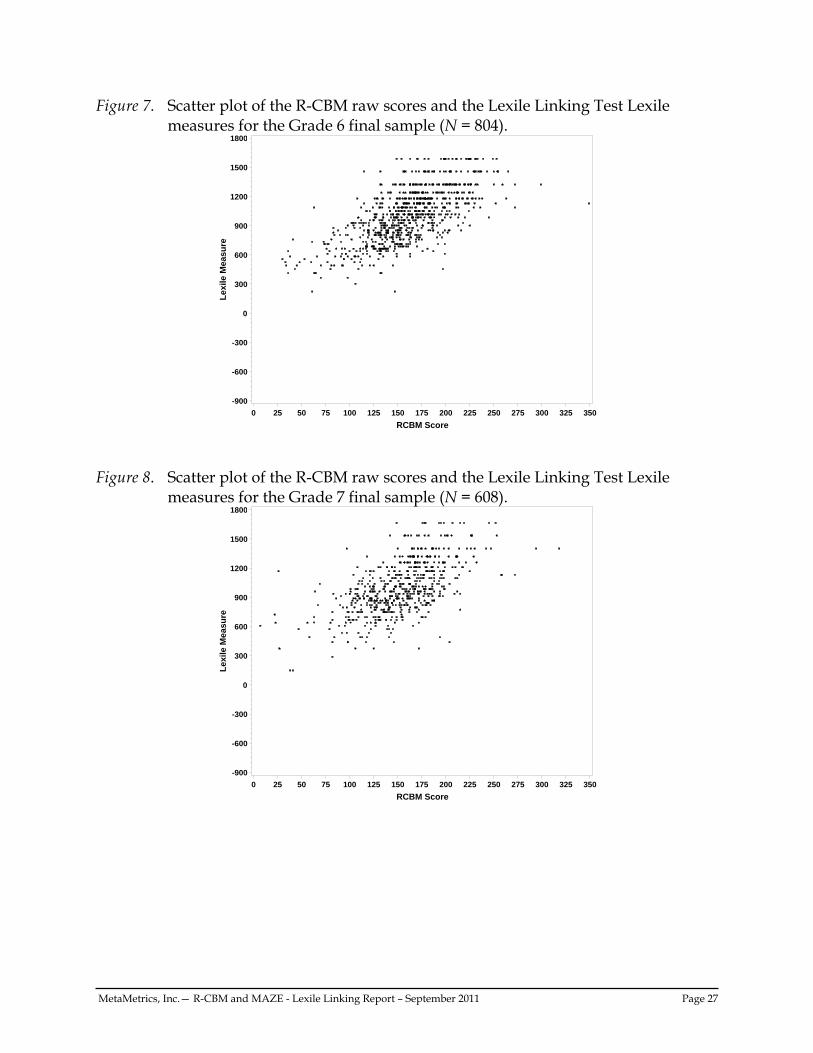
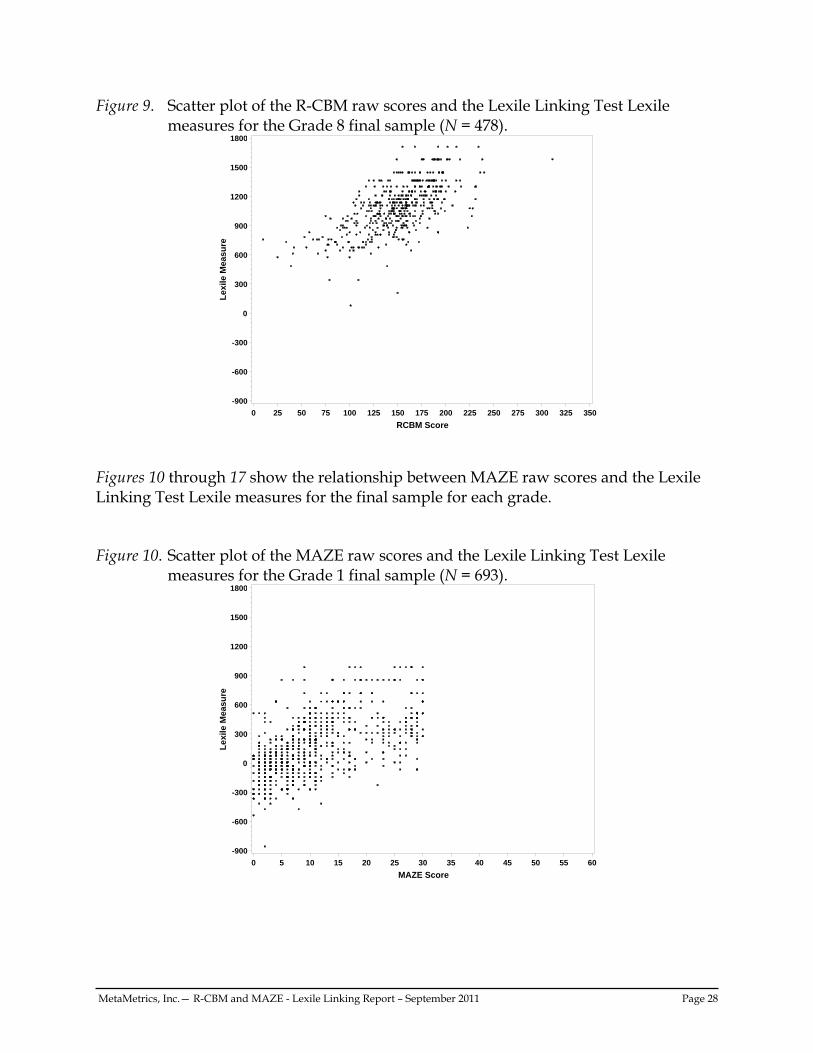
Figures 2 through 9 show the relationship between R-CBM raw scores and the Lexile Linking Test Lexile measures for the final sample for each grade. Figure 2. Scatter plot of the R-CBM raw scores and the Lexile Linking Test Lexile
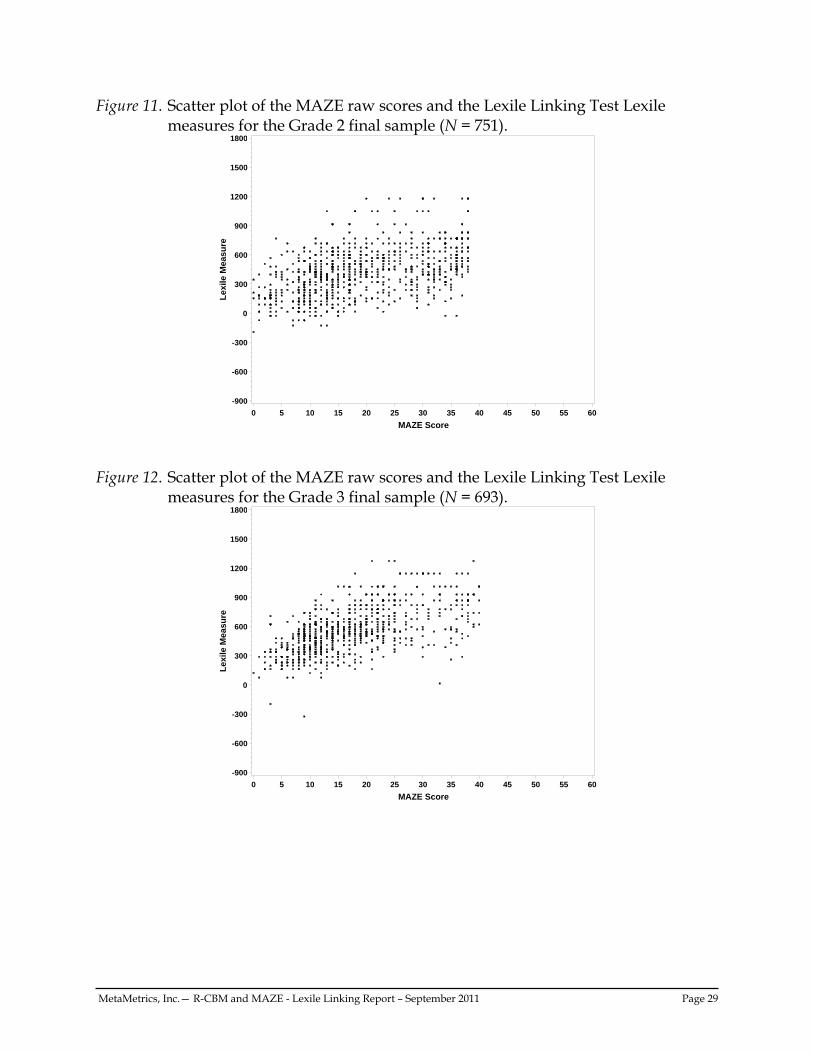
Figures 10 through 17 show the relationship between MAZE raw scores and the Lexile Linking Test Lexile measures for the final sample for each grade.
Figure 10. Scatter plot of the MAZE raw scores and the Lexile Linking Test Lexile measures for the Grade 1 final sample (N = 693).
Lex
ile M
easu
re
-900
-600
-300
0
300
600
900
1200
1500
1800
MAZE Score
0 5 10 15 20 25 30 35 40 45 50 55 60
MetaMetrics, Inc.— R-CBM and MAZE - Lexile Linking Report – September 2011 Page 29
Figure 11. Scatter plot of the MAZE raw scores and the Lexile Linking Test Lexile measures for the Grade 2 final sample (N = 751).
Lex
ile M
easu
re
-900
-600
-300
0
300
600
900
1200
1500
1800
MAZE Score
0 5 10 15 20 25 30 35 40 45 50 55 60
Figure 12. Scatter plot of the MAZE raw scores and the Lexile Linking Test Lexile measures for the Grade 3 final sample (N = 693).
Lex
ile M
easu
re
-900
-600
-300
0
300
600
900
1200
1500
1800
MAZE Score
0 5 10 15 20 25 30 35 40 45 50 55 60
MetaMetrics, Inc.— R-CBM and MAZE - Lexile Linking Report – September 2011 Page 30
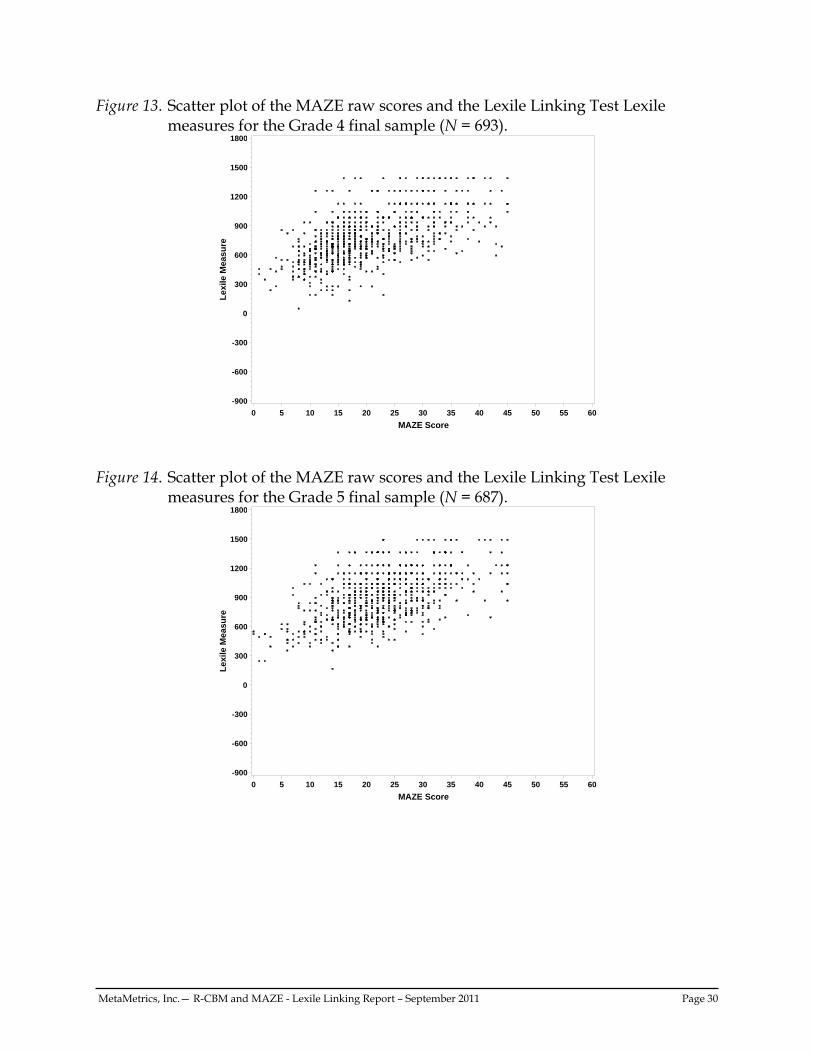
Figure 13. Scatter plot of the MAZE raw scores and the Lexile Linking Test Lexile measures for the Grade 4 final sample (N = 693).
Lex
ile M
easu
re
-900
-600
-300
0
300
600
900
1200
1500
1800
MAZE Score
0 5 10 15 20 25 30 35 40 45 50 55 60
Figure 14. Scatter plot of the MAZE raw scores and the Lexile Linking Test Lexile measures for the Grade 5 final sample (N = 687).
Lex
ile M
easu
re
-900
-600
-300
0
300
600
900
1200
1500
1800
MAZE Score
0 5 10 15 20 25 30 35 40 45 50 55 60
MetaMetrics, Inc.— R-CBM and MAZE - Lexile Linking Report – September 2011 Page 31
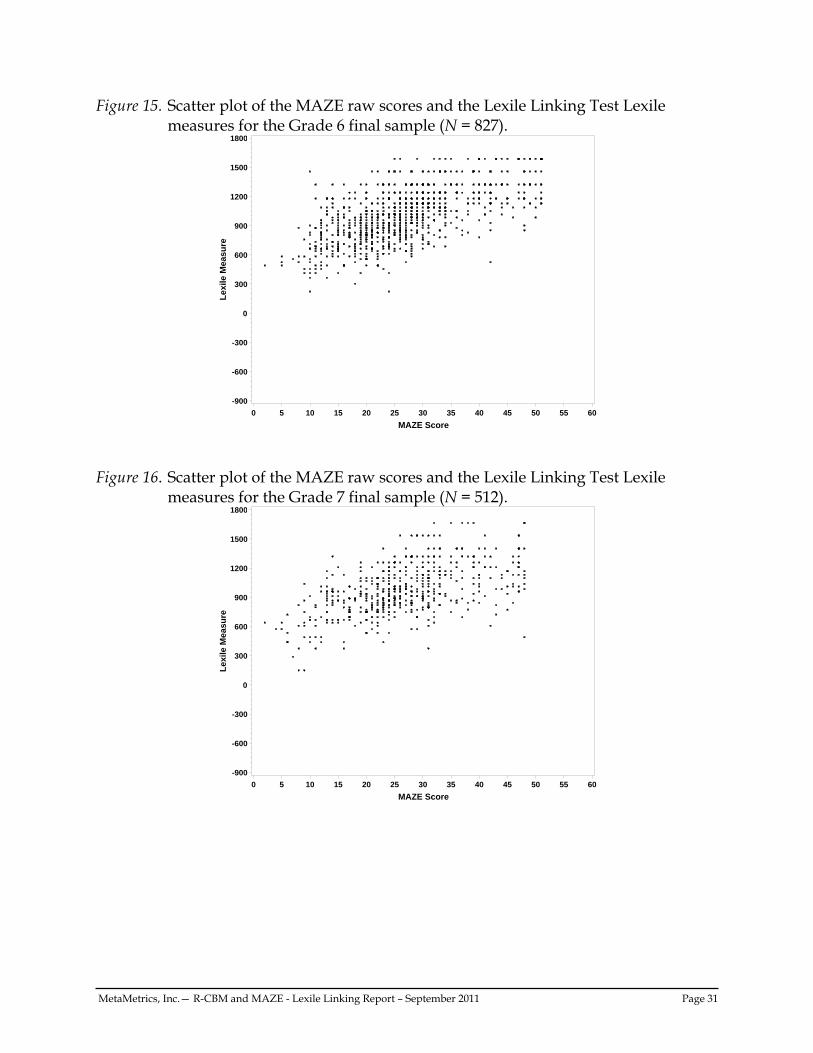
Figure 15. Scatter plot of the MAZE raw scores and the Lexile Linking Test Lexile measures for the Grade 6 final sample (N = 827).
Lex
ile M
easu
re
-900
-600
-300
0
300
600
900
1200
1500
1800
MAZE Score
0 5 10 15 20 25 30 35 40 45 50 55 60
Figure 16. Scatter plot of the MAZE raw scores and the Lexile Linking Test Lexile measures for the Grade 7 final sample (N = 512).
Lex
ile M
easu
re
-900
-600
-300
0
300
600
900
1200
1500
1800
MAZE Score
0 5 10 15 20 25 30 35 40 45 50 55 60
MetaMetrics, Inc.— R-CBM and MAZE - Lexile Linking Report – September 2011 Page 32
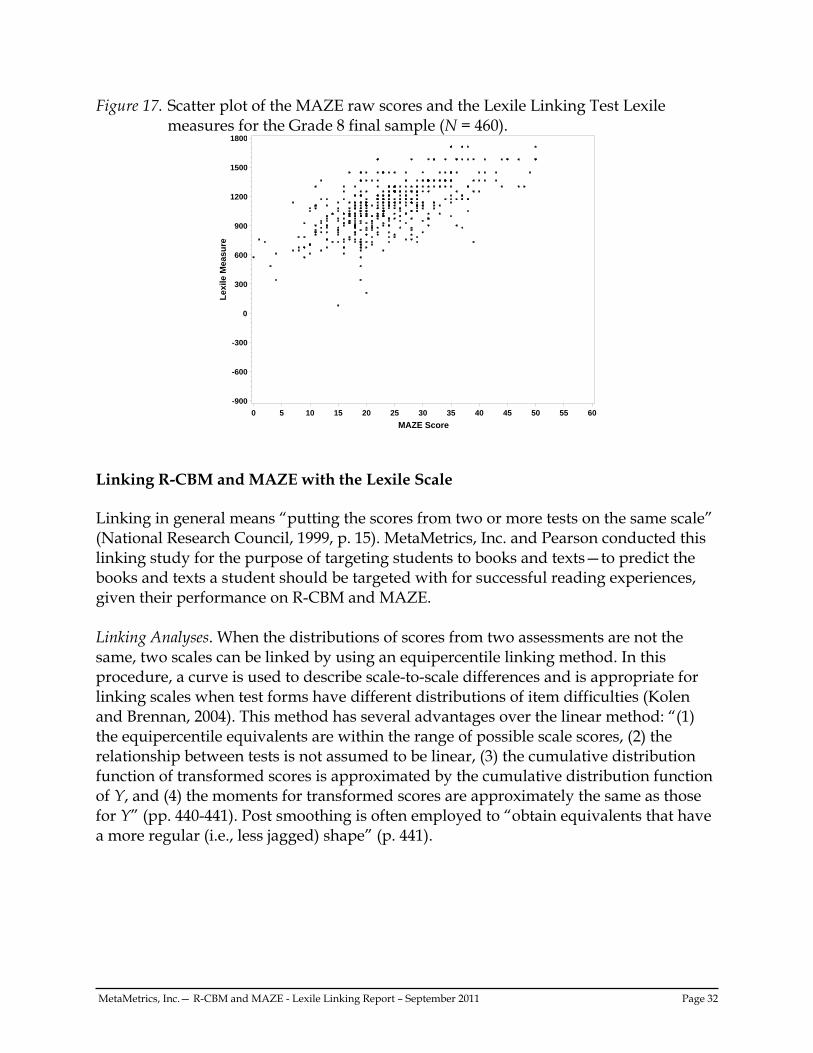
Figure 17. Scatter plot of the MAZE raw scores and the Lexile Linking Test Lexile measures for the Grade 8 final sample (N = 460).
Lex
ile M
easu
re
-900
-600
-300
0
300
600
900
1200
1500
1800
MAZE Score
0 5 10 15 20 25 30 35 40 45 50 55 60
Linking R-CBM and MAZE with the Lexile Scale Linking in general means “putting the scores from two or more tests on the same scale” (National Research Council, 1999, p. 15). MetaMetrics, Inc. and Pearson conducted this linking study for the purpose of targeting students to books and texts—to predict the books and texts a student should be targeted with for successful reading experiences, given their performance on R-CBM and MAZE. Linking Analyses. When the distributions of scores from two assessments are not the same, two scales can be linked by using an equipercentile linking method. In this procedure, a curve is used to describe scale-to-scale differences and is appropriate for linking scales when test forms have different distributions of item difficulties (Kolen and Brennan, 2004). This method has several advantages over the linear method: “(1) the equipercentile equivalents are within the range of possible scale scores, (2) the relationship between tests is not assumed to be linear, (3) the cumulative distribution function of transformed scores is approximated by the cumulative distribution function of Y, and (4) the moments for transformed scores are approximately the same as those for Y” (pp. 440-441). Post smoothing is often employed to “obtain equivalents that have a more regular (i.e., less jagged) shape” (p. 441).
MetaMetrics, Inc.— R-CBM and MAZE - Lexile Linking Report – September 2011 Page 33
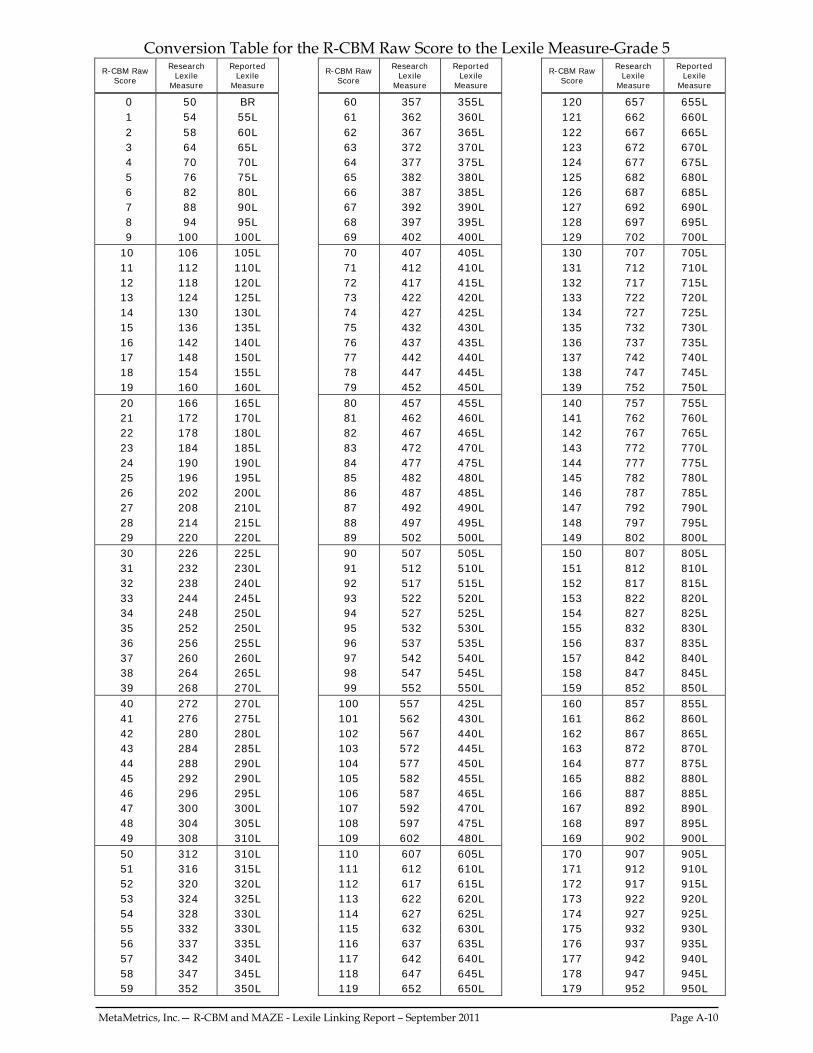
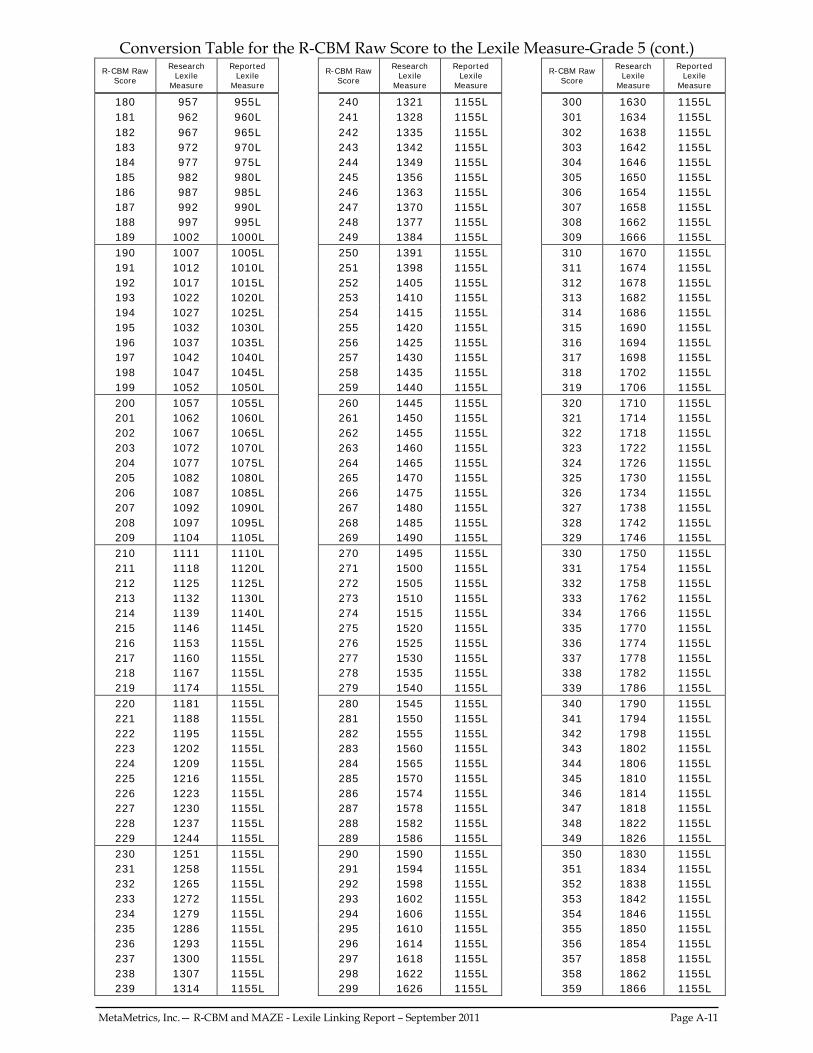
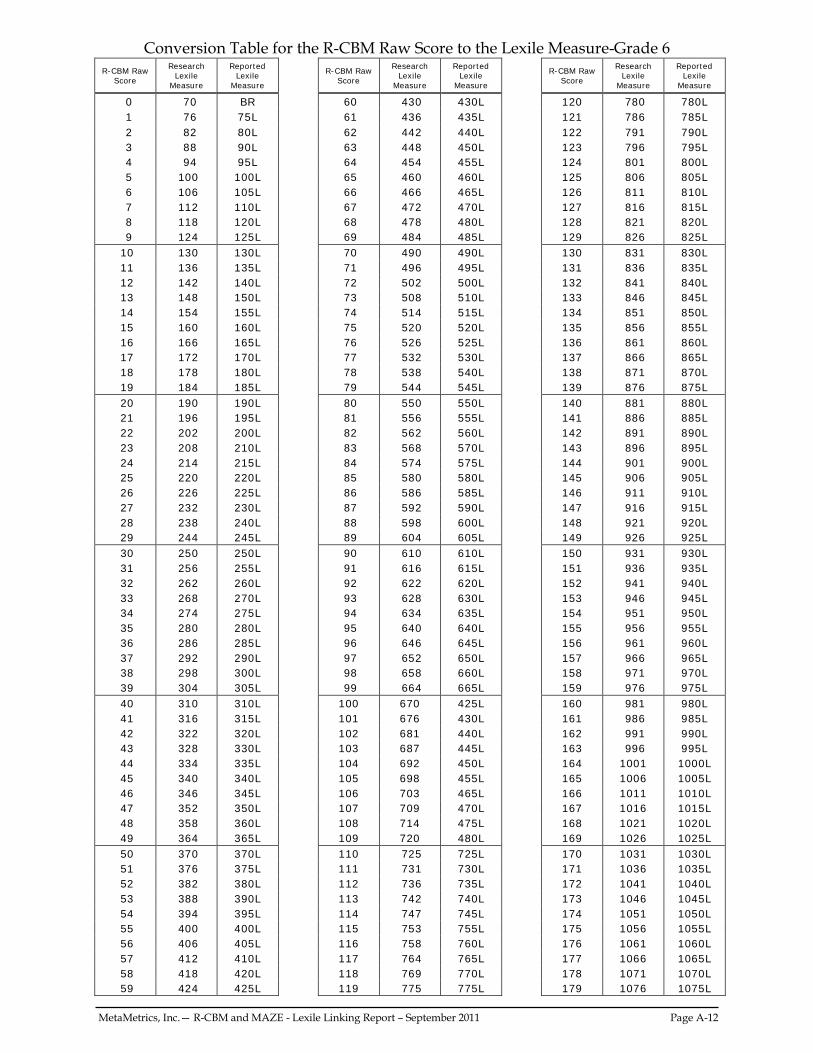
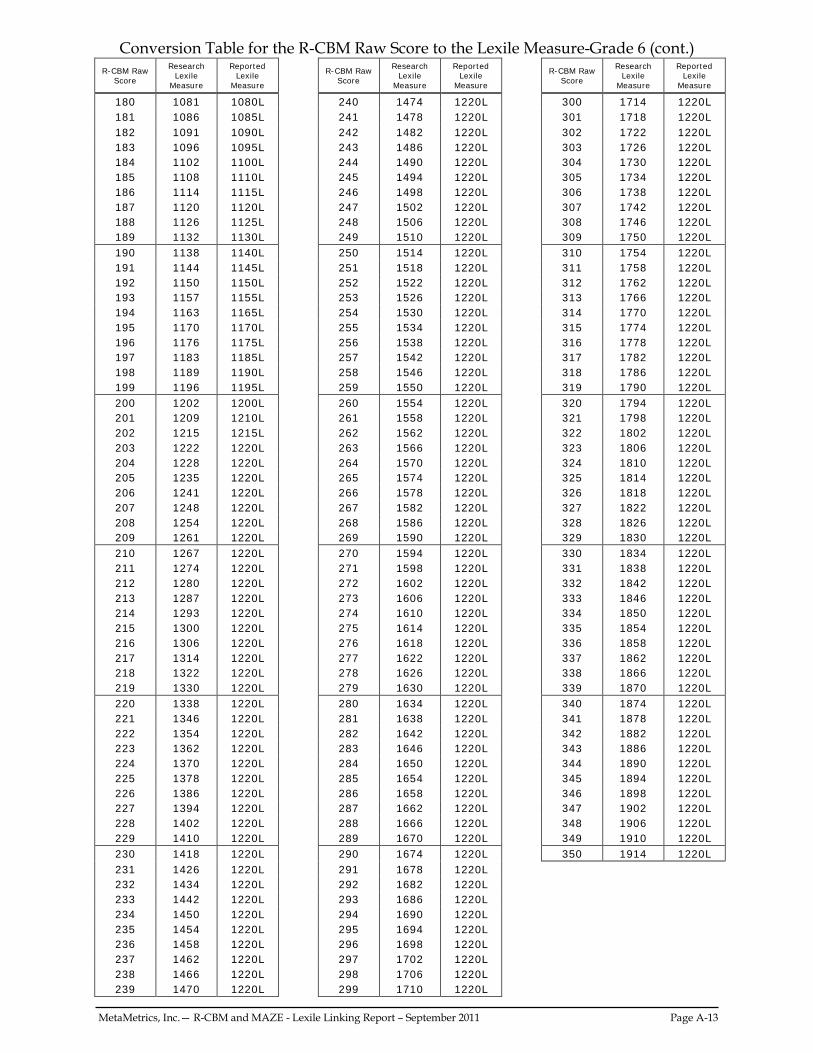
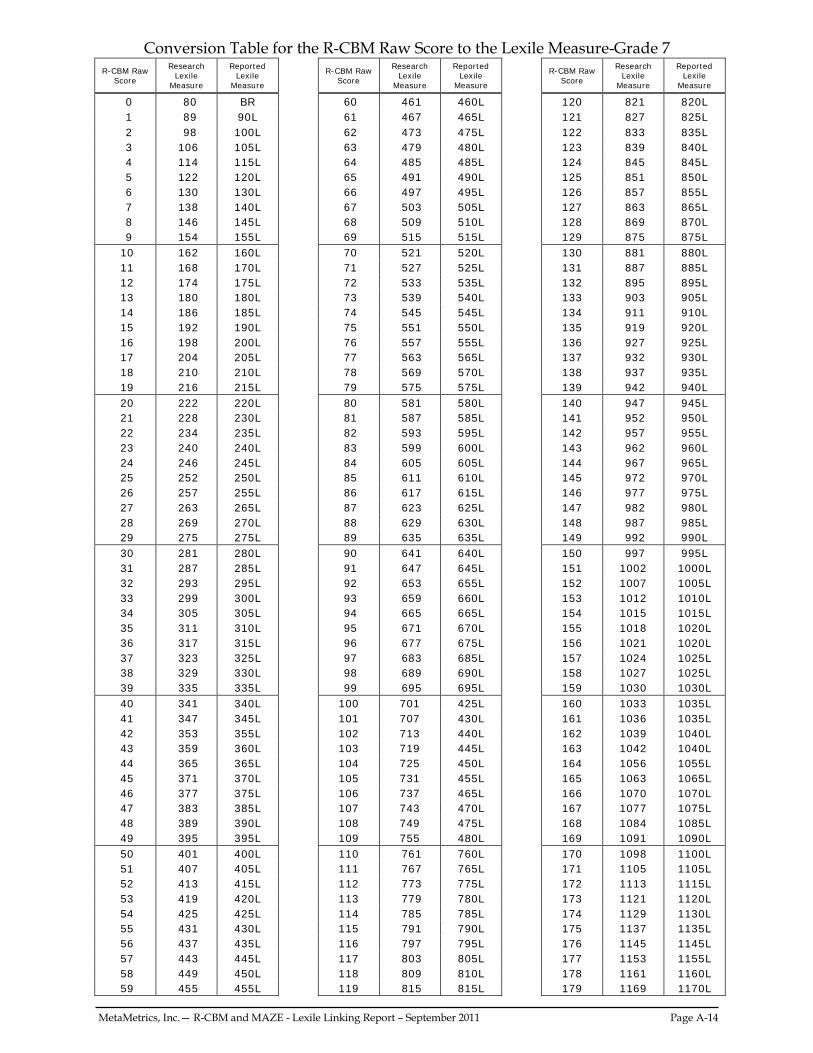
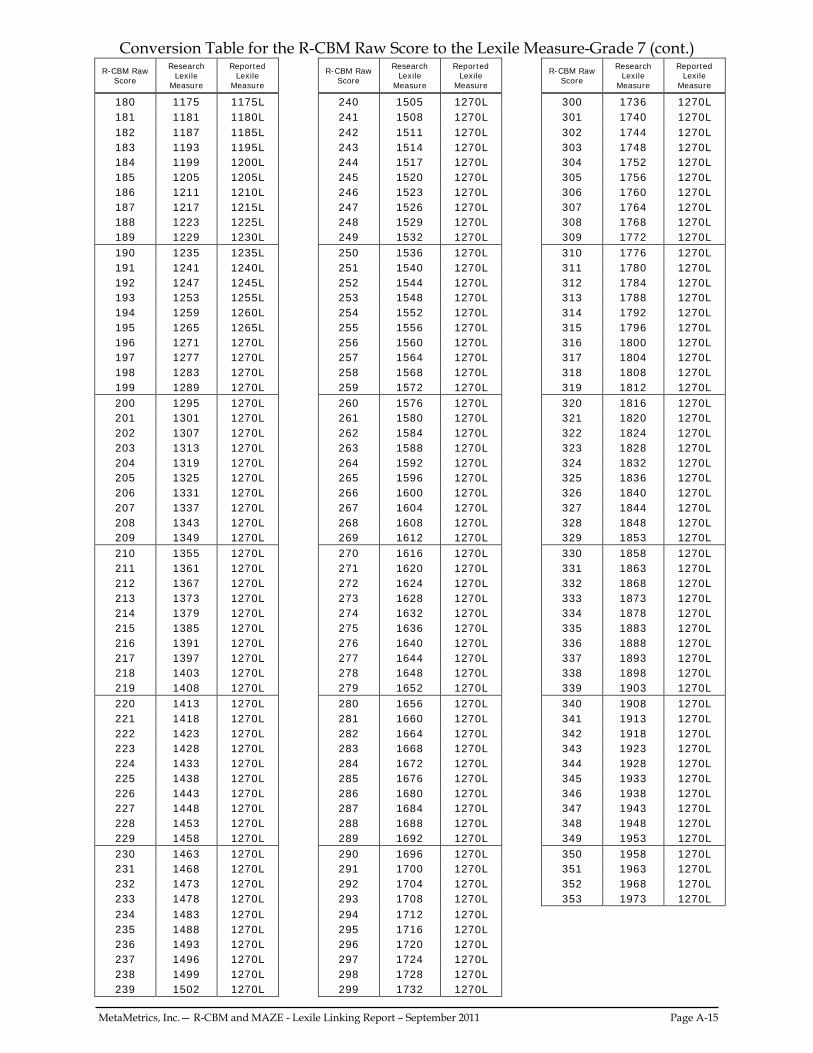
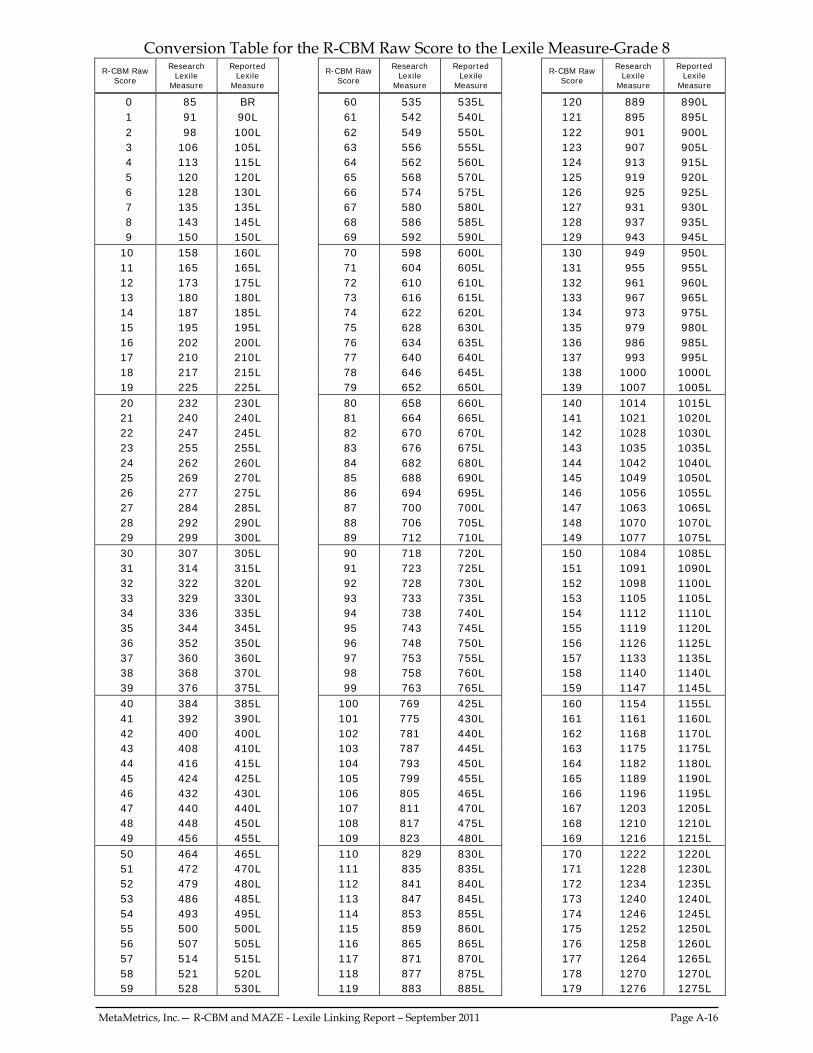
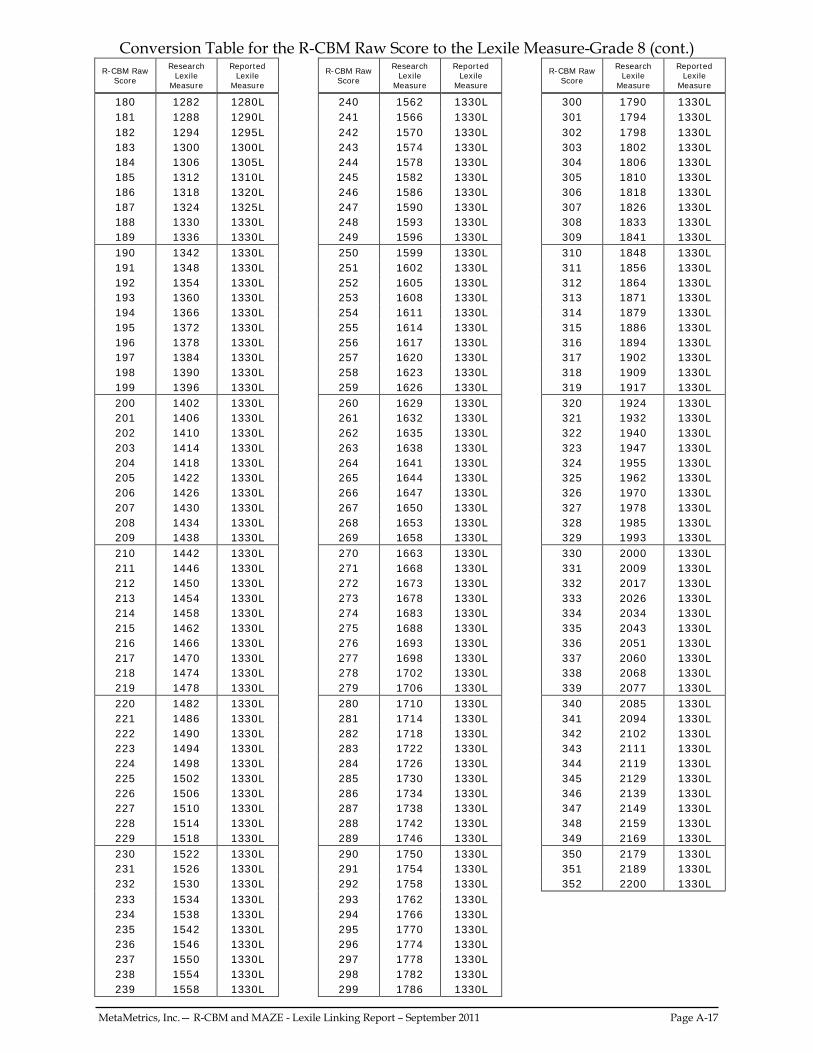
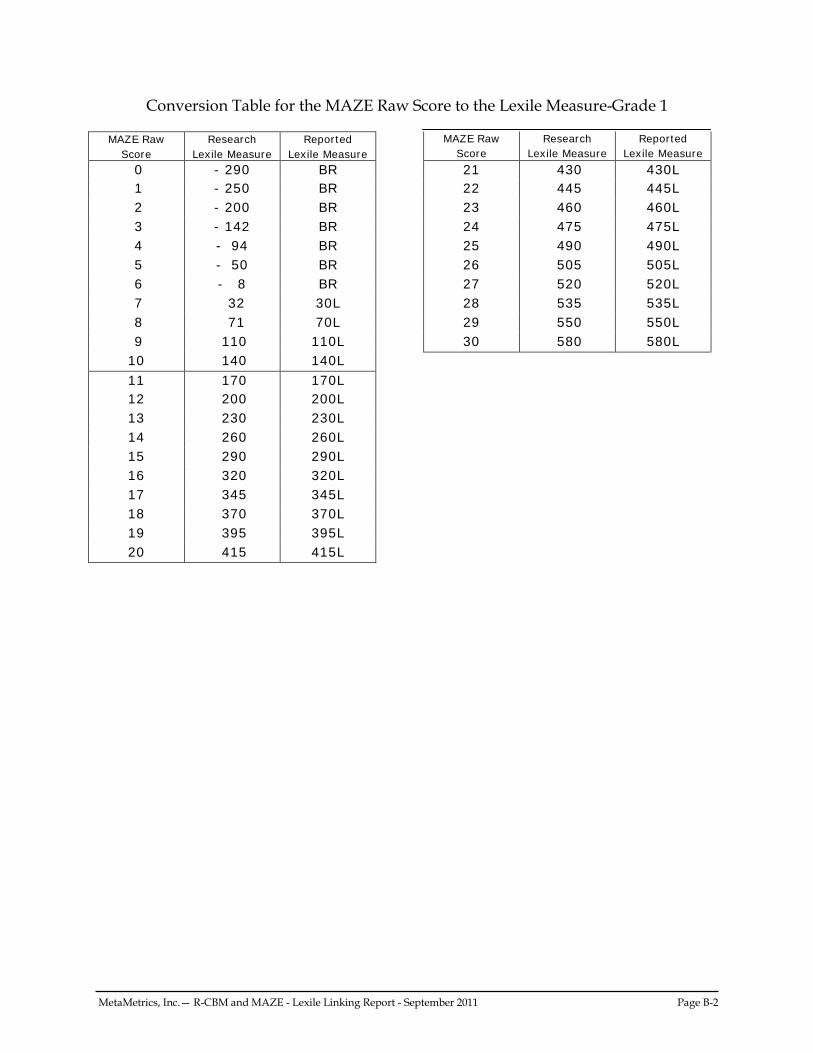
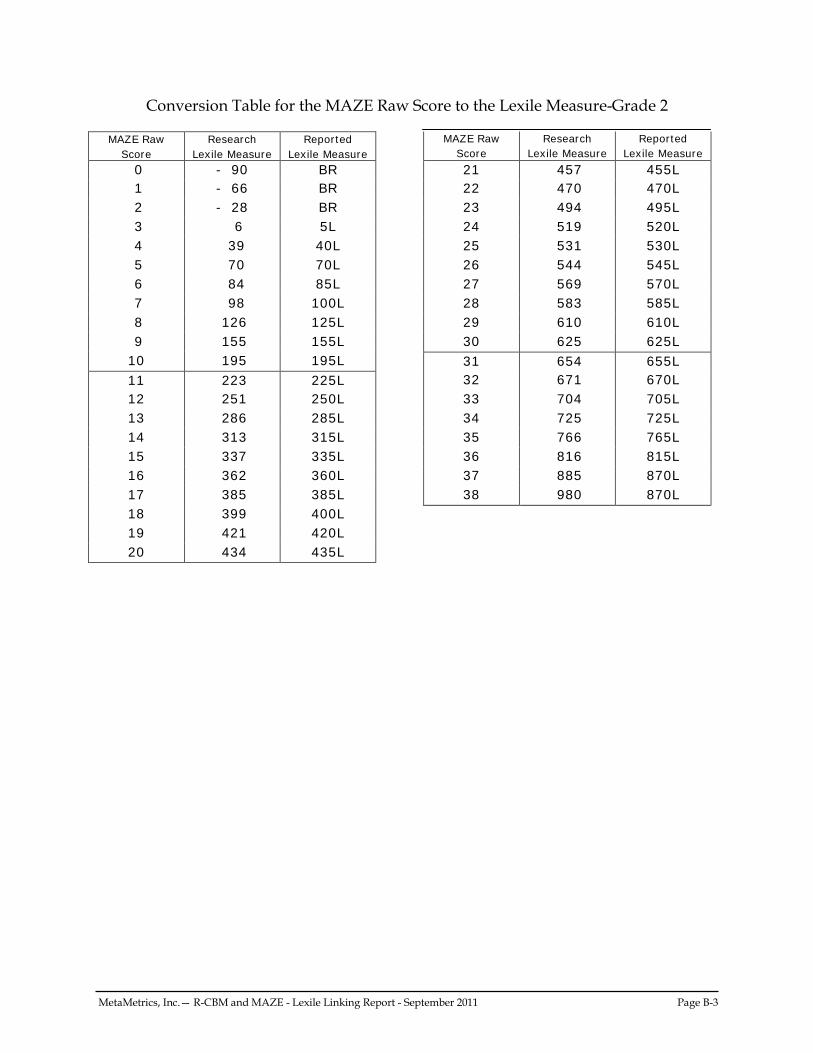
In equipercentile equating, differences in difficulty between tests are described by a non-linear transformation (Kolen and Brennan, 2004). Given scores x and y on tests X and Y, the non-linear relationship is eY(x) = G-1[F(x)] (Equation 2) where F is the cumulative distribution function of X, G is the cumulative distribution function of Y, and G-1 is the inverse of the cumulative distribution function of Y. Using percentile rank functions P and Q (for X and Y, respectively), the equipercentile equivalent of score x on the Y scale for the population is eY(x) = Q-1[P(x)], 0 ≤ P(x) < 100, = Yj + 0.5, P(x) = 100 (Equation 3) where Q-1 is the inverse of the percentile rank function for Y, and Yj represents the highest score for Y. To conduct an equipercentile linking of R-CBM and MAZE with the Lexile Linking Test results, the LEGS (Linking with Equivalent Groups or Single Group Design) program (version 2.0.1) by Brennan (2004) was employed. This program generates both unsmoothed and postsmoothed linking functions and uses the cubic spline method to conduct postsmoothing. In addition, the program preserves the symmetry of the equating conversion by averaging target-to-reference and reference-to-target conversions. Thus, R-CBM and MAZE raw scores can be converted to Lexile measures and, symmetrically, scores on the Lexile scale can be converted to R-CBM and MAZE raw scores using the same correspondence table or linking function. Using the final sample data described in Tables 10 and 11, the equipercentile linking function relating R-CBM and MAZE raw scores with Lexile measures for all students in the sample was developed. Based on an examination of the postsmoothed conversions, a smoothing parameter of 10 was closest to the unsmoothed Y distribution. Conversion tables were developed for all grade levels in order to express R-CBM and MAZE raw scores in the Lexile metric and were delivered to Pearson in electronic format. These tables are located in Appendices A and B. It should be noted that a raw score of “0” is set to a Lexile measure of BR for each grade and test. Table 12 contains the capped Lexile measures by grade. The measures that are reported for an individual student should reflect the purpose for which they will be used. If the purpose is accountability (at the student, school, or district level), then actual measures should be reported at all score points. If the purpose is instructional, then the scores should be capped at the upper bound of measurement error (e.g., at the 95th percentile point). In an instructional environment, where the purpose of the Lexile measure is to
MetaMetrics, Inc.— R-CBM and MAZE - Lexile Linking Report – September 2011 Page 34
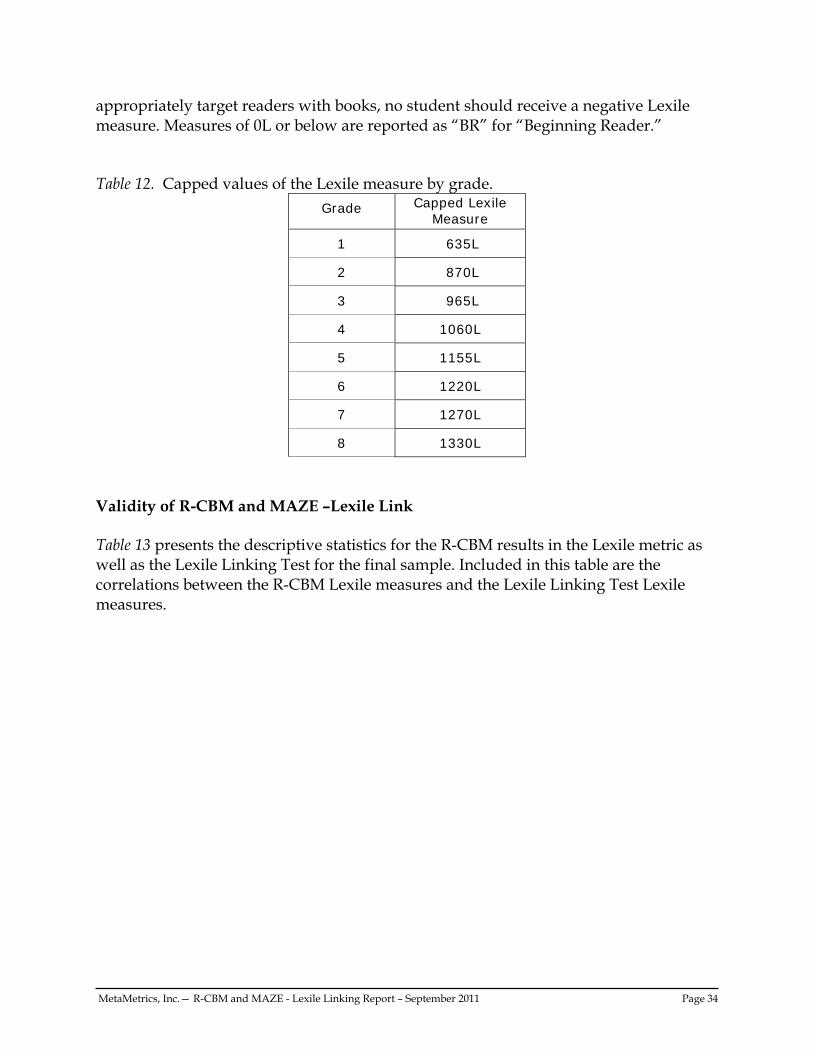
appropriately target readers with books, no student should receive a negative Lexile measure. Measures of 0L or below are reported as “BR” for “Beginning Reader.” Table 12. Capped values of the Lexile measure by grade.
Grade Capped Lexile Measure
1 635L
2 870L
3 965L
4 1060L
5 1155L
6 1220L
7 1270L
8 1330L
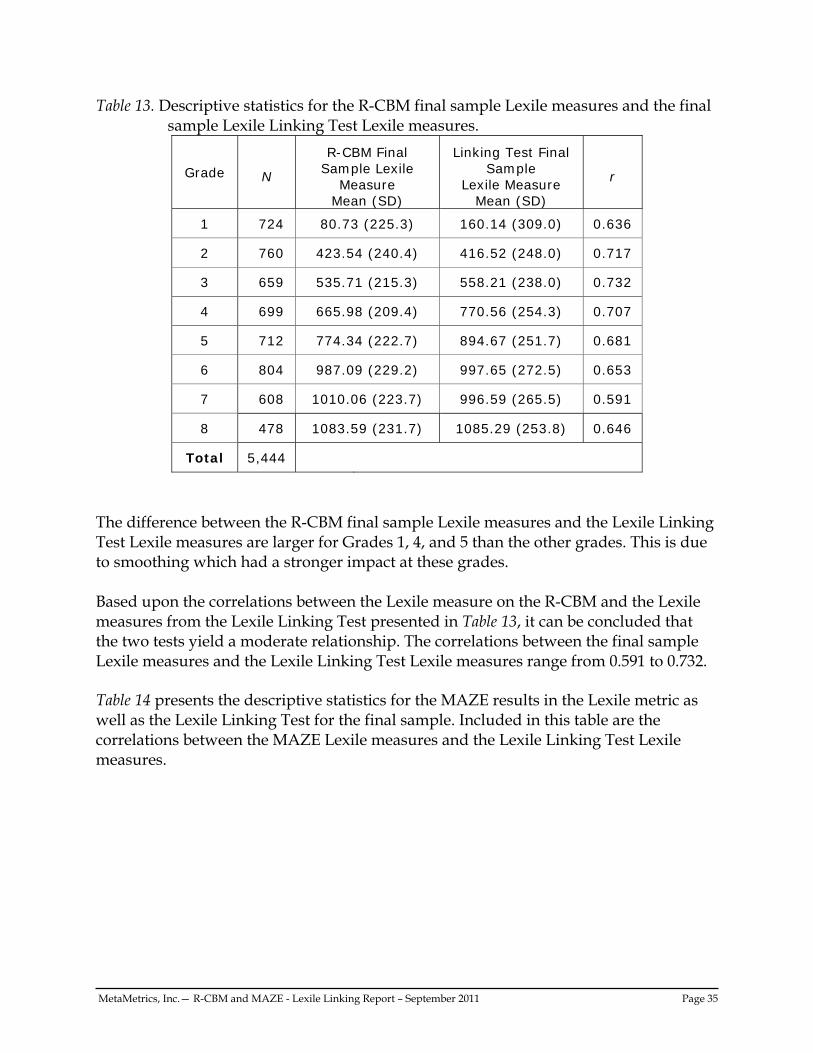
Validity of R-CBM and MAZE –Lexile Link Table 13 presents the descriptive statistics for the R-CBM results in the Lexile metric as well as the Lexile Linking Test for the final sample. Included in this table are the correlations between the R-CBM Lexile measures and the Lexile Linking Test Lexile measures.
MetaMetrics, Inc.— R-CBM and MAZE - Lexile Linking Report – September 2011 Page 35
Table 13. Descriptive statistics for the R-CBM final sample Lexile measures and the final sample Lexile Linking Test Lexile measures.
Grade N
R-CBM Final Sample Lexile
Measure Mean (SD)
Linking Test Final Sample
Lexile Measure Mean (SD)
r
1 724 80.73 (225.3) 160.14 (309.0) 0.636
2 760 423.54 (240.4) 416.52 (248.0) 0.717
3 659 535.71 (215.3) 558.21 (238.0) 0.732
4 699 665.98 (209.4) 770.56 (254.3) 0.707
5 712 774.34 (222.7) 894.67 (251.7) 0.681
6 804 987.09 (229.2) 997.65 (272.5) 0.653
7 608 1010.06 (223.7) 996.59 (265.5) 0.591
8 478 1083.59 (231.7) 1085.29 (253.8) 0.646
Total 5,444
The difference between the R-CBM final sample Lexile measures and the Lexile Linking Test Lexile measures are larger for Grades 1, 4, and 5 than the other grades. This is due to smoothing which had a stronger impact at these grades. Based upon the correlations between the Lexile measure on the R-CBM and the Lexile measures from the Lexile Linking Test presented in Table 13, it can be concluded that the two tests yield a moderate relationship. The correlations between the final sample Lexile measures and the Lexile Linking Test Lexile measures range from 0.591 to 0.732. Table 14 presents the descriptive statistics for the MAZE results in the Lexile metric as well as the Lexile Linking Test for the final sample. Included in this table are the correlations between the MAZE Lexile measures and the Lexile Linking Test Lexile measures.
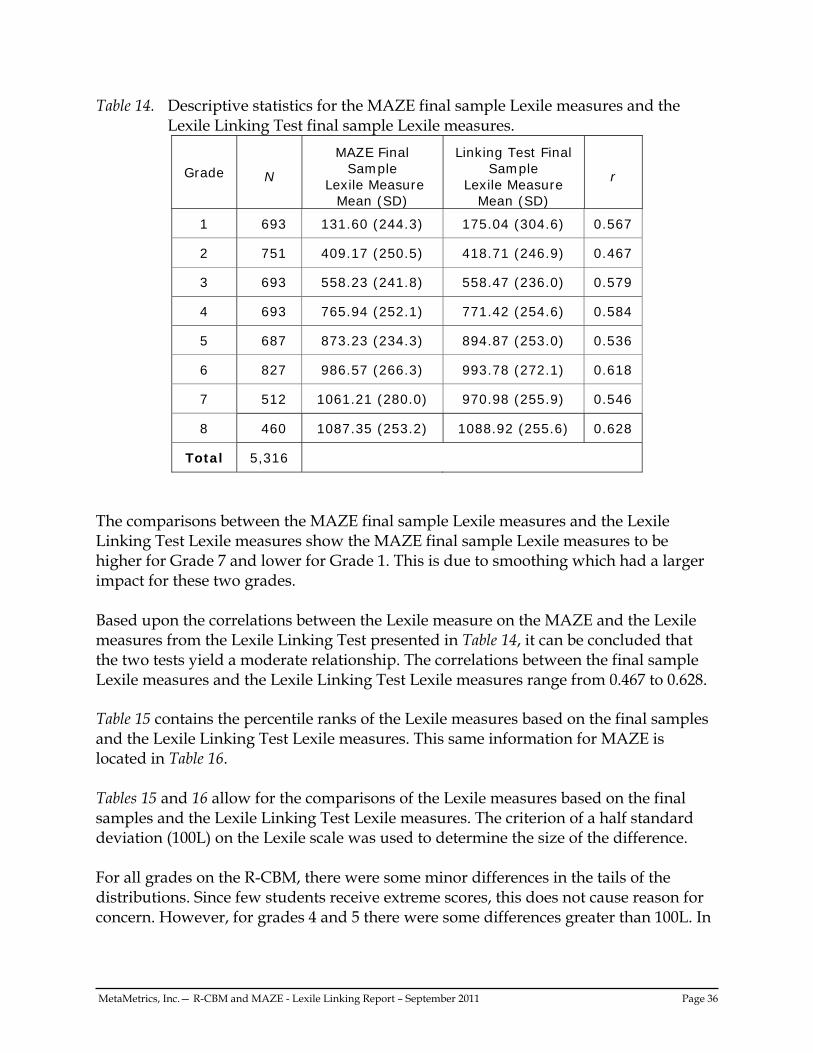
MetaMetrics, Inc.— R-CBM and MAZE - Lexile Linking Report – September 2011 Page 36
Table 14. Descriptive statistics for the MAZE final sample Lexile measures and the Lexile Linking Test final sample Lexile measures.
Grade N
MAZE Final Sample
Lexile Measure Mean (SD)
Linking Test Final Sample
Lexile Measure Mean (SD)
r
1 693 131.60 (244.3) 175.04 (304.6) 0.567
2 751 409.17 (250.5) 418.71 (246.9) 0.467
3 693 558.23 (241.8) 558.47 (236.0) 0.579
4 693 765.94 (252.1) 771.42 (254.6) 0.584
5 687 873.23 (234.3) 894.87 (253.0) 0.536
6 827 986.57 (266.3) 993.78 (272.1) 0.618
7 512 1061.21 (280.0) 970.98 (255.9) 0.546
8 460 1087.35 (253.2) 1088.92 (255.6) 0.628
Total 5,316
The comparisons between the MAZE final sample Lexile measures and the Lexile Linking Test Lexile measures show the MAZE final sample Lexile measures to be higher for Grade 7 and lower for Grade 1. This is due to smoothing which had a larger impact for these two grades. Based upon the correlations between the Lexile measure on the MAZE and the Lexile measures from the Lexile Linking Test presented in Table 14, it can be concluded that the two tests yield a moderate relationship. The correlations between the final sample Lexile measures and the Lexile Linking Test Lexile measures range from 0.467 to 0.628. Table 15 contains the percentile ranks of the Lexile measures based on the final samples and the Lexile Linking Test Lexile measures. This same information for MAZE is located in Table 16. Tables 15 and 16 allow for the comparisons of the Lexile measures based on the final samples and the Lexile Linking Test Lexile measures. The criterion of a half standard deviation (100L) on the Lexile scale was used to determine the size of the difference. For all grades on the R-CBM, there were some minor differences in the tails of the distributions. Since few students receive extreme scores, this does not cause reason for concern. However, for grades 4 and 5 there were some differences greater than 100L. In
MetaMetrics, Inc.— R-CBM and MAZE - Lexile Linking Report – September 2011 Page 37
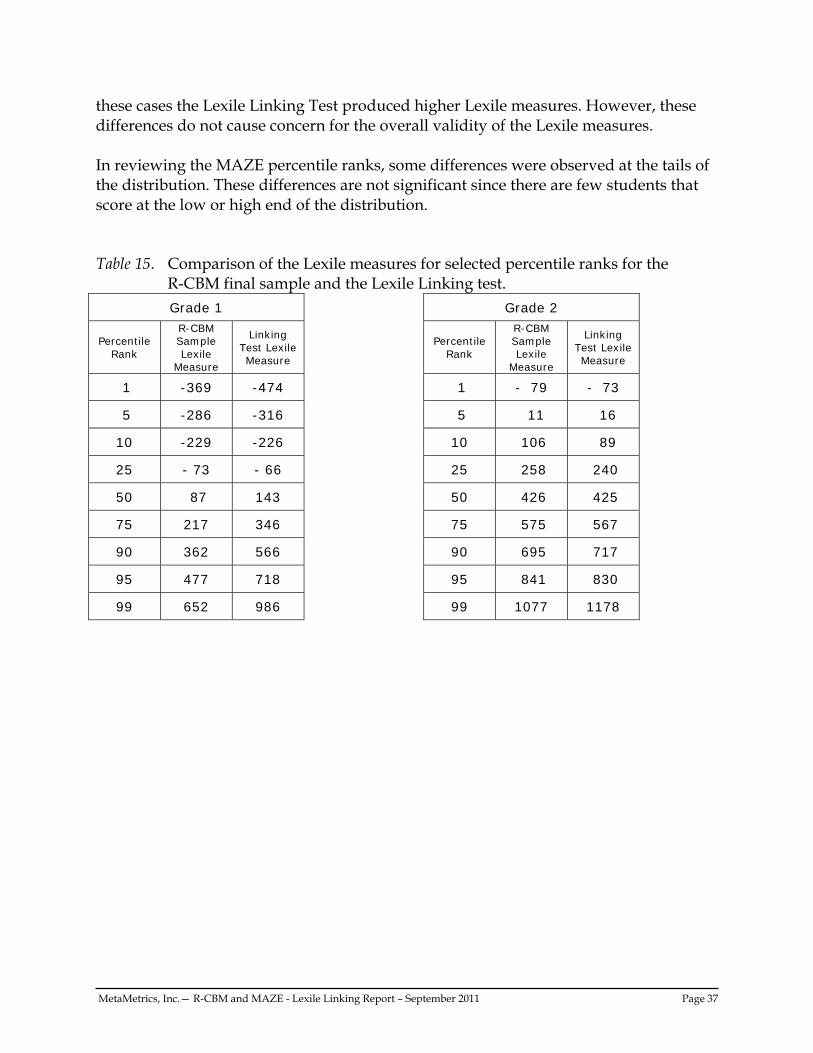
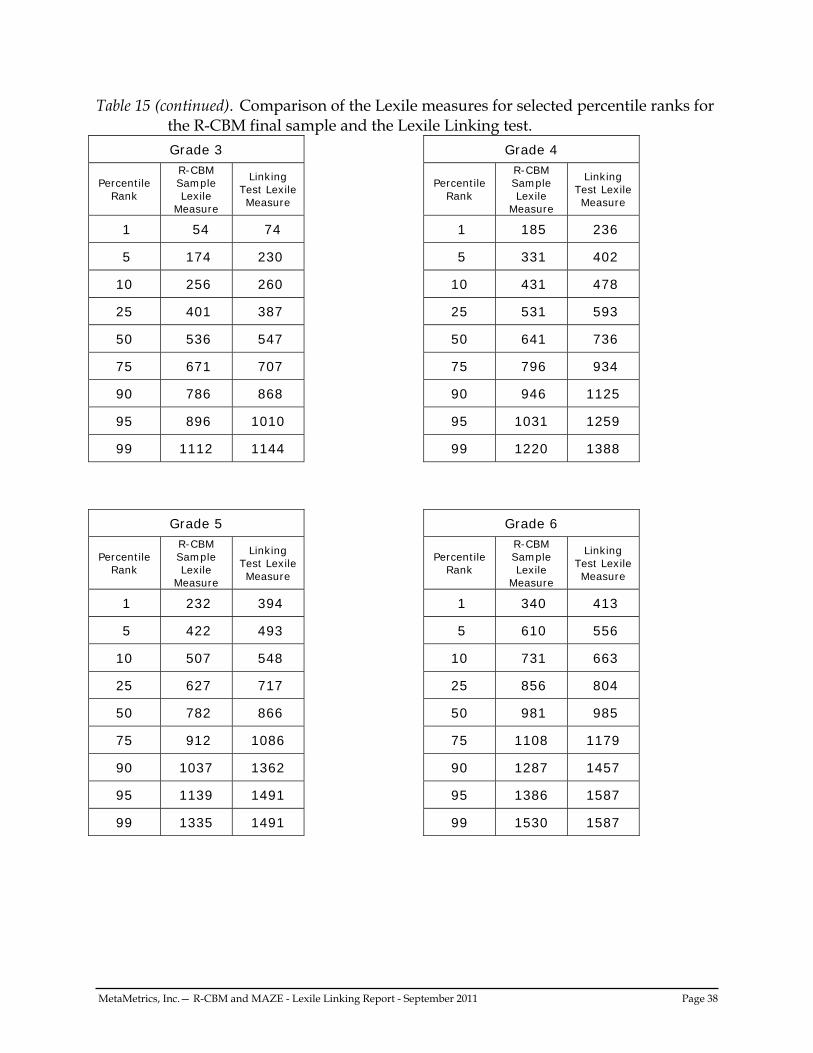
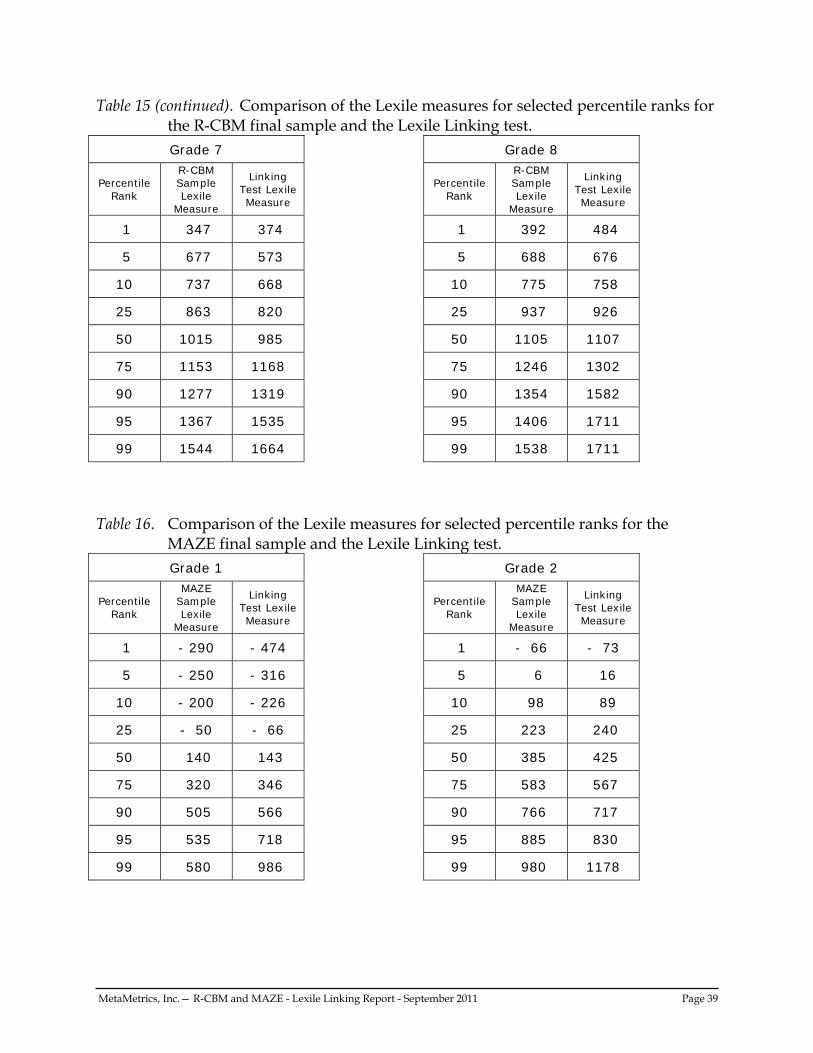
these cases the Lexile Linking Test produced higher Lexile measures. However, these differences do not cause concern for the overall validity of the Lexile measures. In reviewing the MAZE percentile ranks, some differences were observed at the tails of the distribution. These differences are not significant since there are few students that score at the low or high end of the distribution. Table 15. Comparison of the Lexile measures for selected percentile ranks for the
R-CBM final sample and the Lexile Linking test. Grade 1
Percentile Rank
R-CBM Sample Lexile
Measure
Linking Test Lexile Measure
1 -369 -474
5 -286 -316
10 -229 -226
25 - 73 - 66
50 87 143
75 217 346
90 362 566
95 477 718
99 652 986
Grade 2
Percentile Rank
R-CBM Sample Lexile
Measure
Linking Test Lexile Measure
1 - 79 - 73
5 11 16
10 106 89
25 258 240
50 426 425
75 575 567
90 695 717
95 841 830
99 1077 1178
MetaMetrics, Inc.— R-CBM and MAZE - Lexile Linking Report - September 2011 Page 38
Table 15 (continued). Comparison of the Lexile measures for selected percentile ranks for the R-CBM final sample and the Lexile Linking test.Grade 3
Percentile Rank
R-CBM Sample Lexile
Measure
Linking Test Lexile Measure
1 54 74
5 174 230
10 256 260
25 401 387
50 536 547
75 671 707
90 786 868
95 896 1010
99 1112 1144
Grade 4
Percentile Rank
R-CBM Sample Lexile
Measure
Linking Test Lexile Measure
1 185 236
5 331 402
10 431 478
25 531 593
50 641 736
75 796 934
90 946 1125
95 1031 1259
99 1220 1388
Grade 5
Percentile Rank
R-CBM Sample Lexile
Measure
Linking Test Lexile Measure
1 232 394
5 422 493
10 507 548
25 627 717
50 782 866
75 912 1086
90 1037 1362
95 1139 1491
99 1335 1491
Grade 6
Percentile Rank
R-CBM Sample Lexile
Measure
Linking Test Lexile Measure
1 340 413
5 610 556
10 731 663
25 856 804
50 981 985
75 1108 1179
90 1287 1457
95 1386 1587
99 1530 1587
MetaMetrics, Inc.— R-CBM and MAZE - Lexile Linking Report - September 2011 Page 39
Table 15 (continued). Comparison of the Lexile measures for selected percentile ranks for the R-CBM final sample and the Lexile Linking test.Grade 7
Percentile Rank
R-CBM Sample Lexile
Measure
Linking Test Lexile Measure
1 347 374
5 677 573
10 737 668
25 863 820
50 1015 985
75 1153 1168
90 1277 1319
95 1367 1535
99 1544 1664
Grade 8
Percentile Rank
R-CBM Sample Lexile
Measure
Linking Test Lexile Measure
1 392 484
5 688 676
10 775 758
25 937 926
50 1105 1107
75 1246 1302
90 1354 1582
95 1406 1711
99 1538 1711
Table 16. Comparison of the Lexile measures for selected percentile ranks for the
MAZE final sample and the Lexile Linking test.Grade 1
Percentile Rank
MAZE Sample Lexile
Measure
Linking Test Lexile Measure
1 - 290 - 474
5 - 250 - 316
10 - 200 - 226
25 - 50 - 66
50 140 143
75 320 346
90 505 566
95 535 718
99 580 986
Grade 2
Percentile Rank
MAZE Sample Lexile
Measure
Linking Test Lexile Measure
1 - 66 - 73
5 6 16
10 98 89
25 223 240
50 385 425
75 583 567
90 766 717
95 885 830
99 980 1178
MetaMetrics, Inc.— R-CBM and MAZE - Lexile Linking Report - September 2011 Page 40
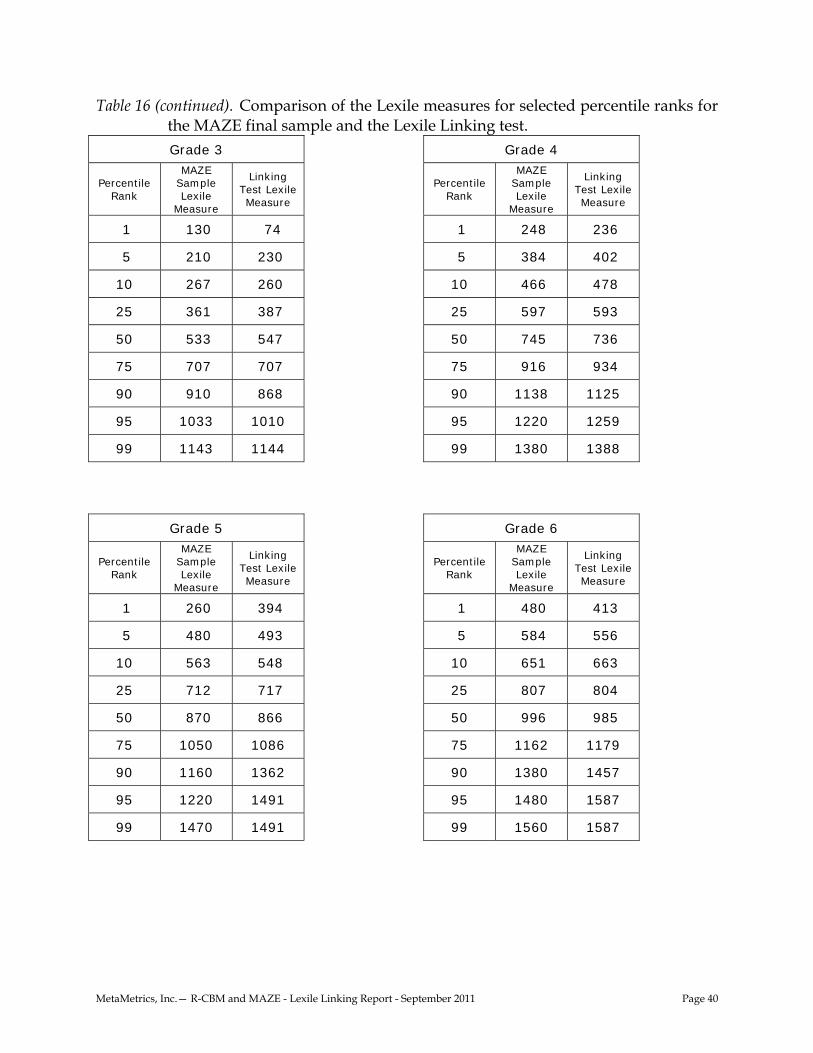
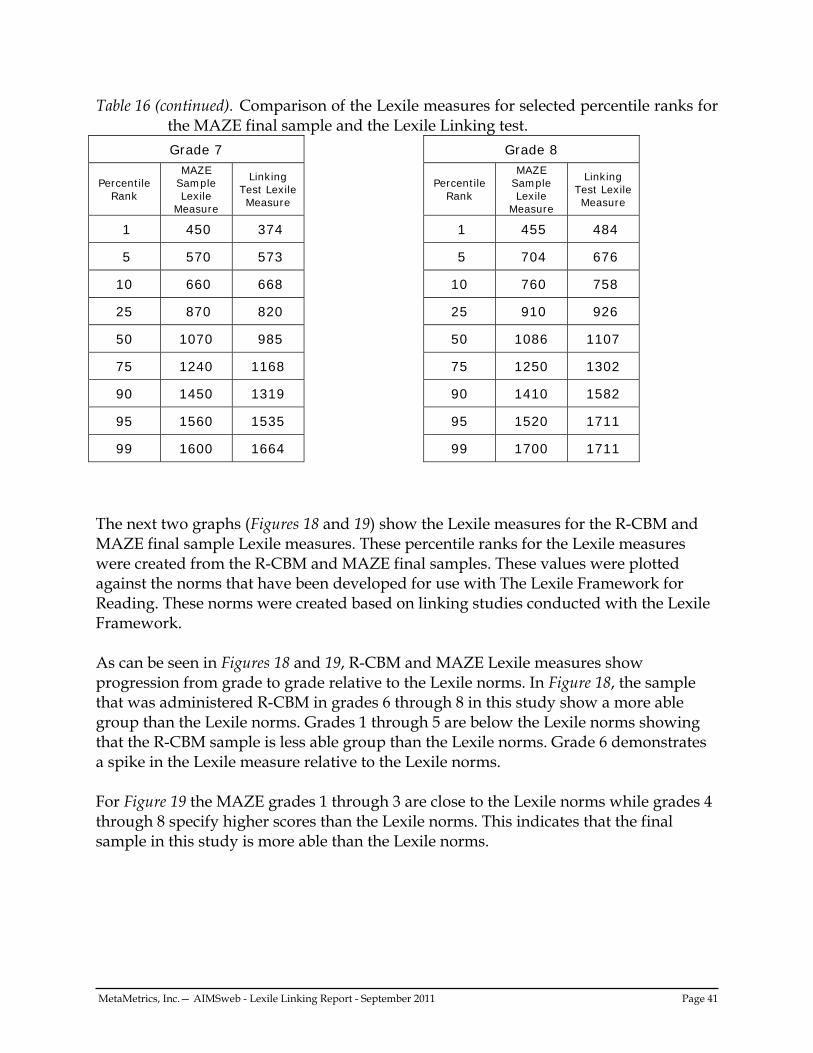
Table 16 (continued). Comparison of the Lexile measures for selected percentile ranks for the MAZE final sample and the Lexile Linking test. Grade 3
Table 16 (continued). Comparison of the Lexile measures for selected percentile ranks for the MAZE final sample and the Lexile Linking test. Grade 7
Percentile Rank
MAZE Sample Lexile
Measure
Linking Test Lexile Measure
1 450 374
5 570 573
10 660 668
25 870 820
50 1070 985
75 1240 1168
90 1450 1319
95 1560 1535
99 1600 1664
Grade 8
Percentile Rank
MAZE Sample Lexile
Measure
Linking Test Lexile Measure
1 455 484
5 704 676
10 760 758
25 910 926
50 1086 1107
75 1250 1302
90 1410 1582
95 1520 1711
99 1700 1711
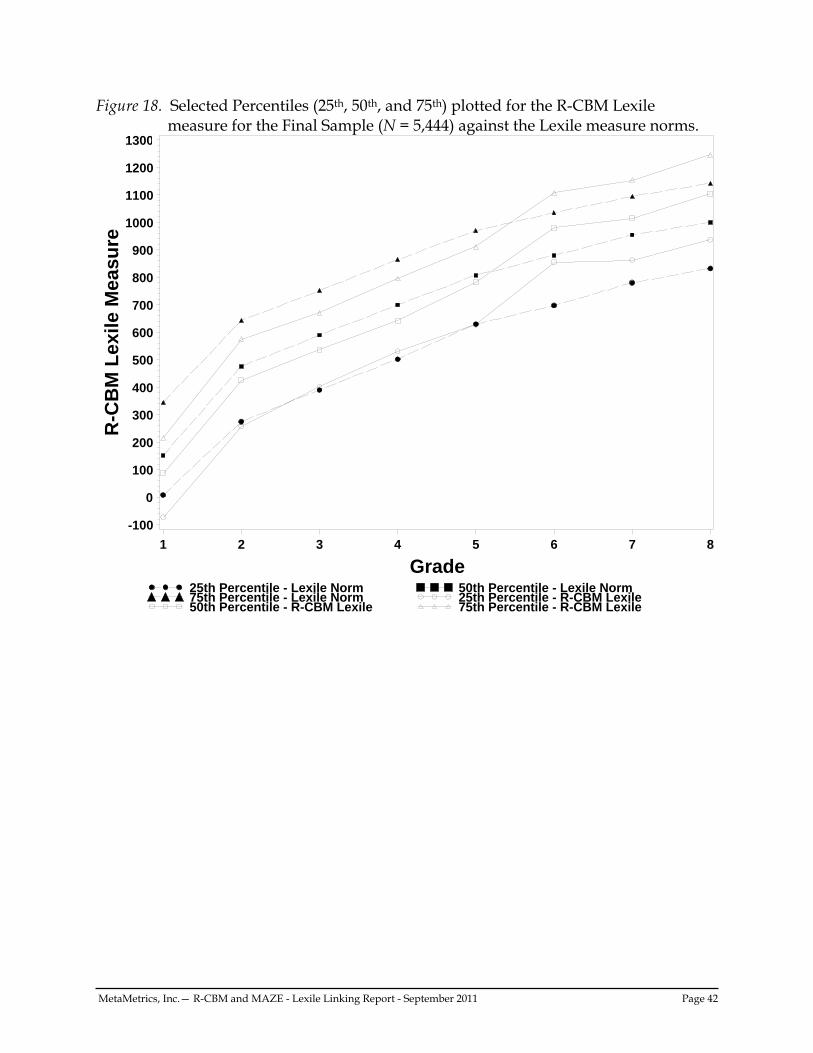
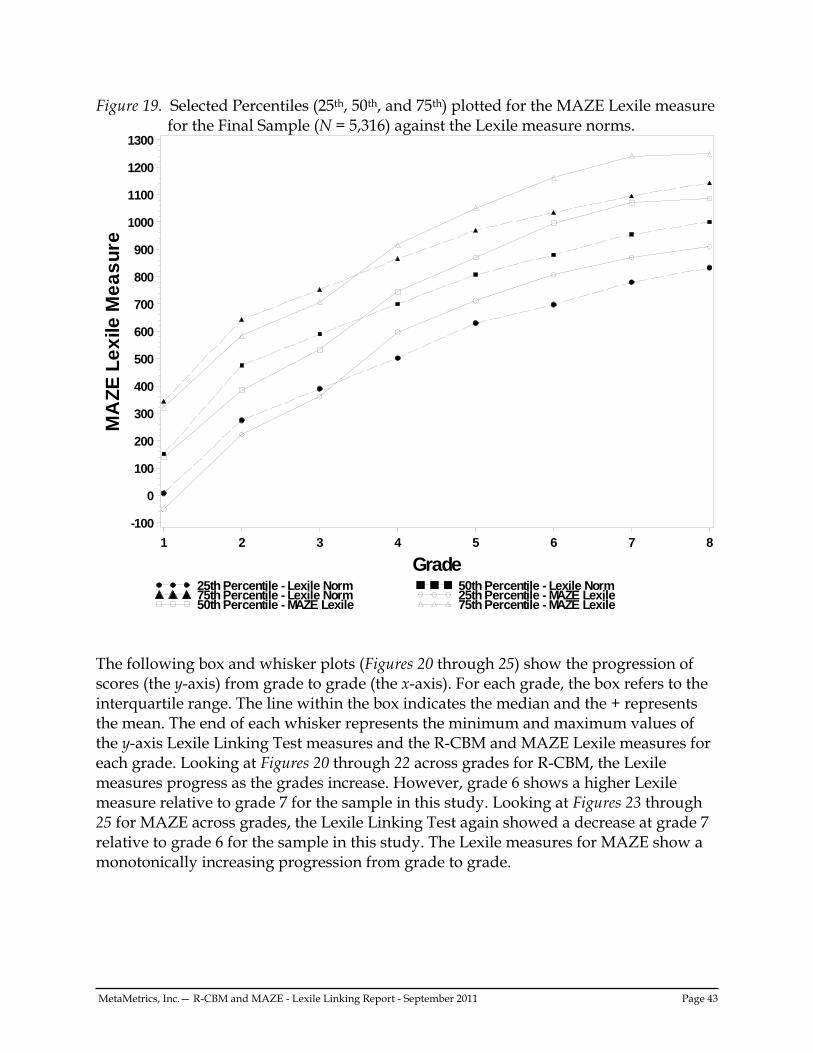
The next two graphs (Figures 18 and 19) show the Lexile measures for the R-CBM and MAZE final sample Lexile measures. These percentile ranks for the Lexile measures were created from the R-CBM and MAZE final samples. These values were plotted against the norms that have been developed for use with The Lexile Framework for Reading. These norms were created based on linking studies conducted with the Lexile Framework. As can be seen in Figures 18 and 19, R-CBM and MAZE Lexile measures show progression from grade to grade relative to the Lexile norms. In Figure 18, the sample that was administered R-CBM in grades 6 through 8 in this study show a more able group than the Lexile norms. Grades 1 through 5 are below the Lexile norms showing that the R-CBM sample is less able group than the Lexile norms. Grade 6 demonstrates a spike in the Lexile measure relative to the Lexile norms. For Figure 19 the MAZE grades 1 through 3 are close to the Lexile norms while grades 4 through 8 specify higher scores than the Lexile norms. This indicates that the final sample in this study is more able than the Lexile norms.
MetaMetrics, Inc.— R-CBM and MAZE - Lexile Linking Report - September 2011 Page 42
Figure 18. Selected Percentiles (25th, 50th, and 75th) plotted for the R-CBM Lexile measure for the Final Sample (N = 5,444) against the Lexile measure norms.
MetaMetrics, Inc.— R-CBM and MAZE - Lexile Linking Report - September 2011 Page 43
Figure 19. Selected Percentiles (25th, 50th, and 75th) plotted for the MAZE Lexile measure for the Final Sample (N = 5,316) against the Lexile measure norms.
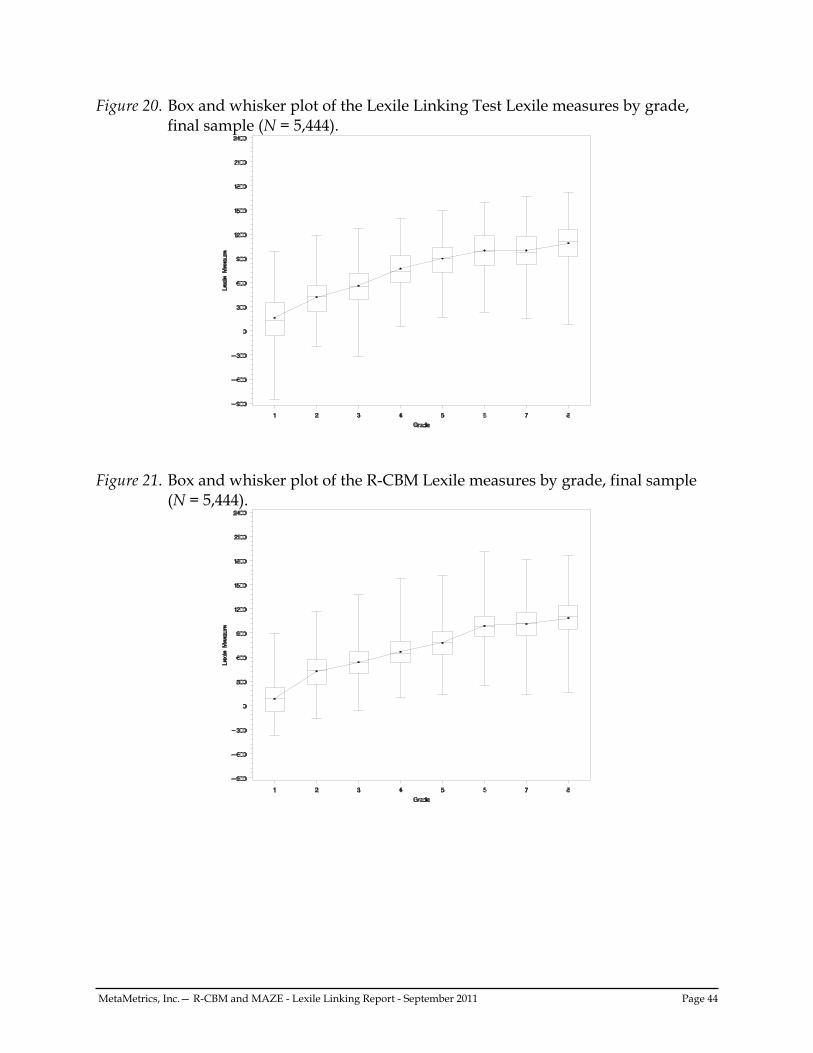
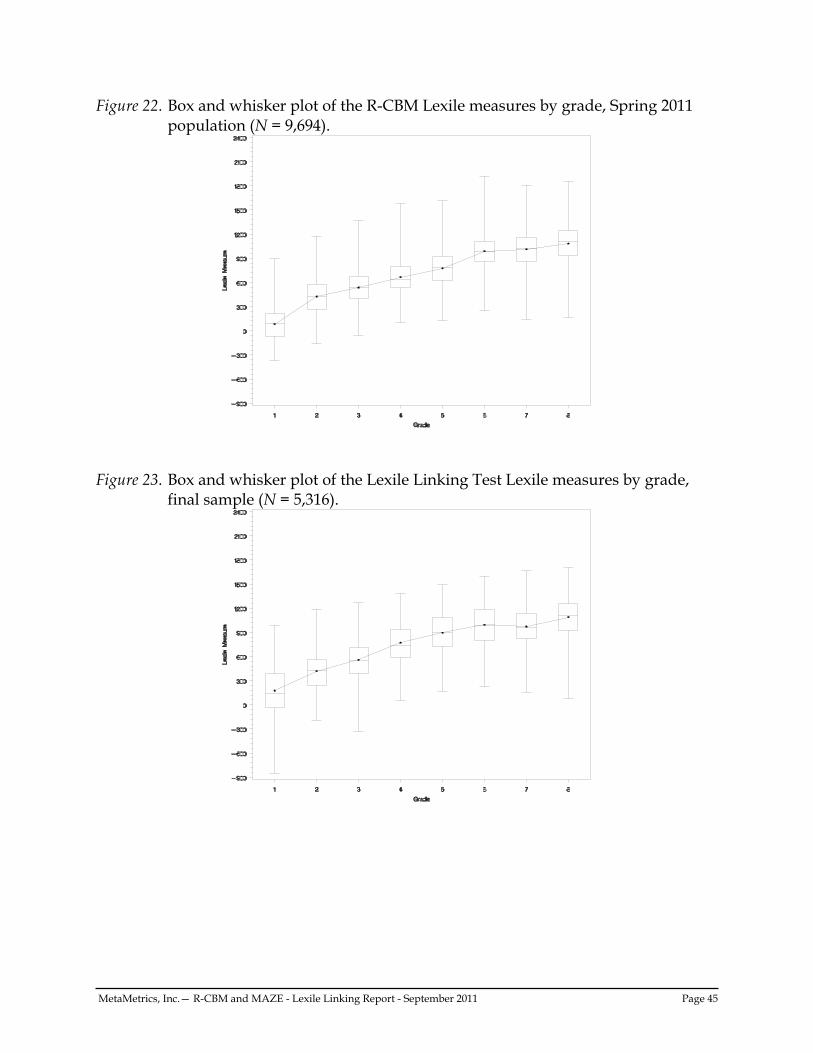
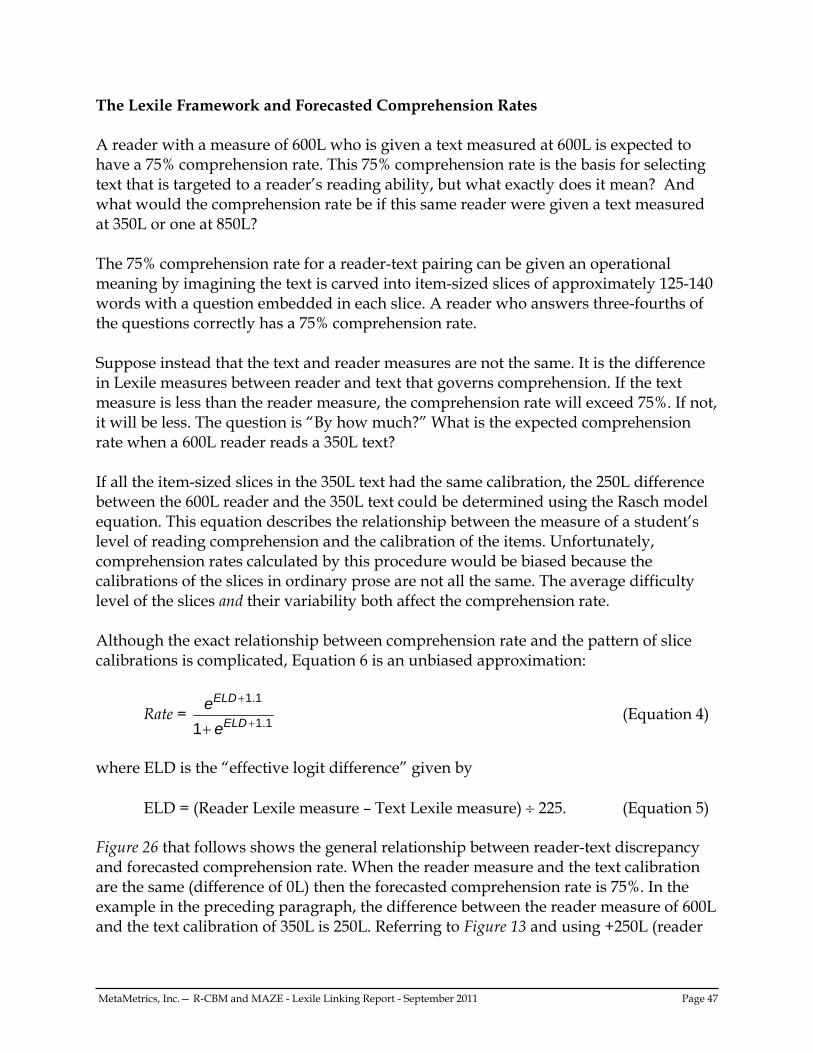
The following box and whisker plots (Figures 20 through 25) show the progression of scores (the y-axis) from grade to grade (the x-axis). For each grade, the box refers to the interquartile range. The line within the box indicates the median and the + represents the mean. The end of each whisker represents the minimum and maximum values of the y-axis Lexile Linking Test measures and the R-CBM and MAZE Lexile measures for each grade. Looking at Figures 20 through 22 across grades for R-CBM, the Lexile measures progress as the grades increase. However, grade 6 shows a higher Lexile measure relative to grade 7 for the sample in this study. Looking at Figures 23 through 25 for MAZE across grades, the Lexile Linking Test again showed a decrease at grade 7 relative to grade 6 for the sample in this study. The Lexile measures for MAZE show a monotonically increasing progression from grade to grade.
MetaMetrics, Inc.— R-CBM and MAZE - Lexile Linking Report - September 2011 Page 44
Figure 20. Box and whisker plot of the Lexile Linking Test Lexile measures by grade, final sample (N = 5,444).
Figure 21. Box and whisker plot of the R-CBM Lexile measures by grade, final sample
(N = 5,444).
MetaMetrics, Inc.— R-CBM and MAZE - Lexile Linking Report - September 2011 Page 45
Figure 22. Box and whisker plot of the R-CBM Lexile measures by grade, Spring 2011 population (N = 9,694).
Figure 23. Box and whisker plot of the Lexile Linking Test Lexile measures by grade,
final sample (N = 5,316).
MetaMetrics, Inc.— R-CBM and MAZE - Lexile Linking Report - September 2011 Page 46
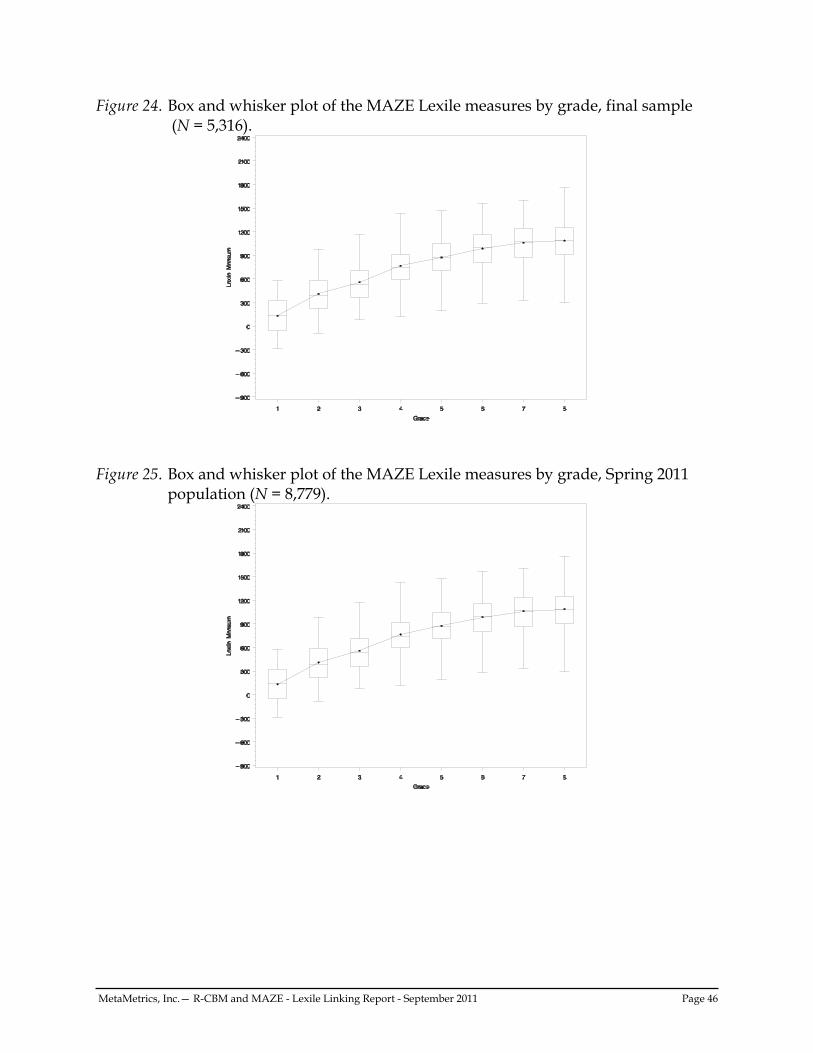
Figure 24. Box and whisker plot of the MAZE Lexile measures by grade, final sample (N = 5,316).
Figure 25. Box and whisker plot of the MAZE Lexile measures by grade, Spring 2011
population (N = 8,779).
MetaMetrics, Inc.— R-CBM and MAZE - Lexile Linking Report - September 2011 Page 47
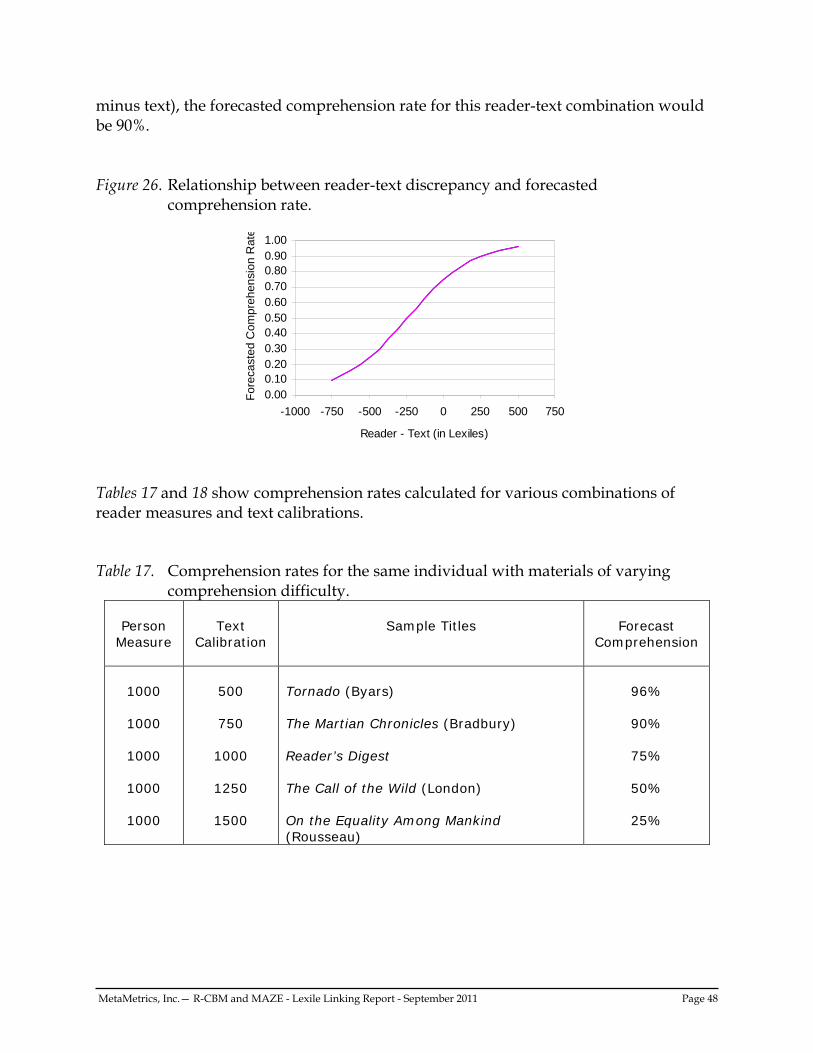
The Lexile Framework and Forecasted Comprehension Rates A reader with a measure of 600L who is given a text measured at 600L is expected to have a 75% comprehension rate. This 75% comprehension rate is the basis for selecting text that is targeted to a reader’s reading ability, but what exactly does it mean? And what would the comprehension rate be if this same reader were given a text measured at 350L or one at 850L? The 75% comprehension rate for a reader-text pairing can be given an operational meaning by imagining the text is carved into item-sized slices of approximately 125-140 words with a question embedded in each slice. A reader who answers three-fourths of the questions correctly has a 75% comprehension rate. Suppose instead that the text and reader measures are not the same. It is the difference in Lexile measures between reader and text that governs comprehension. If the text measure is less than the reader measure, the comprehension rate will exceed 75%. If not, it will be less. The question is “By how much?” What is the expected comprehension rate when a 600L reader reads a 350L text? If all the item-sized slices in the 350L text had the same calibration, the 250L difference between the 600L reader and the 350L text could be determined using the Rasch model equation. This equation describes the relationship between the measure of a student’s level of reading comprehension and the calibration of the items. Unfortunately, comprehension rates calculated by this procedure would be biased because the calibrations of the slices in ordinary prose are not all the same. The average difficulty level of the slices and their variability both affect the comprehension rate. Although the exact relationship between comprehension rate and the pattern of slice calibrations is complicated, Equation 6 is an unbiased approximation:
Rate =
1.1
1.11
ELD
ELD
e
e (Equation 4)
where ELD is the “effective logit difference” given by ELD = (Reader Lexile measure – Text Lexile measure) 225. (Equation 5) Figure 26 that follows shows the general relationship between reader-text discrepancy and forecasted comprehension rate. When the reader measure and the text calibration are the same (difference of 0L) then the forecasted comprehension rate is 75%. In the example in the preceding paragraph, the difference between the reader measure of 600L and the text calibration of 350L is 250L. Referring to Figure 13 and using +250L (reader
MetaMetrics, Inc.— R-CBM and MAZE - Lexile Linking Report - September 2011 Page 48
minus text), the forecasted comprehension rate for this reader-text combination would be 90%. Figure 26. Relationship between reader-text discrepancy and forecasted
comprehension rate.
Tables 17 and 18 show comprehension rates calculated for various combinations of reader measures and text calibrations. Table 17. Comprehension rates for the same individual with materials of varying
comprehension difficulty.
Person Measure
Text
Calibration
Sample Titles
Forecast
Comprehension
1000
1000
1000
1000
1000
500
750
1000
1250
1500
Tornado (Byars) The Martian Chronicles (Bradbury) Reader’s Digest The Call of the Wild (London) On the Equality Among Mankind (Rousseau)
96%
90%
75%
50%
25%
0.000.100.200.300.400.500.600.700.800.901.00
-1000 -750 -500 -250 0 250 500 750
Reader - Text (in Lexiles)
For
ecas
ted
Com
preh
ensi
on R
ate
MetaMetrics, Inc.— R-CBM and MAZE - Lexile Linking Report - September 2011 Page 49
Table 18. Comprehension rates of different person abilities with the same material.
Person Measure
Calibration for a Grade 10
Biology Textbook
Forecast
Comprehension Rate
500
750
1000
1250
1500
1000
1000
1000
1000
1000
25%
50%
75%
90%
96%
The subjective experience of 50%, 75%, and 90% comprehension as reported by readers varies greatly. A 1000L reader reading 1000L text (75% comprehension) reports confidence and competence. Teachers listening to such a reader report that the reader can sustain the meaning thread of the text and can read with motivation and appropriate emotion and emphasis. In short, such readers appear to comprehend what they are reading. A 1000L reader reading 1250L text (50% comprehension) encounters so much unfamiliar vocabulary and difficult syntactic structures that the meaning thread is frequently lost. Such readers report frustration and seldom choose to read independently at this level of comprehension. Finally, a 1000L reader reading 750L text (90% comprehension) reports total control of the text, reads with speed, and experiences automaticity during the reading process. The primary utility of the Lexile Framework is its ability to forecast what happens when readers confront text. With every application by teacher, student, librarian, or parent there is a test of the Framework’s accuracy. The Framework makes a point prediction every time a text is chosen for a reader. Anecdotal evidence suggests that the Lexile Framework predicts as intended. That is not to say that there is an absence of error in forecasted comprehension. There is error in text measures, reader measures, and their difference modeled as forecasted comprehension. However, the error is sufficiently small that the judgments about readers, texts, and comprehension rates are useful. Relationship between Linking Error and Forecasted Comprehension Rate. Using Equation 4 with different combinations of reader measure and text complexity, the effect of linking error on forecasted comprehension rate can be examined. Table 19 shows the changes in the forecasted comprehension rate for different combinations of reader and text interactions. When the linking error is small, 5–10L, then the effect on forecasted comprehension rate is a minimal difference (1 to 2%) increase or decrease in comprehension.
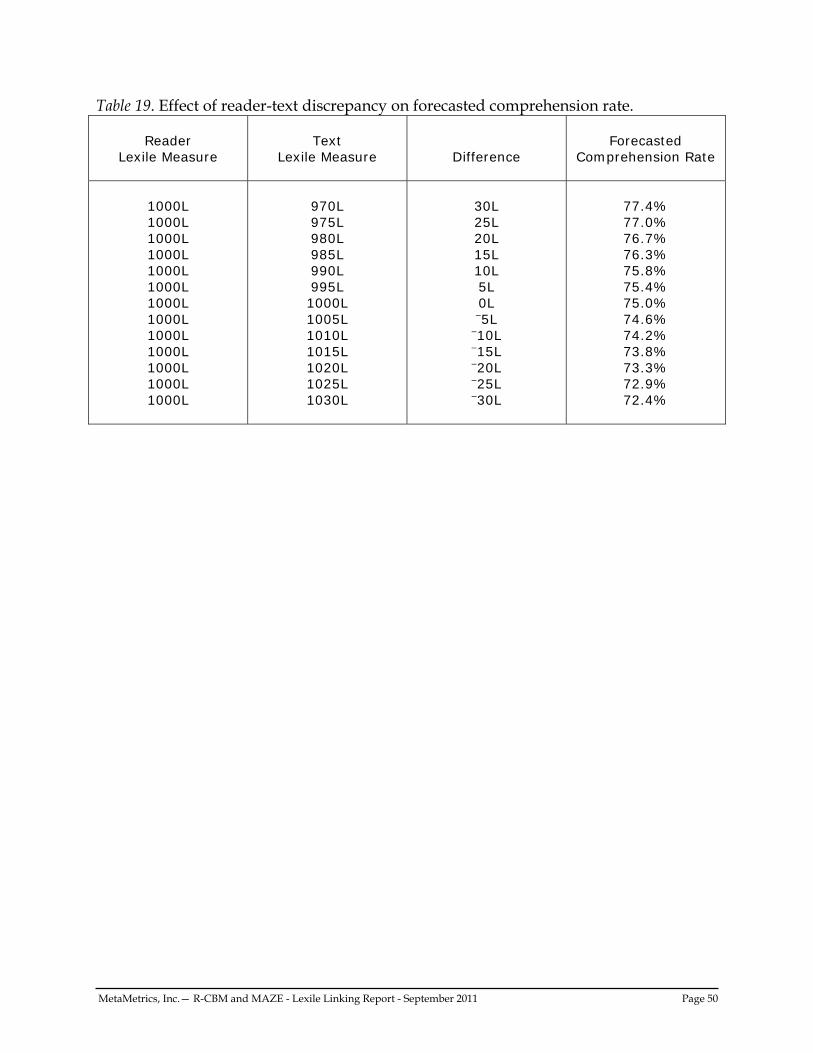
MetaMetrics, Inc.— R-CBM and MAZE - Lexile Linking Report - September 2011 Page 50
Table 19. Effect of reader-text discrepancy on forecasted comprehension rate.
MetaMetrics, Inc.— R-CBM and MAZE - Lexile Linking Report - September 2011 Page 51
Conclusions, Caveats, and Recommendations Forging a link between scales is a way to add value to one scale without having to administer an additional test. Value can be in the form of any or all of the following:
• increased interpretability (e.g., “Based on this test score, what can my child actually read?”),
• increased diagnostic capability (e.g., “Based on this test score, what are the student’s weaknesses?”), or
• increased instructional use (e.g., “Based on these test scores, I need to modify my instruction to include these skills.”).
The link that has been established between the R-CBM and MAZE raw scores and Lexile measures permits readers to be targeted with books and texts that provide an appropriate level of challenge while avoiding frustration. The result of this purposeful “match” may be that students will read more, and, thereby read better. The real power of the Lexile Framework is in examining the growth of readers—wherever the reader may be in the development of his or her reading skills. Readers can be targeted with texts that they are forecasted to read with 75% comprehension. As a reader grows, he or she can be targeted with more demanding texts. And, as the texts become more demanding, then the reader grows. The development of the link between the R-CBM and MAZE raw scores and the Lexile measure has been described and evaluated in this study. There are many factors that can affect the linking process. In this study a few of these factors include:
• sample characteristics (e.g., ethnicity), and • relationship of sample distribution characteristics to the distribution
characteristics of the Spring 2011 population. Recommendations about reporting Lexile measures for readers. Lexile measures are reported as a number followed by a capital “L” for “Lexile.” All Lexile measures should be rounded to the nearest 5L to avoid over interpretation of the measures. As with any test score, uncertainty in the form of measurement error is present. Lexile measures that are reported for an individual student should reflect the purpose for which they will be used. If the purpose is research (e.g., to measure growth at the student, grade, school, district, or state level), then actual measures should be used at all score points, rounded to the nearest integer. A computed Lexile measure of 772.51 would be reflected as 773L. If the purpose is instructional, then the Lexile measures should be capped at the upper bound of measurement error (e.g., at the 95th percentile) to ensure developmental appropriateness of the material. MetaMetrics expresses these as “Reported Lexile Measures” and recommends that these measures be reflected on
MetaMetrics, Inc.— R-CBM and MAZE - Lexile Linking Report - September 2011 Page 52
individual score reports. In instructional environments where the purpose of the Lexile measure is to appropriately match readers with books, all scores at or below 0L should be reported as “BR” (Beginning Reader); no student should receive a negative Lexile measure. Some assessments report a Lexile range for each student, which is 50L above and 100L below the student’s actual Lexile measure. This range represents the boundaries between the easiest kind of reading material for the student and the level at which the student will be more challenged, yet can still read successfully. Within the instructional area, suggested book lists can be developed for ranges of readers. Care must be taken to ensure that the books on the lists are also developmentally appropriate for the readers. The Lexile measure is one factor related to comprehension and is a good starting point in the selection process of a book for a specific reader. Other factors such as student developmental level, motivation, and interest; amount of background knowledge possessed by the reader; and characteristics of the text such as illustrations and formatting also need to be considered when matching a book with a reader. In this era of student-level accountability and high-stakes assessment, differentiated instruction—the attempt “on the part of classroom teachers to meet students where they are in the learning process and move them along as quickly and as far as possible in the context of a mixed-ability classroom” (Tomlinson, 1999)—is a means for all educators to help students succeed. Differentiated instruction promotes high-level and powerful curriculum for all students, but varies the level of teacher support, task complexity, pacing, and avenues to learning based on student readiness, interest, and learning profile. One strategy for managing a differentiated classroom suggested by Tomlinson is the use of multiple texts and supplementary materials. These texts and materials can be targeted for specific students or groups of students based on their reading ability as described by their Lexile measure. The Lexile Framework is an objective tool that can be used to determine a student’s readiness for a reading experience; the Lexile Framework “targets” text (books, newspapers, periodicals) for readers at a 75% comprehension level—a level that is challenging, but not frustrating (Schnick and Knickelbine, 2000). Within the communication area, Lexile measures can be used to communicate with students, parents, teachers, educators, and the community by providing a common language to use to talk about reading growth and development. By aligning all areas of the educational system, parents can be included in the instructional process. With a variety of data related to a student’s reading level, a more complete picture can be
MetaMetrics, Inc.— R-CBM and MAZE - Lexile Linking Report - September 2011 Page 53
formed and more informed decisions can be made concerning reading-group placement, amount of extra instruction needed, and promotion/retention decisions. It is much easier to understand what a national percentile rank of 50 means when it is tied to the reading demands of book titles that are familiar to adults. Parents are encouraged to help their children achieve high standards by expecting their children to succeed at school, communicating with their children’s teachers and the school, and helping their children keep pace and do homework. Through the customized reading lists and electronic database of titles, parents can assist their children in the selection of reading materials that are at the appropriate level of challenge and monitor the reading process at home. A link can be provided to the “Find a Book with Lexiles” website. This site provides a quick, free resource to battle “summer slide” – the learning losses that students often experience during the summer months when they are not in school (Smith and Brewer, 2008). Lexiles make it easy to help students read and learn all summer long and during the school year. This website can help build a reading list of books at a young person’s reading level that are about subjects that interest him or her. This website can be viewed at http:/www.lexile.com/fab/.
MetaMetrics, Inc.— R-CBM and MAZE - Lexile Linking Report - September 2011 Page 54
References American Educational Research Association, American Psychological Association, &
National Council on Measurement in Education. (1999). Standards for educational and psychological testing. Washington, DC: American Educational Research Association.
Bormuth, J.R. (1966). Readability: New approach. Reading Research Quarterly, 7, 79-132. Carroll, J.B., Davies, P., & Richman, B. (1971). Word frequency book. Boston: Houghton
Mifflin. Carver, R.P. (1974). Measuring the primary effect of reading: Reading storage technique,
understanding judgments and cloze. Journal of Reading Behavior, 6, 249-274. Chall, J.S. (1988). “The beginning years.” In B.L. Zakaluk and S.J. Samuels (Eds.),
Readability: Its past, present, and future. Newark, DE: International Reading Association.
Crain, S. & Shankweiler, D. (1988). “Syntactic complexity and reading acquisition.” In
A. Davidson and G.M. Green (Eds.), Linguistic complexity and text comprehension: Readability issues reconsidered. Hillsdale, NJ: Erlbaum Associates.
Davidson, A. & Kantor, R.N. (1982). On the failure of readability formulas to define
readable text: A case study from adaptations. Reading Research Quarterly, 17, 187- 209.
Dunn, L.M. & Dunn, L.M. (1981). Manual for Forms L and M of the Peabody Picture
Vocabulary Test—Revised. Circle Pines, MN: American Guidance Service. Dunn, L.M. & Markwardt, F.C. (1970). Peabody Individual Achievement Test. Circle Pines,
MN: American Guidance Service. Efron, B. (1981). Nonparametric estimates of the standard error: The Jackknife, the
Bootstrap, and other resampling techniques. Biometrika. 68, 589-599. Grolier, Inc. (1986). The electronic encyclopedia. Danbury, CT: Author. Howe, K.B. & Shinn, M.M. (2002, August). Standard reading assessment passages (RAPs)
for use in general outcome measurement: A manual describing development and technical features. Eden Prairie, MN: edformation.
Klare, G.R. (1963). The measurement of readability. Ames, IA: Iowa State University Press.
MetaMetrics, Inc.— R-CBM and MAZE - Lexile Linking Report - September 2011 Page 55
Kolen, M.J. & Brennan, R.L. (2004). Test equating, scaling, and linking: Methods and
practices. (2nd ed.) New York: Springer Science + Business Media, LLC. Liberman, I.Y., Mann, V.A., Shankweiler, D., & Westelman, M. (1982). Children’s
memory for recurring linguistic and non-linguistic material in relation to reading ability. Cortex, 18, 367-375.
Linacre, J.M. (2010). WINSTEPS (Version 3.70) [Computer Program]. Chicago: Author. McGraw-Hill Book Company. (1983). Guidelines for bias-free publishing. Monterey, CA:
Author. Miller, G.A. & Gildea, P.M. (1987). How children learn words. Scientific American, 257,
94-99. National Research Council. (1999). Uncommon measures: Equivalence and linkage among
educational tests. Washington, D.C.: National Academy Press. Petersen, N.S., Kolen, M.J., & Hoover, H.D. (1989). “Scaling, Norming, and Equating.”
In R.L. Linn (Ed.), Educational Measurement (3rd ed.) (pp. 221-262). New York: American Council on Education and Macmillan Publishing Company.
Poznanski, J.B. (1990). A meta-analytic approach to the estimation of item difficulties.
Unpublished doctoral dissertation, Duke University, Durham, NC. Schnick, T. & Knickelbine, M. (2000). The Lexile Framework: An introduction for educators.
Durham, NC: MetaMetrics, Inc. Shankweiler, D. & Crain, S. (1986). Language mechanisms and reading disorder: A
modular approach. Cognition, 14, 139-168. Shinn, M.M. & Shinn, M.R. (2002). Administration and scoring of Reading Curriculum-Based
Measurement (R-CBM) for use in general outcome measurement. NCS Pearson, Inc. Shinn, M.R. & Shinn, M.M. (2002). Administration and scoring of Reading Maze for use in
general outcome measurement. NCS Pearson, Inc. Sitter, R.R. (1992). Comparing three bootstrap methods for survey data. The Canadian
Journal of Statistics, 20(2), 135-154. Smith, M. & Brewer, D. (2008). Stop summer academic loss. A White Paper from
MetaMetrics. Durham, NC: MetaMetrics, Inc.
MetaMetrics, Inc.— R-CBM and MAZE - Lexile Linking Report - September 2011 Page 56
Stenner, A.J. (1990). Objectivity: Specific and general. Rasch Measurement Transactions, 4,
111. Stenner, A.J., Smith, M., & Burdick, D.S. (1983). Toward a theory of construct definition.
Journal of Educational Measurement, 20(4), 305-315. Stenner, A.J., Smith, D.R., Horabin, I., & Smith, M. (1987a). Fit of the Lexile Theory to
item difficulties on fourteen standardized reading comprehension tests. Durham, NC: MetaMetrics, Inc.
Stenner, A.J., Smith, D.R., Horabin, I., & Smith, M. (1987b). Fit of the Lexile Theory to
sequenced units from eleven basal series. Durham, NC: MetaMetrics, Inc. Tomlinson, C.A. (1999). The differentiated classroom. Alexandria, VA: Association for
Supervision and Curriculum Development. Wright, B.D. & Linacre, J.M. (1994, August). The Rasch model as a foundation for the Lexile
Framework. Unpublished manuscript. Wright, B.D. & Stone, M.H. (1979). Best Test Design. Chicago: MESA Press.
Appendix A
Conversion Table for the R-CBM Raw Score to the Lexile Measure-Grade 1 ........................... A-2
Conversion Table for the R-CBM Raw Score to the Lexile Measure-Grade 2 ........................... A-4
Conversion Table for the R-CBM Raw Score to the Lexile Measure-Grade 3 ........................... A-6
Conversion Table for the R-CBM Raw Score to the Lexile Measure-Grade 4 ........................... A-8
Conversion Table for the R-CBM Raw Score to the Lexile Measure-Grade 5 ......................... A-10
Conversion Table for the R-CBM Raw Score to the Lexile Measure-Grade 6 ......................... A-12
Conversion Table for the R-CBM Raw Score to the Lexile Measure-Grade 7 ......................... A-14
Conversion Table for the R-CBM Raw Score to the Lexile Measure-Grade 8 ......................... A-14
MetaMetrics, Inc.— R-CBM and MAZE - Lexile Linking Report – September 2011 Page A-2
Conversion Table for the R-CBM Raw Score to the Lexile Measure-Grade 1 R-CBM Raw