27
Strategies LLC Taxonomy June 4, 2009 Copyright 2006 Taxonomy Strategies LLC. All rights reserved. Taxonomy Validation Joseph A Busch, Founder & Principal

Strategies LLCTaxonomy
June 4, 2009 Copyright 2006 Taxonomy Strategies LLC. All rights reserved.
Taxonomy ValidationJoseph A Busch, Founder & Principal

2Taxonomy Strategies LLC The business of organized information
Agenda
v What is a taxonomy and why is it important
v Taxonomy testingClosed card sorting
Finding content
Tagging content
v Collection analysis

3Taxonomy Strategies LLC The business of organized information
Why build and apply a Taxonomy? Taxonomy enables usability and re‐usability
v The presentation of relevant related content provides users with a “scent” or context.
v Googlers are oriented—even when they land on a page fifteen layers deep.
v Tagging content enables content re‐use and dynamic web publishing.
v Tagged content exponentially increases the ability to aggregate related content, making it easier to present users with relevantcontent.
v Readily offering content‐related web services—RSS feeds, bookmarking, user tagging—provide a more rewarding experience.

4Taxonomy Strategies LLC The business of organized information
What is a Taxonomy?
v A categorization framework agreed upon by business and content owners (with the help of subject matter experts) that will be used to tag content.
6 broad, discrete divisions (called facets)
2‐3 levels deep.
Up to 15 terms at each level.
1200 terms total.
With some logic—hierarchical, equivalent and associative relationships between terms.

5Taxonomy Strategies LLC The business of organized information
Effectiveness of taxonomies
Main Ingredients
Cooking MethodsMeal Type Cuisines
• Chocolate• Dairy• Fruits• Grains• Meat &
Seafood• Nuts• Olives• Pasta• Spices &
Seasonings• Vegetables
• Breakfast• Brunch• Lunch• Supper• Dinner• Snack
• African• American• Asian• Caribbean• Continental• Eclectic/
Fusion/ International
• Jewish• Latin American• Mediterranean• Middle Eastern• Vegetarian
• Advanced• Bake• Broil• Fry• Grill• Marinade• Microwave• No Cooking• Poach• Quick• Roast• Sauté• Slow
Cooking• Steam• Stir-fry
v Categorize in multiple, independent, categories.
v Allow combinations of categories to narrow the choice of items.
v 4 independent categories of 10 nodes each have the same discriminatory power as one hierarchy of 10,000 nodes (104)
Easier to maintain.
Easier to reuse existing material.
Can be easier to navigate, if software supports it.
42 values to maintain (10+6+11+15)
9900 combinations (10x6x11x15)

6Taxonomy Strategies LLC The business of organized information
What uses must a Taxonomy support?
v Primary categorizationNavigation
Content Management
v Secondary categorizationSearch
Tagging
“ When we talk about a taxonomy, we are not only talking about a website navigation scheme. Websites change frequently, we are looking at a more durable way to deal with content so that different navigation schemes can be used over time.”
– R. Daniel “Taxonomy FAQs”
7Taxonomy Strategies LLC The business of organized information
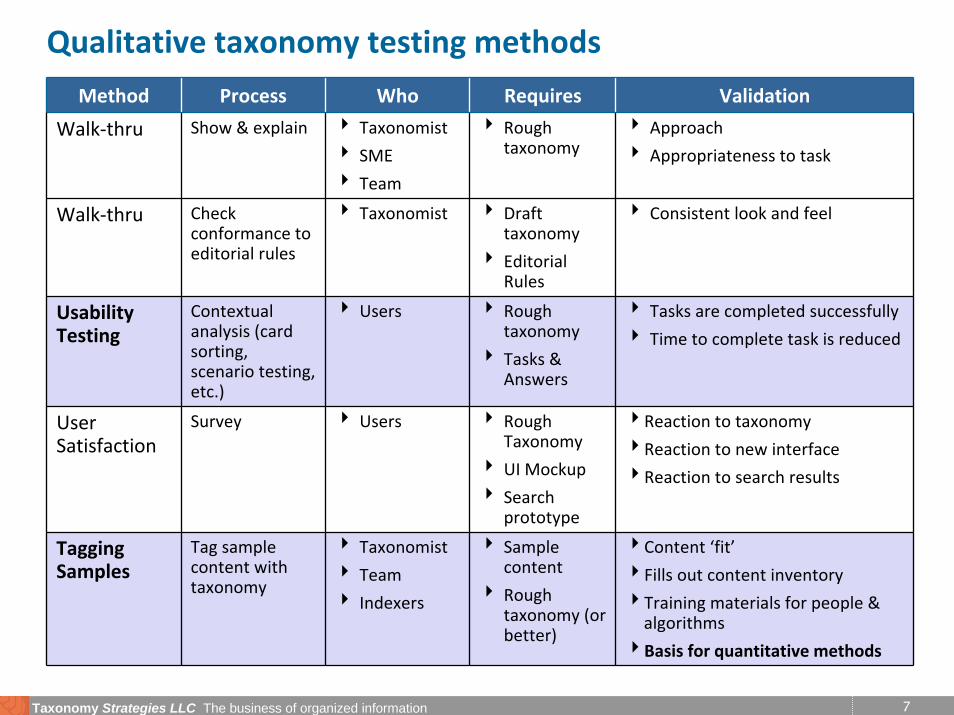
Qualitative taxonomy testing methods
Method Process Who Requires Validation
Walk‐thru Show & explain 4 Taxonomist
4 SME
4 Team
4 Rough taxonomy
4 Approach
4 Appropriateness to task
Walk‐thru Check conformance to editorial rules
4 Taxonomist 4 Draft taxonomy
4 Editorial Rules
4 Consistent look and feel
Usability Testing
Contextual analysis (card sorting, scenario testing, etc.)
4 Users 4 Rough taxonomy
4 Tasks & Answers
4 Tasks are completed successfully
4 Time to complete task is reduced
User Satisfaction
Survey 4 Users 4 Rough Taxonomy
4 UI Mockup
4 Search prototype
4Reaction to taxonomy
4Reaction to new interface
4Reaction to search results
Tagging Samples
Tag sample content with taxonomy
4 Taxonomist
4 Team
4 Indexers
4 Sample content
4 Rough taxonomy (or better)
4Content ‘fit’
4Fills out content inventory
4Training materials for people & algorithms
4Basis for quantitative methods
8Taxonomy Strategies LLC The business of organized information
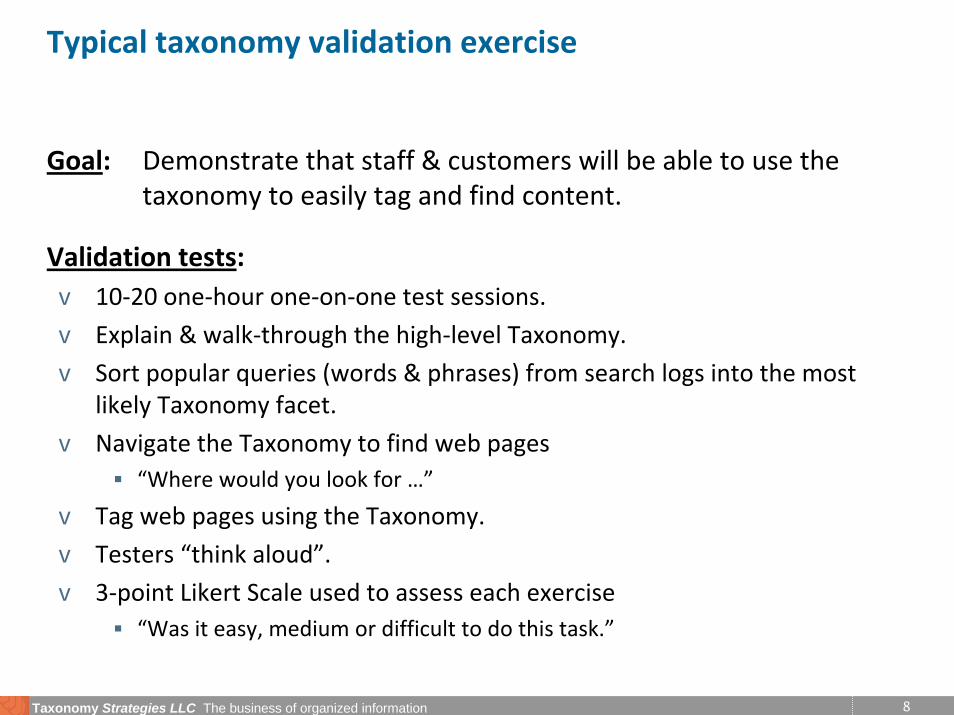
Typical taxonomy validation exercise
Goal: Demonstrate that staff & customers will be able to use the taxonomy to easily tag and find content.
Validation tests:v 10‐20 one‐hour one‐on‐one test sessions.
v Explain & walk‐through the high‐level Taxonomy.
v Sort popular queries (words & phrases) from search logs into the most likely Taxonomy facet.
v Navigate the Taxonomy to find web pages“Where would you look for …”
v Tag web pages using the Taxonomy.
v Testers “think aloud”.
v 3‐point Likert Scale used to assess each exercise“Was it easy, medium or difficult to do this task.”

9Taxonomy Strategies LLC The business of organized information
Term sorting data collection form

10Taxonomy Strategies LLC The business of organized information
Summary of term sorting resultsFrequently chosen related category Frequently chosen incorrect categoryCorrect category

11Taxonomy Strategies LLC The business of organized information
Percentage of popular search terms sorted correctly

12Taxonomy Strategies LLC The business of organized information
Blind sorting of popular search terms (n=12)
Results: Excellent
84% of terms were correctly sorted 60‐100% of the time.
Difficultiesv For Methadone, confusion when, in this case, a substance is a treatment.
v For general terms such as Smoking, Substance Abuse and Suicide, confusion about whether these are Conditions or Research topics.

13Taxonomy Strategies LLC The business of organized information
Search terms sorting task user rating (n=12)
14Taxonomy Strategies LLC The business of organized information
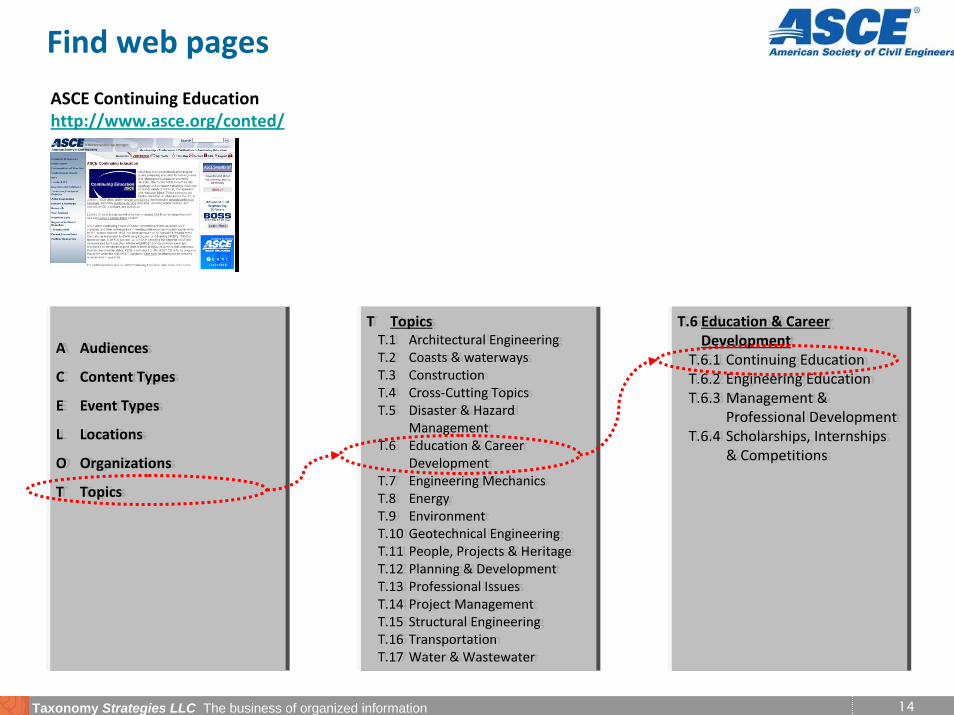
Find web pages
ASCE Continuing Education http://www.asce.org/conted/
A Audiences
C Content Types
E Event Types
L Locations
O Organizations
T Topics
A Audiences
C Content Types
E Event Types
L Locations
O Organizations
T Topics
T TopicsT.1 Architectural EngineeringT.2 Coasts & waterwaysT.3 ConstructionT.4 Cross‐Cutting TopicsT.5 Disaster & Hazard
ManagementT.6 Education & Career
DevelopmentT.7 Engineering MechanicsT.8 EnergyT.9 EnvironmentT.10 Geotechnical EngineeringT.11 People, Projects & HeritageT.12 Planning & DevelopmentT.13 Professional IssuesT.14 Project ManagementT.15 Structural EngineeringT.16 TransportationT.17 Water & Wastewater
T.6 Education & Career Development
T.6.1 Continuing EducationT.6.2 Engineering EducationT.6.3 Management &
Professional DevelopmentT.6.4 Scholarships, Internships
& Competitions
T.6 Education & Career Development
T.6.1 Continuing EducationT.6.2 Engineering EducationT.6.3 Management &
Professional DevelopmentT.6.4 Scholarships, Internships
& Competitions

15Taxonomy Strategies LLC The business of organized information
Summary of navigation results trial
Correct category Frequently chosen related category Frequently chosen incorrect category
Gave up
16Taxonomy Strategies LLC The business of organized information
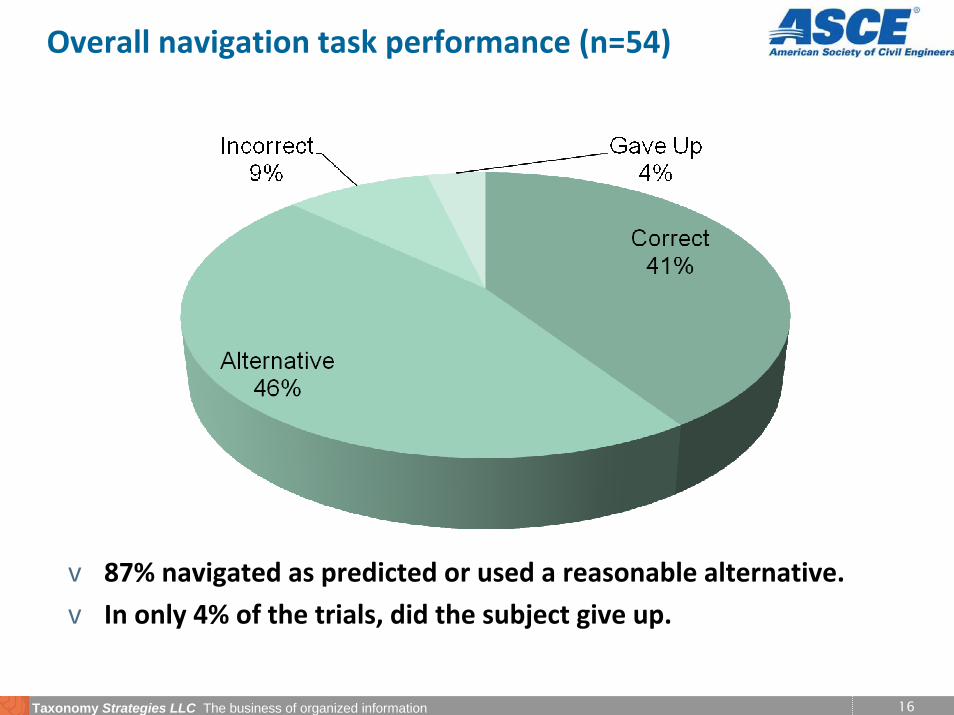
Overall navigation task performance (n=54)
v 87% navigated as predicted or used a reasonable alternative.
v In only 4% of the trials, did the subject give up.

17Taxonomy Strategies LLC The business of organized information
Overall user rating of navigation task (n=9)
No one rated the overall task Difficult!

18Taxonomy Strategies LLC The business of organized information
Tagging template filled in
American Indian/Alaska Native Substance Abuse Treatment Services: 2004http://oas.samhsa.gov/2k5/tribalTX/tribalTX.pdf
Content Type Series Report
Audience Prevention Program Planners
Subjects
Population Groups American Indian & Alaska Native
Substances
Conditions & Disorders Substance AbuseIntervention & Treatment TopicsProfessional & Research Topics
Geographic & Locations
Add any additional keywords that you think would be helpful in finding this item (that are not in the title or taxonomy):
_JB_ Initials Was it easy / medium / difficult to tag this item? (circle one)
19Taxonomy Strategies LLC The business of organized information
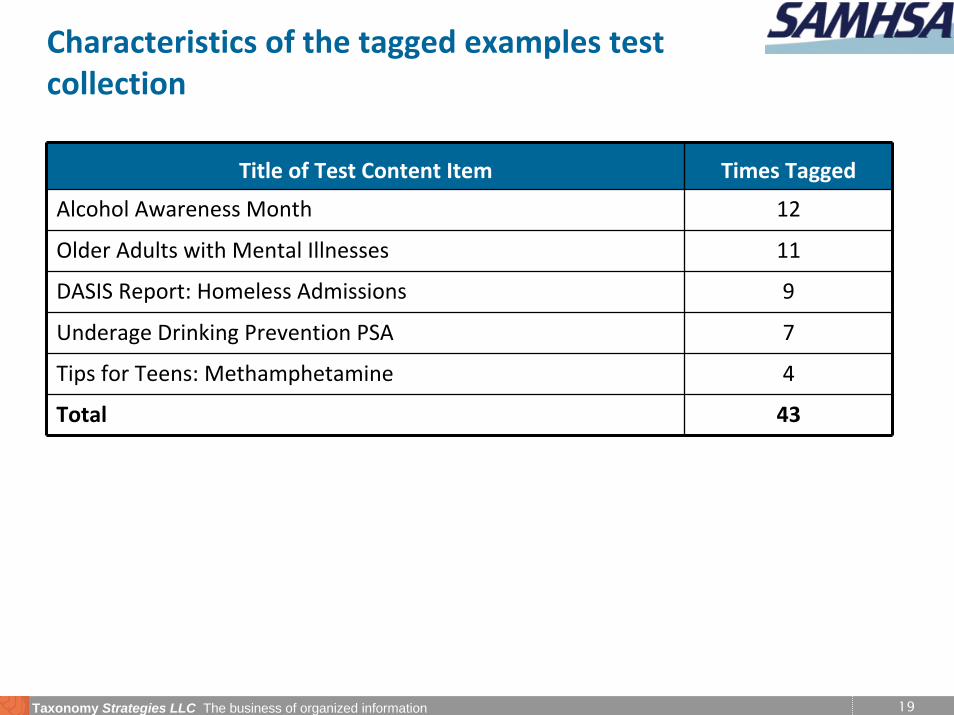
Characteristics of the tagged examples test collection
Title of Test Content Item Times Tagged
Alcohol Awareness Month 12
Older Adults with Mental Illnesses 11
DASIS Report: Homeless Admissions 9
Underage Drinking Prevention PSA 7
Tips for Teens: Methamphetamine 4
Total 43

20Taxonomy Strategies LLC The business of organized information
Content tagging consensus (n=244)
Test subjects tagged content consistent with the baseline 41% of the time.
Results: Good
Observationsv Many other tags were reasonable alternatives.v Correct + Alternative tags accounted for 83% of tags.v Over tagging is a minor problem.

21Taxonomy Strategies LLC The business of organized information
Tagging exercise test subject rating (n=43)
Only 7% rated the task difficult!

22Taxonomy Strategies LLC The business of organized information
Tagging samples—How many items?
GoalNumber of
Items CriteriaIllustrate metadata schema 1-3 Random (excluding junk)
Develop training documentation
10-20 Show typical & unusual cases
Qualitative test of small vocabulary (<100 categories)
25-50 Random (excluding junk)
Quantitative test of vocabularies *
3-10X number of categories
Use computer-assisted methods when more than 10-20 categories. Pre-existing metadata is the most meaningful.
* Quantitative methods require large amounts of tagged content. This requires specialists, or software, to do tagging. Results may be very different from how “real” users would categorize content.

23Taxonomy Strategies LLC The business of organized information
How evenly does it divide the content?
v Documents do not distribute uniformly across categories
v Zipf (1/x) distribution is expected behavior
v 80/20 rule in action (actually 70/20 rule)
Leading candidate for splitting
Leading candidates for merging

24Taxonomy Strategies LLC The business of organized information
How evenly does it divide the content?
v Methodology: 115 randomly selected URLs from corporate intranet search index were manually categorized. Inaccessible files and ‘junk’ were removed.
v Results: Slightly more uniform than Zipf distribution. Above the curve isbetter than expected.

25Taxonomy Strategies LLC The business of organized information
How does taxonomy “shape” match that of content?
Term Group%
Terms%
Docs
Administrators 7.8 15.8
Community Groups 2.8 1.8
Counselors 3.4 1.4
Federal Funds Recipients and Applicants
9.5 34.4
Librarians 2.8 1.1
News Media 0.6 3.1
Other 7.3 2.0
Parents and Families 2.8 6.0
Policymakers 4.5 11.5
Researchers 2.2 3.6
School Support Staff 2.2 0.2
Student Financial Aid Providers 1.7 0.7
Students 27.4 7.0
Teachers 25.1 11.4
Background:v Hierarchical taxonomies allow
comparison of “fit” between content and taxonomy areas.
Methodology:v 25,380 resources tagged with
taxonomy of 179 terms. (Avg. of 2 terms per resource)
v Counts of terms and documents summed within taxonomy hierarchy.
Results:v Roughly Zipf distributed (top 20 terms:
79%; top 30 terms: 87%)v Mismatches between term% and
document% are flagged in red.
Source: Courtesy Keith Stubbs, US. Dept. of Ed.

Strategies LLCTaxonomy
June 4, 2009 Copyright 2006 Taxonomy Strategies LLC. All rights reserved.
Questions
Joseph A. [email protected]
http://ww.taxonomystrategies.com
27Taxonomy Strategies LLC The business of organized information
Taxonomy Validation
v Taxonomy is the key to being able to supply the appropriate content in dynamic user interfaces, and supporting information services such as personalization (e.g., portals), syndication (e.g., RSS feeds), and harvesting (e.g., search). Taxonomy development and validation is on the application development critical path. Effective methods to provide confidence that the taxonomy is good enough to develop against is very important.
v The goal of taxonomy testing is to confirm that a taxonomy will work for tagging content, publishing content and finding and using content in user‐facing applications. This session describes taxonomy validation methods, metrics for successful task completion and consensus, best practices around evaluating those results, and presents case studies that go beyond typical card sorting. These methods include:
Working with most popular queries,
Tagging consistency, and
Task‐based usability testing.


