VOLUME III: CHAPTER 12 MARINE VESSEL LOADING, BALLASTING, AND TRANSIT Revised Final January 2001 Prepared by: Eastern Research Group, Inc. Prepared for: Area Sources Committee Emission Inventory Improvement Program
Transcript
VOLUME III: CHAPTER 12
MARINE VESSEL LOADING,BALLASTING , AND TRANSIT
Revised Final
January 2001
Prepared by:Eastern Research Group, Inc.
Prepared for:Area Sources CommitteeEmission Inventory Improvement Program
DISCLAIMER
As the Environmental Protection Agency has indicated in Emission Inventory ImprovementProgram (EIIP) documents, the choice of methods to be used to estimate emissions depends onhow the estimates will be used and the degree of accuracy required. Methods using site-specificdata are preferred over other methods. These documents are non-binding guidance and not rules. EPA, the States, and others retain the discretion to employ or to require other approaches thatmeet the requirements of the applicable statutory or regulatory requirements in individualcircumstances.
iiiEIIP Volume III
ACKNOWLEDGEMENT
This document was prepared for the Area Sources Committee of the Emission InventoryImprovement Program and for Charles Mann of the Air Pollution Prevention and ControlDivision, U.S. Environmental Protection Agency. Members of the Area Sources Committeecontributing to the preparation of this document are:
Kristin Abraham, West Virginia Department of Environmental ProtectionKwame Agyei, Puget Sound Air Pollution Control AgencyRay Bishop, Oklahoma Department of Environmental QualityDan Brisko, New York State Department of Environmental ConservationOrlando Cabrera-Rivera, Wisconsin Department of Natural ResourcesAndy Delao, California Air Resources BoardLaurel Driver, Emission Factor and Inventory Group, U.S. Environmental Protection AgencyMark Eastburn, Delaware Department of Natural ResourcesCharles Mann, Air Pollution Prevention and Control Division, U.S. Environmental Protection AgencySally Otterson, Washington Department of EcologyKenneth Santlal, Massachusetts Department of Environmental ProtectionWalter Simms, Maryland Department of the EnvironmentJack Sipple, Delaware Department of Natural Resources and Environmental ControlKarla Smith-Hardison, Texas Natural Resources Conservation CommissionAngel Thompson, South Carolina Department of Health and Environmental ControlLee Tooly, Emission Factor and Inventory Group, U.S. Environmental Protection Agency
Other reviewers contributing to this document are:
Allen Ellett, BP Oil CompanyRob Ferry, TGB PartnershipTahir Khan, Chemical Emission Management Services
CHAPTER 12 - MARINE VESSEL LOADING, BALLASTING, AND TRANSIT 1/31/01
CHAPTER 12 - MARINE VESSEL LOADING, BALLASTING, AND TRANSIT 1/31/01
viii EIIP Volume III
This page is intentionally left blank.
12.1-1EIIP Volume III
1
INTRODUCTIONThis chapter is one of a series of documents developed to provide cost-effective, reliable andconsistent approaches to estimating emissions for area source inventories. Multiple methods areprovided in the chapters to accommodate needs of state agencies with different levels ofavailable resources and skills; and different levels of needs for accuracy and reliability of theirestimates. More information about the EIIP program can be found in Volume 1 of the EIIPseries, Introduction and Use of EIIP Guidance for Emissions Inventory Development.
This chapter describes the procedures and recommended approaches for estimating emissionsfrom marine vessel loading, ballasting, and transit. Section 2 of this chapter contains a generaldescription of marine vessel loading, ballasting, and transit and an overview of available controltechnologies. Section 3 provides an overview of available emission estimation methods. Section 4 presents the preferred method for estimating emissions from these processes, andSection 5 of this series of documents usually presents alternative emission estimation techniques. For this source category, no alternative methods are known to exist, and Section 5 presents abrief discussion of this issue. Quality assurance issues and emission estimate quality indicatorsfor the methods presented in this chapter are discussed in Section 6. Data coding procedures arediscussed in Section 7. Section 8 is the reference section.
Throughout this chapter and other EIIP area source methods chapters, we stress that area sourcecategories should be prioritized by the inventory planners so that resources can be spent on thesource categories that are the largest emitters, most likely to be subject to regulations or arealready subject to regulations, or require special effort because of some policy reason. Prioritization is particularly important for area source inventories, because in some cases, adifficult to characterize source category may contribute very little to overall emissions andattempting a high quality estimate for that source category may not be cost effective.
EIIP chapters are written for the state and local air pollution agencies, with their input andreview. EIIP is a response to EPA’s understanding that state and local agency personnel havemore knowledge about their inventory area’s activities, processes, emissions, and availability ofinformation; and require flexible inventory methods to best use their sometimes limitedresources. These EIIP area source chapters are written as a set of options presented to inventoryprofessionals capable of using their own experience and judgement to apply the method that bestfits their overall needs and constraints.
CHAPTER 12 - MARINE VESSEL LOADING, BALLASTING, AND TRANSIT 1/31/01
12.1-2 EIIP Volume III
This page is intentionally left blank.
12.2-1EIIP Volume III
2
SOURCE CATEGORY DESCRIPTION
2.1 CATEGORY DESCRIPTION
Petroleum liquids are transported via ships and barges, and on-land transportation. Theprocedures discussed below relate to evaporative VOC emissions from marine transport ofpetroleum liquids. This category does not include exhaust emissions from fuel consumed byvessels while in transit or in port. Additional information about petroleum vessels can be foundin AP-42 (EPA, 1995), AIRS Area and Mobile Source Category Codes (EPA, 1999), andMethodologies for Estimating Air Emissions from Three Non-Traditional Source Categories(EPA, 1993).
2.2 PROCESS DESCRIPTION AND EMISSION SOURCES
In general, “petroleum liquids” include both crude oil and any refined petroleum product. Refined petroleum products conveyed to fuel marketing terminals and petrochemical industriesvia ships and barges include gasoline, kerosene, distillate oil, residual oil, jet fuel, and otherpetroleum-derived chemicals such as naphtha, mineral spirits, and asphalt.
For the purposes of this document, petroleum liquids are classified into groups which arerepresented by crude oil, gasoline, jet naptha, distillate oil/kerosene, or residual oil. Evaporativeemissions from marine vessel operations result from three processes: loading, ballasting, andtransit. These processes are described in more detail below and in Methodologies for EstimatingAir Emissions from Three Non-Traditional Source Categories. Although there may be certainports where loading large marine tankers results in emissions greater than 100 tons per year (tpy)at a given facility, Volatile Organic Compound (VOC) emissions in most ports do not exceed100 tpy. Methods discussed in this chapter apply to area sources only. Emissions for pointsource facilities, such as petroleum refineries, should be calculated using more detailed methods. Petroleum vessel loading, ballasting and their associated emissions are typically concentrated inurban coastal areas and ports on inland waterways. Transit emissions are based on the amount oftime that the vessel is in an area.
CHAPTER 12 - MARINE VESSEL LOADING, BALLASTING, AND TRANSIT 1/31/01
12.2-2 EIIP Volume III
2.2.1 LOADING LOSSES (SHIPS/OCEAN VESSELS AND BARGES)
Loading losses occur as organic vapors in “empty” cargo tanks are displaced to the atmosphereby the liquid being loaded into the tanks. These vapors are a composite of vapors formed in threeways:
� Vapors which are formed in the “empty” tank by evaporation of residual productfrom previous loads;
� Vapors transferred to the tank from a vapor balance system that was used whenthe previous load was being unloaded; and
� Vapors generated in the tank as the new product is being loaded.
Loading losses are usually the largest source of evaporative emissions from petroleum vessels(EPA, 1996). This activity usually only occurs at refineries or at the terminal at the end of thepipeline where the product is loaded for distribution. However, petroleum liquids shipped in“super tankers” may be unloaded to barges or smaller ships in a harbor or bay to allow the largertanker to enter shallower ports. In this situation called “lightering operations”, vessel loadingemissions occur along with ship transit and ballasting emissions. Barges (compartment depth10 to 12 feet) exhibit higher emissions levels than ocean vessels which have greater compartmentdepth (approximately 40 feet).
2.2.2 BALLASTING LOSSES (SHIP/OCEAN VESSELS)
Ballasting losses are associated with the unloading of petroleum liquids at marine terminals andrefinery loading docks from vessels which do not have segregated ballast tanks. It is commonpractice to load several cargo tank compartments with sea water after the cargo has beenunloaded. This water, called “ballast,” improves the stability of the empty tanker during thesubsequent voyage. Ballasting emissions occur as vapor-laden air in the empty cargo tank isdisplaced to the atmosphere by ballast water being pumped into the tank. More often, the vesselbeing ballasted will be equipped with segregated ballasting tanks are ballasting will not result inemissions of VOC to the atmosphere. However, if the vessels being ballasted are not equippedwith segregated ballasting tanks, then ballasting may range between 15 to 40 percent of thevessels’ capacities (EPA, 1996).
2.2.3 TRANSIT LOSSES (SHIP/OCEAN VESSELS AND BARGES)
Transit losses are similar to breathing losses associated with petroleum storage. Transit loss isthe expulsion of vapor from a vessel compartment through vapor contraction and expansion,which are the result of changes in temperature and barometric pressure. This loss may be
1/31/01 CHAPTER 12 - MARINE VESSEL LOADING, BALLASTING, AND TRANSIT
12.2-3EIIP Volume III
accompanied by slight changes in the level of the liquid in the tank due to liquid expansion orcontraction due to the temperature change. Some ships are equipped with controls for theselosses.
2.3 FACTORS INFLUENCING EMISSIONS
VOC emissions from petroleum vessel loading, ballasting, and transit are influenced by severalfactors. Emissions are a function of the physical and chemical characteristics of both previousand new cargos. Emissions are also a function of the vessel size. Many U.S. harbors are tooshallow to receive large tankers. Instead, these tankers must remain outside the harbor area andoff-load their cargo to smaller vessels in a process known as lightering. Since most lighteringoccurs more than 30 miles offshore, emissions from these operations are well dispersed beforethey reach the land. Lightering operations that occur outside the inventory study area may notneed to be included in the inventory. Preparers of inventories should check with policymakers,modelers, or other inventory clients to determine whether it is necessary to include offshorelightering emissions. If lightering emissions do need to be included in an inventory, estimatingthe potential emissions from loading or ballasting will reflect the same processes as thosediscussed in Sections 2.2.1 and 2.2.2 of this chapter.
VOC emissions are also a function of the method of vessel loading. In splash loading, the fillpipe dispensing the cargo is lowered only partway into the cargo tank, resulting in higherturbulence during loading and subsequent high levels of vapor generation and loss. On the otherhand, in submerged loading, the fill pipe extends almost to the bottom of the cargo tank, thuscontrolling liquid turbulence, and resulting in much lower vapor generation than encounteredduring splash loading.
2.4 CONTROL TECHNIQUES
The U.S. Coast Guard administers regulations (33 CFR, Part 157) that apply to all vesselsexceeding 150 gross tons and are either documented under U.S. laws or are foreign vessels thattransfer cargoes at ports subject to the jurisdiction of the U.S., or otherwise enter or operate in thenavigable waters of the United States. The only exceptions are for foreign ships that are simplypassing through U.S. waters or are exempt by the Port and Tanker Safety Act, as amended. TheCoast Guard rule requires that all affected ships must have segregated ballast tanks, which shouldeliminate emissions from ballasting for these ships. Vessels unaffected by the regulation should be considered potential sources of ballasting emissions.
Many states require controls on vessel loading. State and local rules should be investigatedbefore collecting other data for this category. Cases exist where companies have agreed to install
CHAPTER 12 - MARINE VESSEL LOADING, BALLASTING, AND TRANSIT 1/31/01
1 Personal communication between Allen Ellet, Senior Environmental Consultant, BP OilCompany, and L. Adams, Eastern Research Group Inc., February 1998.
12.2-4 EIIP Volume III
controls where none are required by Federal, state or local regulations. Inventory preparersshould identify these instances.
Emissions from vessel loading can be controlled through loading practice or through controlequipment. Submerged loading, in which the fill pipe opening is below the liquid surface level,reduces liquid turbulence and resulting vapor generation (EPA, 1996). Emissions from splashloading can also be reduced by restricting the loading rate until the fill pipe is submerged. Thispractice reduces the liquid turbulence during the splash loading portion of the load cycle.1 Whenvessel loading is part of a lightering operation, vapor balancing may be used to transfer the vaporfrom the vessel being loaded to the vessel being unloaded. Emissions from vessel loading mayalso be controlled at terminals through vapor balance systems or with vapor control systems,such as carbon adsorption, refrigeration, or thermal destruction units.1
Controls for emissions from ballasting include using segregated non-contaminated ballast tanks,or placing the ballast between hulls on double-hulled ships (33 CFR, Part 157).
Emissions during transit can be reduced through the use of an inert gas system that maintains aninert gas atmosphere at a slight positive pressure in each tank to minimize emissions and reducethe risk of explosions.1
The use of any of these controls within the inventory area should be investigated beforeemissions are calculated.
12.3-1EIIP Volume III
3
OVERVIEW OF AVAILABLE METHODS
3.1 EMISSION ESTIMATION METHODOLOGIES
This document does not present an alternative method of estimating emissions from marinevessels carrying petroleum liquids. The preferred method can be used for any type of marinevessel, traffic classification, crude oil or refined petroleum product type, and any area of theUnited States served by marine vessels.
3.1.1 VOLATILE ORGANIC COMPOUNDS
The preferred method for estimating VOC emissions from marine vessel loading, ballasting, andtransit is based on estimates of amount and type of products transported to or from the inventoryarea by waterways as well as the traffic classification (import, domestic, internal upbound, etc.). Fuels and other petroleum liquids transported are classified into five major product types ofsignificantly different densities, vapor pressures, and physical compositions and the types oflosses (emission points) expected from a specific operation are determined based on the trafficclassification identified above. Inventory preparers with detailed information about the productsbeing handled in their inventory area can use AP-42 equations for estimation calculations, afteractivity data has been collected. VOC emissions are estimated by multiplying the throughput bythe appropriate emission factors corresponding to the type of loss occurring in a specific trafficclassification.
3.1.2 HAZARDOUS AIR POLLUTANTS
Hazardous air pollutant (HAP) emissions from this source are assumed to be proportional to the HAP vapor phase weight concentrations of the petroleum liquid for which the emissions arebeing calculated.
3.2 DATA NEEDS
3.2.1 DATA ELEMENTS
Several data sources are available on the movement of crude oil and other petroleum products;tonnage shipped and received; and capacities of refineries and bulk terminals at the national,regional, Petroleum Administration for Defense (PAD) District, state and local levels.
CHAPTER 12 - MARINE VESSEL LOADING, BALLASTING, AND TRANSIT 1/31/01
1 Traffic classification shipped: Materials classified as shipments or outbound are moved fromthe subject port to another location.
2 Traffic classification received: Materials classified as receipts or inbound are moved fromanother location to the subject port.
3 The publication can be obtained from the U.S. Army Corps of Engineers, New Orleans District,Waterborne Commerce Statistics Center, P.O. Box 61280, New Orleans, LA, 70161-1280. Tel. 504-862-1400; Waterborne commerce statistics may also be obtained on the internet fromthe Waterborne Commerce Statistics Center Wide World Web site athttp://www.bts.gov/ntda/acewcsc/
12.3-2 EIIP Volume III
The minimum data elements needed to calculate emission estimates for marine vessel loading,ballasting, and transit are as follows:
� Petroleum liquids by traffic classification shipped1 by type and volume aggregatedby vessel type;
� Petroleum liquid by traffic classification received2 by type and volume aggregatedby vessel type;
� Petroleum liquid in transit through inventory area;
� Controls in place for all operations, and control effectiveness;
� Product type within each traffic classification;
� Information on transport situation (i.e., barge loading, ballasting, transit) inferredfrom the traffic classification; and
� Fraction of transit time spent in inventory area.
Traffic classifications will depend on the data source used. Examples used in this document arebased on the publication Waterborne Commerce of the United States.3
As mentioned in Section 2 of this chapter, regulations administered by the U.S. Coast Guardrequire that large marine vessels control organic vapors from ballasting through measures such assegregated ballast tanks. As a result, ships affected by this rule do not need to be included in
1/31/01 CHAPTER 12 - MARINE VESSEL LOADING, BALLASTING, AND TRANSIT
12.3-3EIIP Volume III
estimates of emissions from ballasting. Ballasting emissions from smaller vessels will need to beinvestigated.
3.2.2 POINT SOURCE CORRECTIONS
Although there are certain ports where handling of crude oil and other petroleum products mayresult in large emissions, annual VOC emissions at most ports would not exceed 100 tons. As aresult, emissions from marine vessel loading and other operations generally should be consideredarea sources. Some areas may have petroleum refineries where vessel loading operations havebeen accounted for as point sources. If so, the area source emissions estimating methodologyshould be designed to not double-count any sources that have been inventoried as point sources.
3.2.3 APPLICATION OF CONTROLS
Control techniques for loading, ballasting and transit are discussed in Section 2.4 of this chapter. Rules will vary by locale and the size of the terminal or vessel. Inventory preparers shouldinvestigate the rules in place in the inventory area, and determine if those rules apply to thesmaller sources that make up an area source inventory. Air agencies, local port authorities, andmarine vessel operators should be contacted about rules that apply in the inventory area. Inaddition to controls that are put in place because of rules, inventory preparers should identifyinstances of controls that are not required, but still used.
Air pollution control regulations in Louisiana and Pennsylvania require that marine loadingfacilities serving ships and/or barges loading crude oil, gasoline, or volatile organic compoundsbe equipped with a vapor collection system designed to collect the organic compounds vaporsdisplaced from ships and/or barges during loading. The vapors are then processed by recoveryand/or destruction systems such that uncontrolled emissions are reduced by at least 90 percent byweight. Pennsylvania air laws also require that by September 28, 1996, a minimum of 65 percentof the total volume of receipt of crude oil and gasoline during a specified period be delivered to afacility in vessels which do not ballast, such as barges, or in vessels which do not emit VOCwhen ballasted, such as tankers using segregated ballast tanks.
Chapter 1 of this volume, the Introduction to Area Source Emission Inventory Development,provides general guidance for determining and applying rule effectiveness (RE) for a sourcecategory. In addition, the EPA document Procedures for Estimating and Applying RuleEffectiveness in Post-1987 Base Year Emission Inventories for Ozone and Carbon MonoxideState Implementation Plans provides more detailed information on RE (EPA, 1989).
CHAPTER 12 - MARINE VESSEL LOADING, BALLASTING, AND TRANSIT 1/31/01
12.3-4 EIIP Volume III
3.2.4 SPATIAL ALLOCATION
The preferred method estimates emissions from loading, ballasting, and transit at the study regionlevel. Emissions from these operations are concentrated in coastal areas, areas surrounding theGreat Lakes, and areas adjacent to ports on inland waterways.
3.2.5 TEMPORAL RESOLUTION
Seasonal Apportioning
Some emissions from loading, ballasting, and transit of petroleum liquids from marine vesselsare expected to be spread evenly over time, while other emissions will exhibit seasonalvariations. Crude oil activities are relatively stable throughout the seasons. However, seasonalvariations are expected in gasoline shipments and in those areas where wintertime frozen watersmake ports inaccessible, such as the Great Lakes region.
Alternatively, temporal allocation of vessel loading, ballasting, and transit emissions can beaccomplished by (1) obtaining detailed monthly activity data for the port in question andapplying these data to the estimation equation, or (2) by apportionment factors based on use ofthe various products. The second method would capitalize on data which should already existfrom area/mobile source inventory efforts (e.g., monthly or seasonal allocation of motor fuel;consumption and/or vehicle miles traveled; home heating fuels; aircraft fuels, etc.).
VOC emissions from these marine vessel operations vary due to changes in temperature as wellas vapor pressure. Equations are available that account for such variations. However, this sourcecategory generally accounts for a relatively small portion of the overall area inventory.
Daily Resolution
Vessel loading and unloading operations are assumed to occur on a daily basis, seven days aweek.
3.3 PROJECTING EMISSIONS
The EIIP Projections Committee has developed a series of guidance documents containinginformation on options for forecasting future emissions. You can refer to these documents athttp://www.epa.gov/ttn/chief/eiip/project.htm.
1/31/01 CHAPTER 12 - MARINE VESSEL LOADING, BALLASTING, AND TRANSIT
12.3-5EIIP Volume III
Projecting emissions from petroleum vessel loading, ballasting, and transit requires informationon anticipated changes in demand for those products and prices, as well as changes in storagecapacity at ports and harbors. If no information is available, the inventorying agency can assumeno changes to the existing level of activities. Alternatively, historic activity at the ports in theinventory area would be the best source of data for projecting future vessel activity.
CHAPTER 12 - MARINE VESSEL LOADING, BALLASTING, AND TRANSIT 1/31/01
12.3-6 EIIP Volume III
This page is intentionally left blank.
1 The publication can be obtained from the U.S. Army Corps of Engineers, New Orleans District,Waterborne Commerce Statistics Center, P.O. Box 61280, New Orleans, LA, 70161-1280. Tel. 504-862-1400; Waterborne commerce statistics may also be obtained on the internet fromthe Waterborne Commerce Statistics Center Wide World Web site athttp://www.bts.gov/ntda/acewcsc/
2 The Petroleum Supply Annual can be obtained from the Energy Information Administration(EIA), Department of Energy, Washington, DC; refer to the EIA web site athttp://www.eia.doe.gov.
12.4-1EIIP Volume III
4
PREFERRED METHODS FORESTIMATING EMISSIONS
4.1 PREFERRED METHOD
The preferred method for estimating emissions from petroleum vessel loading, ballasting, andtransit is described below. This method has limitations because the data that are needed are oftennot available. The method is intended to produce representative area source emissions estimateswithout requiring the expenditure of an unreasonable amount of resources to fill informationgaps. However, it is recommended that, as a first step, inventory preparers identify controls thatare in use in the area, and determine if emissions are primarily inventoried as part of the pointsource inventory. See Sections 2.4 and 3.2.3 of this chapter for more information about controls. Because some controls may eliminate emissions from certain processes and vessels altogether,data collection can be reduced to only those vessels and processes that are actually creatingemissions. The steps of the methodology are as follows:
4.1.1 DETERMINATION OF AMOUNT OF PETROLEUM LIQUIDS TRANSPORTED TO OR FROM THE INVENTORY REGION
Determine the amount and type of petroleum liquids transported to or from the inventory regionby waterway. The publication Waterborne Commerce of the United States1 can be used to obtaindata on the movements of commodities and vessels at individual ports and harbors and onindividual waterways and canals of the United States. Both foreign and domestic commerce areincluded. Other sources of potentially useful information are the Petroleum Supply Annual,2
Petroleum Storage and Transportation (DOE, 1989), publications from the U.S. Maritime
CHAPTER 12 - MARINE VESSEL LOADING, BALLASTING, AND TRANSIT 1/31/01
3 A periodic report from Salsby/Wilson Press, Houston, Texas; also available athttp://www.opisnet.com/terminal.htm
12.4-2 EIIP Volume III
Administration (U.S. Maritime Administration, 1985), and the Petroleum TerminalEncyclopedia.3 Estimates of percentage of each fuel type carried by each type of vessel areavailable from National or Regional Petroleum Administrations for Defense district, or the state.
The New Orleans District Data Request Office of the U.S. Army Corps of Engineers also handlesspecial requests (at a cost), for water commerce statistics such as port- and harbor-specificinformation regarding shipping and receiving operations. Available data include the following:
� Crude oil and other petroleum products shipped and received at each harboraggregated by fuel and type of vessel (i.e., tankers versus barges);
� Refinery receipts of crude oil and petroleum products by type of vessel; and
� Refinery shipments of crude oil and petroleum products by type of vessel.
In some cases, only one shipping company ships specific products to and from certain locations. If the Data Request Center were to reveal the tonnage for each product shipped, the ConfidentialBusiness Information for that particular company may be compromised. In this situation theData Request Center prefers to submit the data as lump sum totals without specifying the tonnageto each destination.
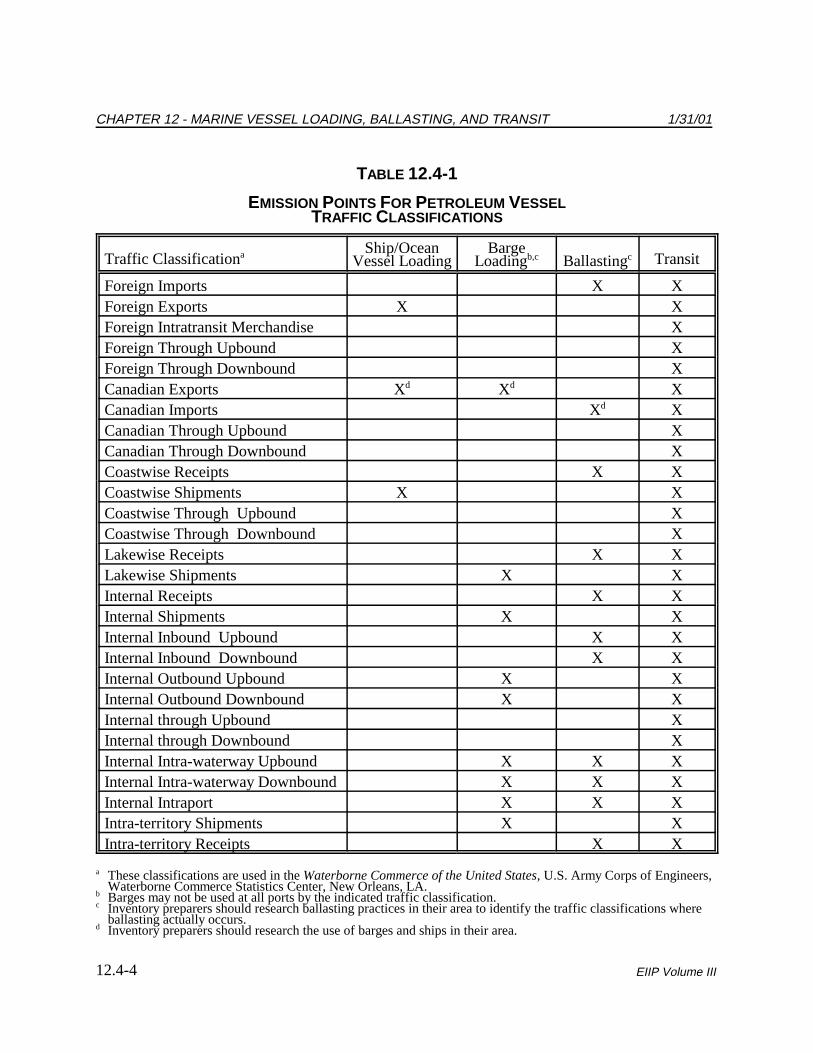
4.1.2 IDENTIFICATION OF EMISSION POINTS
Use Table 12.4-1 to identify the emission points for each traffic classification. Determineemission points for all petroleum commodity types. Additional traffic classifications may exist. Classifications listed here represent the most likely emission process assignments. Table 12.4-1is based on the following assumptions:
� All traffic involves transit emissions;
� Loading (ship, vessel, barge) emissions only result from export, shipment,and outbound traffic;
� Ballasting emissions only result from import and receipts traffic where thereturn voyage requires balancing;
� Through traffic results only in transit emissions; and
1/31/01 CHAPTER 12 - MARINE VESSEL LOADING, BALLASTING, AND TRANSIT
12.4-3EIIP Volume III
� Barge loading emissions result only from exports and shipments traffic inshallower waterways (e.g. internal, lakeside waterways). Inventorypreparers should investigate the use of barges and ships in their area.
The emission points presented in Table 12.4-1 are defined based on the traffic type definitionspresented in the U.S. Army Corps of Engineers’ Waterborne Commerce of the United States. Definitions of the traffic classifications can be found in that document. Loading operations(ship/vessel loading and barge loading) occur when the commodity is moved from the subjectport to another port or location. Other traffic is assumed to be either traffic that has originatedfrom another port or location and represents an unloading operation, or through traffic that doesnot stop at the port/waterway. One exception to this rule is intra-port or intra-waterway trafficwhich is loaded and unloaded in the subject waterway.
Unloading operations do not result in emissions from the vessel itself. Unloading operationsonly result in emissions counted as part of this source category if ballasting into non-segregatedcargo tanks occurs to the vessel being unloaded. Otherwise the emissions that result due to theloading of the receiving tank or truck are counted as the source category covering emissions fromloading tanks or trucks. Unless the receiving vessel is another marine vessel, loading of the tankor truck would not be considered marine loading and would not be part of this area sourcecategory.
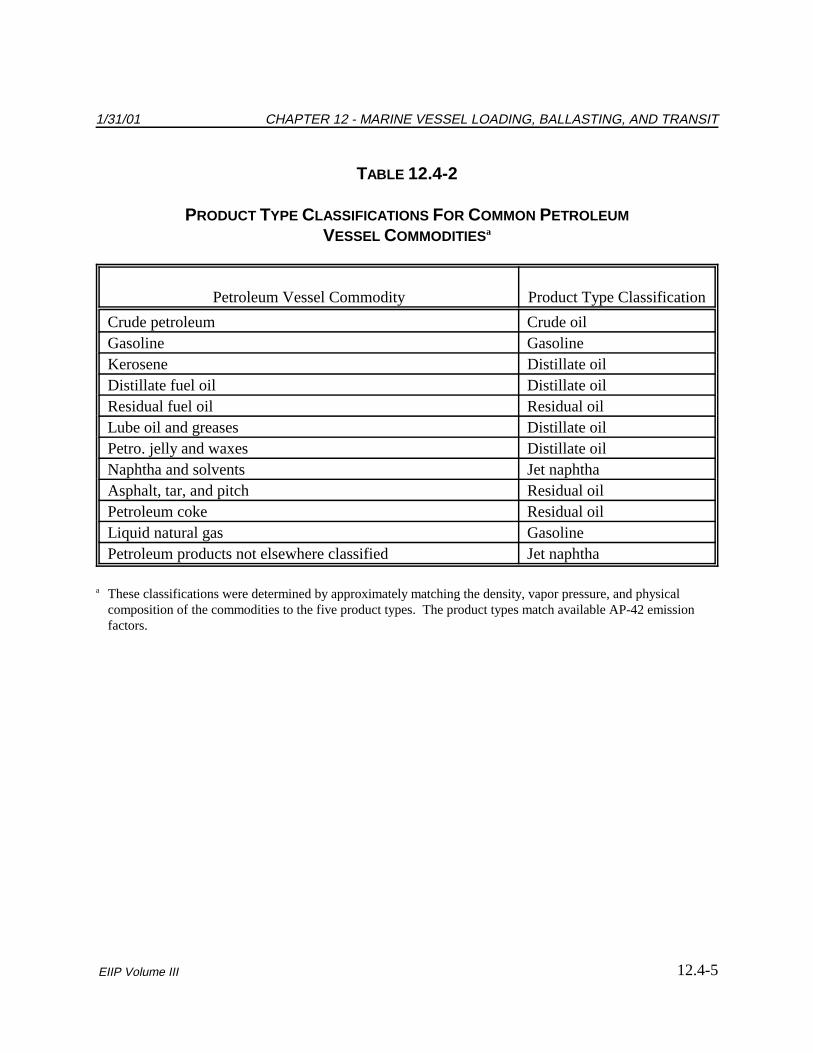
4.1.3 CLASSIFICATION OF PETROLEUM PRODUCTS BY FUEL TYPE
Classify the petroleum liquids transported in the inventory region into five fuel typeclassifications using Table 12.4-2. If inventory data quality objectives require more detailedemission estimates, the inventory preparer may want to use the equations for calculatingemissions from AP-42, Section 5.2, Transportation and Marketing of Petroleum Liquids, andportions of AP-42, Section 7.1, Liquid Storage Tanks, including Table 7.1-2, Properties ofSelected Petroleum Liquids. The equations in AP-42 require considerably more data collectionthan the data collection discussed in this chapter. The inventory preparer may want to considerthe costs and benefits of using the more detailed approach, and may want to use the AP-42equations on a small subset of products that will most make the most significant improvement tothe overall estimate, and use the emission factors presented here for the remaining products.
CHAPTER 12 - MARINE VESSEL LOADING, BALLASTING, AND TRANSIT 1/31/01
12.4-4 EIIP Volume III
TABLE 12.4-1
EMISSION POINTS FOR PETROLEUM VESSELTRAFFIC CLASSIFICATIONS
Traffic ClassificationaShip/Ocean
Vessel LoadingBarge
Loadingb,c Ballastingc Transit
Foreign Imports X XForeign Exports X XForeign Intratransit Merchandise XForeign Through Upbound XForeign Through Downbound XCanadian Exports Xd Xd XCanadian Imports Xd XCanadian Through Upbound XCanadian Through Downbound XCoastwise Receipts X XCoastwise Shipments X XCoastwise Through Upbound XCoastwise Through Downbound XLakewise Receipts X XLakewise Shipments X XInternal Receipts X XInternal Shipments X XInternal Inbound Upbound X XInternal Inbound Downbound X XInternal Outbound Upbound X XInternal Outbound Downbound X XInternal through Upbound XInternal through Downbound XInternal Intra-waterway Upbound X X XInternal Intra-waterway Downbound X X XInternal Intraport X X XIntra-territory Shipments X XIntra-territory Receipts X X
a These classifications are used in the Waterborne Commerce of the United States, U.S. Army Corps of Engineers,Waterborne Commerce Statistics Center, New Orleans, LA.
b Barges may not be used at all ports by the indicated traffic classification.c Inventory preparers should research ballasting practices in their area to identify the traffic classifications where
ballasting actually occurs.d Inventory preparers should research the use of barges and ships in their area.
1/31/01 CHAPTER 12 - MARINE VESSEL LOADING, BALLASTING, AND TRANSIT
12.4-5EIIP Volume III
TABLE 12.4-2
PRODUCT TYPE CLASSIFICATIONS FOR COMMON PETROLEUM
VESSEL COMMODITIESa
Petroleum Vessel Commodity Product Type Classification
Crude petroleum Crude oilGasoline GasolineKerosene Distillate oilDistillate fuel oil Distillate oilResidual fuel oil Residual oilLube oil and greases Distillate oilPetro. jelly and waxes Distillate oilNaphtha and solvents Jet naphthaAsphalt, tar, and pitch Residual oilPetroleum coke Residual oilLiquid natural gas GasolinePetroleum products not elsewhere classified Jet naphtha
a These classifications were determined by approximately matching the density, vapor pressure, and physicalcomposition of the commodities to the five product types. The product types match available AP-42 emissionfactors.
CHAPTER 12 - MARINE VESSEL LOADING, BALLASTING, AND TRANSIT 1/31/01
12.4-6 EIIP Volume III
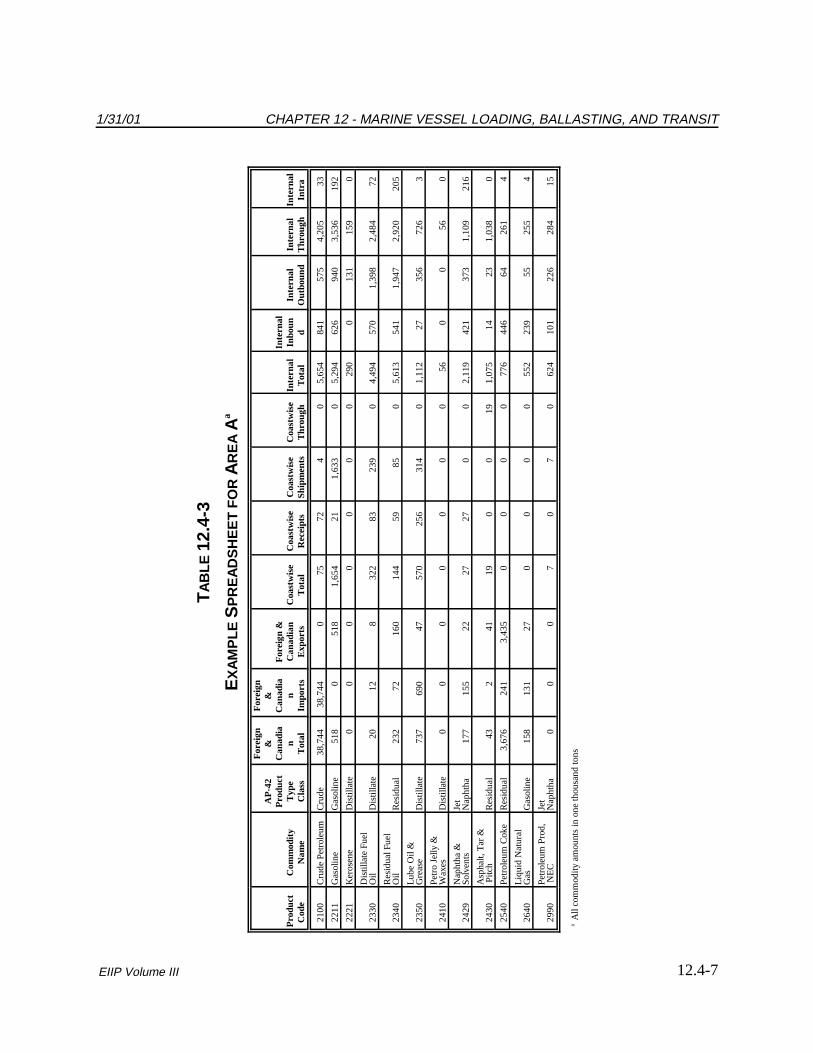
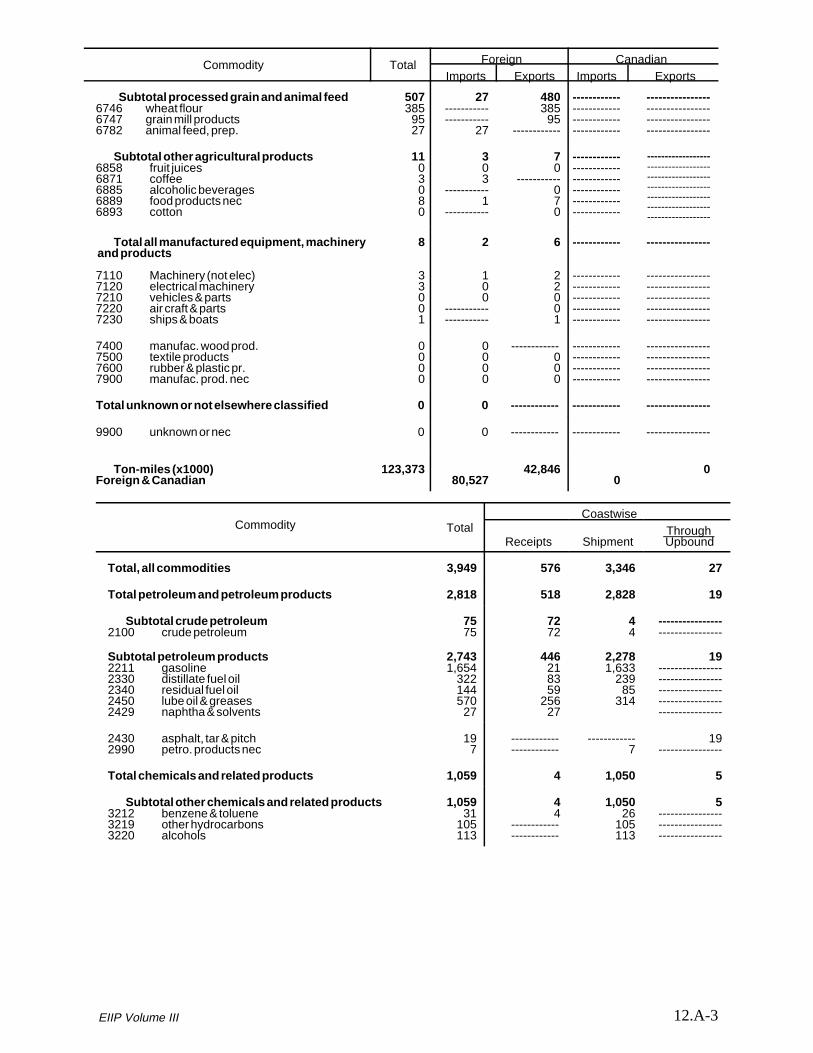
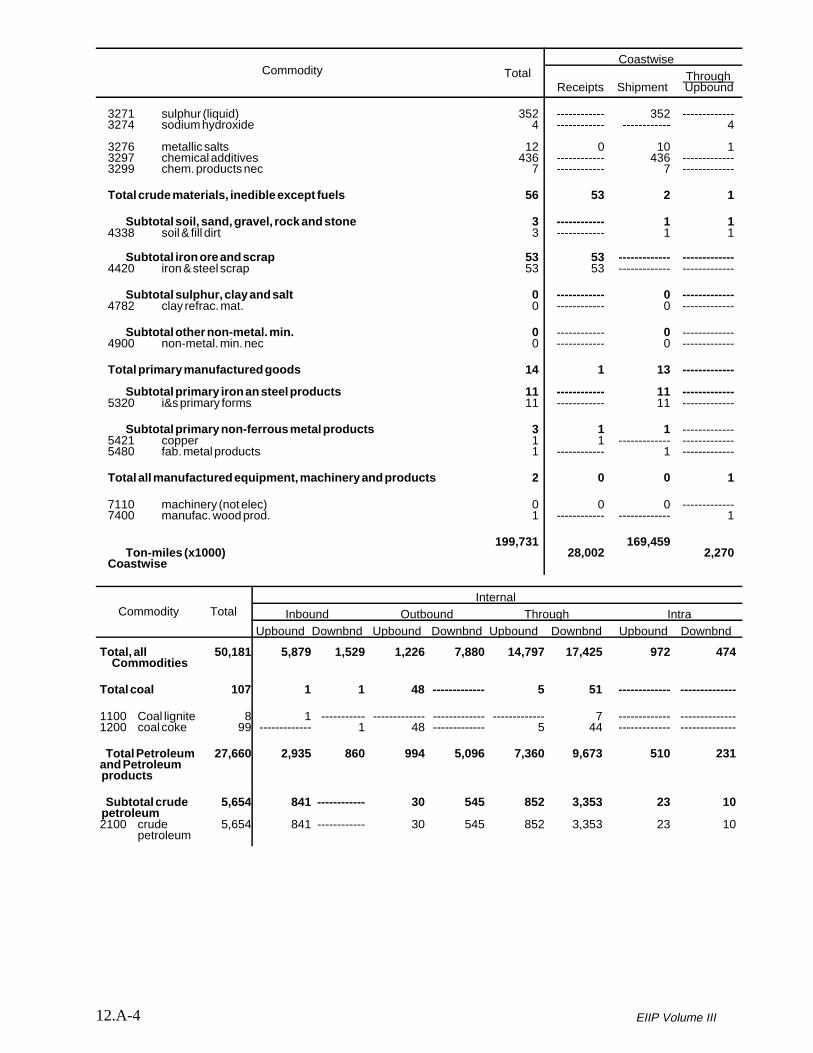
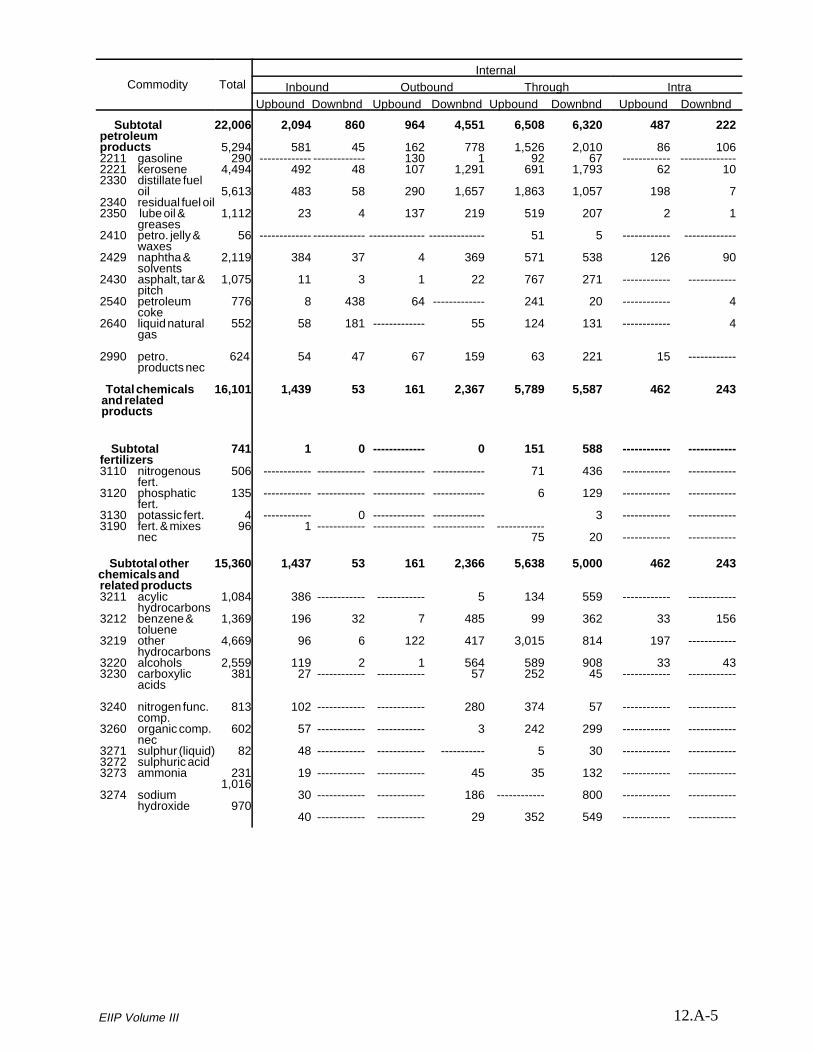
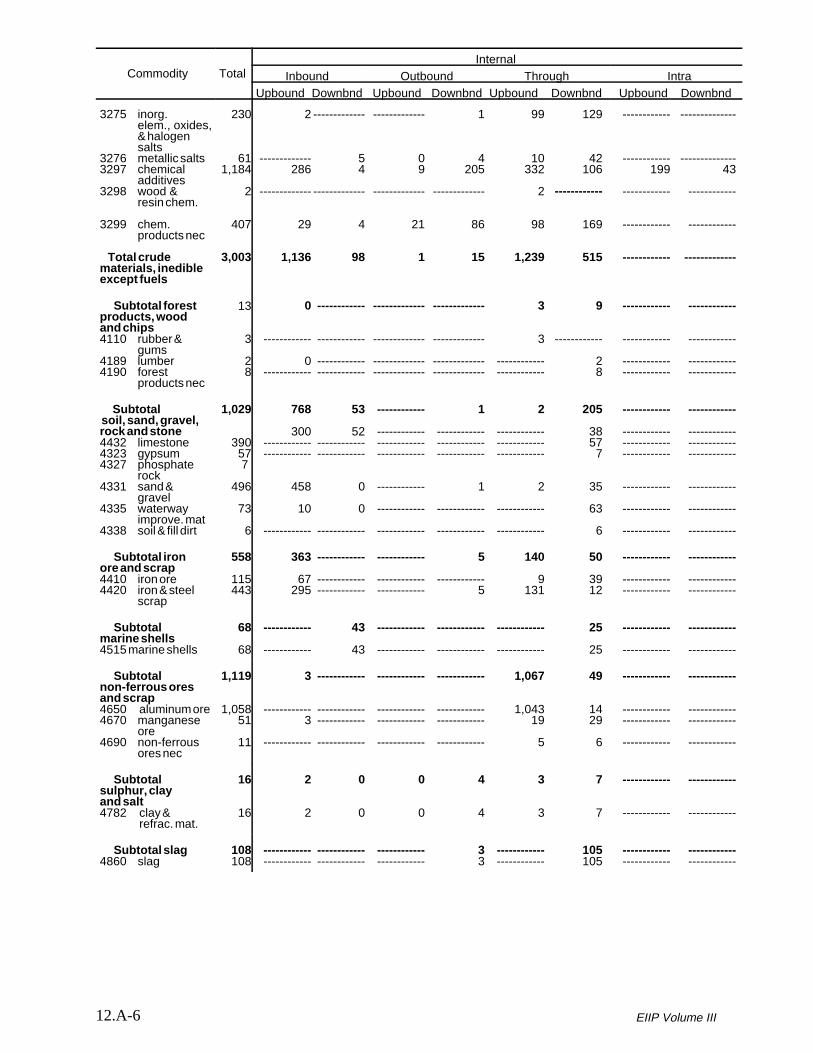
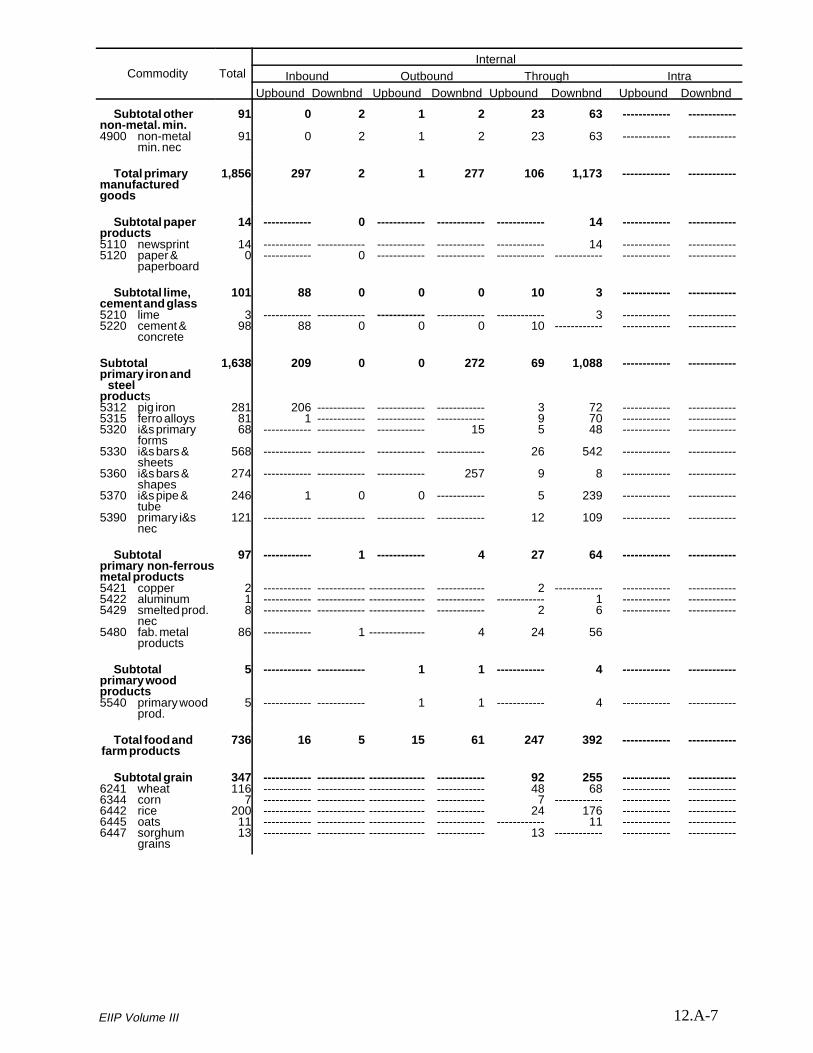
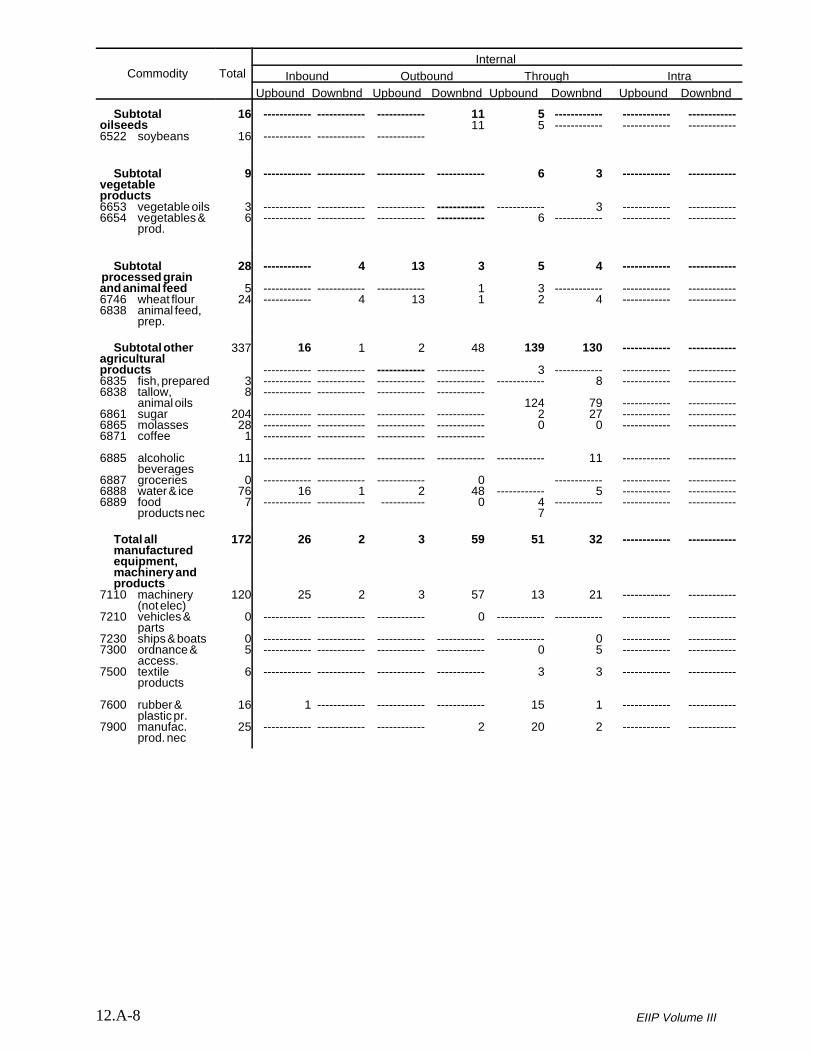
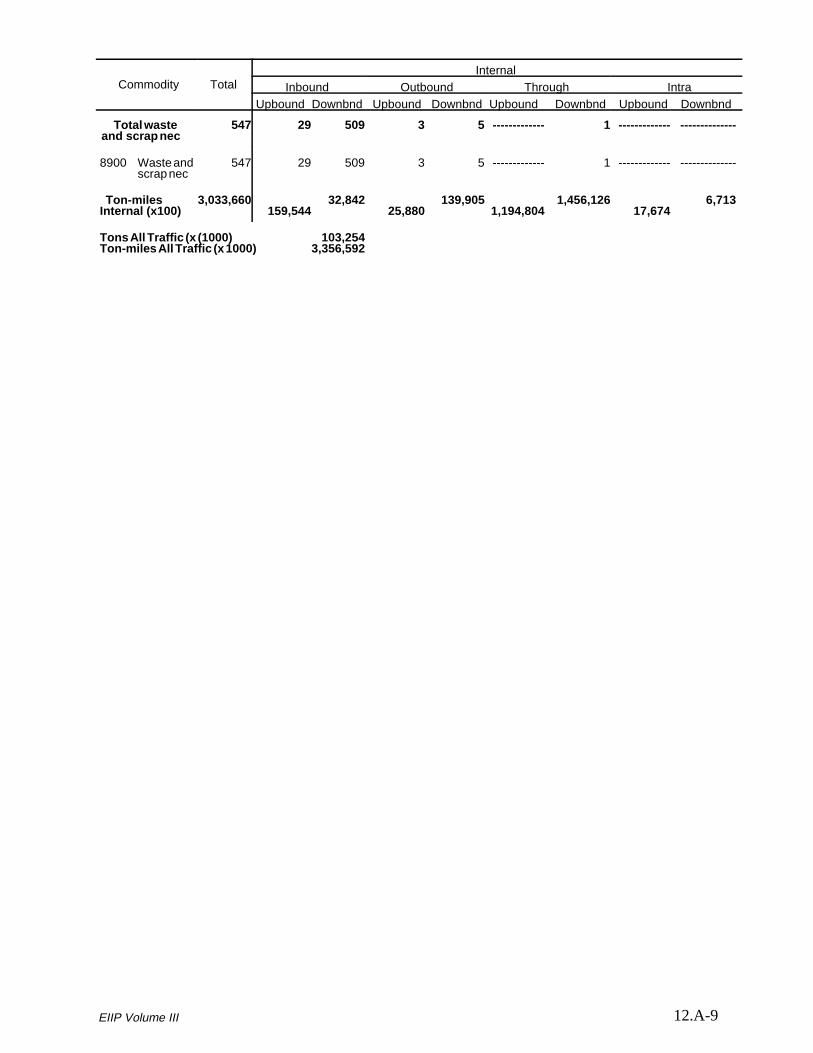
Example 12.4-1:
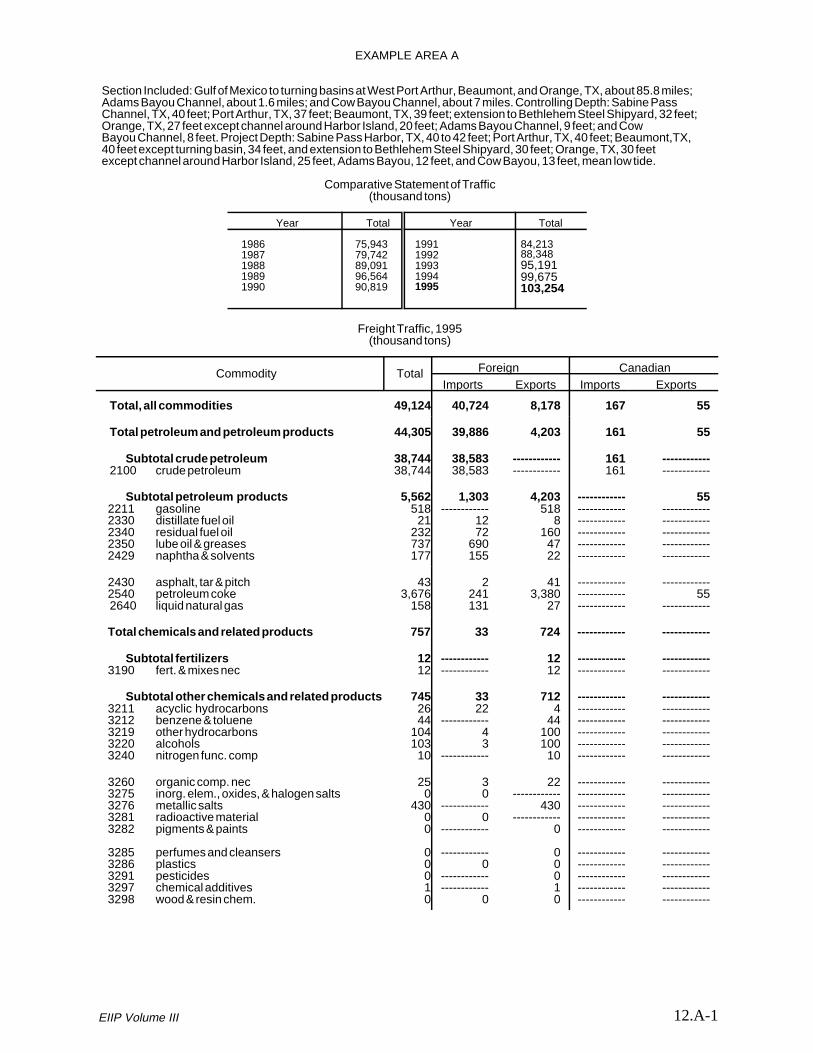
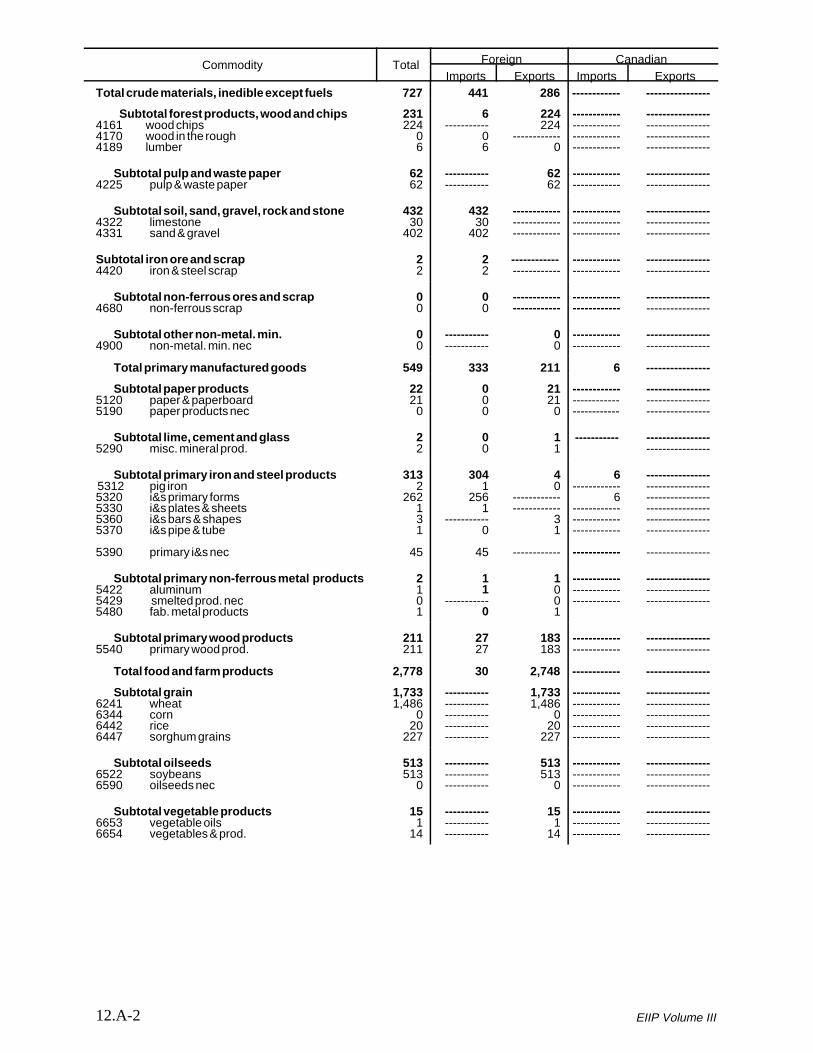
Data from Example Area A, an area where large amounts of petroleum liquids are handled, is listedin Appendix A as it is provided in the Waterborne Commerce of the United States. Shipments andreceipts of commodities are listed by product type and traffic classification. Definitions of trafficclassifications can be found in the Waterborne Commerce document. For an area source inventory,the information needs to be compiled first by traffic classifications representing similar processes,and then by product types that can be linked to existing emission factors. For this example, thesesteps are accomplished using a spreadsheet. The first step, shown in Table 12.4-3, is to enter thedata into the spreadsheet so it can be sorted by traffic classification and product type.
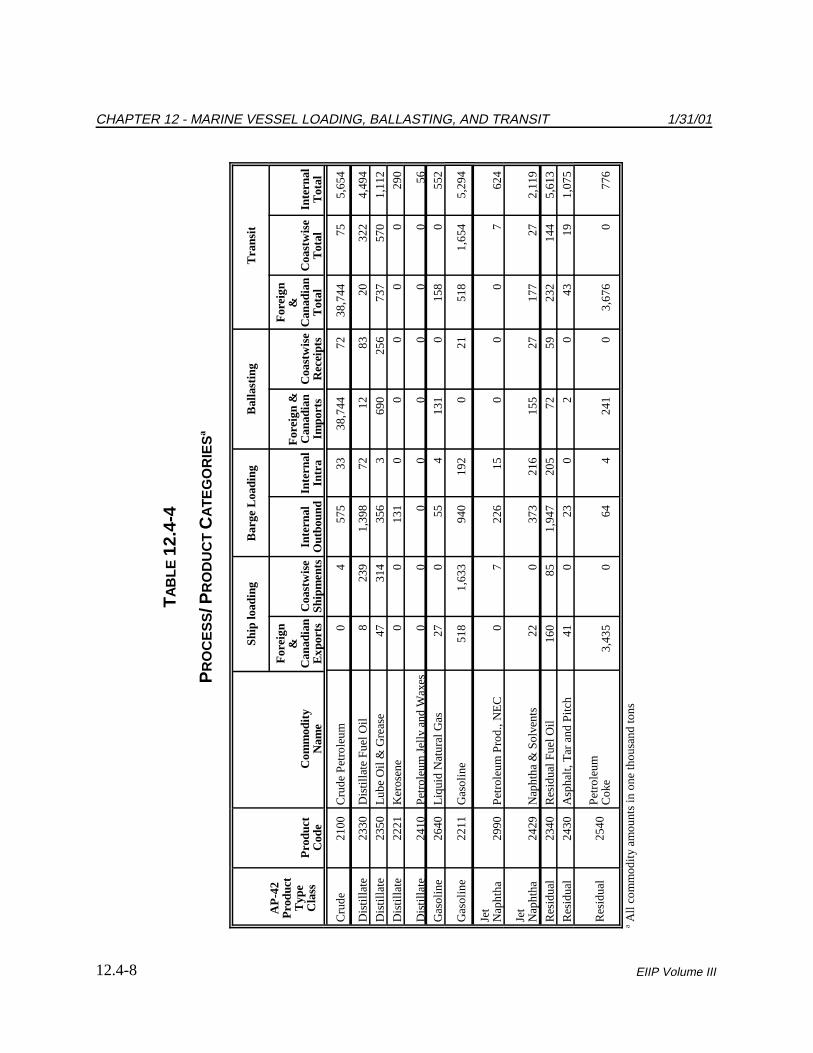
Table 12.4-4 shows the data further combined into groups based on traffic classification and sortedby product types that will match AP-42 emission factors. Table 12.4-1 can be used to match trafficclassifications and AP-42 processes, e.g. ship loading or barge loading. Note that based on localinformation, only foreign and Canadian and coastwise receipt categories were subject to ballasting.
An example of how data from the Waterborne Commerce document can be compiled for onelarge waterway is shown in Example 12.4-1.
4.1.4 ESTIMATION OF TRANSIT EMISSIONS
For transit emissions, estimate the average time traffic is in the inventory area. Specific data maybe difficult to obtain. The best resource for this information may be the local port authorities.
4.1.5 CORRECTION FOR POINT SOURCE EMISSIONS
It is possible for some marine loading operations, such as those at large petroleum refineriesoperating their own port, to be included in point source inventories. To make thedouble-counting correction, the material throughputs from specific point source SCCs should betotaled and subtracted from the total area source material transferred. Area source emissionsshould then be estimated based on this corrected material transferred amount.
If the point source material throughputs are not available, the correction can be made at theemissions level (subtract total emissions from specific point source SCCs from total area sourceemissions). Emissions from vessel loading/unloading operations at facilities such as petroleumrefineries located in the inventory area should be deducted from the area source totals. Pointsource SCCs may include 40600231 through 40600259. Additional point source SCCs mayexist, so the point source inventory should be carefully reviewed.
1/31/01 CHAPTER 12 - MARINE VESSEL LOADING, BALLASTING, AND TRANSIT
12.4-7EIIP Volume III
TA
BLE
12.
4-3
EX
AM
PLE
SP
RE
AD
SH
EE
T F
OR
AR
EA
Aa
Pro
duct
Cod
eC
omm
odity
Nam
e
AP
-42
Pro
duct
Typ
eC
lass
For
eign
&C
anad
ian
Tot
al
For
eign
&C
anad
ian
Impo
rts
For
eign
&C
anad
ian
Exp
orts
Coa
stw
ise
Tot
alC
oast
wis
eR
ecei
pts
Coa
stw
ise
Shi
pmen
tsC
oast
wis
eT
hrou
ghIn
tern
alT
otal
Inte
rnal
Inbo
und
Inte
rnal
Out
boun
dIn
tern
alT
hrou
ghIn
tern
alIn
tra
21
00
Cru
de
Pet
role
um
Cru
de
38
,74
43
8,7
44
07
57
24
05
,65
48
41
57
54
,20
53
3
22
11
Gas
olin
eG
asol
ine
51
80
51
81
,65
42
11
,63
30
5,2
94
62
69
40
3,5
36
19
2
22
21
Ker
osen
eD
istil
late
00
00
00
02
90
01
31
15
90
23
30
Dis
tilla
te F
uel
Oil
Dis
tilla
te2
01
28
32
28
32
39
04
,49
45
70
1,3
98
2,4
84
72
23
40
Res
idu
al F
uel
Oil
Res
idu
al2
32
72
16
01
44
59
85
05
,61
35
41
1,9
47
2,9
20
20
5
23
50
Lub
e O
il &
Gre
ase
Dis
tilla
te7
37
69
04
75
70
25
63
14
01
,11
22
73
56
72
63
24
10
Pet
ro J
elly
&
Wax
esD
istil
late
0
00
00
00
56
00
56
0
24
29
Nap
hth
a &
S
olve
nts
Jet
Nap
hth
a1
77
15
52
22
72
70
02
,11
94
21
37
31
,10
92
16
24
30
Asp
hal
t, T
ar &
Pitc
hR
esid
ual
43
24
11
90
01
91
,07
51
42
31
,03
80
25
40
Pet
role
um
Cok
eR
esid
ual
3,6
76
24
13
,43
50
00
07
76
44
66
42
61
4
26
40
Liq
uid
Nat
ura
l G
asG
asol
ine
15
81
31
27
00
00
55
22
39
55
25
54
29
90
Pet
role
um
Pro
d,
NE
CJe
t N
aph
tha
00
07
07
06
24
10
12
26
28
41
5
aA
ll co
mm
odity
am
oun
ts in
on
e th
ousa
nd
ton
s
CHAPTER 12 - MARINE VESSEL LOADING, BALLASTING, AND TRANSIT 1/31/01
12.4-8 EIIP Volume III
TA
BLE
12.
4-4
PR
OC
ES
S/ P
RO
DU
CT
CA
TE
GO
RIE
Sa
AP
-42
Pro
duct
Typ
eC
lass
Pro
duct
Cod
eC
omm
odity
Nam
e
Shi
p lo
adin
gB
arge
Loa
ding
Bal
last
ing
Tra
nsit
For
eign
&C
anad
ian
Exp
orts
Coa
stw
ise
Shi
pmen
tsIn
tern
alO
utbo
und
Inte
rnal
Intr
a
For
eign
&C
anad
ian
Impo
rts
Coa
stw
ise
Rec
eipt
s
For
eign
&C
anad
ian
Tot
alC
oast
wis
eT
otal
Inte
rnal
Tot
al
Cru
de
21
00
Cru
de
Pet
role
um
04
57
53
33
8,7
44
72
38
,74
47
55
,65
4
Dis
tilla
te2
33
0D
istil
late
Fu
el O
il8
23
91
,39
87
21
28
32
03
22
4,4
94
Dis
tilla
te2
35
0Lu
be
Oil
& G
reas
e4
73
14
35
63
69
02
56
73
75
70
1,1
12
Dis
tilla
te2
22
1K
ero
sen
e0
01
31
00
00
02
90
Dis
tilla
te
24
10
Pet
role
um
Jel
ly a
nd
Wax
es0
00
00
00
05
6
Gas
olin
e2
64
0Li
qu
id N
atu
ral G
as2
70
55
41
31
01
58
05
52
Gas
olin
e2
21
1G
aso
line
51
81
,63
39
40
19
20
21
51
81
,65
45
,29
4
Jet
Nap
hth
a2
99
0P
etro
leu
m P
rod
., N
EC
07
22
61
50
00
76
24
Jet
Nap
hth
a2
42
9N
aph
tha
& S
olv
ents
22
03
73
21
61
55
27
17
72
72
,11
9
Res
idu
al2
34
0R
esid
ual
Fu
el O
il1
60
85
1,9
47
20
57
25
92
32
14
45
,61
3
Res
idu
al2
43
0A
sph
alt,
Tar
an
d P
itch
41
02
30
20
43
19
1,0
75
Res
idu
al2
54
0P
etro
leu
m
Co
ke3
,43
50
64
42
41
03
,67
60
77
6
a All
com
mo
dity
am
ou
nts
in o
ne
tho
usa
nd
to
ns
1/31/01 CHAPTER 12 - MARINE VESSEL LOADING, BALLASTING, AND TRANSIT
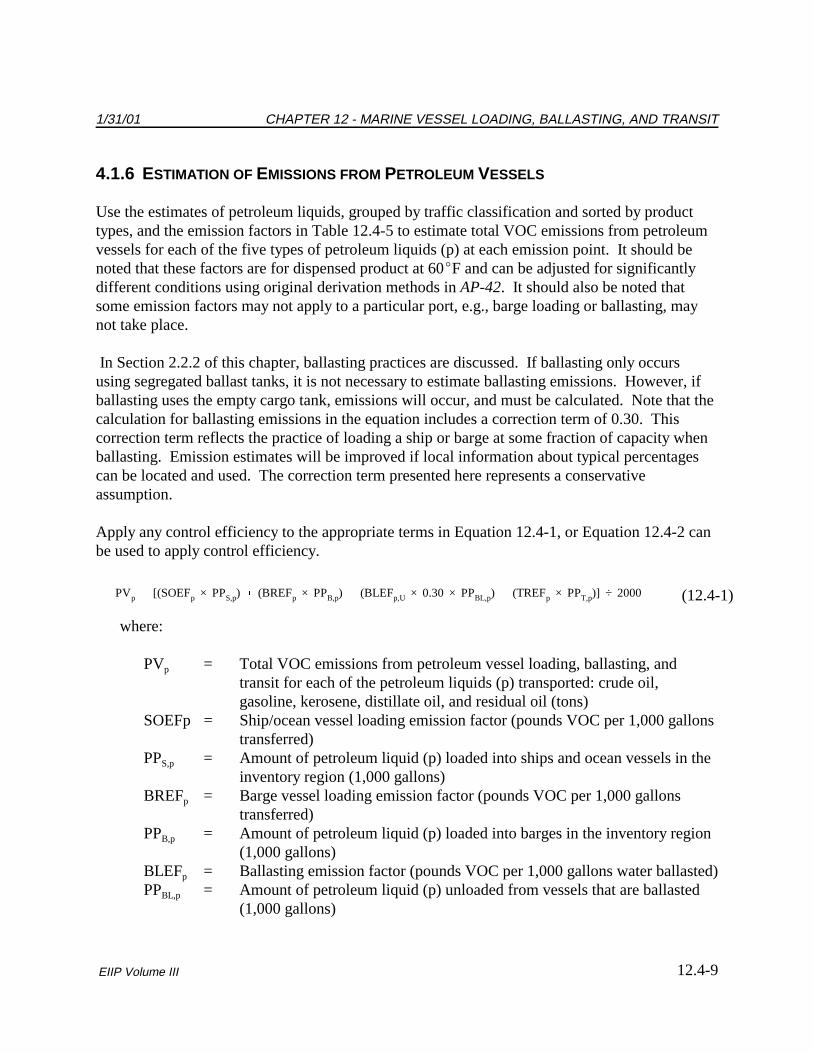
4.1.6 ESTIMATION OF EMISSIONS FROM PETROLEUM VESSELS
Use the estimates of petroleum liquids, grouped by traffic classification and sorted by producttypes, and the emission factors in Table 12.4-5 to estimate total VOC emissions from petroleumvessels for each of the five types of petroleum liquids (p) at each emission point. It should benoted that these factors are for dispensed product at 60�F and can be adjusted for significantlydifferent conditions using original derivation methods in AP-42. It should also be noted thatsome emission factors may not apply to a particular port, e.g., barge loading or ballasting, maynot take place.
In Section 2.2.2 of this chapter, ballasting practices are discussed. If ballasting only occursusing segregated ballast tanks, it is not necessary to estimate ballasting emissions. However, ifballasting uses the empty cargo tank, emissions will occur, and must be calculated. Note that thecalculation for ballasting emissions in the equation includes a correction term of 0.30. Thiscorrection term reflects the practice of loading a ship or barge at some fraction of capacity whenballasting. Emission estimates will be improved if local information about typical percentagescan be located and used. The correction term presented here represents a conservativeassumption.
Apply any control efficiency to the appropriate terms in Equation 12.4-1, or Equation 12.4-2 canbe used to apply control efficiency.
where:
PVp = Total VOC emissions from petroleum vessel loading, ballasting, andtransit for each of the petroleum liquids (p) transported: crude oil,gasoline, kerosene, distillate oil, and residual oil (tons)
PPB,p = Amount of petroleum liquid (p) loaded into barges in the inventory region(1,000 gallons)
BLEFp = Ballasting emission factor (pounds VOC per 1,000 gallons water ballasted)PPBL,p = Amount of petroleum liquid (p) unloaded from vessels that are ballasted
(1,000 gallons)
CHAPTER 12 - MARINE VESSEL LOADING, BALLASTING, AND TRANSIT 1/31/01
12.4-10 EIIP Volume III
PPC�PPU�(1�CE/100) (12.4-2)
TREFp = Vessel transit emission factor (pounds VOC per week per 1,000 gallonstransferred)
PPT,p = Amount of petroleum liquid (p) transported by marine vessels in theinventory region (1,000 gallons)
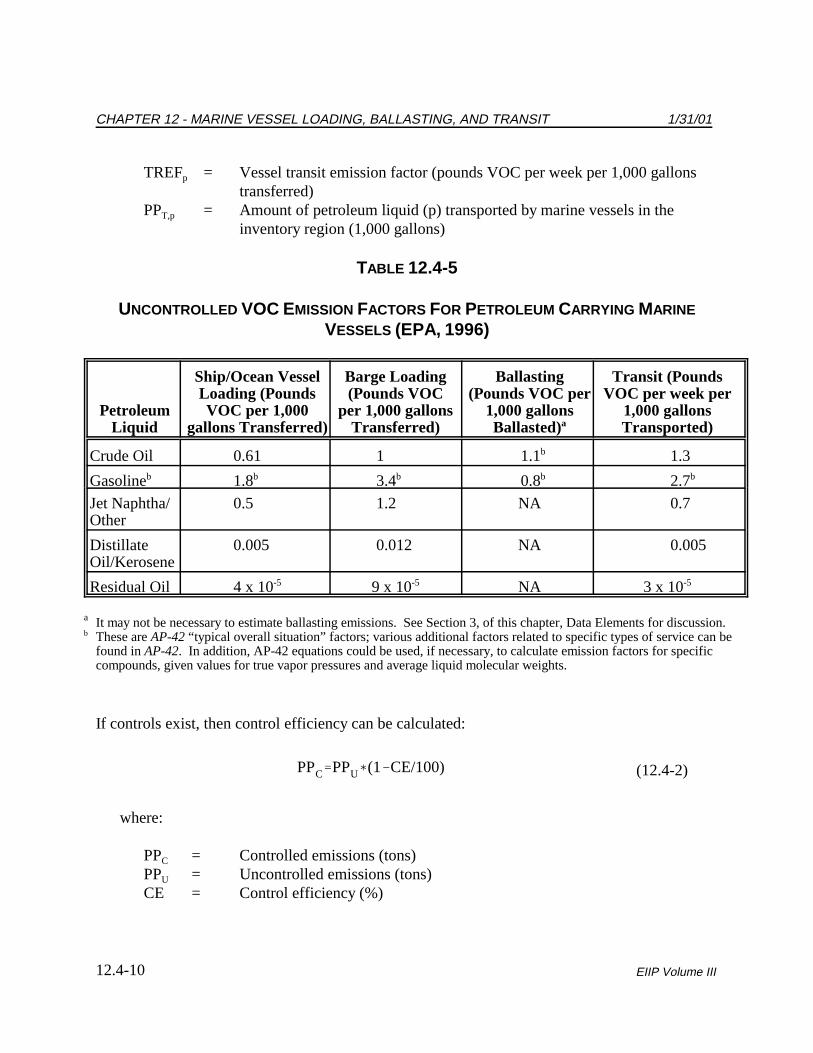
TABLE 12.4-5
UNCONTROLLED VOC EMISSION FACTORS FOR PETROLEUM CARRYING MARINE
VESSELS (EPA, 1996)
PetroleumLiquid
Ship/Ocean VesselLoading (PoundsVOC per 1,000
gallons Transferred)
Barge Loading(Pounds VOC
per 1,000 gallonsTransferred)
Ballasting(Pounds VOC per
1,000 gallonsBallasted)a
Transit (PoundsVOC per week per
1,000 gallonsTransported)
Crude Oil 0.61 1 1.1b 1.3
Gasolineb 1.8b 3.4b 0.8b 2.7b
Jet Naphtha/Other
0.5 1.2 NA 0.7
Distillate Oil/Kerosene
0.005 0.012 NA 0.005
Residual Oil 4 x 10⁻⁵ 9 x 10⁻⁵ NA 3 x 10⁻⁵
a It may not be necessary to estimate ballasting emissions. See Section 3, of this chapter, Data Elements for discussion.b These are AP-42 “typical overall situation” factors; various additional factors related to specific types of service can be
found in AP-42. In addition, AP-42 equations could be used, if necessary, to calculate emission factors for specificcompounds, given values for true vapor pressures and average liquid molecular weights.
If controls exist, then control efficiency can be calculated:
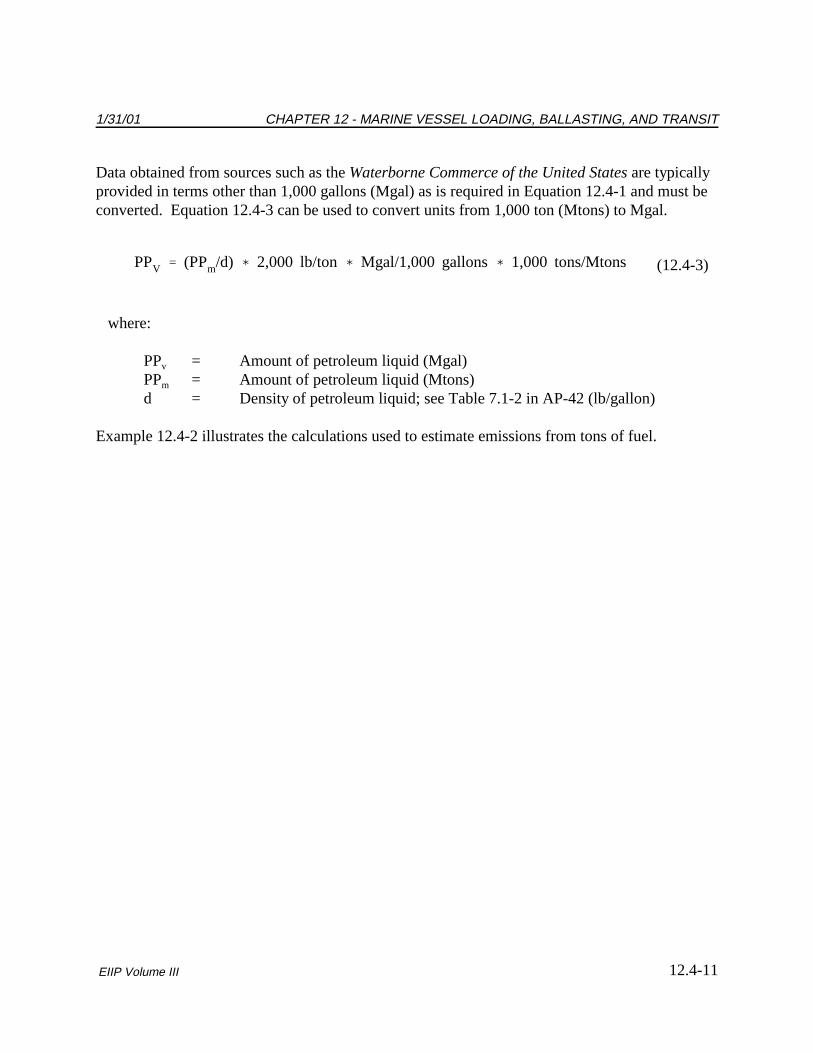
Data obtained from sources such as the Waterborne Commerce of the United States are typicallyprovided in terms other than 1,000 gallons (Mgal) as is required in Equation 12.4-1 and must beconverted. Equation 12.4-3 can be used to convert units from 1,000 ton (Mtons) to Mgal.
where:
PPv = Amount of petroleum liquid (Mgal)PPm = Amount of petroleum liquid (Mtons)d = Density of petroleum liquid; see Table 7.1-2 in AP-42 (lb/gallon)
Example 12.4-2 illustrates the calculations used to estimate emissions from tons of fuel.
CHAPTER 12 - MARINE VESSEL LOADING, BALLASTING, AND TRANSIT 1/31/01
12.4-12 EIIP Volume III
PPv � [2,178 Mtons/(5.6 lb/gal)]�2,000 lb
ton�
Mgal1,000 gal
�
1,000 tonsMtons
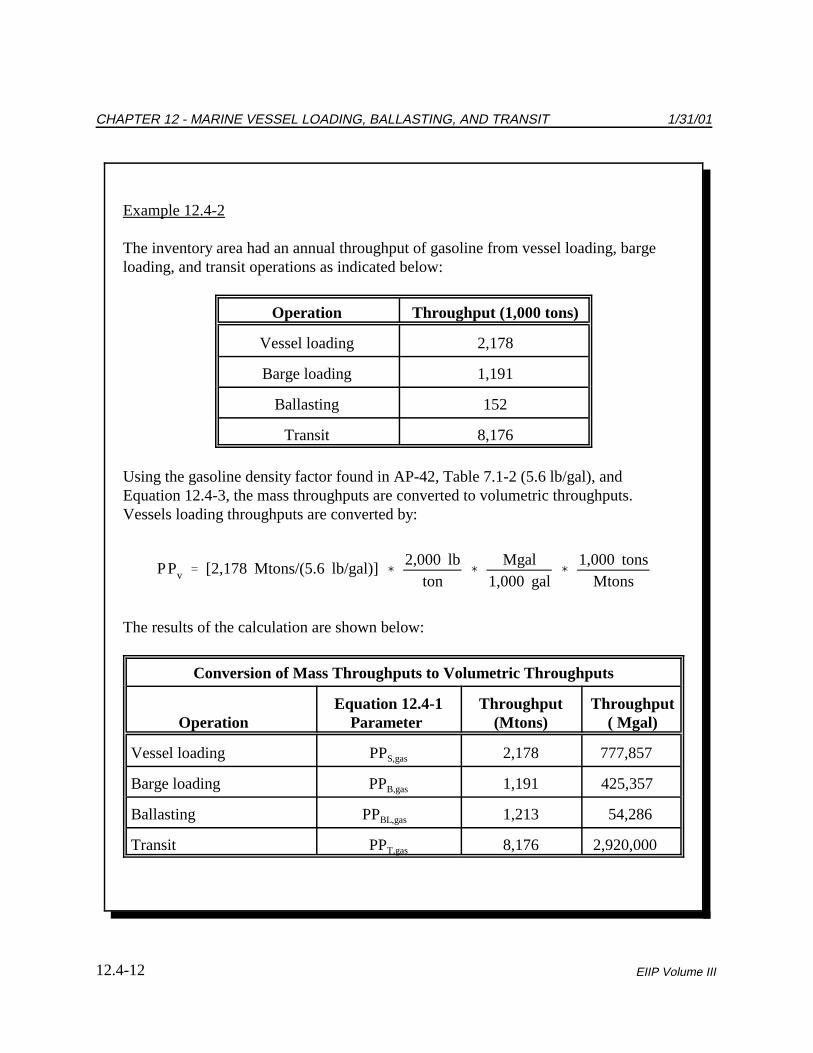
Example 12.4-2
The inventory area had an annual throughput of gasoline from vessel loading, bargeloading, and transit operations as indicated below:
Operation Throughput (1,000 tons)
Vessel loading 2,178
Barge loading 1,191
Ballasting 152
Transit 8,176
Using the gasoline density factor found in AP-42, Table 7.1-2 (5.6 lb/gal), andEquation 12.4-3, the mass throughputs are converted to volumetric throughputs. Vessels loading throughputs are converted by:
The results of the calculation are shown below:
Conversion of Mass Throughputs to Volumetric Throughputs
Operation Equation 12.4-1
Parameter Throughput (Mtons)
Throughput ( Mgal)
Vessel loading PPS,gas 2,178 777,857
Barge loading PPB,gas 1,191 425,357
Ballasting PPBL,gas 1,213 54,286
Transit PPT,gas 8,176 2,920,000
1/31/01 CHAPTER 12 - MARINE VESSEL LOADING, BALLASTING, AND TRANSIT
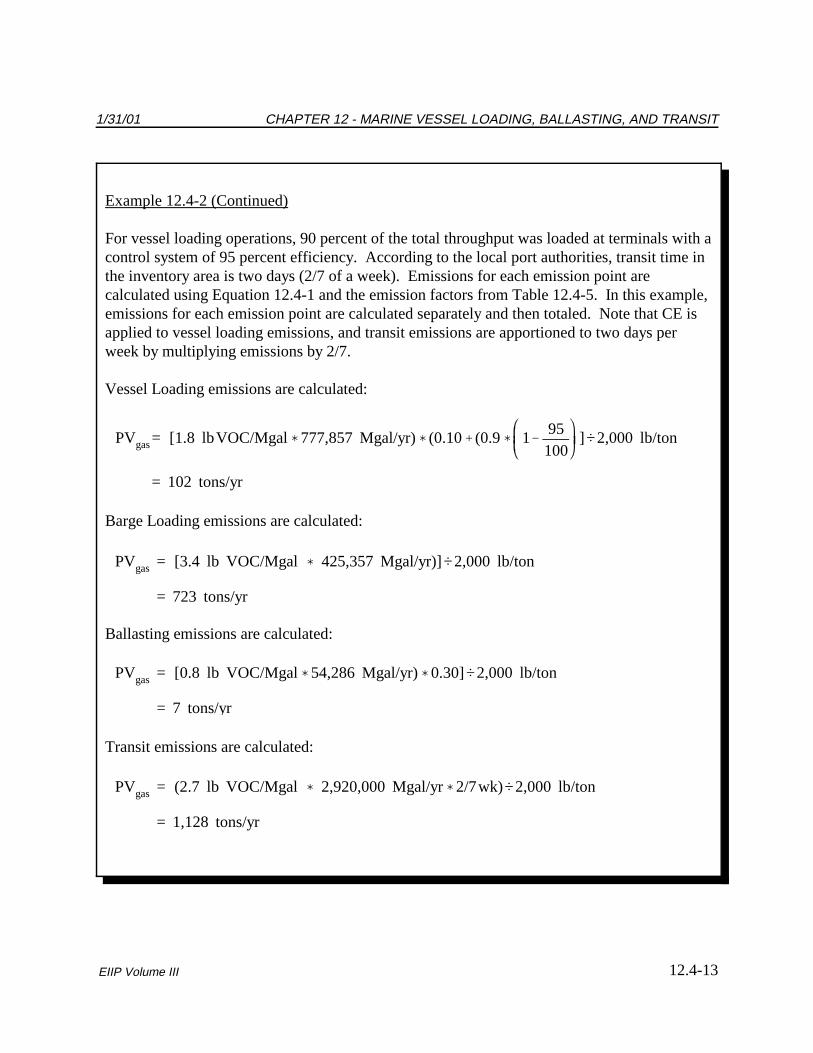
For vessel loading operations, 90 percent of the total throughput was loaded at terminals with acontrol system of 95 percent efficiency. According to the local port authorities, transit time inthe inventory area is two days (2/7 of a week). Emissions for each emission point arecalculated using Equation 12.4-1 and the emission factors from Table 12.4-5. In this example,emissions for each emission point are calculated separately and then totaled. Note that CE isapplied to vessel loading emissions, and transit emissions are apportioned to two days perweek by multiplying emissions by 2/7.
Vessel Loading emissions are calculated:
Barge Loading emissions are calculated:
Ballasting emissions are calculated:
Transit emissions are calculated:
CHAPTER 12 - MARINE VESSEL LOADING, BALLASTING, AND TRANSIT 1/31/01
12.4-14 EIIP Volume III
Total VOC = 102 tons/yr� 723 tons/yr�7 tons/yr� 1,128 tons/yr
= 1,957 tons/yr
1,957 tons/yr�82 tons/yr�1,875 tons/yr
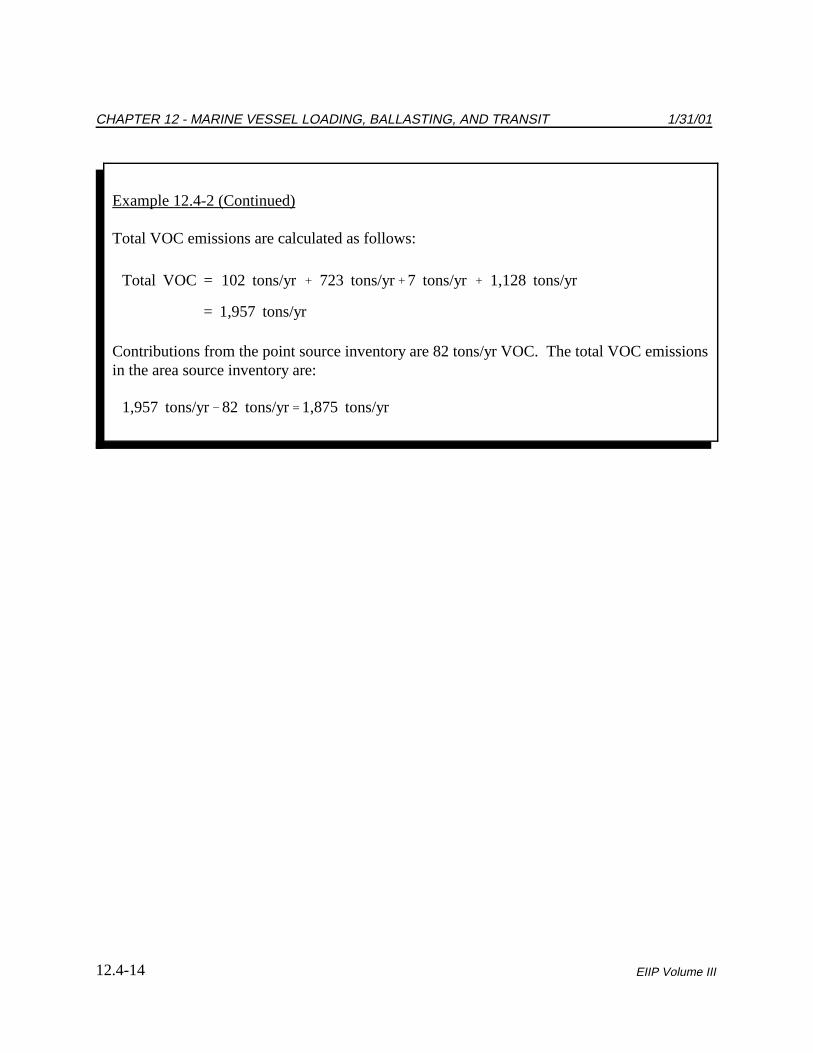
Example 12.4-2 (Continued)
Total VOC emissions are calculated as follows:
Contributions from the point source inventory are 82 tons/yr VOC. The total VOC emissionsin the area source inventory are:
12.5-1EIIP Volume III
5
ALTERNATIVE METHODS FORESTIMATING EMISSIONSNo alternative methods are known to exist, nor are any necessary since the preferred method and dataassociated with it can be used for any type of vessel, any type of traffic, any type of fuel, and any areaof the United States serviced by petroleum vessels.
CHAPTER 12 - MARINE VESSEL LOADING, BALLASTING, AND TRANSIT 1/31/01
12.5-2 EIIP Volume III
This page is intentionally left blank.
12.6-1EIIP Volume III
6
QUALITY ASSURANCE/QUALITY CONTROLData collection and handling for the marine vessel loading, ballasting, and transit source categoryshould be planned and documented in the Quality Assurance Plan. In particular, material typeassignments and emission estimation calculations should be reviewed as part of the QA/QCprocedures. Refer to the discussion of inventory planning and QA/QC in Chapter 1, Introductionto Area Source Emission Inventory Development, of this volume, and the QA volume (VI) of theEIIP series.
6.1 EMISSION ESTIMATE QUALITY INDICATORS
One method is provided in this chapter for estimating emissions from marine vessel loading,ballasting, and transit. Data collection for this source category involves identifying the mostsuitable data source from those listed in Section 4 of this chapter, and compiling the information. Although data collection for this category can require a significant amount of effort, the qualityof the activity data is high, and the effort required may be justified by the importance of theestimated emissions in areas where there is a significant amount of marine vessel loading,ballasting, and transit.
6.1.1 DATA ATTRIBUTE RATING SYSTEM (DARS) SCORES
The Data Attribute Rating System (DARS) has been developed as a tool to rate emissioninventories. A description of the system and the EIIP recommendations for its use can be foundin Appendix F of EIIP Volume VI, Quality Assurance Procedures. The following discussionuses the DARS rating system as a way to compare the estimation approaches presented in thischapter and analyze their strengths and weaknesses.
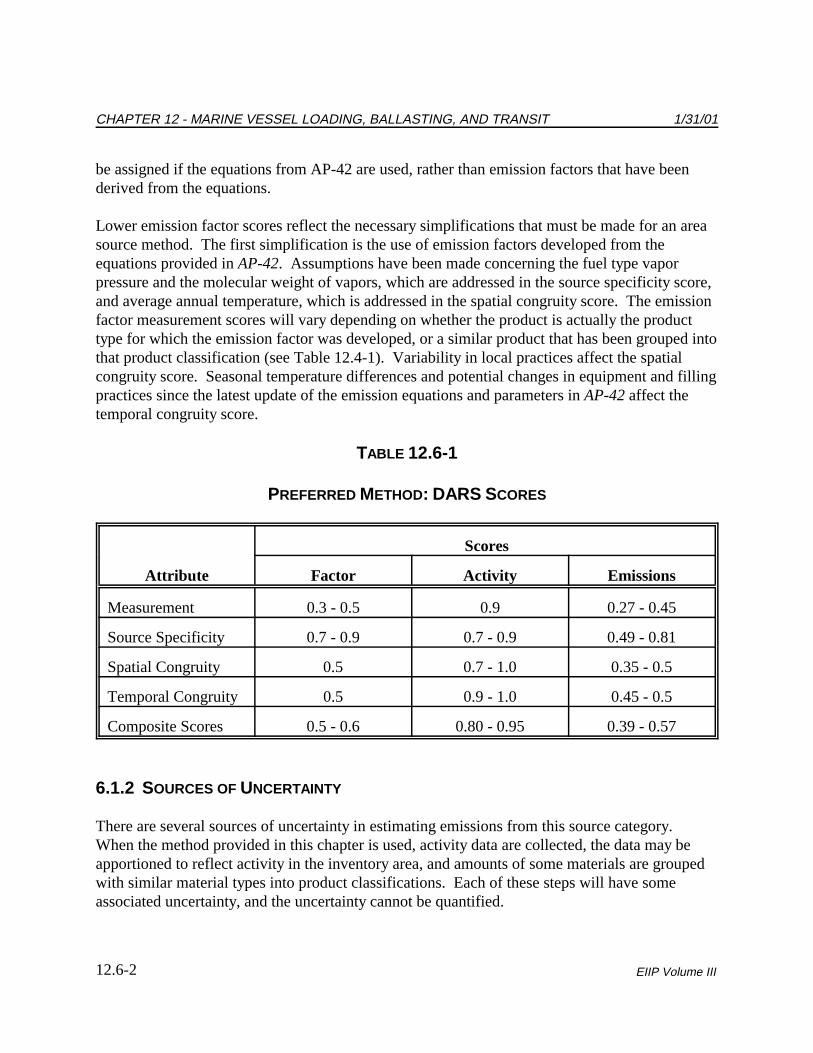
The DARS scores for the preferred method are summarized in Table 12.6-1. A range of scores isprovided to account for differences in the implementation of the method. Lower activity scoresare shown for activity data that are not drawn from records collected specifically for theinventory area. This would be the case if specific product data are not available for the inventoryarea and the tonnage of each product loaded or unloaded in the inventory area must beapportioned from regional data. Higher DARS scores than those assigned in Table 12.6-1 could
CHAPTER 12 - MARINE VESSEL LOADING, BALLASTING, AND TRANSIT 1/31/01
12.6-2 EIIP Volume III
be assigned if the equations from AP-42 are used, rather than emission factors that have beenderived from the equations.
Lower emission factor scores reflect the necessary simplifications that must be made for an areasource method. The first simplification is the use of emission factors developed from theequations provided in AP-42. Assumptions have been made concerning the fuel type vaporpressure and the molecular weight of vapors, which are addressed in the source specificity score,and average annual temperature, which is addressed in the spatial congruity score. The emissionfactor measurement scores will vary depending on whether the product is actually the producttype for which the emission factor was developed, or a similar product that has been grouped intothat product classification (see Table 12.4-1). Variability in local practices affect the spatialcongruity score. Seasonal temperature differences and potential changes in equipment and fillingpractices since the latest update of the emission equations and parameters in AP-42 affect thetemporal congruity score.
There are several sources of uncertainty in estimating emissions from this source category. When the method provided in this chapter is used, activity data are collected, the data may beapportioned to reflect activity in the inventory area, and amounts of some materials are groupedwith similar material types into product classifications. Each of these steps will have someassociated uncertainty, and the uncertainty cannot be quantified.
1/31/01 CHAPTER 6 - QUALITY ASSURANCE/QUALITY CONTROL
12.6-3EIIP Volume III
An additional source of uncertainty comes from using emission factors rather than equations thatuse a number of parameters. In this case, the sensitivity of the equations to different parameterscould be quantified using typical sensitivity analysis techniques.
CHAPTER 12 - MARINE VESSEL LOADING, BALLASTING, AND TRANSIT 1/31/01
12.6-4 EIIP Volume III
This page is intentionally left blank.
12.7-1EIIP Volume III
7
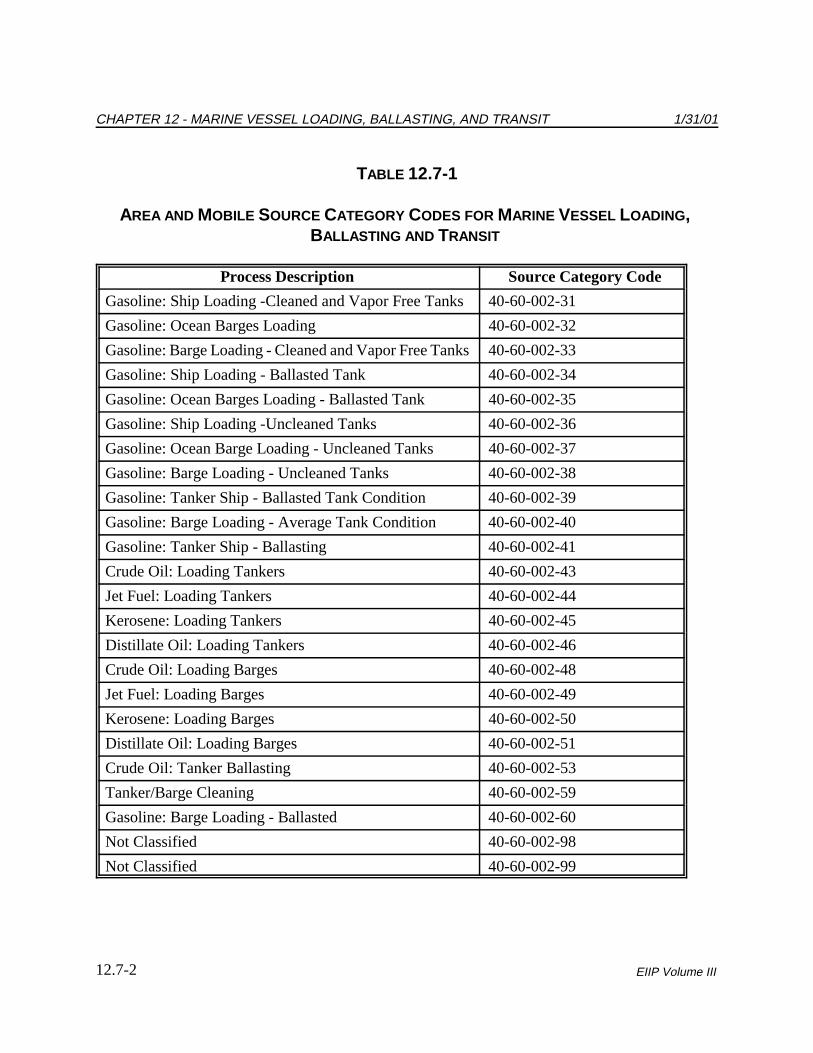
DATA CODING PROCEDURESThe inventory preparer should check the EPA website (http://www.epa.gov/ttn/chief/) for thelatest information (codes) available to characterize emission estimates from marine vesselloading, ballasting, and transit. A complete list of Source Classification Codes (SCC) can beretrieved at http://www.epa.gov/ttn/chief/codes/. Table 12.7-1 lists the applicable SCCs formarine vessel loading, ballasting, and transit.
Available codes and process definitions influence and help guide the preparation of emissionestimates for this category. Data transfer formats should be taken into account when aninventory preparer plans for data collection, calculation, and inventory presentation. Consistentcategorization and coding will result in greater continuity between emission inventories for use inregional and national scale analyses.
7.1 NECESSARY DATA ELEMENTS
If the category emissions data will be transferred to EPA for incorporation into the nationalcriteria and toxics air pollutant inventory, specific data transfer formats are acceptable. Theacceptable data transfer format(s) are described and available for download athttp://www.epa.gov/ttn/chief/net/. The acceptable data transfer formats contain the data elementsnecessary to complete the data set for use in regional or national air quality and human exposuremodeling. The inventory preparer should review the area source portion of the acceptable fileformat(s) to understand the necessary data elements. The EPA describes its use and processingof the data for purposes of completing the national inventory, in its Data Incorporation Plan, alsolocated at http://www.epa.gov/ttn/chief/net/.
CHAPTER 12 - MARINE VESSEL LOADING, BALLASTING, AND TRANSIT 1/31/01
12.7-2 EIIP Volume III
TABLE 12.7-1
AREA AND MOBILE SOURCE CATEGORY CODES FOR MARINE VESSEL LOADING, BALLASTING AND TRANSIT
Process Description Source Category Code
Gasoline: Ship Loading -Cleaned and Vapor Free Tanks 40-60-002-31
Gasoline: Ocean Barges Loading 40-60-002-32
Gasoline: Barge Loading - Cleaned and Vapor Free Tanks 40-60-002-33
Gasoline: Ship Loading - Ballasted Tank 40-60-002-34
Gasoline: Ocean Barges Loading - Ballasted Tank 40-60-002-35
Gasoline: Tanker Ship - Ballasted Tank Condition 40-60-002-39
Gasoline: Barge Loading - Average Tank Condition 40-60-002-40
Gasoline: Tanker Ship - Ballasting 40-60-002-41
Crude Oil: Loading Tankers 40-60-002-43
Jet Fuel: Loading Tankers 40-60-002-44
Kerosene: Loading Tankers 40-60-002-45
Distillate Oil: Loading Tankers 40-60-002-46
Crude Oil: Loading Barges 40-60-002-48
Jet Fuel: Loading Barges 40-60-002-49
Kerosene: Loading Barges 40-60-002-50
Distillate Oil: Loading Barges 40-60-002-51
Crude Oil: Tanker Ballasting 40-60-002-53
Tanker/Barge Cleaning 40-60-002-59
Gasoline: Barge Loading - Ballasted 40-60-002-60
Not Classified 40-60-002-98
Not Classified 40-60-002-99
12.8-1EIIP Volume III
8
REFERENCESEPA. 1995. Compilation of Air Pollution Emission Factors - Volume 1: Stationary Point andArea Sources. Fifth Edition, Supplements A-F, AP-42. U.S. Environmental Protection Agency,Office of Air Quality Planning and Standards. (GPO 055-000-00251-7). Research TrianglePark, North Carolina. (www.epa.gov/ttn/chief/ap42/)
EPA. 1993. Methodologies for Estimating Air Emissions from Three Non-Traditional SourceCategories: Oil Spills, Petroleum Vessel Loading and Unloading, and Cooling Towers. U.S.Environmental Protection Agency, Office of Research and Development. EPA-600/R-93-063(NTIS PB93-181592). Washington, DC.
EPA. 1999. AIRS Point, Area, and Mobile Source Category Codes. U.S. EnvironmentalProtection Agency, Office of Air Quality Planning and Standards. Research Triangle Park, NorthCarolina. (www.epa.gov/ttn/chief/scccodes.html)
EPA. 1989. Procedures for Estimating and Applying Rule Effectiveness in Post-1987 Base YearEmission Inventories for Ozone and Carbon Monoxide State Implementation Plans. U.S.Environmental Protection Agency. Research Triangle Park, North Carolina.
DOE. 1989. Petroleum Storage and Transportation, Volume II: System Dynamics. NationPetroleum Council, U.S. Department of Energy. Washington, DC.
U.S. Maritime Administration. 1985. Domestic Waterborne Trade of the U.S. U.S. MaritimeAdministration, Office of Domestic Shipping. Washington, DC.
CHAPTER 12 - MARINE VESSEL LOADING, BALLASTING, AND TRANSIT 1/31/01
12.8-2 EIIP Volume III
This page is intentionally left blank.
1/31/01 CHAPTER 12 - MARINE VESSEL LOADING, BALLASTING, AND TRANSIT
EIIP Volume III
Appendix A
Example Waterborne Commerce Data
12.A-1EIIP Volume III
EXAMPLE AREA A
Section Included: Gulf of Mexico to turning basins at West Port Arthur, Beaumont, and Orange, TX, about 85.8 miles;Adams Bayou Channel, about 1.6 miles; and Cow Bayou Channel, about 7 miles. Controlling Depth: Sabine PassChannel, TX, 40 feet; Port Arthur, TX, 37 feet; Beaumont, TX, 39 feet; extension to Bethlehem Steel Shipyard, 32 feet;Orange, TX, 27 feet except channel around Harbor Island, 20 feet; Adams Bayou Channel, 9 feet; and CowBayou Channel, 8 feet. Project Depth: Sabine Pass Harbor, TX, 40 to 42 feet; Port Arthur, TX, 40 feet; Beaumont,TX,40 feet except turning basin, 34 feet, and extension to Bethlehem Steel Shipyard, 30 feet; Orange, TX, 30 feetexcept channel around Harbor Island, 25 feet, Adams Bayou, 12 feet, and Cow Bayou, 13 feet, mean low tide.
Comparative Statement of Traffic(thousand tons)
Year Total Year Total
19861987198819891990
75,94379,74289,09196,56490,819
19911992199319941995
84,21388,34895,19199,675103,254
Freight Traffic, 1995(thousand tons)
Commodity Total Foreign CanadianImports Exports Imports Exports
Total, all commodities 49,124 40,724 8,178 167 55
Total petroleum and petroleum products 44,305 39,886 4,203 161 55
2430 asphalt, tar & pitch2540 petroleum coke2640 liquid natural gas
433,676
158
2241131
413,380
27
------------------------------------
------------55
------------
Total chemicals and related products 757 33 724 ------------ ------------
Subtotal fertilizers3190 fert. & mixes nec
1212
------------------------
1212
------------------------
------------------------
Subtotal other chemicals and related products3211 acyclic hydrocarbons3212 benzene & toluene3219 other hydrocarbons3220 alcohols3240 nitrogen func. comp