Page 1
8/6/2019 Meaning of Working Capital
http://slidepdf.com/reader/full/meaning-of-working-capital 1/66
1
CHAPTER: 1
INTRODUCTION
1.1 ABOUT THE STUDY
Meaning of Working Capital:
Working capital in general practice refers to the excess of
current assets over current liabilities. The basic goal of working capital
management is to manage the current assets and current liabilities of a firm in
such a way that satisfactory level of working capital is maintained. This is to
because both inadequate as well as excessive working capital positions are bad
for any business. Capital require for a business can be classified under two
main categories:-(a).fixed capital, (b).working capital.
Every business needs funds for two purposes for its
establishment and to carry our it’s day-to-day operations. Long-term funds are
required to create production facilities through purchase of fixed assets such as
plant and machinery, land, building, furniture etc.
Definition:
In the words of shubin, “working capital is the amount of
funds necessary to cover the cost of operating the enterprise”.
Concept of working capital:
There are two concept of working capital:
(a) Balance sheet concept,
(b) Operating cycle or circular flow concept.
(a).Balance Sheet Concept:
There are two interpretations of working capital under the
balance sheet concept:
1. Gross working capital,
2. Net working capital.
Page 2
8/6/2019 Meaning of Working Capital
http://slidepdf.com/reader/full/meaning-of-working-capital 2/66
2
In the broad sense, the term working capital refers to the gross
working capital and represents the amount of funds invested in current assets.
This, the gross working capital is the capital invested in total current assets of
the enterprise.
(b).Operating cycle or circular flow concept:
As discussed earlier, working capital refers to that part of
firm’s capital which is required for financing short-term or current assets keep
revolving fast and are being constantly converted into cash and this cash flow.
Hence, it is also known as revolving or circulating capital.
(Working capital cycle: circular flow concept)
Kinds of working capital:
Wording capital may be classified in two ways:
(a)On the basis of concept
(b)On the basis of time.
Cash
Raw materialsDebtors
(Receivables)
Work in progressSales
Finished
goods
NET WORKING CAPITAL=CURRENT ASSETS-CURRENT LIABILITIES.
Page 3
8/6/2019 Meaning of Working Capital
http://slidepdf.com/reader/full/meaning-of-working-capital 3/66
3
1. Permanent or Fixed working capital:
Permanent or fixed working capital is the minimum
amount which is required to ensure effective utilization of fixed facilities and
for maintaining the circulation of current assets. There is always a min mum
level of current assets which is continuously required by his enterprise to carry
out its normal business operations. As the business grows, the requirements of
permanent working capital also increase due to the increase in current assets.
2. Temporary or Variable working capital:
Temporary or variable working capital is the amount of working capital which is required to meet the seasonal demands and some
special exigencies. Variable working capital can be further classified as
seasonal working capital and special working capital. Most of the enterprises
have to provide additional working capital to meet the seasonal and special
needs. The capital required to meet the seasonal needs of the enterprise is
called seasonal working capital.
KINDS OF WORKING CAPITRAL
On the basic of concept On the basic of time
Gross working
capital
Net working
capital
Temporary or variable
working capital
Regular working
capital
Permanent or fixed working
capital
Reserve working
capital
Seasonal working
capital
Special working
capital
Page 4
8/6/2019 Meaning of Working Capital
http://slidepdf.com/reader/full/meaning-of-working-capital 4/66
4
Importance or advantage of adequate working capital:
The main advantages of maintaining adequate amount of
working capital are as follows:
1. Solvency of the Business:
Adequate working capital helps in maintaining solvency of the
business by providing uninterrupted flow of production.
2. Goodwill:
Sufficient working capital enables a business concern to make
prompt payments and hence helps in creating and maintaining goodwill.
3. Easy Discounts:
A concern having adequate working capital, high solvency and
good credit standing can arrange loans from banks and others on easy and
favorable terms.
4. Cash Discount:
Adequate working capital also enables a concern to avail cash
discounts on the purchases and hence it reduces costs.
5. Regular supply of Raw Materials:
Sufficient working capital ensures regular supply of raw
materials and continuous production.
6. Regular payment of Salaries, Wages and Other day-to-day
commitments:
A company which has ample working capital can makeregular payment of salaries, wages and other day-to day commitments which
raises the morale of its employees, increases their efficiency, reduces wastages
and costs and enhances production and profits.
Page 5
8/6/2019 Meaning of Working Capital
http://slidepdf.com/reader/full/meaning-of-working-capital 5/66
5
Excess or inadequate working capital:
Every business concern should have adequate wording capital
to run its business operations. It should have neither redundant or excess
working capital nor inadequate nor shortage of working capital. Both excess as
well as short working capital positions are bad for any business. However,
ought of the two, it is the inadequacy of working capital which is more
dangerous from the point of view of the firm.
FACTORS DETERMINING THE WORKING CAPITAL
REQUIREMENTS:
The following are important factors generally influencing the
working capital requirements.
1. Nature or character of Business:
The working capital requirements of a firm basically depend
upon the nature of its business. Public utility undertakings like electricity,
water supply and railways need very limited working capital because they
offer cash sales only and supply services, not products, and as such no funds
are tied up in inventories and receivables.
2. Size of Business/scale of operations:
The working capital requirements of a concern are directly
influenced by the size of its business which may be measured in terms of scale
of operations. Greater the size of a business unit, generally larger will be therequirements of working capital.
3. Production policy:
In certain industries the demand is subject to wide
fluctuations due to seasonal variations. The requirements of working capital,
in such cases, depend upon the production policy.
Page 6
8/6/2019 Meaning of Working Capital
http://slidepdf.com/reader/full/meaning-of-working-capital 6/66
6
4. Manufacturing process/Length of production cycle:
In manufacturing business, the requirements of working
capital increase in direct proportion to length of manufacturing process.
Longer the process period of manufacture, larger is the amount of working
capital required.
5. Seasonal Variations:
In certain industries raw material is not available throughout
the year. They have to buy raw materials in bulk during the season to ensure
an uninterrupted flow and process them during the entire year.
6. Rate of Stock Turnover:
There is a high degree of inverse co-relationship between the
quantum of working capital and the velocity or speed with which the sales are
affected. A firm having a high rate of stock turnover will need lower amount
of working capital as compared to a firm having a low rate of turnover.
7. Credit Policy:
The credit policy of a concern in its dealings with debtors
and creditors influence considerably the requirements of working capital. A
concern that purchases its requirements on credit and sells its
products/services on cash requires lesser amount of working capital.
8. Business Cycle:
Business cycle refers to alternate expansion and
contraction in general business activity. In a period of boom i.e., when the
business is prosperous there is a need for larger amount of working capital due
to increase in sales.
Page 7
8/6/2019 Meaning of Working Capital
http://slidepdf.com/reader/full/meaning-of-working-capital 7/66
7
9. Rate of Growth of Business:
The working capital requirements of a concern increase with
the growth and expansion of its business activities. Although, it is difficult to
determine the relationship between the growth in the volume of business and
the growth in the working capital of a business.
10. Earning capacity and Dividend Policy:
Some firms have more earning capacity than others due to
quality of their products, monopoly conditions, etc. such firms with high
earning capacity may generate cash profits from operations and contribute to
their working capital.
Management of working capital:
Working capital, in general practice, refers to the excess
of current assets over current liabilities. Management of working capital
therefore, is concerned with the problems that arise in attempting to manage
the current assets, the current liabilities and the inter-relationship that exists
between them. In other words it refers to all aspects of administration of both
current assets and current liabilities.
Working capital management is three dimensional in nature:
(a) Dimension I
It is concerned with the formulation of policies with regard to
profitability, risk and liquidity.(b) Dimension II
It is concerned with the decisions about the composition and
level of current assets.
(c) Dimension III
It is concerned with the decisions about the composition and
level of current liabilities.
Page 8
8/6/2019 Meaning of Working Capital
http://slidepdf.com/reader/full/meaning-of-working-capital 8/66
8
Principles of working capital management policy:
1. Principle of Risk Variation:
Risk here refers to the inability of a firm to meet its
obligations as and when they become due for payment. Larger investment in
current assets with less dependence on short-term borrowings increases the
opportunity for gain or loss.
2. Principle of Cost of Capital:
The various sources of raising working capital finance have
different cost of capital and the degree of risk involved. Generally, higher the
risk lower is the cost and lower the risk higher is the cost. A sound working
capital management should always try to achieve a proper balance between
these two
3. Principle of Equity Position:
This principle is concerned with planning the total
investment in current assets. According to this principle, the amount of
working capital invested in each component should be adequately justified by
a firm’s equity position.
4. Principle of Maturity of Payment:
This principle is concerned with planning the sources of finance for working capital. According to this principle, a firm should make
every effort to relate maturities of payment to its flow of internally generated
funds.
Page 9
8/6/2019 Meaning of Working Capital
http://slidepdf.com/reader/full/meaning-of-working-capital 9/66
9
1.2 ABOUT THE INDUSTRY
Indians are familiar with iron and steel during Vedic age more than
4000 years ago. It is evident from the iron pillar at the outskirts of Delhi, but
the seeds of modern steel industry were shown by sir. Jamshedji Tata in 1907,
when Tata Iron and Steel Company (TISCO) was set up. The first steel ingots
were rolled in TISCO in 1911. This was followed by the establishment of the
Mysore Iron and Steel Works in 1936, later renamed as Viswesvaraya Iron
and Steel Works. Three years later in 1939 production of steel started in
another private company, The Indian Iron and Steel Company now a
subsidiary of Steel Authority of India Limited (SAIL).
Growth
In the era of planned economy, iron and steel, a core basic sector
received the full attention of the Government. It becomes a key sector for
public investment for the first Five Year Plan itself. The year 1953 saw the
first agreement being signed with the Germans to establish a one million tones
at Rourkela in Orissa .Two more agreements of setting up plans, at Bhilay
with the erstwhile U.S.S.R’s assistance another at Durgapur with the help of
U.K were signed in 1956. Success of capacity augmentations at Bhilay,
Durgapur and Rourkela, so their capacity increased to 2.5, 1.6, 1.8 million
tones per annum respectively by the end of 60’s.
A new plant at Bokaro with a capacity of 2.5 million tones per annum
went into production 1973–74. The year 1978 witnessed a major restructuring
of the steel making public sector units giving birth to the public sector giants,
SAIL, having “Navaratna” status today, with an aggregate capacity over a 10
million tones. The first shore based public sector integrated steel plant
Page 10
8/6/2019 Meaning of Working Capital
http://slidepdf.com/reader/full/meaning-of-working-capital 10/66
10
through. The Rashtriya Ispat Nigam Limited of 3 million tones per annum
went into production August 1992.
Until the 1990’s the iron and steel sector was by and large the
exclusive preserves of only the public sector, the sole exception being TISCO,
the new economic policy announced in 1991 was no doubt a significant
milestone in the evolution of Indian economy. The process of economic
reforms ushered in substantial liberalization of the policies and institutions
governing trade, industry and finance. With this complexion of Indian Iron
and Steel Industry has undergone a sea change.
Iron and steel industry became one of the foremost sectors to be
opened under the New Economic Policy. Substantial private investments
flowed in with the consequent changes heralding. A new beginning for
interplay of free market enterprise in this vital section.
Changes
A glance at the pre and post 1991 era reveals some interesting and
significant structural changes. At the consumer or demand end, the market for
steel has been transformed from a seller to a buyer market. Control and
regulation have been replaced by competition. Administered prices have been
replaced by supply and demand determined market prices. There has been a
clear focus on the state of art technology. India can boast new technology like
corex, thin slab casting and compact scrip mill technology, DC electric Arc
Furnaces, Twin shells, AC EAF’s etc. in the steel industry. The industry has tofocus on customer satisfaction and outstanding quality of steel products in
competitive environment. Steel produces in public and private sector have
taken upon determination and commitment to overcome the new and arduous
challenges to come up to the governments expectations has also the people of
our country in the most difficult and trying period for the last couple of years.
Production
Page 11
8/6/2019 Meaning of Working Capital
http://slidepdf.com/reader/full/meaning-of-working-capital 11/66
11
The production of finished steel increased from 14.33 million tones in
1991- 92 to 1998- 99. The private sector contribution in the availability of
finished steel has been constantly increasing. From 51.4% in 1991- 92 it
increased to over 68% in 1998-99 this trend is likely to continue.
Export
Although India started steel production as early as in 1911 still exports
began only 1964. Exports in the first five years increased due to demand down
term in the domestic iron and steel market. Once domestic demand revived,
exports declined. India once again started exporting steel in 1975, touching a
figure of one million tones of pig iron and 1.4 million tonnes of steel exports
in 1976-77. Thereafter exports again fell rapidly to meet challenges arising
from increased demand.
Steel industry is a booming in the whole world the increasing demand
for it was mainly generated by the development project that has been going on
along the world, especially the infrastructural works and real estate projects
that has been on the boom around the developing countries. Steel industry was
till recently dominated by the United State of America but this scenario is
changing with a rapid pace with the Indian steel company on an acquisition
spree.
The Asian countries have their respective dominance in the production
of the steel all over the world. India being one among the fastest growingeconomies of the world has been considered as one of the potential global
steel hub internationally. Over the years, particularly after the adoption of the
liberalization policies all over the world, the world steel industry is growing
very fast.
Page 12
8/6/2019 Meaning of Working Capital
http://slidepdf.com/reader/full/meaning-of-working-capital 12/66
12
It has been observed that steel industry has grown tremendously in the
last one and a half a decade with a strong financial condition the increasing
needs of steel by the developing countries for its infrastructural project has
pushed the companies in the industry near their operative capacity.
In the last one year, the world has seen to big M&A deal to take place:
• The Mittal steel, listed in Holland, has acquired the world’s largest
steel company called Marcelo steel to become the world’s largest
producer of steel named Arcelor-Mittal.
• Tata steel of India or TISCO (as listed in BSE) has acquired the
world’s fifth largest steel company, Corus, with the highest ever-stock
price.
The most significant growth that can be seen in the steel industry has
been in the steel industry has been observed during the period 1960 to 1974
when the consumption of steel around the whole world doubled. Between
these years the rate at which the steel industry grew has been recorded to be
5.5%.This roaring market saw a phase of deceleration from the year 1975
which continued till 1982.after this period, the continuous fall slowed down
and again started its upward movement from the early 1990s.
New innovation is also taking place in steel industry for cost
minimization and at the same time production maximization and at the same
time maximization. Some of the cutting edge technologies that are being
implemented in this industry are thin-slab casting, making of steel through the
use of electric furnace, vacuum degassing, etc.
Page 13
8/6/2019 Meaning of Working Capital
http://slidepdf.com/reader/full/meaning-of-working-capital 13/66
13
TABLE NO: 1
COUNTRIES PRODUCING CRUDE STEEL
Rank Country 2007 (In million
tones)
2008 (In million
tones)
World 1,351.3
1 China 494.9 500.5
2 Japan 120.2 118.7
3 United States 98.1 91.4
4 Russia 72.4 68.5
5 India 53.1 55.26 South Korea 51.5 53.6
7 Germany 48.6 45.8
8 Ukraine 42.8 37.1
9 Brazil 33.8 33.7
10 Italy 31.6 30.6
Source: www.worldsteel.org (22 Jan 2009)
CHART NO: 1
SECTOR-WISE CONSUMPTION
COMSUMPTIO
Construction
50%
Engineerin
25%
Automobile
15%
Ship Buildig
5%
Others
3%
Paka
ging
2%
INDIAN ECOMONIC OVERVIEW
Page 14
8/6/2019 Meaning of Working Capital
http://slidepdf.com/reader/full/meaning-of-working-capital 14/66
14
As per the Central Statistical Organization India is the second fastest
growing economy in the world with an 8.7% GDP growth in 2007-08
primarily fuelled by the industry and services sectors. The performance of the
industrial production was largely led by the manufacturing sector, which grew
by 8.1% in 2007-08. During the same period, the six core infrastructure
sectors comprising finished steel, cement, crude petroleum, petroleum
refinery, power and coal grew at the rate of 5.6 %.
INDIAN STEEL INDUSTRY
Riding high on the resurgent economy and rising demand the Indian
steel industry has entered into a new development stage from 2005-06
onwards, with an average growth rate of 12% per annum in steel output, for
the last two years. The steel industry, in general, is on the upswing, due to
strong growth in demand propelled particularly by the demand for steel in
China. The world scenario coupled with strong domestic demand has
benefited the Indian steel industry.
The rapid rise in production has resulted in India becoming the worlds
5th largest producer of steel, up by two places, on the back of 50.71million tons
production of crude steel and 51.9 MT of finished steel. The production of
finished steel grew by 16.52per cent, from 44.54MT in 2006-07. While the
demand for steel for will continue to grow in traditional sectors such as
infrastructure, construction housing automotives, steel tube and pipes,
consumer durable, packaging and ground transportation ,
specialized steel will
be increasingly used in hi-tech engineering industries such as power
generation, petrochemicals, fertilizers, etc.
In the first half of February 2007(April-September), production of
finished carbon steel was estimated at 24.8MT-against 23.25MT in same time
of previous year-recording a growth rate of 6.6%.During this period, pig iron
Page 15
8/6/2019 Meaning of Working Capital
http://slidepdf.com/reader/full/meaning-of-working-capital 15/66
15
production recorded growth of 7.9% at 2.58MT. Presently, the Government
plan to increase production from the present 53MT to 124 MT by 2011 and
200 MT by 2020, so as to narrow the gap between supply and demand.
However, access to coking coal will be the key to success of this strategy.
According to a report by the world steel dynamics (WSD), a leading
global steel information services, the Indian has entered a period of massive
growth not only in steel demand but also in steel making capacities. The origin
of the modern Indian steel industry can be traced back to 1953 when a contract
for the construction of an integrated steelworks in Roukema, Orissa, was
signed between the Indian government and the German companies Fried
Krupp and Demag AG. The initial plant was an annual capacity of 500000
tones, the capacity of Rourkela steel plant(RSP), which belong to the SAIL
(Steel Authority Of India LTD)group, is presently about 2 million tones. At a
very early stage the former USSR and a British consortium also showed an
interest in establishing a modern steel industry in India. This result in the
soviet-aided building of steel mill with a capacity of 1 million tone capacity.SAIL is the largest producer of the steel industry in India.
The Indian steel industry is organized in three categories i.e. ., main
producers, other major producer and the secondary producers. The main
producer and other major producer have integrated steel making facility with
plant capacities over 0.5 MT and utilize iron ore and coal/gas for production of
steel. The main produces are TATA steel, SAIL and RINL. While the other
major producers are ESSAR, ISPAT and JVSL.
The secondary sector is dispersed and consists of:
1) Backward linkage from about 120 sponge iron producer that use iron ore
and non coking coal, providing feedstock for steel producers
Page 16
8/6/2019 Meaning of Working Capital
http://slidepdf.com/reader/full/meaning-of-working-capital 16/66
16
2) Approximately 650 mini blast furnaces, electric arc furnaces, induction
furnace and energy optimizing furnace that use spoiron and melting scrap to
produce steel
3) Forward linkage with about 1200 re-rollers that roll out semi into finished
steel products for consumer use.
The following are the premier steel plants operating in India:-
Salem steel plant at Tamil Nadu
Bhilai Steel Plant at Chhattisgarh
Durgapur Steel Plant at West Bengal
Alloy Steel Plants at West Bengal
Visvesvaraya Iron and Steel Plant in Karnataka
Rourkela Steel Plant at Orissa
Bokaro Steel Plant at Jharkhand
CONSUMPTION
Driven a booing economy and concomitant demand levels
consumption of steel has grown by 12.5%during the last three years, well
above the 6.9 % envisaged in the National steel Policy For 2008 it has been
forest that the apparent steel use point in India will increase by 11.8%in 2008.
Steel consumption amounted to 46.14 in MT in 2006-07, against
41.43MT in 2005-06, recording 11.36%growth –higher than the world
average. During the first half of 2007, steel consumption has grown by 13%.
For the period of April-September 2007-08, the total consumption (excluding
double counting) of steel is 21,998MT as compared to the 19,819MT in the
same period last year (as per data from the joint parliamentary committee).
Page 17
8/6/2019 Meaning of Working Capital
http://slidepdf.com/reader/full/meaning-of-working-capital 17/66
17
1.3 ABOUT THE COMPANY
Minar Steels Pvt. Ltd is the only mini steel plant in Kerala. The
company was originally promoted in the joint sector between Kerala State
Industrial Development Corporation Pvt Ltd. and a private entrepreneur in
1969. Minar steel set up its mini steel plant in 1972 with installed capacity of
37,000 tones p.a. The company commenced commercial production, of Mild,
Medium carbon and spring steel billets of 100 mm sq. in September 1973. As
part of rehabilitation package, raised its shareholding in SCL to more than
50% and thus minar steels, became the subsidiary of in 1979.
In 1983 minar steels undertook expansion scheme by adding the third
electric furnace finance, by which the production capacity was raised to
55,000 tones p.a. The operation of the company then improved and minar
steels earned substantial profits during 1984-8/6.
In July 1986 minar steels took over Malabar Steel Re-rolling Mill (P)
Ltd. (MSRM) located of Malappuram District. As its Rolling mill by way of
forward integration, because of unviable operation company was referred to
BIFR in July 1992. The revival scheme approved by BIFR on 23-05-1995 is in
implementation.
Manufacture of Steel
Steel making by melting various grades of good quality scrap, hot
briquetted iron, iron ore and pig iron and refining the same in electric arc
furnace is adopted in minar steels. The company has 3 electric arc furnaces of
10/12 T capacity each and a twin-strand continuous casting machine designed
by Concast-AG, Zurich, Besides these, the company has various auxiliary
equipments like 25/5 T EOT cranes, water treatment plant, 110/11 KV
substation, fully fledged metallurgical laboratory etc. The steel purchased here
Page 18
8/6/2019 Meaning of Working Capital
http://slidepdf.com/reader/full/meaning-of-working-capital 18/66
18
is strictly confirming to BIS specification falling under mild, medium carbon
and spring steel qualities and is cast into 100 mm sq. Billets. The billets are
further rolled and converted into construction of steel of various sections at
rolling mills.
Product mix
Minar steels markets wide range of products with sizes varying from 6
mm to 40 mm plain rounds and 8 mm to 40 mm dia CTD bars, besides other
sections needed for engineering industry. These are rolled out of 100 mm. sq.
billets manufactured by the company. The rounds/CTD bars are produced
strictly confirming to IS: 226/1786 specifications. Besides mild steel, the
company also produces medium and high carbon billets against firm orders.
Product range
Billets
Continuously cast billets of 100 mm square size in mild/ medium/high
carbon grades.
Quality
During refining, samples are analyzed in the laboratory and the process
is controlled according to the bath sample analysis. Steel produced in the plant
is every time subjected to the most stringent and uncompromising quality
control tests. The company being the holder of ‘A’ Grade BIS License is
authorized to issue certificates confirming to BIS specification. With strict
compliance to the prescribed code of standards, Minar steels Limited has over the years acquired a reputation for quality steel.
Management
Company is professionally managed by a team of experts in the steel
field with adequate support from a committed Board of Directors, Minar Steel
Pvt. Limited has over seventy employees and equal number is employed
Page 19
8/6/2019 Meaning of Working Capital
http://slidepdf.com/reader/full/meaning-of-working-capital 19/66
19
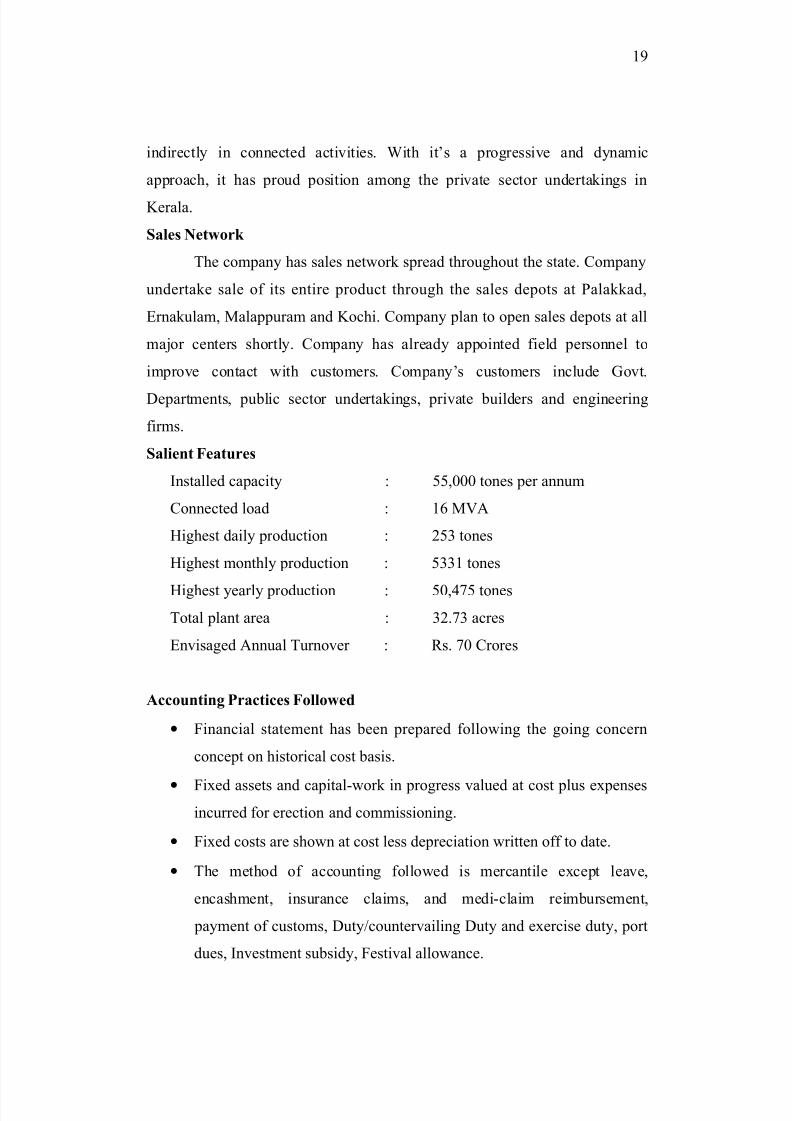
indirectly in connected activities. With it’s a progressive and dynamic
approach, it has proud position among the private sector undertakings in
Kerala.
Sales Network
The company has sales network spread throughout the state. Company
undertake sale of its entire product through the sales depots at Palakkad,
Ernakulam, Malappuram and Kochi. Company plan to open sales depots at all
major centers shortly. Company has already appointed field personnel to
improve contact with customers. Company’s customers include Govt.
Departments, public sector undertakings, private builders and engineering
firms.
Salient Features
Installed capacity : 55,000 tones per annum
Connected load : 16 MVA
Highest daily production : 253 tones
Highest monthly production : 5331 tones
Highest yearly production : 50,475 tones
Total plant area : 32.73 acres
Envisaged Annual Turnover : Rs. 70 Crores
Accounting Practices Followed
• Financial statement has been prepared following the going concern
concept on historical cost basis.
• Fixed assets and capital-work in progress valued at cost plus expenses
incurred for erection and commissioning.
• Fixed costs are shown at cost less depreciation written off to date.
• The method of accounting followed is mercantile except leave,
encashment, insurance claims, and medi-claim reimbursement,
payment of customs, Duty/countervailing Duty and exercise duty, port
dues, Investment subsidy, Festival allowance.
Page 20
8/6/2019 Meaning of Working Capital
http://slidepdf.com/reader/full/meaning-of-working-capital 20/66
20
• Depreciation is provided on straight line method at rate prescribed in
schedule XIV of the companies Act, 1956.
• Valuation of stores, spares, consumables, and loose tools not for resale.
i. Consumption valued at cost.
ii. Inventories as on 31-03-2006 valued at cost.
iii. Good in transit-valued at cost.
iv. Loose tools are written of 100% to P & L a/c.
• Inventory of finished goods including, billets, finished steels and other
valued at last of cost or net realizable value following FIFO method of
valuation.
• Investments are started at cost.
• Rupee exchange variation on foreign currency on imports of raw
materials charged to raw material cost.
• Sale of finished goods within the state includes Excise duty. But
exclude sales tax.
• Vat credits in respect of all materials are adjusted against the purchase
value of respective materials.
Page 21
8/6/2019 Meaning of Working Capital
http://slidepdf.com/reader/full/meaning-of-working-capital 21/66
21
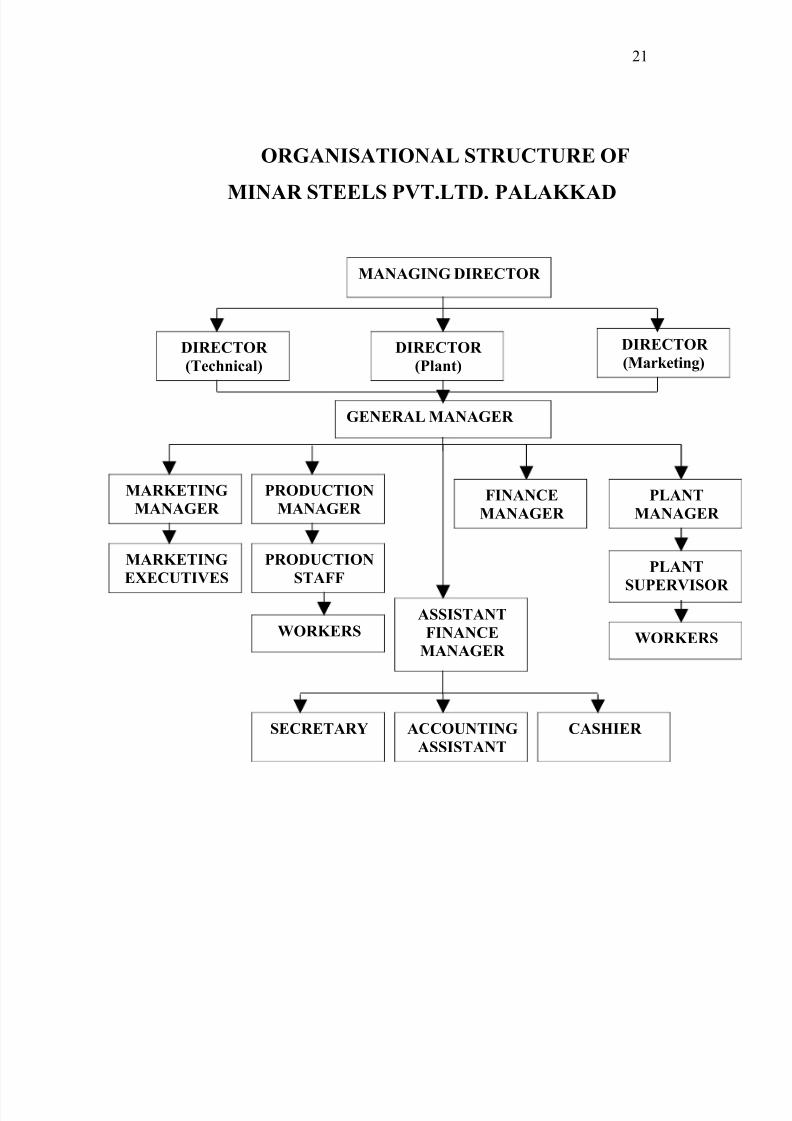
ORGANISATIONAL STRUCTURE OF
MINAR STEELS PVT.LTD. PALAKKAD
DIRECTOR
(Technical)
MANAGING DIRECTOR
DIRECTOR
(Plant)
DIRECTOR
(Marketing)
GENERAL MANAGER
MARKETING
MANAGER
PRODUCTION
MANAGER FINANCE
MANAGER
PLANT
MANAGER
MARKETING
EXECUTIVES
PRODUCTION
STAFFPLANT
SUPERVISOR
WORKERSASSISTANT
FINANCE
MANAGER WORKERS
SECRETARY ACCOUNTING
ASSISTANT
CASHIER
Page 22
8/6/2019 Meaning of Working Capital
http://slidepdf.com/reader/full/meaning-of-working-capital 22/66
22
CHAPTER: 2
MAIN THEME OF THE PROJECT
2.1 OBJECTIVES OF THE STUDY
To study about the effect of working capital management of Minar
steels Pvt. Ltd Palakkad.
To analyze current asset movement of the company.
To find out the gross and net working capital of the company.
To know about the changing position of working capital by comparing
current asset and current liability of five years.
To suggest suitable measures for the improvement of working capital.
Page 23
8/6/2019 Meaning of Working Capital
http://slidepdf.com/reader/full/meaning-of-working-capital 23/66
23
2.2 SCOPE OF THE STUDY
Every business needs some amount of working capital. The need for
working capital arises due to the time gap between production and realization
of cash from sales. Working capital is that part of capital, which makes a
business, run on a continuous basis without any interruption. The working
capital of Minar steels Pvt.Ltd. shows that the fluctuating net working capital
during the period of study. The barometer to measure the effectiveness of
managing the working capital of Minar steels is the evaluation of the past
performance and analyzing the financial statements using accounting and
statistical tools. Thus the study would give a brief description of the
performance of Minar steels and suggestion for its improvement.
Page 24
8/6/2019 Meaning of Working Capital
http://slidepdf.com/reader/full/meaning-of-working-capital 24/66
24
LIMITATIONS OF THE STUDY
Study was made for just five years and the current year was excluded
on account of the non availability of the data. So the current position of
the firm was not able to take in to consideration.
Some relevant details of the company were kept confidential
The study is based on the secondary data such as published annual
reports of the company. The accuracy of calculation depends very
much on the information found in the balance sheet
Page 25
8/6/2019 Meaning of Working Capital
http://slidepdf.com/reader/full/meaning-of-working-capital 25/66
25
2.3 METHODOLOGY
Meaning of Research:
Research in common parlance refers to a search for knowledge. The
advanced learner’s dictionary of current English lays down the meaning of
research as “a careful investigation or inquiry especially through sear for newfacts in any branch of knowledge.”
Definition:
According to Woody, “Research comprises defining and redefining
problems formulating hypothesis or suggested solution collecting organizing
and evaluating, data making deduction and researching concessions and at last
carefully the concessions to determine whether they fit the formulating the
hypothesis.”
Research Design:
A research design is programme which guides the investigator in the
process of collecting, analyzing and interpreting the observation. It is needed
to facilitate the smooth sailing of the various research operations thereby
making research as efficient as possible. A research design is the blue print of
the data collections measurements and analysis of data.
Analytical research design:
The researcher has adopted analytical research in the present study.
Analytical research is to use facts or information already available, and
azalyze these to make a critical evaluation of the problem.
Page 26
8/6/2019 Meaning of Working Capital
http://slidepdf.com/reader/full/meaning-of-working-capital 26/66
26
Methods of Data Collection:
There are two types of data.
1. Primary data
2. Secondary data
1. Primary data:
The primary data are those which are collected a fresh and for the first
time and thus happens to be original in character.
Primary data was collected of discussions with Managers, Accountants
and Other staff of Minar steel.Pvt. Limited.
2. Secondary data:
The secondary data, on the other hand, are those which have already
been collected by someone else and which have already been passed though
the statistical process.
Secondary data was collected form Balance Sheet and annual reports
of the company, Magazines, Books of Accounts, Other books, etc.
Sources of data:
The data needed to the study was collected from company’s financial
records and annual reports.
Tools used for Analysis:
1. Schedule of Changes in Working Capital
2. Ratio AnalysisPeriod of study:
The study is carried out for 60 days by collecting data for a period of
five years from 2005-2006 to 2008-2009.
Page 27
8/6/2019 Meaning of Working Capital
http://slidepdf.com/reader/full/meaning-of-working-capital 27/66
27
2.4 REVIEW OF LITERATURE
The aim of this chapter is to review briefly and critically the empirical
work done in the areas evolving working capital management. This is
intensified to reveal some prominent facts and to highlight the nature of the
present study. The researcher has given a review of various studies both in
India and abroad in connection with the present study.
Literature relating to working capital management:
1. GOSH AND MAJI-2003, In this paper made an attempt to examine the
efficiency of working capital management of the Indian cement companies
during 1992-1993 to 2001-2002. For measuring the efficiency of working
capital management, performance utilization, and overall efficiency indices
were calculated instead of using some common working capital management
ratios.
2.. SHIN AND SOENEN-1998, Point out that a corporation’s working capital
is the result of the time lag between the expenditure for the purchase of raw
materials and the collection from the sale of finished goods. As such, it
involves many different aspects of corporate operate operational
3. HAWAWINI, VIALLET, AND VORA-1986, examine the influence of a
firm’s industry on its working capital management. Using data o 1,181 U.S.
firms over the period 1960 to 1979. From these studies, we conclude that sales
growth and industry practices are important factors influencing a firm’s
investment in working capital.
Page 28
8/6/2019 Meaning of Working Capital
http://slidepdf.com/reader/full/meaning-of-working-capital 28/66
28
4. ABDUL RAHEMAN AND MOHAMED NASR- 2007, Working Capital
Management has its effect on liquidity as well on profitability of the firm. The
cash conversion cycle increases it will lead to decreasing profitability of the
firm, and managers can create a positive value for the shareholders by
reducing the cash conversion cycle to a possible minimum level. We find that
there is a significant negative relationship between size of the form and its
profitability. There is also a significant negative relationship between debt
used by the firm and its profitability.
5. REL Consultancy Group has for year’s conducted and annual survey of
corporate working capital management performance for CFO Magazine,
which CFO Magazine then reports. Their 2005 survey report points out, there
is a high positive correlation between the efficiency of a corporation’s
working capital policies and its return on invested capital.
6. ELJELLY-2004, Elucidated that efficient liquidity management involves
planning and controlling current assets and current liabilities in such a manner
that eliminates the risk of inability to meet due short-term obligations and
avoids excessive investment in these assets..
7. NUNN-1981 Uses the PIMS database to examine why some product lines
have low working capital requirements, while other product lines have high
working capital requirements. In addition, Nunn is interested in “permanent”
rather than temporary working capital investment as he uses data averaged
over four years.
Page 29
8/6/2019 Meaning of Working Capital
http://slidepdf.com/reader/full/meaning-of-working-capital 29/66
29
8. DELOOF-2003, Discussed that most firms had a large amount of cash
invested in working capital. It can therefore be expected that the way in which
working capital is managed will have a significant impact of profitability of
those firms. On basis of these results he suggested that managers could create
value for their shareholders by reducing the number of days’ accounts
receivable and inventories to a reasonable minimum.
Page 30
8/6/2019 Meaning of Working Capital
http://slidepdf.com/reader/full/meaning-of-working-capital 30/66
30
CHAPTER: 3
ANALYSIS AND INTERPRETATION
SCHEDULE SHOWING CAHNGES IN WORKING CAPITAL:
Schedule showing changes in working capital is an important
tool to study the changes in working capital of the concern and can also throw
light on cause for these changes. Working capital means the excess of current
asset over current liabilities. Statement of changes in working capital is
prepared to show the changes in the working capital between the two balance
sheet dates. This statement is prepared with the help of current assets and
current liabilities derived from the two balance sheets.
WORKING CAPITAL= CURRENT ASSETS- CURRENT LIABILITIES.
i. An increase in current assets increases in working capital.
ii. A decrease in current assets decreases in working capital.
iii. An increase in current liabilities decreases in working capital and
iv. A decrease in current liabilities increases in working capital.
Page 31
8/6/2019 Meaning of Working Capital
http://slidepdf.com/reader/full/meaning-of-working-capital 31/66
31
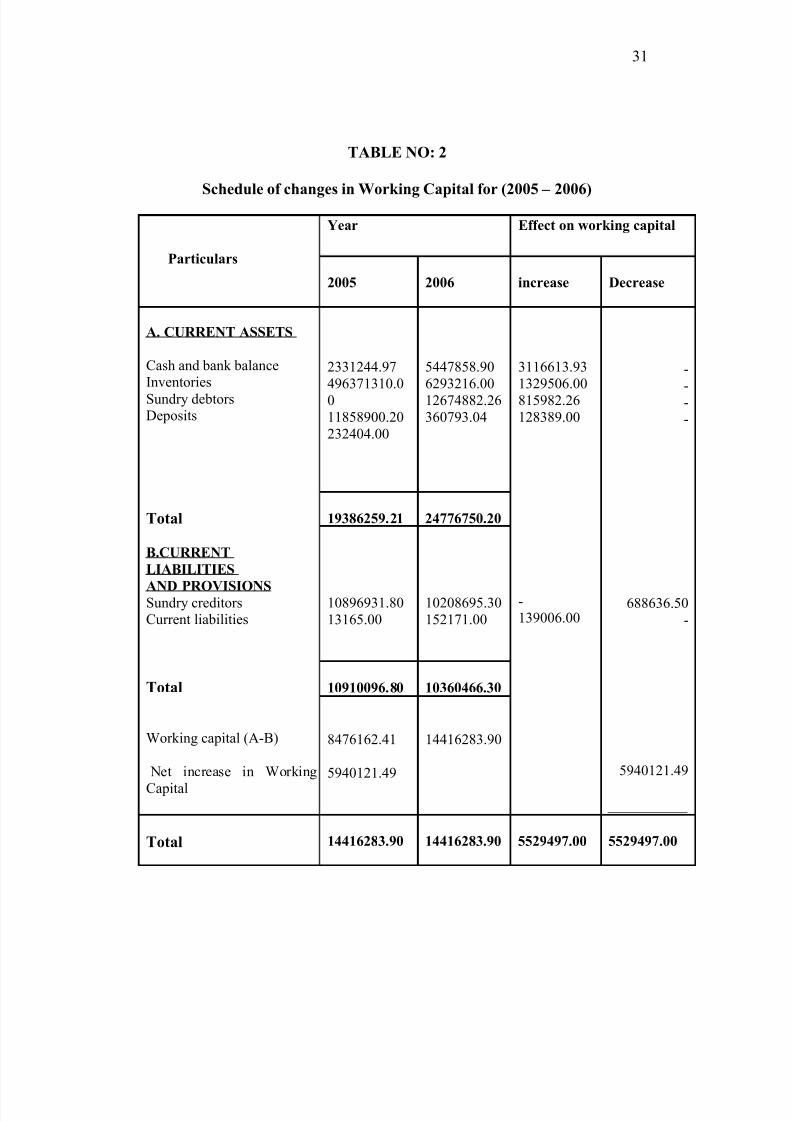
TABLE NO: 2
Schedule of changes in Working Capital for (2005 – 2006)
Particulars
Year Effect on working capital
2005 2006 increase Decrease
A. CURRENT ASSETS
Cash and bank balance
Inventories
Sundry debtors
Deposits
Total
B.CURRENT
LIABILITIES
AND PROVISIONSSundry creditors
Current liabilities
Total
Working capital (A-B)
Net increase in Working
Capital
2331244.97
496371310.0
0
11858900.20
232404.00
5447858.90
6293216.00
12674882.26
360793.04
3116613.93
1329506.00
815982.26
128389.00
-
139006.00
-
--
-
688636.50
-
5940121.49
19386259.21 24776750.20
10896931.80
13165.00
10208695.30
152171.00
10910096.80 10360466.30
8476162.41
5940121.49
14416283.90
Total 14416283.90 14416283.90 5529497.00 5529497.00
Page 32
8/6/2019 Meaning of Working Capital
http://slidepdf.com/reader/full/meaning-of-working-capital 32/66
32
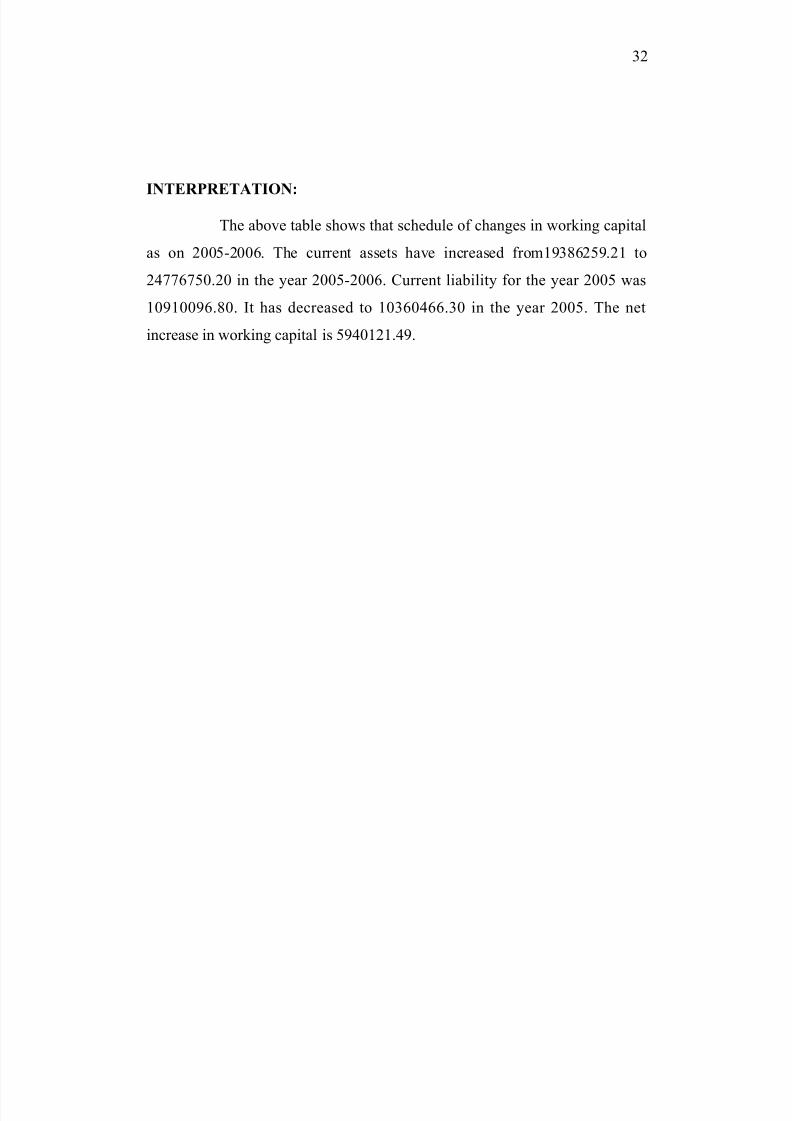
INTERPRETATION:
The above table shows that schedule of changes in working capital
as on 2005-2006. The current assets have increased from19386259.21 to
24776750.20 in the year 2005-2006. Current liability for the year 2005 was
10910096.80. It has decreased to 10360466.30 in the year 2005. The net
increase in working capital is 5940121.49.
Page 33
8/6/2019 Meaning of Working Capital
http://slidepdf.com/reader/full/meaning-of-working-capital 33/66
33
TABLE NO: 3
Schedule of changes in Working Capital for (2006 – 2007)
Particulars
Year Effect on working capital
2006 2007 increase Decrease
A. CURRENT
ASSETSCash and bank balance
Inventories
Sundry debtors
Deposits
Total
B.CURRENT
LIABILITIES
AND PROVISIONS
Sundry creditors
Current liabilities
Total
Working capital (A-B)
Net increase in
Working Capital
5447858.90
6293216.00
12674882.2
6
360793.04
7704495.32
8401064.40
23949552.01
481515.04
2256636.42
2107848.40
11274669.75
120722.00
5358885.40
-
-
-
-
-
77343.00
10478334.17
24776750.2
0
40536626.77
10208295.3
0
152171.00
15567180.70
74828.00
10360466.3
0
15642008.70
14416283.9
0
10478334.1
7
24894618.07
Page 34
8/6/2019 Meaning of Working Capital
http://slidepdf.com/reader/full/meaning-of-working-capital 34/66
34
Total 24894618.0
7
24894618.07 21118761.97 21118761.97
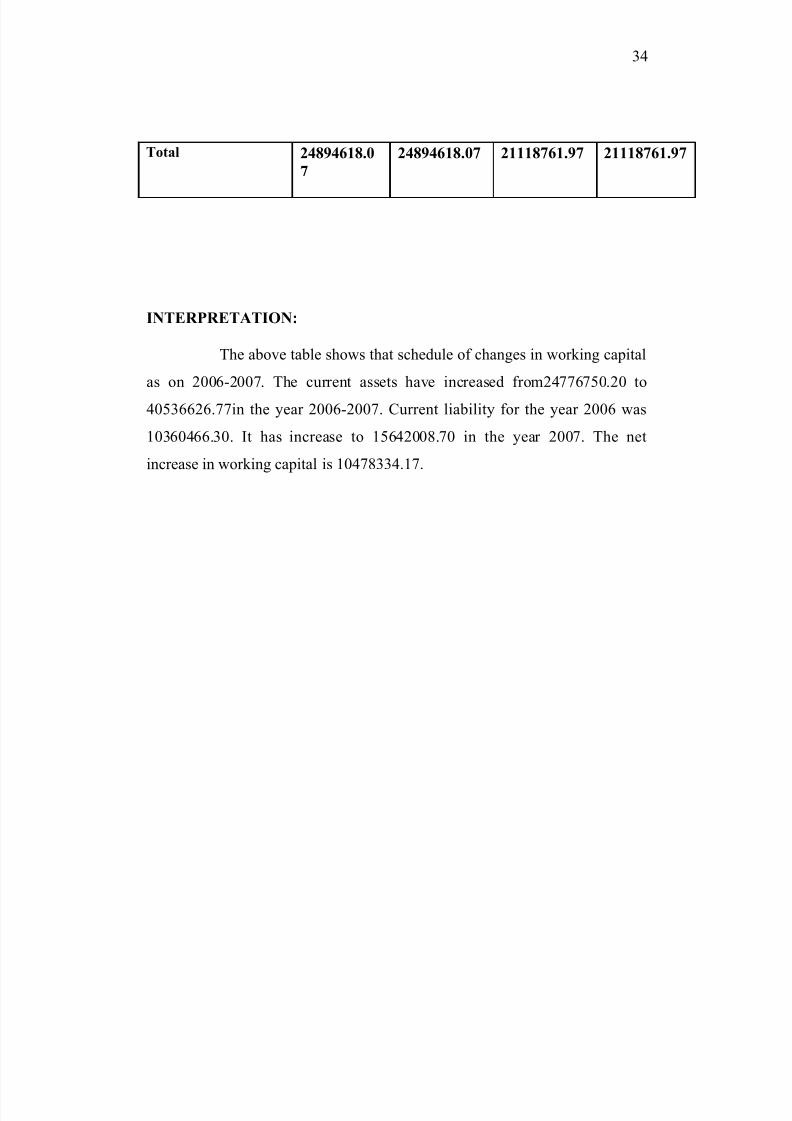
INTERPRETATION:
The above table shows that schedule of changes in working capital
as on 2006-2007. The current assets have increased from24776750.20 to
40536626.77in the year 2006-2007. Current liability for the year 2006 was
10360466.30. It has increase to 15642008.70 in the year 2007. The net
increase in working capital is 10478334.17.
Page 35
8/6/2019 Meaning of Working Capital
http://slidepdf.com/reader/full/meaning-of-working-capital 35/66
35
TABLE NO: 4
Schedule of changes in Working Capital for (2007 – 2008)
Particulars
Year Effect on working capital
2007 2008 increase Decrease
A. CURRENT ASSETS
Cash and bank balance
Inventories
Sundry debtors
Deposits
Total
B.CURRENT
LIABILITIES
AND PROVISIONS
Sundry creditors
Current liabilities
Total
Working capital A-B)
7704495.32
8401064.40
23949652.0
1
481515.04
7160393.77
4503098.89
28865377.5
1
10869165.4
5
4915725.50
10387650.4
1
6023829.27
717477.00
544101.55
3897965.89
-
-
-
-
23552102.58
40536626.7
7
51398035.6
2
15567180.7
0
74828.00
2159009.99
722305.00
15622008.7
0
2951314.97
Page 36
8/6/2019 Meaning of Working Capital
http://slidepdf.com/reader/full/meaning-of-working-capital 36/66
36
Net increase in Working
Capital
24894618.0
7
23552102.5
8
48446720.6
5
Total 48446720.6
5
48446720.6
5
43163444.1
5
43163444.15
INTERPRETATION:
The above table shows that schedule of changes in working capital
as on 2007-2008. The current asset has increased from 40536626.77 to
51398035.62 in the year 2007-2008. The net increase in working capital is
23552102.58.
Page 37
8/6/2019 Meaning of Working Capital
http://slidepdf.com/reader/full/meaning-of-working-capital 37/66
37
TABLE NO: 5
Schedule of changes in Working Capital for (2008 – 2009)
Particulars
Year Effect on working capital
2008 2009 increase Decrease
A. CURRENT ASSETS
Cash and bank balance
Inventories
Sundry debtors
Deposits
Total
7160393.77
4503098.89
28865377.5
1
10869165.4
5
12802004.5
5
4757728.00
24695657.0
6
7103313.65
5641610.78
254629.11
-
-
4169720.45
3765851.80
51398035.6
2
24910002.2
6
Page 38
8/6/2019 Meaning of Working Capital
http://slidepdf.com/reader/full/meaning-of-working-capital 38/66
38
B.CURRENT
LIABILITIES
AND PROVISIONS
Sundry creditors
Current liabilities
Total
Working capital (A-B)
Net decrease in Working
Capital
56530684.00
7495773.76
475280.002159009.99
722305.00
14095236.2
1
317025.00
2951314.97 14412261.2
1
4844672.65 10497741.0
5
56530684.0
0
Total 4844672.65 4844672.65 62426923.8
9
62426923.89
INTERPRETATION:
The above table shows that schedule of changes in working capital
as on 2008-2009. The current assets have decreased from 51398035.62 to
24910002.26 in the year 2008-2009. Current liability for the year 2008 was
2951314.97. It has decreased to 14412261.21 in the year 2009. The net
decrease in working capital is 56530684.
Page 39
8/6/2019 Meaning of Working Capital
http://slidepdf.com/reader/full/meaning-of-working-capital 39/66
39
3.1 RATIO ANALYSIS
One of the most important financial tools which have come to be very
frequently for analyzing the financial strength and weakness of the enterprise
is the ratio analysis. Ratio analysis is the process of determine and presenting
arithmetical terms & the relationship between the figures and the group of
figures drawn from the statements. It is calculated by dividing one figure by
other. The quotient so obtain is the ratio of the figures .When the relationship
between the two figures in the balance sheet is established the ratio so
calculated is the balance sheet ratio. If the relationship between the figure of
Page 40
8/6/2019 Meaning of Working Capital
http://slidepdf.com/reader/full/meaning-of-working-capital 40/66
40
profit and loss account is established the result so found is the income
statement ratio.
Ratio may be expressed in various ways .It may be a quotient obtained by
dividing one value by the other. This unit of expression is called the ‘times’. If
the quotient is multiplied by one hundred, the unit of the expression becomes
the percentage’. The ratio analysis involves two types of comparison for the
useful interpretation of the financial statement .A ratio itself does not
indicate the favorable or unfavorable position. It must be compare with some
standard
1) CURRENT RATIO:
Current ratio explains the relationship between current assets and
current liabilities. The general norms are to maintain 2:1 ratio. It can be
calculated by dividing current assets by current liabilities.
CURRENT ASSETS
CURRENT RATIO =
Page 41
8/6/2019 Meaning of Working Capital
http://slidepdf.com/reader/full/meaning-of-working-capital 41/66
41
CURRENT LIABILITIES
TABLE NO: 6
STATEMENT SHOWING CURRENT RATIO
YEAR 2005 2006 2007 2008 2009
CA 19386251.2
1
24776756.2
0
40536626.7
7
51398035.6
2
24910002.26
CL 10910096.8
0
10360466.3
0
15642008.7
0
2951314.97 14412261.21
CR 1.78:1 2.39:1 2.5:1 17.4:1 1.72:1
INTERPRETATION:
The above table shows that the company is running good position. The
company’s current ratio is above the arbitrary standard of liquidity. In 2008
the ratio increased 17.4 . Because of a decrease in the current liabilities. The
ratio shows the liquidity position of the company is good.
Page 42
8/6/2019 Meaning of Working Capital
http://slidepdf.com/reader/full/meaning-of-working-capital 42/66
42
CHART NO:2
CURRENT RATIO
Page 43
8/6/2019 Meaning of Working Capital
http://slidepdf.com/reader/full/meaning-of-working-capital 43/66
43
0
2
4
6
8
10
12
14
16
18
20
Year-2005 Year-2006 Year-2007 Year-2008 Year-2009
C R
Page 44
8/6/2019 Meaning of Working Capital
http://slidepdf.com/reader/full/meaning-of-working-capital 44/66
44
2) QUICK RATIO:
The quick ratio tells about the relationship between quick assets
and current liabilities. It is calculated by dividing quick assets by current
liabilities. The ideal norm is 1:1. Quick assets are obtained by subtracting
prepaid expenses and inventories from current assets.
QUICK ASSETS
QUICK RATIO =
CURRENT LIABILITIES
QUICK ASSETS = SUNDRY DEBTORS + CASH & BANK BALANCE +
LOANS & ADVANCES
TABLE NO: 7
STATEMENT SHOWING QUICK RATIO
YEAR 2005 2006 2007 2008 2009
QA 14190145.1
7
18122741.1
6
31654147.3
3
36025775.2
8
37497661.61
CL 10910096.8
0
10360466.3
0
15642008.7
0
2951314.97 14412261.21
QR 1.3:1 1.7:1 2.02:1 12.2:1 2.60:1
Page 45
8/6/2019 Meaning of Working Capital
http://slidepdf.com/reader/full/meaning-of-working-capital 45/66
45
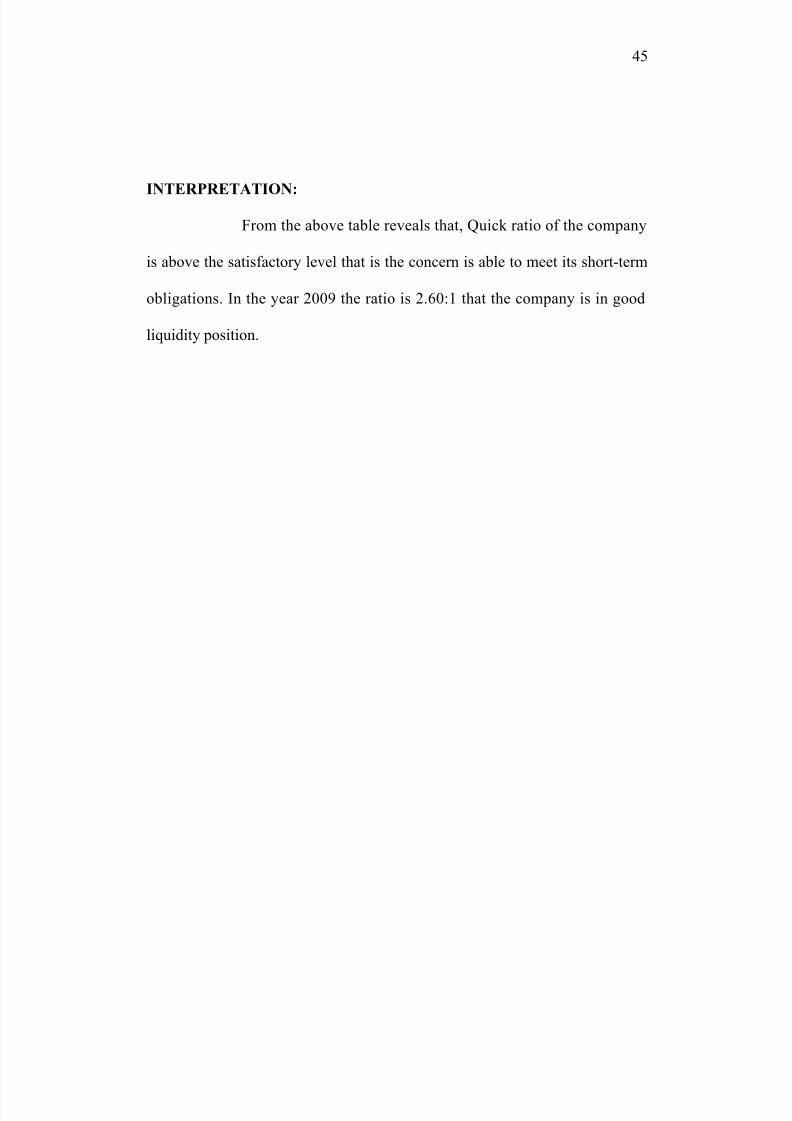
INTERPRETATION:
From the above table reveals that, Quick ratio of the company
is above the satisfactory level that is the concern is able to meet its short-term
obligations. In the year 2009 the ratio is 2.60:1 that the company is in good
liquidity position.
Page 46
8/6/2019 Meaning of Working Capital
http://slidepdf.com/reader/full/meaning-of-working-capital 46/66
46
CHART NO: 3
QUICK RATIO
0
2
4
6
8
10
12
14
Year-2005 Year-2006 Year-2007 Year-2008 Year-2009
Q R
Page 47
8/6/2019 Meaning of Working Capital
http://slidepdf.com/reader/full/meaning-of-working-capital 47/66
47
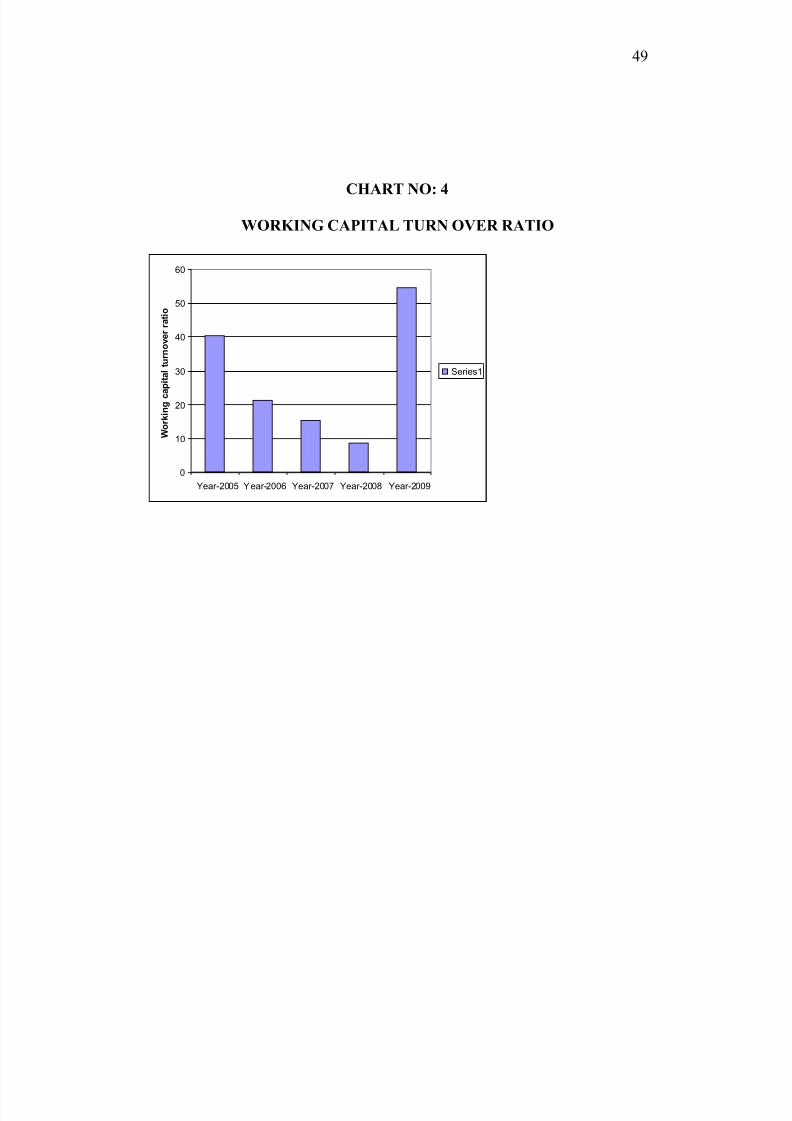
3) WORKING CAPITAL TURNOVER RATIO:
The ratio is calculated by dividing sales by working capital. It
shows the number of times the working capital of the company is turned into
sales.
WORKING CAPITAL NET SALES
TURN OVER RATIO =
NET WORKING CAPITAL
TABLE NO: 8
STATEMENT SHOWING WORKING CAPITAL TURNOVER
RATIO
YEAR 2005 2006 2007 2008 2009
NET SALES 342287581 305585326.9
9
384385145.9
6
409158176.0
2
571309147.41
NET
WORKING
CAPITAL
8476162.4
1
14416283.90 24894618.09 48446720.65 10497741.05
WORKNG
CAPITAL
TURNOVER
RATIO
40.3
times
21.1
times
15.4
times
8.44
times
54.4
times
Page 48
8/6/2019 Meaning of Working Capital
http://slidepdf.com/reader/full/meaning-of-working-capital 48/66
48
INTERPRETATION:
Working capital of a company is directly related to sales. The above table,
it is inferred that the working capital turnover ratio is in higher status. This
shows the firm is efficient to utilize the working capital.
Page 49
8/6/2019 Meaning of Working Capital
http://slidepdf.com/reader/full/meaning-of-working-capital 49/66
49
CHART NO: 4
WORKING CAPITAL TURN OVER RATIO
0
10
20
30
40
50
60
Year-2005 Year-2006 Year-2007 Year-2008 Year-2009
W o r k i n g c a
p i t a l t u r n o v e r r a t i o
Series1
Page 50
8/6/2019 Meaning of Working Capital
http://slidepdf.com/reader/full/meaning-of-working-capital 50/66
50
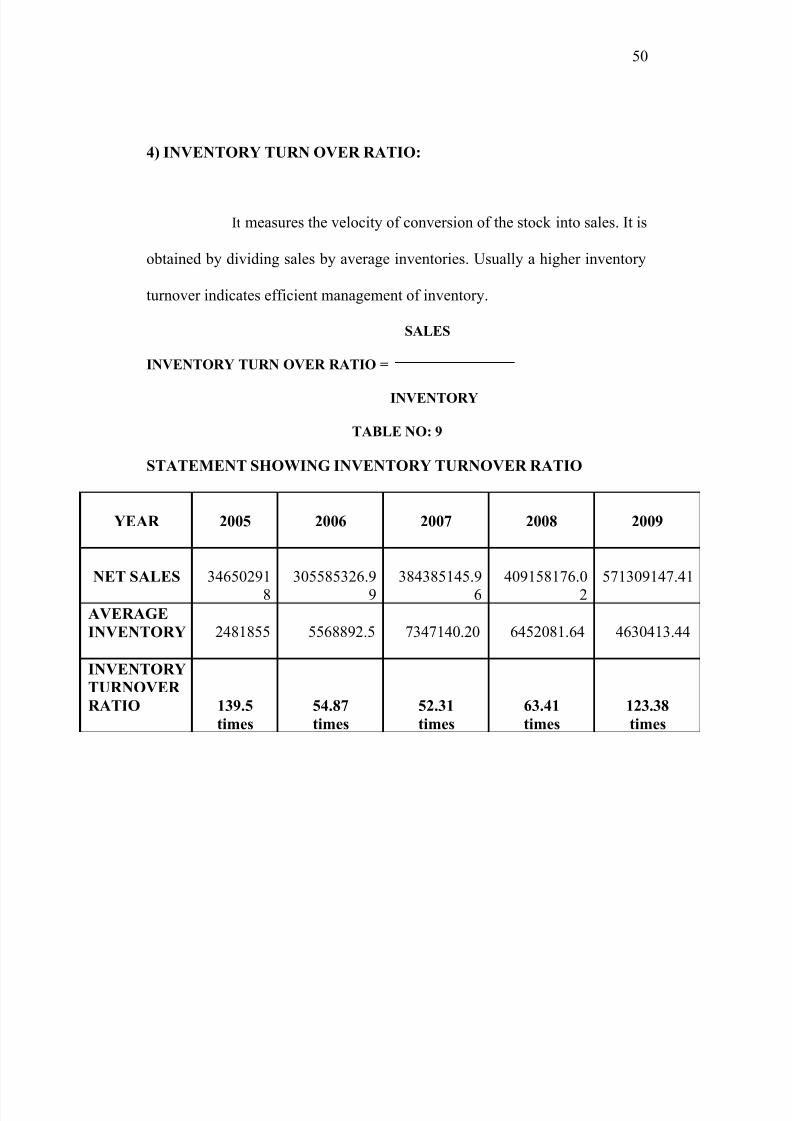
4) INVENTORY TURN OVER RATIO:
It measures the velocity of conversion of the stock into sales. It is
obtained by dividing sales by average inventories. Usually a higher inventory
turnover indicates efficient management of inventory.
SALES
INVENTORY TURN OVER RATIO =
INVENTORY
TABLE NO: 9
STATEMENT SHOWING INVENTORY TURNOVER RATIO
YEAR 2005 2006 2007 2008 2009
NET SALES 34650291
8
305585326.9
9
384385145.9
6
409158176.0
2
571309147.41
AVERAGE
INVENTORY 2481855 5568892.5 7347140.20 6452081.64 4630413.44
INVENTORY
TURNOVER
RATIO 139.5
times
54.87
times
52.31
times
63.41
times
123.38
times
Page 51
8/6/2019 Meaning of Working Capital
http://slidepdf.com/reader/full/meaning-of-working-capital 51/66
51
INTERPRETATION:
The above table shows the inventory turnover ratio of Minar Steels is
an increasing trend. This is because of the firm’s low investment in
inventories. This analysis shows the efficiency of management in managing
the inventories.
Page 52
8/6/2019 Meaning of Working Capital
http://slidepdf.com/reader/full/meaning-of-working-capital 52/66
52
CHART NO: 5
INVENTORY TURN OVER RATIO
0
20
40
60
80
100
120
140
160
Year-2005Year-2006Year-2007Year-2008Year-2009
I n v e n t o r y
t u r n o v e r r a t i o
Series1
Page 53
8/6/2019 Meaning of Working Capital
http://slidepdf.com/reader/full/meaning-of-working-capital 53/66
53
5) FIXED ASSETS TURNOVER RATIO
Fixed assets turnover ratio shows the relationship between sales and
fixed assets. It measures the efficiency of assets used.
FIXED ASSET TURN OVER RATIO = NET SALES
FIXED ASSET
TABLE NO: 10
STATEMENT SHOWING FIXED ASSET TURNOVER RATIO
Sl. No Year Net Sales Fixed Assets Ratio
1 2005 346502918 3272819.65 105.8
2 2006 305585326.99 5178956.95 59.06
3 2007384385145.96
7316184.90 52.5
4 2008409158176.02
6418806.58 63.7
5 2009571309147.41
5887010.48 97.04
INTERPRETATION:
The fixed assets to net worth ratio from 2005 to 2009 are: 105.8, 59.06,
52.50,63.7 and 97.04. That means it shows an increasing and decreasing trend.
The ratio is satisfactory for the firm.
CHART NO: 6
Page 54
8/6/2019 Meaning of Working Capital
http://slidepdf.com/reader/full/meaning-of-working-capital 54/66
54
FIXED ASSET TURN OVER RATIO
0
20
40
60
80
100
120
Year-2005 Year-2006 Year-2007 Year-2008 Year-2009
R a t i o
Page 55
8/6/2019 Meaning of Working Capital
http://slidepdf.com/reader/full/meaning-of-working-capital 55/66
55
6) DEBTORS TURNOVER RATIO:
Normally almost all the firms try to improve sales by giving
credit. So the debtors and receivables are inevitable. It indicates the velocity of
the debt collection of the firms. In simple words it indicates the number of
times average debtors are turned over during the year. It is calculated as,
NET CREDIT SALES
DEBTORS TURNOVER RATIO =
AVERAGE TRADE DEBTORS
TABLE NO: 11
STATEMENT SHOWING DEBTORS TURNOVER RATIO
YEAR 2005 2006 2007 2008 2009
NET SALES 342287581 305585326.9
9
384385145.9
6
409158176.0
2
571309147.41
NET
AVERAGE
DEBTORS
11858900.2
0
12674882.26 23949652.01 28865377.51 24695657.06
DEBTORS
TURNOVER
RATIO
2.92
times
2.41
times
1.6
times
14.17
times
23.13
times
Page 56
8/6/2019 Meaning of Working Capital
http://slidepdf.com/reader/full/meaning-of-working-capital 56/66
56
INTERPRETATION:
It indicated the numbers of time debtors are turned over during a year.
Generally higher the value of debtors turnover ratio, the more efficient in the
management of debt. Here the debtor’s turnover ratio of the company shows
that an increasing trend. But this is not in a satisfied condition. There is a
slight increase in the debtors turnover ratio.
Page 57
8/6/2019 Meaning of Working Capital
http://slidepdf.com/reader/full/meaning-of-working-capital 57/66
57
CHART NO: 7
DEBTORS TURN OVER RATIO
0
5
10
15
20
25
Year-2005 Year-2006 Year-2007 Year-2008 Year-2009
D e b t o r s t u r n o v e r r a t i o
Page 58
8/6/2019 Meaning of Working Capital
http://slidepdf.com/reader/full/meaning-of-working-capital 58/66
58
7) CREDITORS TURN OVER RATIO:
The creditor’s turnover ratio indicates the velocity, which the
creditors are turned over in relation to purchase. Higher the ratio, better it is
otherwise lower the creditors velocity, the more is the time taken for payment.
Finding out how much time the firm is likely to take in repaying its made
creditors.
NET CREDIT PURCHASE
CREDITORS TURNOVER RATIO =
AVERAGE CREDITORS
TABLE NO: 12
STATEMENT SHOWING CREDITORS TURNOVER RATIO
YEAR 2005 2006 2007 2008 2009
NET
PURCHASE
342408227.3
0
301376009.0
6
377160277 3877518443 543699106
NET
AVERAGE
CREDITORS
10896931.80 10208295.30 15567180.70 21591009.97 14095236.21
CREDITORS
TURNOVER
RATIO
31.42 29.52 24.22 17.95 38.57
Page 59
8/6/2019 Meaning of Working Capital
http://slidepdf.com/reader/full/meaning-of-working-capital 59/66
59
INTERPRETATION:
In the above table the creditors turnover ratios increased
from 2005-2006. When compared to 2007. The creditor’s turnover
ratio is decreased in the year 2008. It is increased in the year of
2009.
Page 60
8/6/2019 Meaning of Working Capital
http://slidepdf.com/reader/full/meaning-of-working-capital 60/66
60
CHART NO: 9
CREDITORS TURN OVER RATIO
0
5
10
15
20
25
30
35
40
45
Year-2005 Year-2006 Year-2007 Year-2008 Year-2009
C r e d i t o r s t u r n o v e r r a t i o
Page 61
8/6/2019 Meaning of Working Capital
http://slidepdf.com/reader/full/meaning-of-working-capital 61/66
61
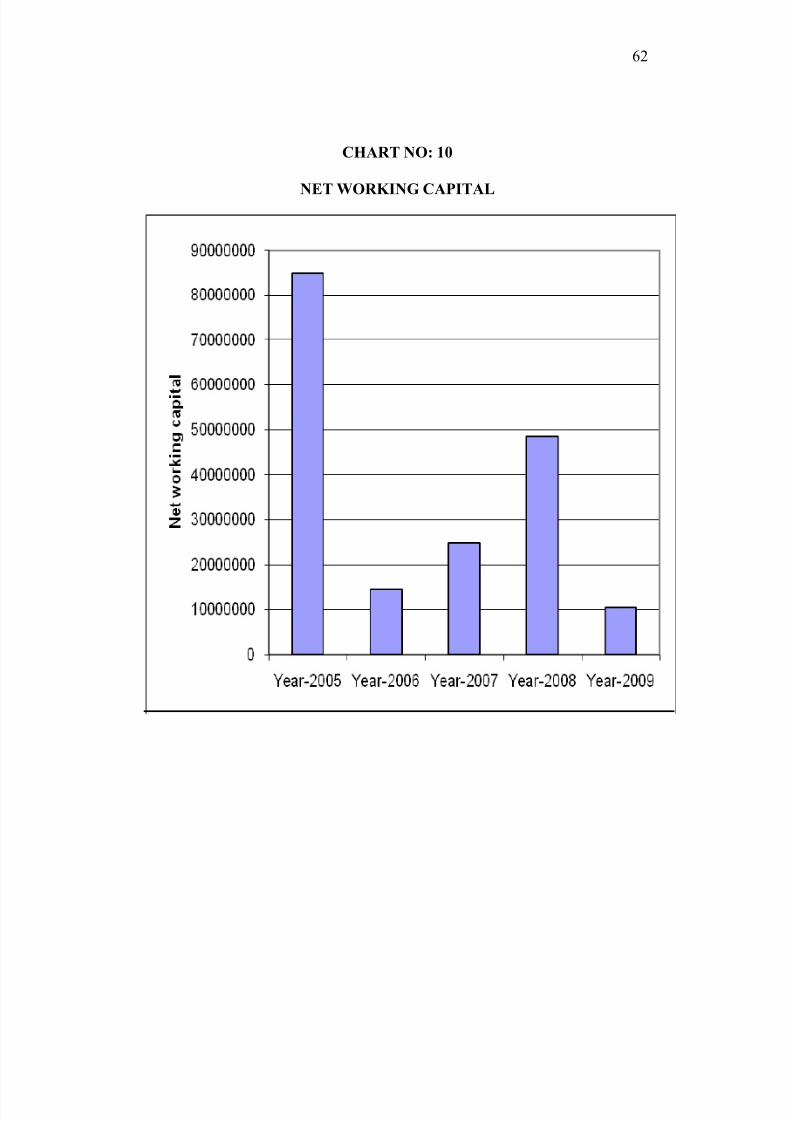
NET WORKING CAPITAL
It refers to the difference between current asset and current liabilities.
Current liabilities are those claims of outsiders, which are expensed to nature
for payment for with in an accounting year and include creditors, bills payable
and outstanding expense.
NET WORKING CAPITAL=CURRENT ASSET-CURRENT
LIABLITY
TABLE NO: 13
STATEMENT SHOWING NET WORKING CAPITAL
YEAR 2005 2006 2007 2008 2009
CA 19386251.2
1
24776756.20 40536626.77 51398035.62 24910002.26
CL 10910096.8
0
10360466.30 15642008.70 2951314.97 14412261.21
NETWORKING
CAPITAL84776162.4 14416283.90 24894618.07 48446720.65 10497741.05
INTERPRETATION:
This table shows that net working capital in the year 2005-2009. It will
show that in net working capital increasing. In 2008-2009 working capital
decreased. It will show that fluctuating trend of working capital.
Page 62
8/6/2019 Meaning of Working Capital
http://slidepdf.com/reader/full/meaning-of-working-capital 62/66
62
CHART NO: 10
NET WORKING CAPITAL
Page 63
8/6/2019 Meaning of Working Capital
http://slidepdf.com/reader/full/meaning-of-working-capital 63/66
63
CHAPTER: 4
4.1 FINDINGS
1. The net working capital of the Minar steel shows an increasing trend,
in 2008-2009 networking capital decreasing during the study period of
2005-2006 to 2008-2009.
2. The company’s current ratio shows a fluctuating trend. In the year
2008 it shows a increasing trend.
3. The current ratio reveals that the firm’s current assets are able to meet
its current obligations. The firm’s current ratio satisfies a moderate
ratio.
4. The company’s quick ratio shows fluctuating trend. In the year 2005,
2006 it shows a lowest ratio comparing to the considered year 2007,
2008, and 2009.
5. The inventory turnover ratio shows an increasing trend. Higher the
ratio better it is because it shows that the finished stock is rapidly
turnover. The inventory turnover ratio is very good
6. Fixed asset turnover ratio shows that the cash position of the firm is
good.
7. The working capital turnover ratio reveals that it is favorable for the
firm.
8. The study reveals that the debtor’s turnover ratio is in a satisfactory
level. The firm is efficient in handling the debt.
Page 64
8/6/2019 Meaning of Working Capital
http://slidepdf.com/reader/full/meaning-of-working-capital 64/66
64
9. Creditor’s turnover ratio reveals that the creditors velocities are
increased year by year.
10. The company’s net working capital shows a increasing trend
Page 65
8/6/2019 Meaning of Working Capital
http://slidepdf.com/reader/full/meaning-of-working-capital 65/66
65
4.2 RECOMMENDATIONS
• The company should use their working capital in an intelligent way so
as to maintain their turnover.
• Increase the sale to maintain the profitability.
• The company’s manufacturing expenses and selling expenses is very
high. This will reduce properly for improving the profit of the
company.
• Take remedial measures for increasing the profitability of the concern.
The management have improve their efficiency in collecting the debts.
• To increase profitability the investment in fixed assets can be
increased.
• The company can try to reduce the excess of investment in current
assets, especially in the debtors. The higher investment in current
assets will severally affect the profitability of the firm
Page 66
8/6/2019 Meaning of Working Capital
http://slidepdf.com/reader/full/meaning-of-working-capital 66/66
66
4.3 CONCLUSION
Working capital is the life-blood & controlling nerve centre
of a business. No business can be successfully run without an adequate
amount of working capital. It is very essential to maintain the smooth
running of a business. The concept of working capital has its own
importance in a going concern. Generally negative balance is generally
space soon.
This study explains the management of working capital by the
Minar steels management. The net working capital of the concern
fluctuating year by year. This study shows that the management is
passed to handle the management of working capital and they facing a
good profit.