~ 344 IEEE TRANSACTIONS ON BROADCASTING, VOL. 34, NO. 3, SEPTEMBER 1988 MEASURING TELEVISION TRANSPOSER INTERMODULATION DISTORTION A D Broadhurst, P F Bouwer, Department of Electronic Engineering, University of Natal Durban 4001, South Africa A L Curle South African Broadcasting Corporation, P 0 Boz 8606, Johannesburg, 2000, South Africa ABSTRACT Intermodulation (I.M.) occurs in common amplification broadcast television transposers when the color subcarrier and the vision and sound carrier components interact in the presence of common amplifier non-linearities. Static measuring techniques, such as the three-tone method neglect the fact that a picture contains varying levels of luminance and chrominance information. This causes the I.M. level to vary from one instant to another, as the three carrier components experience different degrees of non-linearity during common amplification in the transposer. This paper examines the behavior of the I.M. level during one line period and proposes a new measuring method allowing the use of a standard or a modified color bar test signal. The latter enables the non-linearity of the transposer to be minimized in the line synchronization region and this is shown to minimize vision/sound cross-modulation. Differential gain and phase can also be optimized. Measurements indicate that minimization of the I.M., level with the three-tone method (which corresponds to the carrier levels associated with the 100/0/75/0 cyan color bar in the South African television system) often causes unacceptable I.M. limits at other colors. The measurement technique is based upon sampling the demodulated color bar signal for short intervals corresponding to a selected color. This allows the simultaneous measurement of I.M. level at seven different points on the transposer’s characteristic. The paper concludes that the internationally accepted three-tone test method appears to be inadequate. 1. INTRODUCTION Intermodulation distortion occurs in common R.F. amplification television broadcast transposers, when the vision carrier, color subcarrier and sound carrier frequency components interact in the presence of amplifier non- linearities [l]. Fig.1 shows a typical characteristic of a 5 kW tetrode. When these non-linear devices are amplitude modulated by the video and sound signals, various spurious 0 -120 0 140 grid voltage Fig.1 A typical characteristic of a 5 kW tetrode. frequency components are generated as the excitation frequencies beat together or with their harmonics. If the three frequency components are represented as single frequencies f, the vision carrier, f,, the color subcarrier and f, the sound carrier, two in-band intermodulation components occur, the most significant at a frequency of fi, = f, + f,- f,, = f,+ 920455.00Hz = f, + 1066381.25 Hz = f, + 1565981.25 Hz (1.1) for M/NTSC for B+G/PAL for I/PAL which may cause perceptible interference patterns if the level of the intermodulation component is too high [l]. The maximum power which may be produced by a transposer [4] is limited by the permissible intermodulation level which is typically -53 dBp, i.e. 53 dB below the power transmitted during the synchronizing pulses. Mathematical analyses [1,2,3,4] represent the transfer characteristic of the amplifier as a series containing 3 terms 0018-9316/88/0900-0344$01.00 0 1988 IEEE
Transcript
~
344 IEEE TRANSACTIONS ON BROADCASTING, VOL. 34, NO. 3, SEPTEMBER 1988
MEASURING TELEVISION TRANSPOSER INTERMODULATION DISTORTION
A D Broadhurst, P F Bouwer,
Department of Electronic Engineering, University of Natal Durban 4001, South Africa
A L Curle
South African Broadcasting Corporation, P 0 Boz 8606, Johannesburg, 2000, South Africa
ABSTRACT
Intermodulation (I.M.) occurs in common amplification broadcast television transposers when the color subcarrier and the vision and sound carrier components interact in the presence of common amplifier non-linearities. Static measuring techniques, such as the three-tone method neglect the fact that a picture contains varying levels of luminance and chrominance information. This causes the I.M. level to vary from one instant to another, as the three carrier components experience different degrees of non-linearity during common amplification in the transposer.
This paper examines the behavior of the I.M. level during one line period and proposes a new measuring method allowing the use of a standard or a modified color bar test signal. The latter enables the non-linearity of the transposer to be minimized in the line synchronization region and this is shown to minimize vision/sound cross-modulation. Differential gain and phase can also be optimized. Measurements indicate that minimization of the I.M., level with the three-tone method (which corresponds to the carrier levels associated with the 100/0/75/0 cyan color bar in the South African television system) often causes unacceptable I.M. limits at other colors. The measurement technique is based upon sampling the demodulated color bar signal for short intervals corresponding to a selected color. This allows the simultaneous measurement of I.M. level a t seven different points on the transposer’s characteristic. The paper concludes that the internationally accepted three-tone test method appears to be inadequate.
1. INTRODUCTION
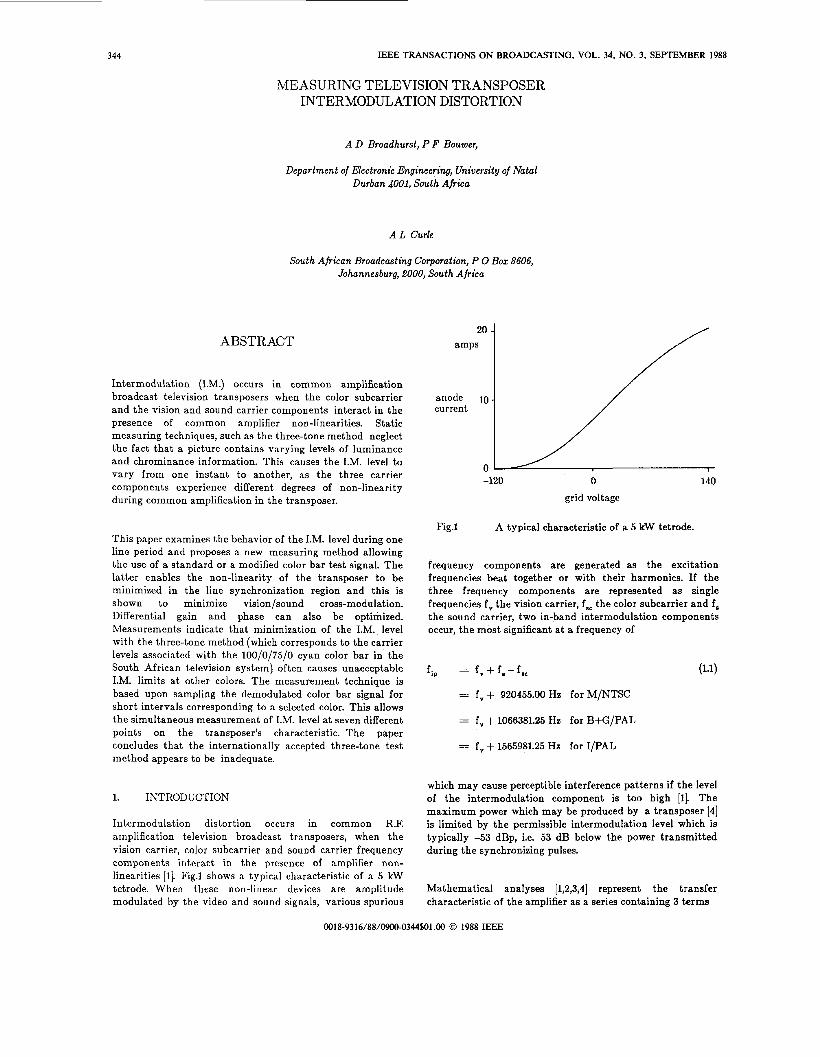
Intermodulation distortion occurs in common R.F. amplification television broadcast transposers, when the vision carrier, color subcarrier and sound carrier frequency components interact in the presence of amplifier non- linearities [l]. Fig.1 shows a typical characteristic of a 5 kW tetrode. When these non-linear devices are amplitude modulated by the video and sound signals, various spurious
0 -120 0 140
grid voltage
Fig.1 A typical characteristic of a 5 k W tetrode.
frequency components are generated as the excitation frequencies beat together or with their harmonics. If the three frequency components are represented as single frequencies f, the vision carrier, f,, the color subcarrier and f, the sound carrier, two in-band intermodulation components occur, the most significant at a frequency of
fi, = f, + f , - f,,
= f , + 920455.00Hz
= f, + 1066381.25 Hz
= f, + 1565981.25 Hz
(1.1)
for M/NTSC
for B+G/PAL
for I/PAL
which may cause perceptible interference patterns if the level of the intermodulation component is too high [l]. The maximum power which may be produced by a transposer [4] is limited by the permissible intermodulation level which is typically -53 dBp, i.e. 53 dB below the power transmitted during the synchronizing pulses.
Mathematical analyses [1,2,3,4] represent the transfer characteristic of the amplifier as a series containing 3 terms
0018-9316/88/0900-0344$01.00 0 1988 IEEE
345
-6
I %
L i- :I I o
10 -17
f " FRL3QU ENCY
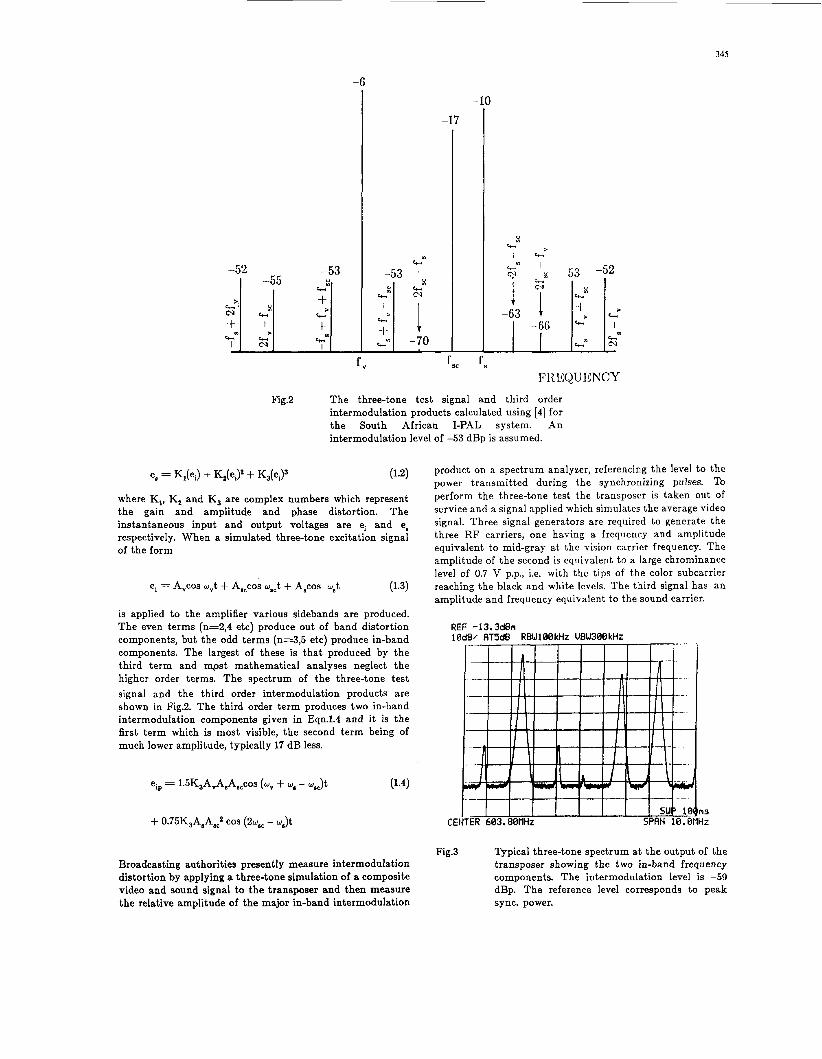
Fig.2 The three-tone test signal and third order intermodulation products calculated using [4] for the South African I-PAL system. An intermodulation level of -53 dBp is assumed.
where K,, K, and K, are complex numbers which represent the gain and amplitude and phase distortion. The instantaneous input and output voltages are ei and e, respectively. When a simulated three-tone excitation signal of the form
ei = A,COS w,t + A,,COS wsct + A,COS w,t (1.3)
is applied to the amplifier various sidebands are produced. The even terms (n=2,4 etc) produce out of band distortion components, but the odd terms (n=3,5 etc) produce in-band components. The largest of these is that produced by the third term and mpst mathematical analyses neglect the higher order terms. The spectrum of the three-tone test signal and the third order intermodulation products are shown in Fig.2. The third order term produces two in-band intermodulation components given in Eqn.l.4 and it is the first term which is most visible, the second term being of much lower amplitude, typically 17 dB less.
eip = 1.5K,AVA,A,,cos (w, + w8 - wJt
+ 0.75K3A,A,,2 COS (2w,, - u,)t
Broadcasting authorities presently measure intermodulation distortion by applying a three-tone simulation of a composite video and sound signal to the transposer and then measure the relative amplitude of the major in-band intermodulation
product on a spectrum analyzer, referencing the level to the power transmitted during the synchronizing pulses. TO perform the three-tone test the transposer is taken out of service and a signal applied which simulates the average video signal. Three signal generators are required to generate the three RF carriers, one having a frequency and amplitude equivalent to mid-gray at the vision carrier frequency. The amplitude of the second is equivalent to a large chrominance level of 0.7 V p.p., i.e. with the tips of the color subcarrier reaching the black and white levels. The third signal has an amplitude and frequency equivalent to the sound carrier.
REF -13.3dBm 10dBI AT5dB RBW100kHz UBW300kHz
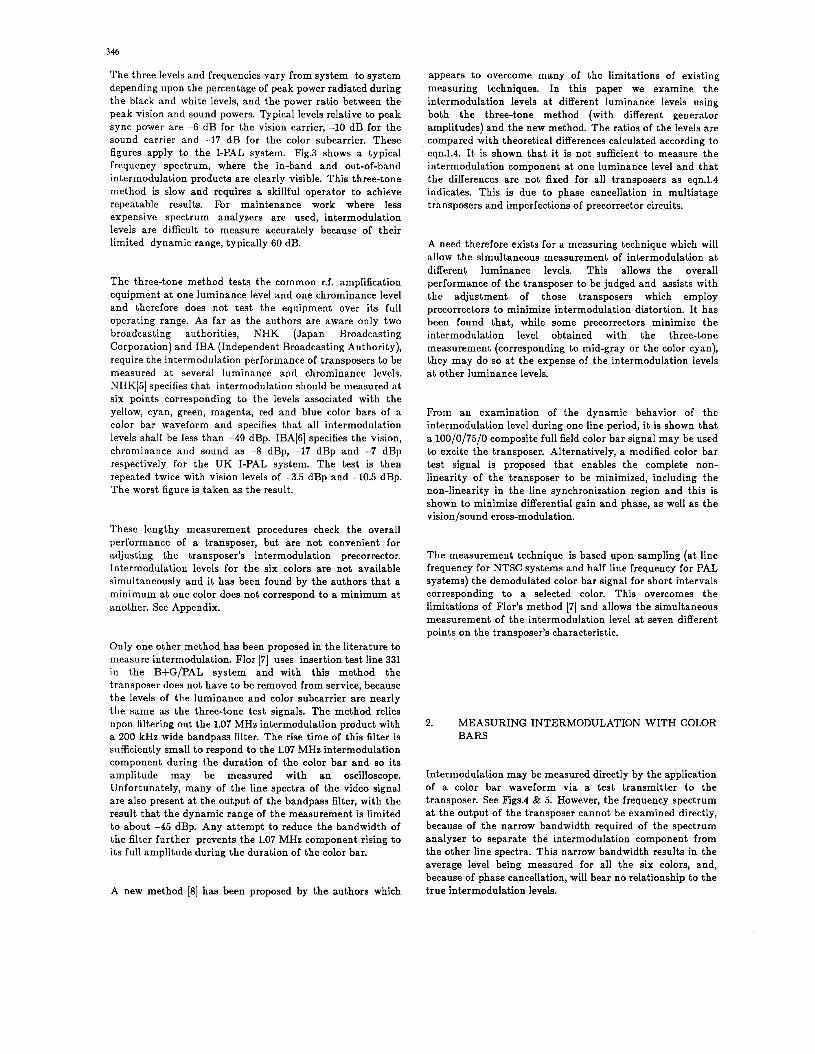
Fig.3 Typical three-tone spectrum at the output of the transposer showing the two in-band frequency components. The intermodulation level is -59 dBp. The reference level corresponds to peak sync. power.
346
The three levels and frequencies vary from system to system depending upon the percentage of peak power radiated during the black and white levels, and the power ratio between the peak vision and sound powers. Typical levels relative to peak sync power are -6 dB for the vision carrier, -10 dB for the sound carrier and -17 dB for the color subcarrier. These figures apply to the I-PAL system. Fig.3 shows a typical frequency spectrum, where the in-band and out-of-band intermodulation products are clearly visible. This three-tone method is slow and requires a skillful operator to achieve repeatable results. For maintenance work where less expensive spectrum analyzers are used, intermodulation levels are difficult to measure accurately because of their limited dynamic range, typically 60 dB.
The three-tone method tests the common r.f. amplification equipment a t one luminance level and one chrominance level and therefore does not test the equipment over its full operating range. As far as the authors are aware only two broadcasting authorities, NHK (Japan Broadcasting Corporation) and IBA (Independent Broadcasting Authority), require the intermodulation performance of transposers to be measured at several luminance and chrominance levels. NHK[5] specifies that intermodulation should be measured at six points corresponding to the levels associated with the yellow, cyan, green, magenta, red and blue color bars of a color bar waveform and specifies that all intermodulation levels shall be less than -49 dBp. IBA[6] specifies the vision, chrominance and sound as -8 dBp, -17 dBp and -7 dBp respectively for the UK I-PAL system. The test is then repeated twice with vision levels of -3.5 dBp and -10.5 dBp. The worst figure is taken as the result.
These lengthy measurement procedures check the overall performance of a transposer, but are not convenient for adjusting the transposer’s intermodulation precorrector. Intermodulation levels for the six colors are not available simultaneously and it has been found by the authors that a minimum at one color does not correspond to a minimum at another. See Appendix.
Only one other method has been proposed in the literature to measure intermodulation. Flor [7] uses insertion test line 331 in the B+G/PAL system and with this method the transposer does not have to be removed from service, because the levels of the luminance and color subcarrier are nearly the same as the three-tone test signals. The method relies upon filtering out the 1.07 MHz intermodulation product with a 200 kHz wide bandpass filter. The rise time of this filter is sufficiently small to respond to the 1.07 MHz intermodulation component during the duration of the color bar and so its amplitude may be measured with an oscilloscope. Unfortunately, many of the line spectra of the video signal are also present at the output of the bandpass filter, with the result that the dynamic range of the measurement is limited to about -45 dBp. Any attempt to reduce the bandwidth of the filter further prevents the 1.07 MHz component rising to its full amplitude during the duration of the color bar.
A new method [8] has been proposed by the authors which
appears to overcome many of the limitations of existing measuring techniques. In this paper we examine the intermodulation levels a t different luminance levels using both the three-tone method (with different generator amplitudes) and the new method. The ratios of the levels are compared with theoretical differences calculated according to eqn.l.4. It is shown that i t is not sufficient to measure the intermodulation component at one luminance level and that the differences are not fixed for all transposers as eqn.l.4 indicates. This is due to phase cancellation in multistage transposers and imperfections of precorrector circuits.
A need therefore exists for a measuring technique which will allow the simultaneous measurement of intermodulation at different luminance levels. This allows the overall performance of the transposer to be judged and assists with the adjustment of those transposers which employ precorrectors to minimize intermodulation distortion. It has been found that, while some precorrectors minimize the intermodulation level obtained with the three-tone measurement (corresponding to mid-gray or the color cyan), they may do so at the expense of the intermodulation levels at other luminance levels.
From an examination of the dynamic behavior of the intermodulation level during one line period, it is shown that a 100/0/75/0 composite full field color bar signal may be used to excite the transposer. Alternatively, a modified color bar test signal is proposed that enables the complete non- linearity of the transposer to be minimized, including the non-linearity in the line synchronization region and this is shown to minimize differential gain and phase, as well as the vision/sound cross-modulation.
The measurement technique is based upon sampling (at line frequency for NTSC systems and half line frequency for PAL systems) the demodulated color bar signal for short intervals corresponding to a selected color. This overcomes the limitations of Flor’s method [7] and allows the simultaneous measurement of the intermodulation level a t seven different points on the transposer’s characteristic.
2. MEASURING INTERMODULATION WITH COLOR BARS
Intermodulation may be measured directly by the application of a color bar waveform via a test transmitter to the transposer. See Figs.4 & 5. However, the frequency spectrum at the output of the transposer cannot be examined directly, because of the narrow bandwidth required of the spectrum analyzer to separate the intermodulation component from the other line spectra. This narrow bandwidth results in the average level being measured for all the six colors, and, because of phase cancellation, will bear no relationship to the true intermodulation levels.
341
iiiterniodulation d is tort i on detector
Fig.4 The line waveform of 100/0/75/0 color bars used t o measure intermodulation distortion.
* derriotlula(,or video
1 I
color bar
Fig.5 Block diagram of the test gear configuration used t o measured intermodulation with the color bar waveform shown in Fig.4.
SYSTEMS M/NTSC B+G/PAL I/PAL
Video Bandwidth B" 4.2 MHz 5.0 MHz 5.5 MIIz
Video rise time 0.25 p s 0.20 p s 0.18 p s
tr" = 1/B"
Chrom. Bandwidth JL +0.62 MHz +0.57 MHz +LO7 MHz
Chrom. Rise time -1.30 -1.30 -1.30
0.52 p s 0.54 p s 0.42 p s t r s c = l/Bsc
Rise time of I.M. tr = t r s c 0.52 p s 0.54 p s 0.42 p s
_______
Table 1. Estimated Rise Times of the Intermodulation Components
The dynamic behavior of the intermodulation level cannot be examined directly, but may be estimated from the rise time of t he chrominance signal. The rise time of the luminance signal is small in comparison, as shown in Table 1. The sound subcarrier level is constant.
The duration of each of the color bars in Fig.4 is one tenth of the line period or 6 .4~s. There is therefore ample time for the intermodulation component to reach its full value during each color bar. Measurements may be performed about lps from the beginning of each color bar. The color bars and sound carrier therefore apply the three tones to the transposer, changing levels in rapid succession and with suitable processing may be used t o give all six intermodulation levels in histogram form as shown in Fig.6.
Fig.6 The histogram waveform of the intermodulation detector displaying intermodulation levels associated with the color burst, zero level (white), yellow, cyan, green, magenta, red, blue, zero level (black) and zero level (sync.).
The processing is best implemented a t baseband frequencies and a demodulator is employed to give a video signal as shown in Fig.5. The video signal is then applied to the intermodulation detector whose block diagram is shown in Fig.7. The signal is first bandpass filtered to remove most of t,he energy associated with the principal frequency components in the color bar waveform. These are the line frequency components associated with the luminance component and the color subcarrier sidebands. The sound carrier is removed by the demodulator. The passband used to select either the 920 kHz (NTSC), 1.07 MHz (B+G/PAL), or 1.57 MIlz (I/PAL) intermodulation component is from 500 kHz to 2MIlz.
The output signal from the bandpass filter is then fed to the mixer which samples the video signal for a short period (1.8~s) every line a t a point corresponding to a particular color bar. See Fig.8. In this way the mixer is only excited with intermodulation components of constant amplitude and phase which do not vary from one line t o the next. For PAL
ov
___,
L
d
LINE SYNC EXTRACTOR
SELECT ‘EITHER BURST. YELLOW, CYAN. GREEN.
MAGENTA, RED OR BLUE.
w Y C
LINE n + l LINE n
a
C
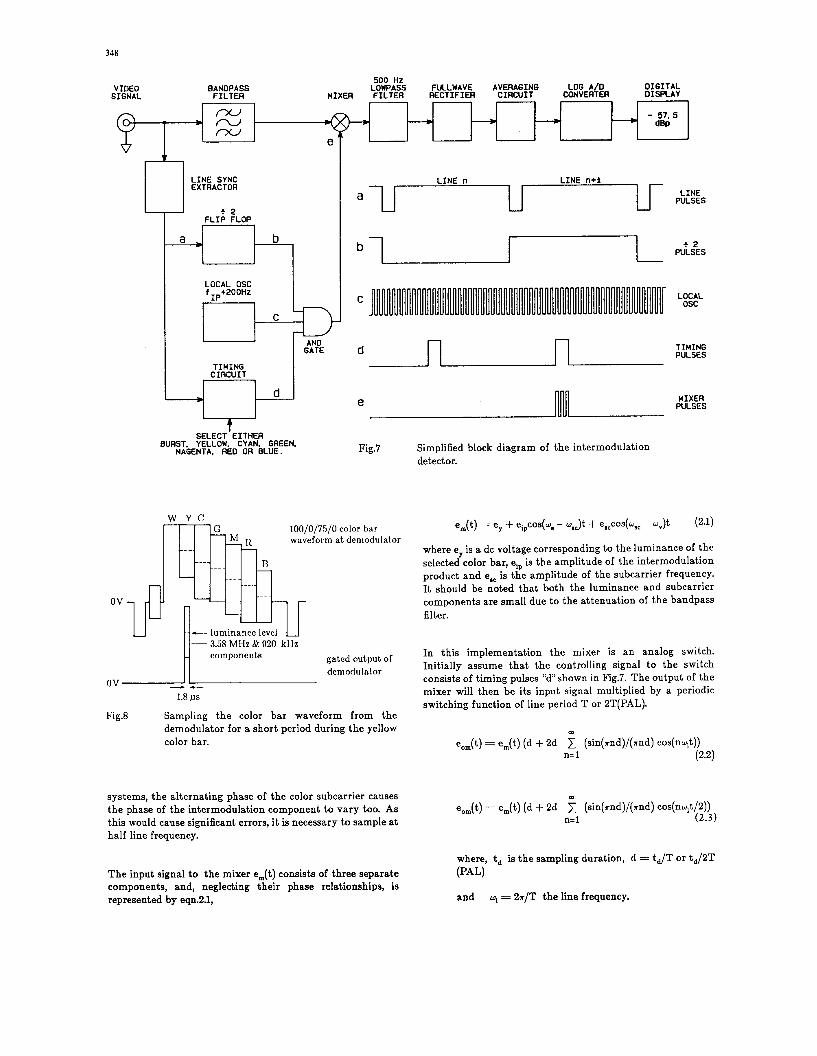
Fig9 Simplified block diagram of the intermodulation detector.
where e, is a dc voltage corresponding to the luminance of the selected color bar, eip is the amplitude of the intermodulation product and e,, is the amplitude of the subcarrier frequency. It should be noted that both the luminance and subcarrier components are small due to the attenuation of the bandpass filter.
level U 3.58 MIIz & 920 kllz components gated output of
demodulator -- ov 1.8 ,us
Fig.8 Sampling the color bar waveform from the demodulator for a short period during the yellow color bar.
systems, the alternating phase of the color subcarrier causes the phase of the intermodulation component to vary too. AS this would cause significant errors, it is necessary to sample at half line frequency.
The input signal to the mixer e,(t) consists of three separate components, and, neglecting their phase relationships, is represented by eqn.2.1,
In this implementation the mixer is an analog switch. Initially assume that the controlling signal to the switch consists of timing pulses “d”shown in Fig.7. The output of the mixer will then be its input signal multiplied by a periodic switching function of line period T or 2T(PAL).
m
e,,(t) = e,(t) (d + 2d 1 (sin(snd)/(+nd) cos(nwlt)) n = l (2.2)
where, t, is the sampling duration, d = t,/T or td/2T (PAL)
and W, = 2r/T the line frequency.
In Tables 2 and 3 below, the frequency spectrum at the output of the mixer is evaluated for components in the vicinity of the intermodulation frequency for the M/NTSC and B+G/PAL systems respectively. The I/PAL system is very similar to the B+G/PAL systems except that the different sound-vision frequency spacing of 5999600 Hz gives intermodulation frequencies of about 1.57 MHz.
Examination of the frequencies in Tables 2 & 3 shows that a frequency component exists at the output of the mixer at the intermodulation frequency which is sufficiently separated from the other components to enable the amplitude of the intermodulation component to be measured. The component lies midway between the luminance components, a fact which is fundamental to television systems and is determined by the selection of the sound subcarrier, color subcarrier and line frequencies. In the case of the M/NTSC system the nearest line frequency is half a line frequency away or 7867 Hz. For
the B+G/PAL systems the spacing is about a quarter of a line frequency away or 3881 Hz. A similar frequency spacing exists for the I/PAL system.
Tables 2 & 3 also indicate that a color subcarrier component exists very much closer to the intermodulation frequency, but that its amplitude is much smaller. The function of the bandpass filter is to reduce this amplitude even further so that the intermodulation component can be isolated.
The measurement of eip may be performed using a frequency spectrum analyzer or by simply heterodyning the intermodulation component down to a lower frequency for measurement. This latter approach is shown in Fig.7, where the mixer is fed with a burst of pulses (signal “e”) at a frequency of f,, + 200 Hz. Assuming a square wave local oscillator, the peak amplitude of the 200 Hz component at the
____ __ - .- ___-
Frequency Component Amplitude Hz Volts peak
__
1050756 f,, n = 2 0.0140 e,* 1050806 fsc n = 433 0.0002 e , 1054688 f , n = 135 0.0000 ey
f,, n = 1 0.0141 elp 1058569 1058619 f,, n = 432 0.0002 est 1062500 f , n = 136 0.0013 ey 1066381 f 1, 0.0141 erp 1066431 fsc n = 431 0.0001 e,, 1070313 f , n = 137 0.0011 ey 1074194 f,, n = 1 0.0141 elp
fsc n = 430 0.0005 e, 1074244 f , n = 138 0.0009 ey 1078125
0.0140 elp 1082006 f,, n = 2
Table 3. Frequency components at the output of the mixer shown in Fig.7 assuming the mixer is controlled by timing pulses “d”. System B+G/PAL with
Video intermod. freq.: f p = (f, - fuc) = 1066381 HZ
Line frequency: f , = 15625 Hz
Sound vision spacing: f, - f, = 5.5 MHz
Color subcarrier spacing: fsc = f,, - f, = 4433618.75 Ha
Sampling duration: t, = 1 . 8 ~ ~
Duty cycle: d = t, f, = 0.0283
Duty cycle: d = t, f,/2 = 0.0141
350
output of the mixer will be
e, = eip d / r (2.4)
The actual amplitude of the 200 Hz component is quite small because of the very small duty factor required to select a particular color bar. Like the three-tone method, the color bar method references the dBp level to peak sync. power. The voltage excursion between the sync. pulse level and the zero carrier level at the output of the demodulator, is 1.12 V dc for the M/NTSC system. Taking an example of an intermodulation level of -50 dBp, the input voltage to the mixer at the intermodulation frequency of 920 kHz will be
eip = 2 x 1.12 x 10-50/20 = 7.08 mV peak at -50 dBp
where the factor of 2 accounts for the 6 dB gain in the vestigial sideband filter in the demodulator at 920 kHz. The amplitude of the 200Hz component at the output of the mixer will be
e,, = 7.08 mV x d / r = 64 ,AV peak (at -50 dBp for M/NTSC)
(2.6)
where d = 0.0283
For the B+G/PAL and I/PAL systems the amplitude is about one half this level because the color bar can only be sampled every other line (d=0.0141). There are also small differences in the voltage excursion between the sync. pulse level and the zero carrier level (B+G/PAL l . lOV, I/PAL 1.25 V). Although small, with suitable amplification and lowpass filtering the 200 Hz component can be extracted to determine its amplitude. This amplitude is directly related to the amplitude of the intermodulation component. The authors used an eighth-order Butterworth filter with a -3 dB cut-off frequency of 500 Hz to achieve easily a measurement range of -70 dBp to -40 dBp with an accuracy of +0.5 dBp with a noise floor of -80 dBp. The output of the full wave rectifier in Fig.7 was averaged with a three second time constant and converted to a logarithmic scale to display the intermodulation level directly in dBp.
waveform monitor of the seven intermodulation levels. Thus the histogram was able to display amplitude changes smoothly in real time as the transposer was adjusted.
To perform the measurements it is necessary to interrupt the program and transmit color bars. During program transmissions, the level of intermodulation occurring during the duration of the color burst pulse can be monitored continuously. Modulation of the FM sound carrier causes a reduction in the indicated level of the intermodulation component, but during quiet moments the level may be assessed. A chart recorder may usefully be employed for this purpose. As the duration of the burst is only 2.25 ps, the measurement during the burst under-reads by a fixed 3 dB. However, it provides a facility to continuously monitor the performance of a transposer while in service.
3. MEASUREMENTS
The color bar measurement technique has been tested extensively on TV transposers of the South African Broadcasting Corporation to see whether it is really easier to use than the three-tone method and whether it raises aspects of transposer performance obscure to the three-tone test. A 100/0/75/0 color bar waveform was used for all the intermodulation measurements. The luminance and chrominance levels in the cyan color bar correspond very closely to the levels used by the South African Broadcasting Corporation in their three-tone test. The system used is I/PAL and the three-tone intermodulation level of the specification is -53 dBp. Color bar and three-tone test readings agreed in all cases to f l dB.
The histogram shown in Fig.6 was obtained by using time division multiplexing techniques. The mixer pulses in Fig.7 were aligned in turn with the color burst and each of the six color bars for a full field period (20ms) with the process repeating every seven field periods. The histogram was produced by sequentially scanning seven memories at the line repetition rate. The contents of the memories correspond to the intermodulation levels during the color burst, yellow, cyan, green, magenta, red, and blue drive levels and thus gave an apparently continuous display on an oscilloscope or
Fig.9
-40
-50
-53
dBP
-60
-70
400 W final
Y C G M I E B
COLOR BARS
Intermodulation performance of a 400 W UHF tetrode output transposer measured using the color bar method.
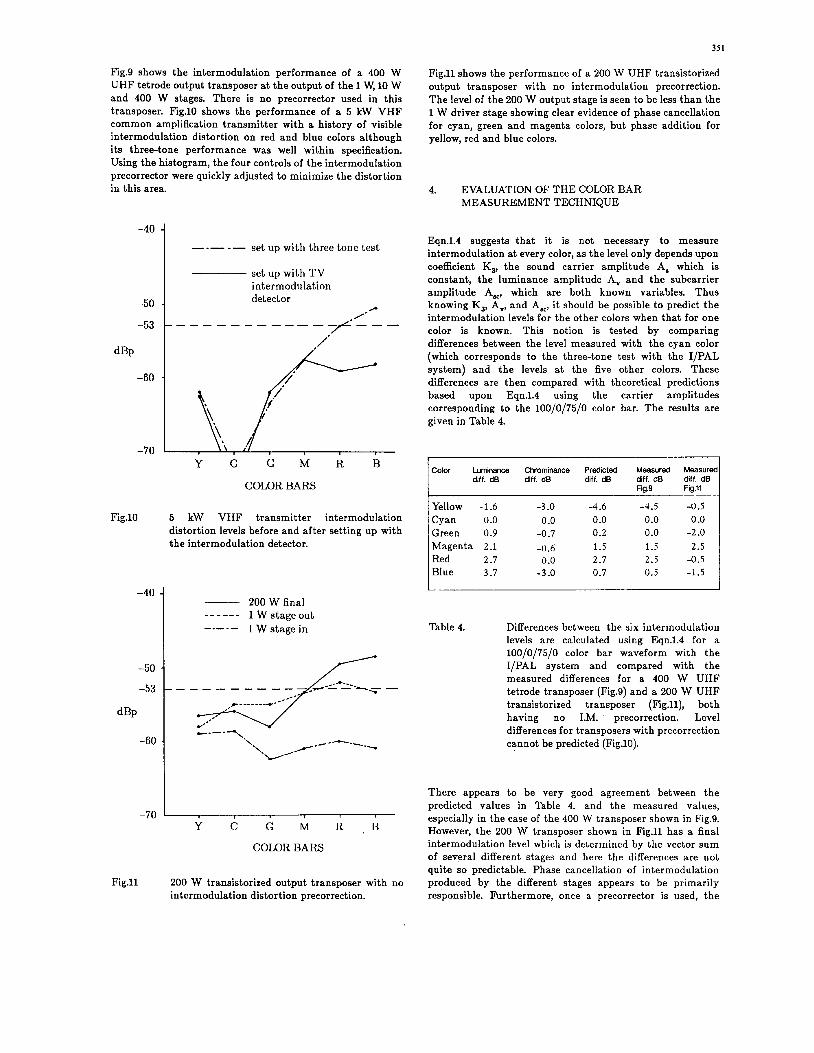
Fig.9 shows the intermodulation performance of a 400 W UHF tetrode output transposer at the output of the 1 W, 10 W and 400 W stages. There is no precorrector used in this transposer. Fig.10 shows the performance of a 5 kW VHF common amplification transmitter with a history of visible intermodulation distortion on red and blue colors although its three-tone performance was well within specification. Using the histogram, the four controls of the intermodulation precorrector were quickly adjusted to minimize the distortion in this area.
-40
-50
-53
dBP
-60
-70
Fig.10
-40
-50
-53
dBP
-60
-70
Fig.11
----- set up with three tone test
set up with TV intermodulation detector
r
. - - - - - - - - - - - -p-< - - /'
Y C G M l t B
COLOR BARS
5 kW VHF transmitter intermodulation distortion levels before and after setting up with the intermodulation detector.
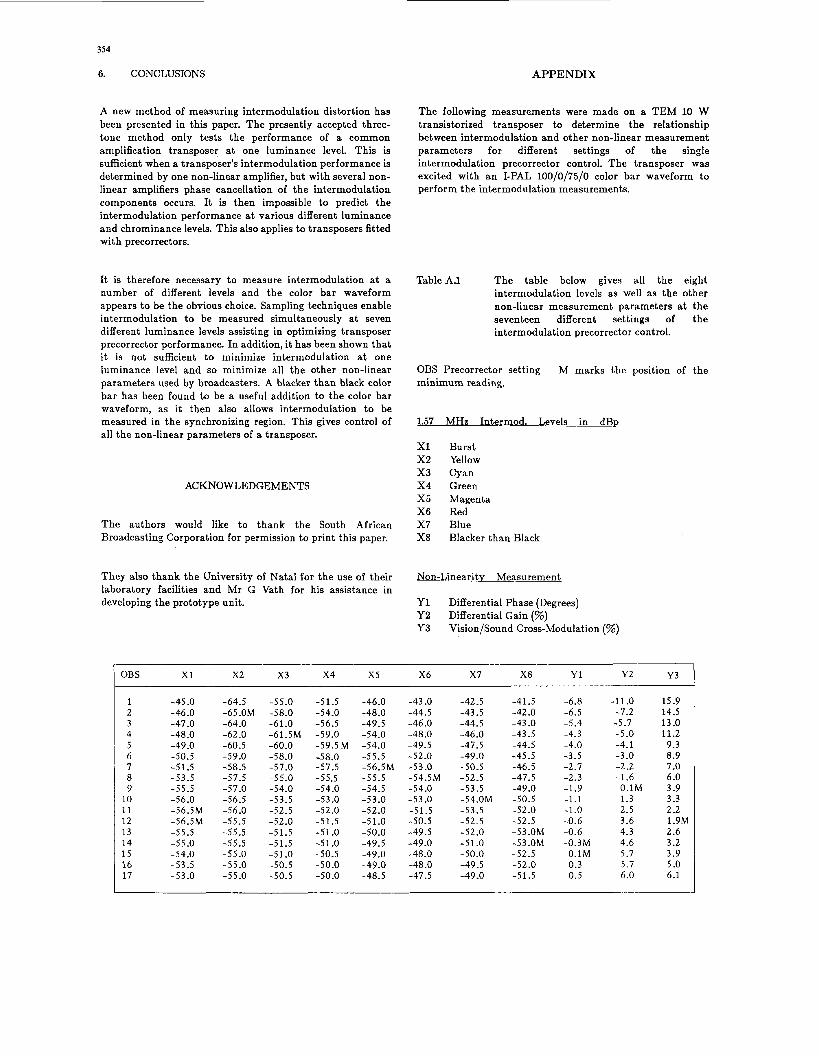
200 W final 1 W stage out 1 W stage in
------ -.- - -
--- '. -/--- \.-.--
Y C G M It , I 3
COLOR BARS
200 W transistorized output transposer with no intermodulation distortion precorrection.
35 1
Fig.11 shows the performance of a 200 W UHF transistorized output transposer with no intermodulation precorrection. The level of the 200 W output stage is seen to be less than the 1 W driver stage showing clear evidence of phase cancellation for cyan, green and magenta colors, but phase addition for yellow, red and blue colors.
4. EVALUATION OF THE COLOR BAR MEASUREMENT TECHNIQUE
Eqn.l.4 suggests that it is not necessary to measure intermodulation at every color, as the level only depends upon coefficient K,, the sound carrier amplitude A, which is constant, the luminance amplitude A, and the subcarrier amplitude A,,, which are both known variables. Thus knowing K,, A,, and A,,, it should be possible to predict the intermodulation levels for the other colors when that for one color is known. This notion is tested by comparing differences between the level measured with the cyan color (which corresponds to the three-tone test with the I/PAL system) and the levels at the five other colors. These differences are then compared with theoretical predictions based upon Eqn.l.4 using the carrier amplitudes corresponding to the 100/0/75/0 color bar. The results are given in Table 4.
Color Luminance Chrominance Predicted Measured Measured diff. dB diff. dB diff. dB diff. dB diff. dB
Table 4. Differences between the six intermodulation levels are calculated using Eqn.l.4 for a 100/0/75/0 color bar waveform with the I/PAL system and compared with the measured differences for a 400 W UHF tetrode transposer (Fig.9) and a 200 W UHF transistorized transposer (Fig.ll), both having no I.M. precorrection. Level differences for transposers with precorrection cannot be predicted (Fig.10).
There appears to be very good agreement between the predicted values in Table 4. and the measured values, especially in the case of the 400 W transposer shown in Fig.9. However, the 200 W transposer shown in Fig.11 has a final intermodulation level which is determined by the vector sum of several different stages and here the differences are not quite so predictable. Phase cancellation of intermodulation produced by the different stages appears to be primarily responsible. Furthermore, once a precorrector is used, the
352
differences are totally unrelated to Eqn.l.4. Finally, while K, is a constant for a given transposer it will vary between different types of transposers. It therefore appears essential to measure intermodulation at different luminance and color levels for all but the simplest of transposers.
5. WIDER APPLICATIONS OF THE COLOR BAR TECHNIQUE
The plethora of non-linear distortion measures used by the broadcaster suggests that there is no useful relationship between them. Some other non-linear distortion measures relevant to common amplification television transmitters are described below. However, theoretical studies [4] applied to the L/SECAM system show that for an amplifier represented by Eqn.l.2 this is not so and that all the parameters may determined by the complex coefficients K,, K, and K,. Extending this theory to the NTSC and PAL systems, it is easily shown using Eqns.l.2 & 1.3 that the non-linear parameters are also directly related according to the Eqns. given below.
1. Differential eain
Differential gain is defined as the maximum variation of chrominance gain between black and white levels. The variation is caused by a distortion component at freqency fat. When added to the chrominance signal, it either increases or decreases the amplitude of the chrominance signal. Assuming the two components to be in phase, Eqn.5.1 gives the maximum differential gain error.
AG = (1 + 1.5kA; + 1.5kA; + 0.75kA8:) 100 % ( 5 4
where k = K,/K,.
2. Differential phase
Differential phase is defined as the maximum variation in phase of the color subcarrier with different luminance levels. Assuming the two components to be 90 degrees out of phase, Eqn.5.2 gives the maximum differential phase error.
A? = arctan(l.5 kAV2 + 1.5kA: + 0.75kAS,2) ( 5 4
where k = K,/K,
3. Visionfsound cross-modulation
Vision/sound cross-modulation is defined as the variation of the sound carrier amplitude caused by the variation of the vision carrier level and is particularly noticeable during the synchronization periods when
the vision carrier is at a maximum. It is normally expressed as a percentage of the sound carrier amplitude. The variation is caused by a distortion component at frequency fa. When added to the sound carrier it modifies the resultant sound carrier amplitude modulating the carrier at the line frequency. The percentage distortion may be estimated using Eqn.5.3.
m = (1.5kA: + 0.75kA;) 100 %
where k = K,/K,.
(5.3)
4. Svnc. Dulse crushing
Sync. pulse crushing is defined as the change in the picture/sync amplitude ratio caused by non-linear distortion and is determined by the variation of luminance gain in the vicinity of the sync. pulses compared with a distortionless system. It may be estimated using Eqn.5.4.
AS = 20 log(1 + 1.5kA; + 0.75kA;) dB (5.4)
where, k = K,/K, and A, is the mean value of the vision carrier in the sync. pulse region.
From the above analyses it is clear that for a transposer described by Eqn.l.2 all these non-linear parameters are related and determined by the coefficients K, and K,. However, when a transposer consists of several stages, or where several amplifiers are in parallel, phase cancellation may occur causing errors in these relationships. For transposers with precorrectors the relationships do not apply because of the complex nature of the phase cancellation of the intermodulation products.
The color bar method allows the intermodulation level to be measured over a number of luminance levels and the opportunity exists to also measure the intermodulation level which would occur if the luminance level extended into the synchronization region. This allows the complete transfer characteristic of the transposer to be investigated, simplifying the simultaneous satisfaction of the various non- linear distortion standards such as intermodulation and vision/sound cross modulation which are notoriously difficult to optimize simultaneously. The interaction of the two distortions is clearly visible by this means and has been found in practice to greatly simplify the adjustment procedure.
The modified color bar waveform shown in Fig.12 was adapted from the normal 100/0/75/0 color bar by converting the usual blue color bar to a blacker than black luminance level of -150 mV with a chrominance amplitude of 300 mV p.p. With the addition of this color bar it was possible to measure the intermodulation level at eight points on a transposer’s characteristic. A comprehensive set of
Fig.12 Modified blacker than black color bar waveform used to measure intermodulation in the synchronizing region.
measurements were performed on a TEM 10 W solid state transposer. Eight intermodulation measurements were performed as well as conventional measurements of differential gain, differential phase and vision/sound cross modulation. These measurements were repeated seventeen times with different settings of the precorrector and the results are given in the Appendix. Some of the data is plotted in Figs.13 to 15.
From these figures it is apparent that minimizing the cyan color bar (three-tone test) is not the best way of minimizing differential gain, differential phase or vision/sound cross- modulation. A full statistical analysis of this data will be published later, but it would seem that the three different parameters that are most affected by the color bars are given in Table 5. It is therefore apparent that the equations relating the non-linear parameters are not valid for transposers employing precorrectors to minimize intermodulation distortion.
I Parameter I Color bars for best minimizat ion
Vision/sound cross -mod
Differential gain Differential phase Blacker than black
Burst, blacker than black Blue, red and magenta
Table 5. Optimization of the parameters shown above was best achieved with this 10 W transistorized transposer by optimizing the color bars shown.
20
15
10
5
0
%
b l a c k e r t h a n b l a c k (dBp) 1-40
-50
dBP
-60
__..' * - . . . . . . . --.- *....
V i s i o n sound c r o s s mod. (%) -70 , -
1 5 10 15 17 PRECORRECTOR SETTING
Fig.13 Vision/sound cross-modulation and intermodulation distortion levels of a 10 W transistorized transposer at different precorrector settings.
5
0
-5
-10
%
- -60
Fig.14
0
m W W [I El w -5 n
1 5 10 15 17 PRECORRECTOR SETTING
Differential gain and intermodulation distortion levels of a 10 W transistorized transposer a t different precorrector settings.
,Blacker t h a n b l a c k (dBp) ___.-.
......
(Degrees),..." ....
-40
-50
dBp
-60
-70 -10 1 5 10 15 17
PRECORRECTOR SETTING
Fig.15 Differential phase and intermodulation distortion levels of a 10 W transistorized transposer at different precorrector settings.
354
6. CONCLUSIONS APPENDIX
A new method of measuring intermodulation distortion has been presented in this paper. The presently accepted three- tone method only tests the performance of a common amplification transposer at one luminance level. This is sufficient when a transposer’s intermodulation performance is determined by one non-linear amplifier, but with several non- linear amplifiers phase cancellation of the intermodulation components occurs. It is then impossible to predict the intermodulation performance at various different luminance and chrominance levels. This also applies to transposers fitted with precorrectors.
It is therefore necessary to measure intermodulation at a number of different levels and the color bar waveform appears to be the obvious choice. Sampling techniques enable intermodulation to be measured simultaneously at seven different luminance levels assisting in optimizing transposer precorrector performance. In addition, it has been shown that it is not sufficient to minimize intermodulation at one luminance level and so minimize all the other non-linear parameters used by broadcasters. A blacker than black color bar has been found to be a useful addition to the color bar waveform, as it then also allows intermodulation to be measured in the synchronizing region. This gives control of all the non-linear parameters of a transposer.
ACKNOWLEDGEMENTS
The authors would like to thank the South African Broadcasting Corporation for permission to print this paper.
They also thank the University of Natal for the use of their laboratory facilities and Mr G Vath for his assistance in developing the prototype unit.
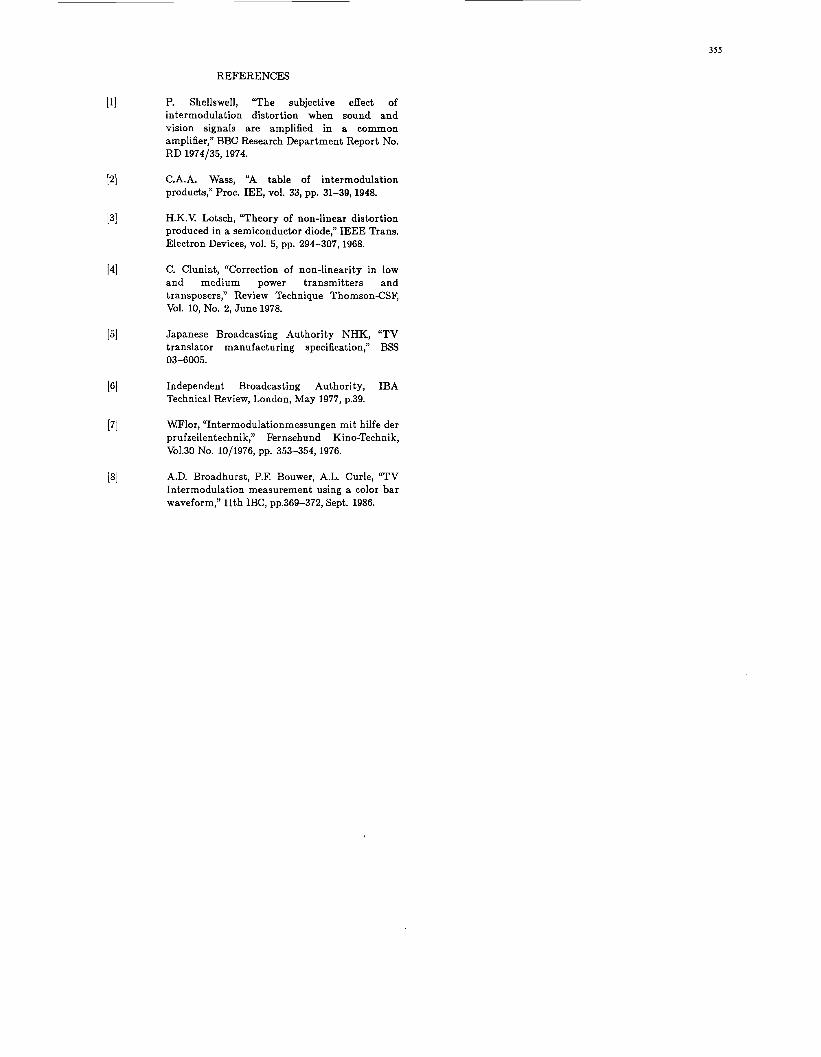
The following measurements were made on a TEM 10 W transistorized transposer to determine the relationship between intermodulation and other non-linear measurement parameters for different settings of the single intermodulation precorrector control. The transposer was excited with an I-PAL 100/0/75/0 color bar waveform to perform the intermodulation measurements.
Table A.l The table below gives all the eight intermodulation levels as well as the other non-linear measurement parameters at the seventeen different settings of the intermodulation precorrector control.
OBS Precorrector setting - M marks the position of the minimum reading.
1.57 MHz Intermod. Levels in dBD
x 1 x 2 x 3 X4 x 5 X6 x 7 X8
Burst Yellow Cyan Green Magenta Red Blue Blacker than Black
P. Shellswell, “The subjective effect of intermodulation distortion when sound and vision signals are amplified in a common amplifier,” BBC Research Department Report No. RD 1974/35,1974.
C.A.A. Wass, “A table of intermodulation products,” Proc. IEE, vol. 33, pp. 31-39,1948.
H.K.V. Lotsch, “Theory of non-linear distortion produced in a semiconductor diode,” IEEE Trans. Electron Devices, vol. 5, pp. 294-307,1968.
C. Cluniat, “Correction of non-linearity in low and medium power transmitters and transposers,” Review Technique Thomson-CSF, Vol. 10, No. 2, June 1978.
Japanese Broadcasting Authority NHK, “TV translator manufacturing specification,” BSS 03-6005.
Independent Broadcasting Authority, IBA Technical Review, London, May 1977, p.39.
WFlor, “Intermodulationmessungen mit hilfe der prufzeilentechnik,” Fernsehund Kino-Technik, Vo1.30 No. 10/1976, pp. 353-354,1976.
A.D. Broadhurst, P.l? Bouwer, A.L. Curle, “TV Intermodulation measurement using a color bar waveform,” 11th IBC, pp.369-372, Sept. 1986.