UCRL-ID-147523 Meteorological Monitoring on Bikini Atoll: System Description and Data Summary (May 2000–April 2001) F.Gouveia, R. Bradsher, J. Brunk, W. Robison, and T. Hamilton January 1, 2002 Lawrence Livermore National Laboratory U.S. Department of Energy
Transcript
UCRL-ID-147523
Meteorological Monitoring on Bikini Atoll: System Description and Data Summary (May 2000–April 2001)
F.Gouveia, R. Bradsher, J. Brunk, W. Robison, and T. Hamilton
January 1, 2002LawrenceLivermoreNationalLaboratory
U.S. Department of Energy
DISCLAIMER This document was prepared as an account of work sponsored by an agency of the United StatesGovernment. Neither the United States Government nor the University of California nor any of theiremployees, makes any warranty, express or implied, or assumes any legal liability or responsibility forthe accuracy, completeness, or usefulness of any information, apparatus, product, or process disclosed, orrepresents that its use would not infringe privately owned rights. Reference herein to any specificcommercial product, process, or service by trade name, trademark, manufacturer, or otherwise, does notnecessarily constitute or imply its endorsement, recommendation, or favoring by the United StatesGovernment or the University of California. The views and opinions of authors expressed herein do notnecessarily state or reflect those of the United States Government or the University of California, andshall not be used for advertising or product endorsement purposes. This work was performed under the auspices of the U. S. Department of Energy by the University ofCalifornia, Lawrence Livermore National Laboratory under Contract No. W-7405-Eng-48.
This report has been reproduced directly from the best available copy.
Available electronically at http://www.doc.gov/bridge
Available for a processing fee to U.S. Department of Energy And its contractors in paper from
U.S. Department of Energy Office of Scientific and Technical Information
Lawrence Livermore National Laboratory Technical Information Department’s Digital Library
http://www.llnl.gov/tid/Library.html
UCRL-ID-147523
Meteorological Monitoring on Bikini Atoll: System Description and Data Summary(May 2000—April 2001)
Frank Gouveia
Rayla Bradsher
James Brunk
William Robison
Terry Hamilton
Manuscript Date: January 2002
Lawrence Livermore National Laboratory University of California • Livermore, CA • 94551
ii
iii
Table of Contents
Introduction ................................................................................................................................................................................. 1 System Description ..................................................................................................................................................................... 1 Locations ................................................................................................................................................................................. 1 Sensors..................................................................................................................................................................................... 3 Manual Ran Gauge ................................................................................................................................................................ 3 Data Logger ............................................................................................................................................................................ 3 DAPS........................................................................................................................................................................................ 3 Procedures.................................................................................................................................................................................... 3 Inventory of Sensors .............................................................................................................................................................. 4 Calibration of Sensors............................................................................................................................................................ 4 Wind Speed..................................................................................................................................................................... 4 Wind Direction ............................................................................................................................................................... 4 Temperature.................................................................................................................................................................... 4 Relative Humidity.......................................................................................................................................................... 4 Solar ................................................................................................................................................................................. 4 Rain Gauge...................................................................................................................................................................... 5 Installation of Sensors............................................................................................................................................................ 5 Data Recovery......................................................................................................................................................................... 6 Via Satellite ..................................................................................................................................................................... 6 On Site ............................................................................................................................................................................. 6 Monthly Files .......................................................................................................................................................................... 6 Annual Files............................................................................................................................................................................ 6 Summary of 2000–2001 Data...................................................................................................................................................... 6 Mission and Station Reports................................................................................................................................................. 7 Spring 2000 Mission....................................................................................................................................................... 7 Spring 2001 Mission....................................................................................................................................................... 7 House 36.......................................................................................................................................................................... 7 Control Plot..................................................................................................................................................................... 8 Eneu ................................................................................................................................................................................. 8 Historical Rainfall Data .............................................................................................................................................................. 8 Rainfall Since May 2000............................................................................................................................................................ 11 Wind Speed................................................................................................................................................................................ 12 Monthly Average Wind Speed ................................................................................................................................................ 12 Monthly Average Air Temperature ........................................................................................................................................ 12 Annual Windrose ...................................................................................................................................................................... 14 Summary 15 Acknowledgment ...................................................................................................................................................................... 15 References................................................................................................................................................................................... 15
iv
Appendix A. Wiring Diagrams ............................................................................................................................................... 16 Appendix B. Logger Programs ................................................................................................................................................ 18 Appendix C. FORTRAN Code to Interpret 3-Character Data............................................................................................. 28 Appendix D. Monthly Plots of Hourly Data.......................................................................................................................... 30 Appendix E. Monthly Tables of Daily Rainfall ..................................................................................................................... 74 Appendix F. Historical Monthly Totals of Rainfall............................................................................................................... 87 Appendix G. Wind Rose Tables .............................................................................................................................................. 93
List of Tables
Table 1. Brief description of the meteorological stations currently located on Bikini Atoll. ............................................. 2 Table 2. List of variables measured at each station and the type of sensors used. ............................................................. 3 Table 3. List of sensors used by the Marshall Islands Program............................................................................................. 5 Table 4. Interpretation of the DAPS download message string. ........................................................................................... 7 Table 5. Historical values of the annual total rain (inches) for the Bikini Atoll gauges. ................................................... 9 Table 6. Historical values of monthly average rain (inches) for Bikini Atoll gauges. ...................................................... 11
List of Figures
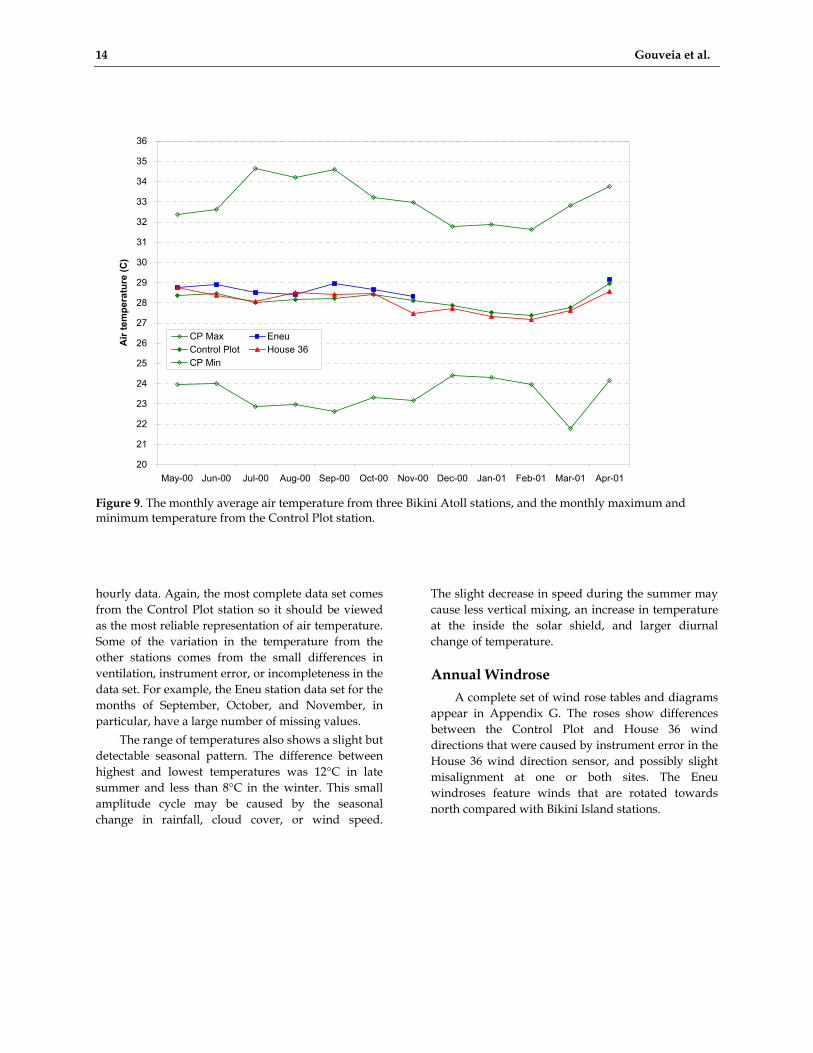
Figure 1. Map of Bikini Island with the locations of meteorological stations. .................................................................... 2 Figure 2. Map of Eneu Island with the location of the meteorological station.................................................................... 2 Figure 3. Comparison of Relative Humidity as measures at the Control Plot and House 36 stations............................. 9 Figure 4. Annual total rainfall for the year 1985 through 2000 from the Bikini Island average...................................... 10 Figure 5. Monthly average of rain based on the best estimate of all Bikini Island data................................................... 10 Figure 6. Cumulative daily values of rainfall for the six rain gauges on Bikini Atoll for the period starting 6 May 2000 through 30 April 2001. ........................................................................................................................... 12 Figure 7. Histogram of cumulative frequency of wind speed class using all available data from May 2000 through April 2001. ................................................................................................................................................. 13 Figure 8. The monthly average wind speed from three Bikini Atoll stations.................................................................... 13 Figure 9. The monthly average air temperature from three Bikini Atoll stations, and the monthly maximum and minimum temperature from the Control Plot station................................................................................ 14
1
Meteorological Monitoring on Bikini Atoll: System Description and Data Summary (May 2000 - April 2001)
Frank Gouveia, Rayla Bradsher, Jim Brunk, William Robison and Terry Hamilton
Introduction
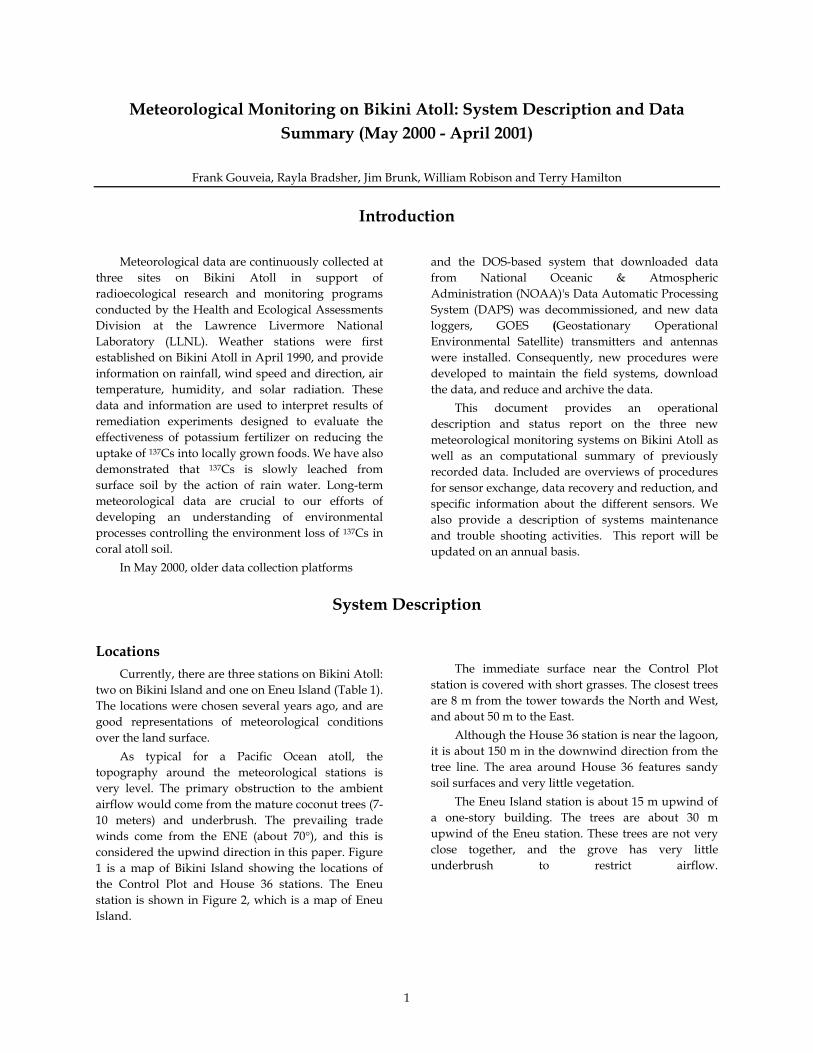
Meteorological data are continuously collected at three sites on Bikini Atoll in support of radioecological research and monitoring programs conducted by the Health and Ecological Assessments Division at the Lawrence Livermore National Laboratory (LLNL). Weather stations were first established on Bikini Atoll in April 1990, and provide information on rainfall, wind speed and direction, air temperature, humidity, and solar radiation. These data and information are used to interpret results of remediation experiments designed to evaluate the effectiveness of potassium fertilizer on reducing the uptake of 137Cs into locally grown foods. We have also demonstrated that 137Cs is slowly leached from surface soil by the action of rain water. Long-term meteorological data are crucial to our efforts of developing an understanding of environmental processes controlling the environment loss of 137Cs in coral atoll soil.
In May 2000, older data collection platforms
and the DOS-based system that downloaded data from National Oceanic & Atmospheric Administration (NOAA)'s Data Automatic Processing System (DAPS) was decommissioned, and new data loggers, GOES (Geostationary Operational Environmental Satellite) transmitters and antennas were installed. Consequently, new procedures were developed to maintain the field systems, download the data, and reduce and archive the data.
This document provides an operational description and status report on the three new meteorological monitoring systems on Bikini Atoll as well as an computational summary of previously recorded data. Included are overviews of procedures for sensor exchange, data recovery and reduction, and specific information about the different sensors. We also provide a description of systems maintenance and trouble shooting activities. This report will be updated on an annual basis.
System Description
Locations Currently, there are three stations on Bikini Atoll:
two on Bikini Island and one on Eneu Island (Table 1). The locations were chosen several years ago, and are good representations of meteorological conditions over the land surface.
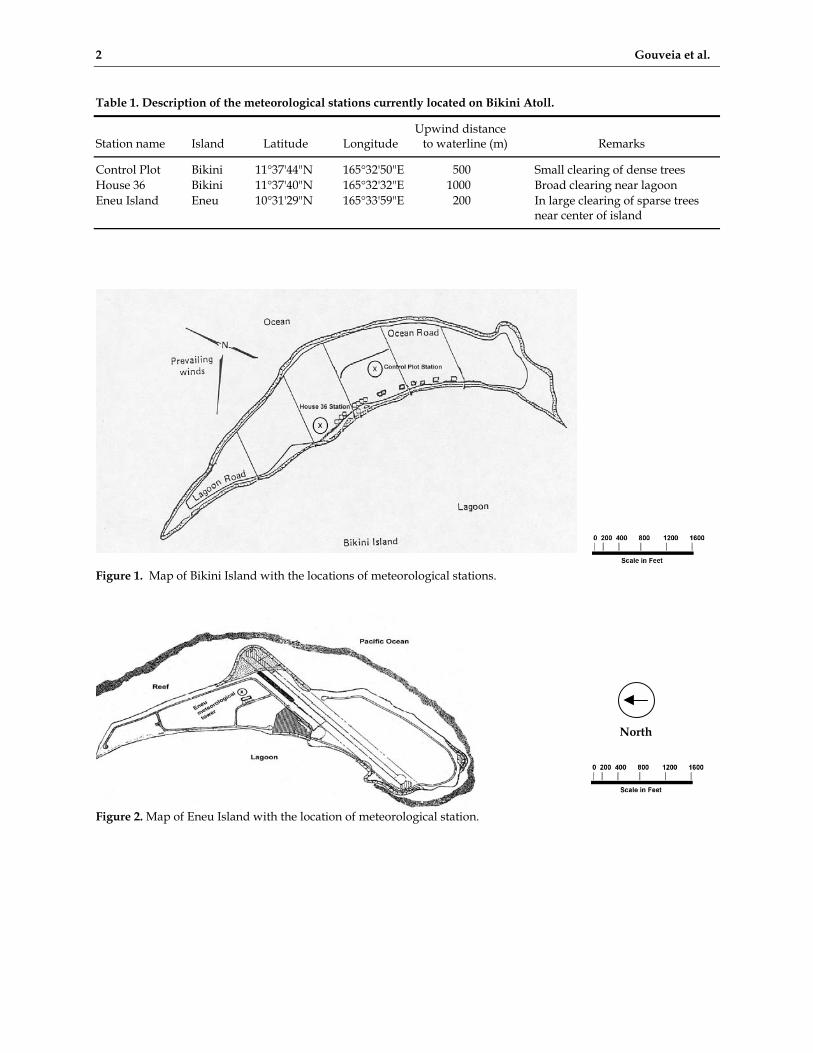
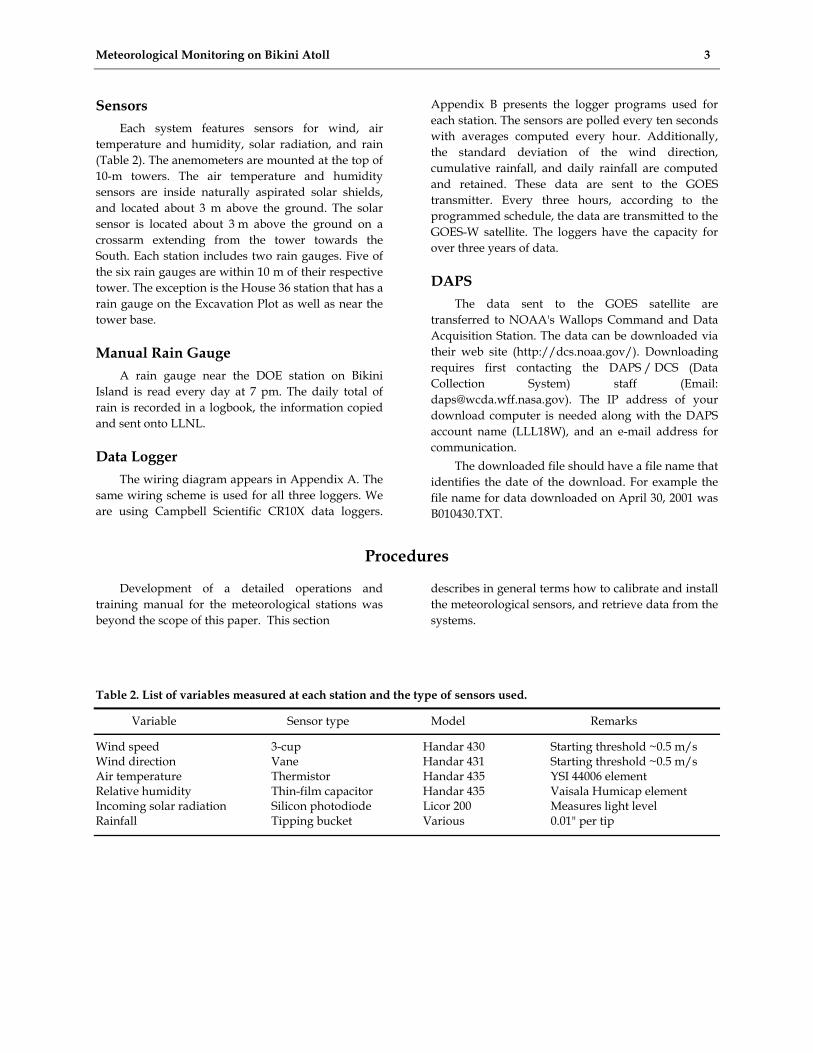
As typical for a Pacific Ocean atoll, the topography around the meteorological stations is very level. The primary obstruction to the ambient airflow would come from the mature coconut trees (7-10 meters) and underbrush. The prevailing trade winds come from the ENE (about 70°), and this is considered the upwind direction in this paper. Figure 1 is a map of Bikini Island showing the locations of the Control Plot and House 36 stations. The Eneu station is shown in Figure 2, which is a map of Eneu Island.
The immediate surface near the Control Plot
station is covered with short grasses. The closest trees are 8 m from the tower towards the North and West, and about 50 m to the East.
Although the House 36 station is near the lagoon, it is about 150 m in the downwind direction from the tree line. The area around House 36 features sandy soil surfaces and very little vegetation.
The Eneu Island station is about 15 m upwind of a one-story building. The trees are about 30 m upwind of the Eneu station. These trees are not very close together, and the grove has very little underbrush to restrict airflow.
2 Gouveia et al.
Table 1. Description of the meteorological stations currently located on Bikini Atoll. Upwind distance Station name Island Latitude Longitude to waterline (m) Remarks Control Plot Bikini 11°37'44"N 165°32'50"E 500 Small clearing of dense trees House 36 Bikini 11°37'40"N 165°32'32"E 1000 Broad clearing near lagoon Eneu Island Eneu 10°31'29"N 165°33'59"E 200 In large clearing of sparse trees near center of island
Figure 1. Map of Bikini Island with the locations of meteorological stations.
Figure 2. Map of Eneu Island with the location of meteorological station.
North
Meteorological Monitoring on Bikini Atoll 3
Sensors Each system features sensors for wind, air
temperature and humidity, solar radiation, and rain (Table 2). The anemometers are mounted at the top of 10-m towers. The air temperature and humidity sensors are inside naturally aspirated solar shields, and located about 3 m above the ground. The solar sensor is located about 3 m above the ground on a crossarm extending from the tower towards the South. Each station includes two rain gauges. Five of the six rain gauges are within 10 m of their respective tower. The exception is the House 36 station that has a rain gauge on the Excavation Plot as well as near the tower base.
Manual Rain Gauge A rain gauge near the DOE station on Bikini
Island is read every day at 7 pm. The daily total of rain is recorded in a logbook, the information copied and sent onto LLNL.
Data Logger The wiring diagram appears in Appendix A. The
same wiring scheme is used for all three loggers. We are using Campbell Scientific CR10X data loggers.
Appendix B presents the logger programs used for each station. The sensors are polled every ten seconds with averages computed every hour. Additionally, the standard deviation of the wind direction, cumulative rainfall, and daily rainfall are computed and retained. These data are sent to the GOES transmitter. Every three hours, according to the programmed schedule, the data are transmitted to the GOES-W satellite. The loggers have the capacity for over three years of data.
DAPS The data sent to the GOES satellite are
transferred to NOAA's Wallops Command and Data Acquisition Station. The data can be downloaded via their web site (http://dcs.noaa.gov/). Downloading requires first contacting the DAPS / DCS (Data Collection System) staff (Email: [email protected]). The IP address of your download computer is needed along with the DAPS account name (LLL18W), and an e-mail address for communication.
The downloaded file should have a file name that identifies the date of the download. For example the file name for data downloaded on April 30, 2001 was B010430.TXT.
Procedures
Development of a detailed operations and training manual for the meteorological stations was beyond the scope of this paper. This section
describes in general terms how to calibrate and install the meteorological sensors, and retrieve data from the systems.
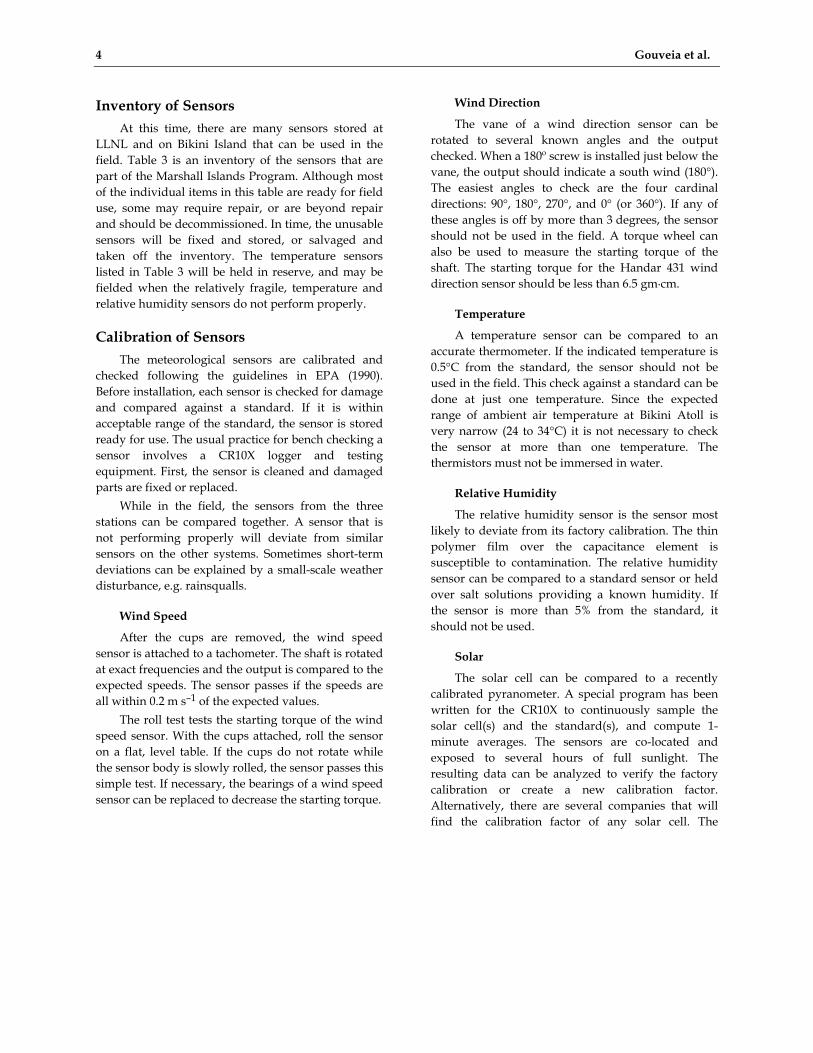
Table 2. List of variables measured at each station and the type of sensors used. Variable Sensor type Model Remarks Wind speed 3-cup Handar 430 Starting threshold ~0.5 m/s Wind direction Vane Handar 431 Starting threshold ~0.5 m/s Air temperature Thermistor Handar 435 YSI 44006 element Relative humidity Thin-film capacitor Handar 435 Vaisala Humicap element Incoming solar radiation Silicon photodiode Licor 200 Measures light level Rainfall Tipping bucket Various 0.01" per tip
4 Gouveia et al.
Inventory of Sensors At this time, there are many sensors stored at
LLNL and on Bikini Island that can be used in the field. Table 3 is an inventory of the sensors that are part of the Marshall Islands Program. Although most of the individual items in this table are ready for field use, some may require repair, or are beyond repair and should be decommissioned. In time, the unusable sensors will be fixed and stored, or salvaged and taken off the inventory. The temperature sensors listed in Table 3 will be held in reserve, and may be fielded when the relatively fragile, temperature and relative humidity sensors do not perform properly.
Calibration of Sensors The meteorological sensors are calibrated and
checked following the guidelines in EPA (1990). Before installation, each sensor is checked for damage and compared against a standard. If it is within acceptable range of the standard, the sensor is stored ready for use. The usual practice for bench checking a sensor involves a CR10X logger and testing equipment. First, the sensor is cleaned and damaged parts are fixed or replaced.
While in the field, the sensors from the three stations can be compared together. A sensor that is not performing properly will deviate from similar sensors on the other systems. Sometimes short-term deviations can be explained by a small-scale weather disturbance, e.g. rainsqualls.
Wind Speed
After the cups are removed, the wind speed sensor is attached to a tachometer. The shaft is rotated at exact frequencies and the output is compared to the expected speeds. The sensor passes if the speeds are all within 0.2 m s–1 of the expected values.
The roll test tests the starting torque of the wind speed sensor. With the cups attached, roll the sensor on a flat, level table. If the cups do not rotate while the sensor body is slowly rolled, the sensor passes this simple test. If necessary, the bearings of a wind speed sensor can be replaced to decrease the starting torque.
Wind Direction
The vane of a wind direction sensor can be rotated to several known angles and the output checked. When a 180º screw is installed just below the vane, the output should indicate a south wind (180°). The easiest angles to check are the four cardinal directions: 90°, 180°, 270°, and 0° (or 360°). If any of these angles is off by more than 3 degrees, the sensor should not be used in the field. A torque wheel can also be used to measure the starting torque of the shaft. The starting torque for the Handar 431 wind direction sensor should be less than 6.5 gm·cm.
Temperature
A temperature sensor can be compared to an accurate thermometer. If the indicated temperature is 0.5°C from the standard, the sensor should not be used in the field. This check against a standard can be done at just one temperature. Since the expected range of ambient air temperature at Bikini Atoll is very narrow (24 to 34°C) it is not necessary to check the sensor at more than one temperature. The thermistors must not be immersed in water.
Relative Humidity
The relative humidity sensor is the sensor most likely to deviate from its factory calibration. The thin polymer film over the capacitance element is susceptible to contamination. The relative humidity sensor can be compared to a standard sensor or held over salt solutions providing a known humidity. If the sensor is more than 5% from the standard, it should not be used.
Solar
The solar cell can be compared to a recently calibrated pyranometer. A special program has been written for the CR10X to continuously sample the solar cell(s) and the standard(s), and compute 1-minute averages. The sensors are co-located and exposed to several hours of full sunlight. The resulting data can be analyzed to verify the factory calibration or create a new calibration factor. Alternatively, there are several companies that will find the calibration factor of any solar cell. The
Meteorological Monitoring on Bikini Atoll 5
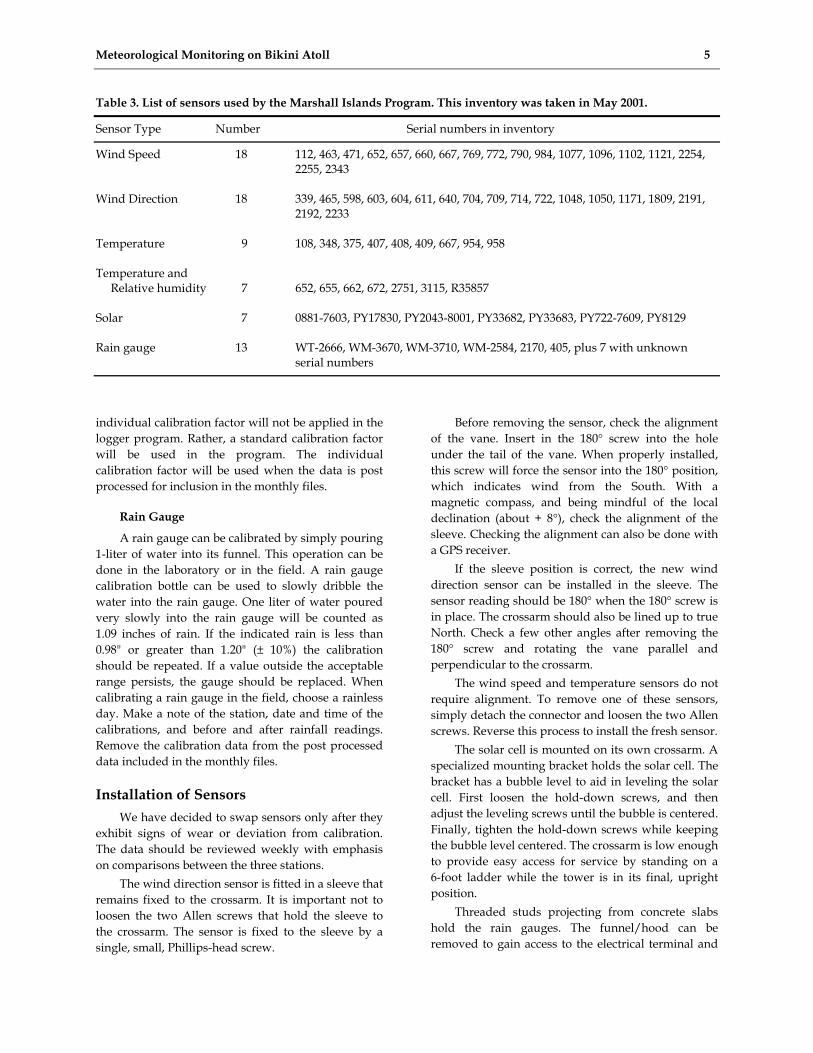
Table 3. List of sensors used by the Marshall Islands Program. This inventory was taken in May 2001. Sensor Type Number Serial numbers in inventory Wind Speed 18 112, 463, 471, 652, 657, 660, 667, 769, 772, 790, 984, 1077, 1096, 1102, 1121, 2254,
2192, 2233 Temperature 9 108, 348, 375, 407, 408, 409, 667, 954, 958 Temperature and Relative humidity 7 652, 655, 662, 672, 2751, 3115, R35857 Solar 7 0881-7603, PY17830, PY2043-8001, PY33682, PY33683, PY722-7609, PY8129 Rain gauge 13 WT-2666, WM-3670, WM-3710, WM-2584, 2170, 405, plus 7 with unknown
serial numbers
individual calibration factor will not be applied in the logger program. Rather, a standard calibration factor will be used in the program. The individual calibration factor will be used when the data is post processed for inclusion in the monthly files.
Rain Gauge
A rain gauge can be calibrated by simply pouring 1-liter of water into its funnel. This operation can be done in the laboratory or in the field. A rain gauge calibration bottle can be used to slowly dribble the water into the rain gauge. One liter of water poured very slowly into the rain gauge will be counted as 1.09 inches of rain. If the indicated rain is less than 0.98" or greater than 1.20" (± 10%) the calibration should be repeated. If a value outside the acceptable range persists, the gauge should be replaced. When calibrating a rain gauge in the field, choose a rainless day. Make a note of the station, date and time of the calibrations, and before and after rainfall readings. Remove the calibration data from the post processed data included in the monthly files.
Installation of Sensors We have decided to swap sensors only after they
exhibit signs of wear or deviation from calibration. The data should be reviewed weekly with emphasis on comparisons between the three stations.
The wind direction sensor is fitted in a sleeve that remains fixed to the crossarm. It is important not to loosen the two Allen screws that hold the sleeve to the crossarm. The sensor is fixed to the sleeve by a single, small, Phillips-head screw.
Before removing the sensor, check the alignment of the vane. Insert in the 180° screw into the hole under the tail of the vane. When properly installed, this screw will force the sensor into the 180° position, which indicates wind from the South. With a magnetic compass, and being mindful of the local declination (about + 8°), check the alignment of the sleeve. Checking the alignment can also be done with a GPS receiver.
If the sleeve position is correct, the new wind direction sensor can be installed in the sleeve. The sensor reading should be 180° when the 180° screw is in place. The crossarm should also be lined up to true North. Check a few other angles after removing the 180° screw and rotating the vane parallel and perpendicular to the crossarm.
The wind speed and temperature sensors do not require alignment. To remove one of these sensors, simply detach the connector and loosen the two Allen screws. Reverse this process to install the fresh sensor.
The solar cell is mounted on its own crossarm. A specialized mounting bracket holds the solar cell. The bracket has a bubble level to aid in leveling the solar cell. First loosen the hold-down screws, and then adjust the leveling screws until the bubble is centered. Finally, tighten the hold-down screws while keeping the bubble level centered. The crossarm is low enough to provide easy access for service by standing on a 6-foot ladder while the tower is in its final, upright position.
Threaded studs projecting from concrete slabs hold the rain gauges. The funnel/hood can be removed to gain access to the electrical terminal and
6 Gouveia et al.
leveling bubble. Most problems with the rain gauges can be traced to debris in the funnel or tipping buckets, and broken or disconnected terminal wires.
Data Recovery There are two basic ways to retrieve data from
the loggers: via-satellite and on-site. Collecting data via satellite is the routine method of data collection. It involves a desktop PC and an Internet connection to the NOAA Wallops Command and Data Acquisition Station. The on-site method requires a direct connection to the logger.
Via Satellite
Currently there are two methods for downloading data from NOAA: telnet and web-based. Both methods require the user name (LLL18W) and a password. The DCS web site, http://dcs.noaa.gov/, has a link for telnet access.
Web-based downloads can be made through the URL http://dcs.noaa.gov/default1.asp.
Data downloaded via satellite includes a DAPS message (Table 4) and the DCP data. A typical data string that represents three hours of data from one logger is 293 bytes long, not including the 37-byte DAPS message.
The downloaded data follows the DAPS download message. The data is coded to reduce size. Each number is coded into three characters. Appendix C includes the FORTRAN source code that converts three characters into the numeric equivalent. For
example, the string @_Q is converted to the value 2001.
On Site
All the data that are in the memory of the logger can be downloaded to a storage module or laptop computer. The 2-Megabyte loggers can hold over three years of data. For this download method, use a keyboard (model CR10KD), and storage module (SM4M) connected with the same blue cable (SC12). Connect the combination to the CS I/O port on the logger. The data on the module is downloaded to a computer running the Windows-based program PC208W. The data file can then be copied to floppy, and sent to LLNL for analysis and archiving.
Monthly Files Every month, data from all three stations are
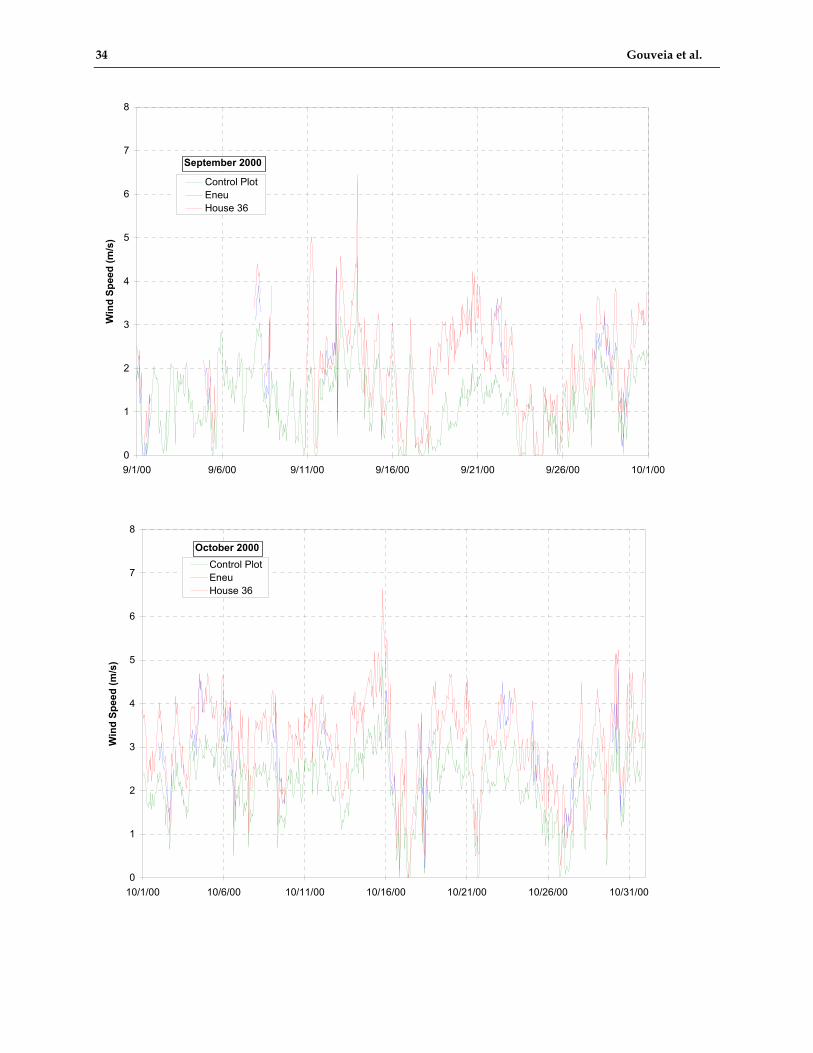
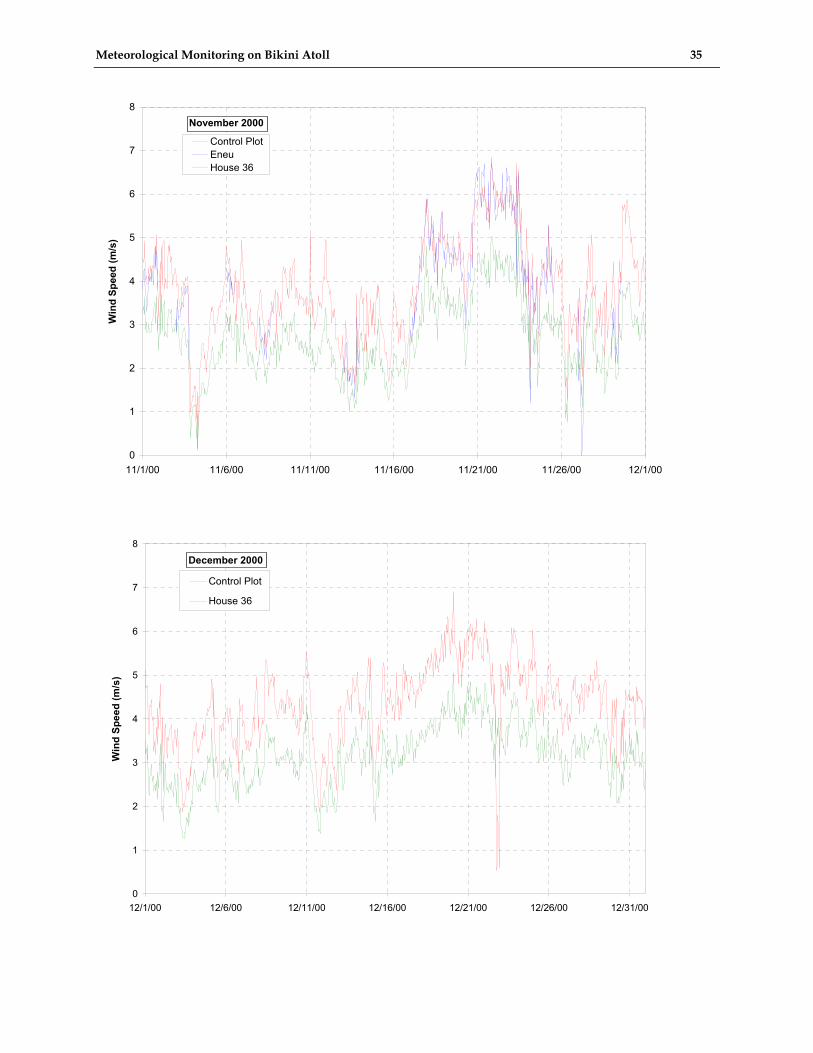
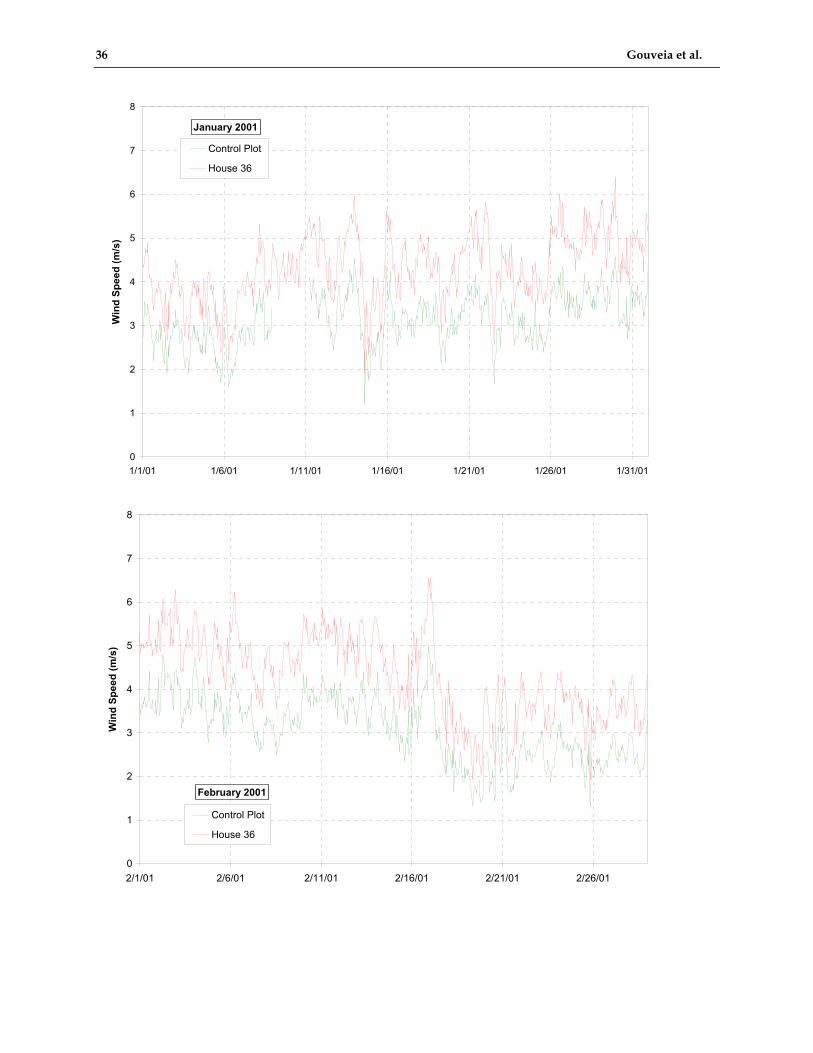
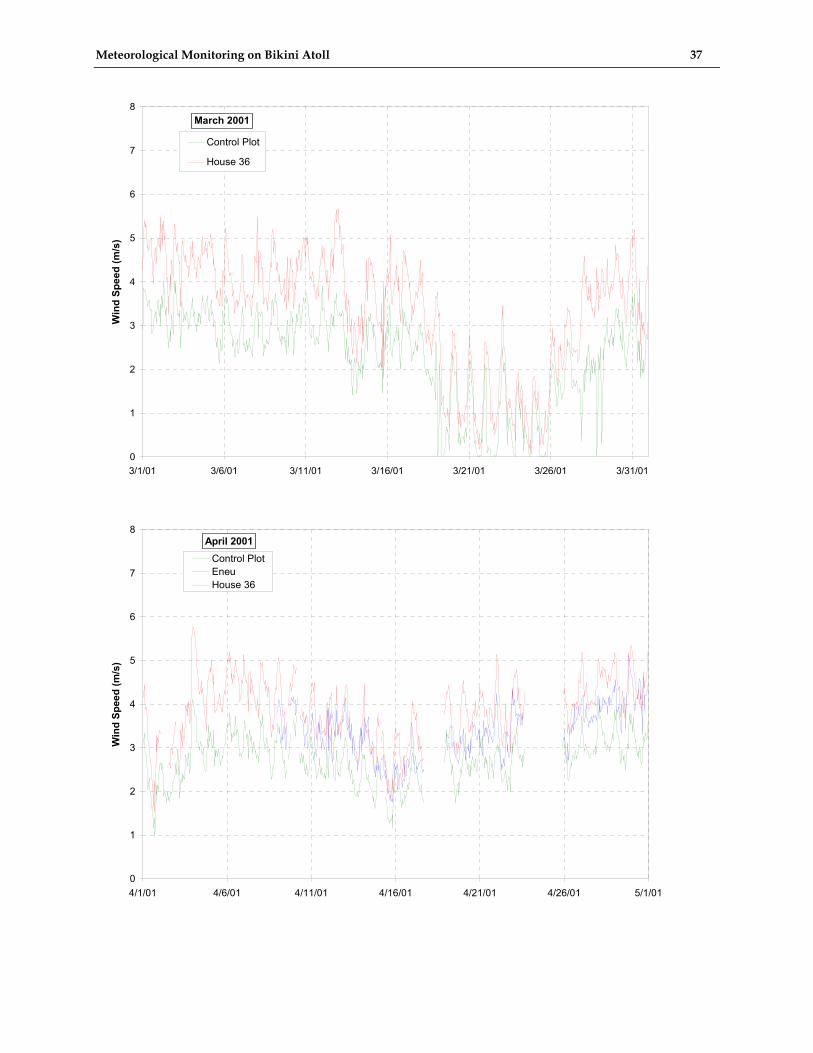
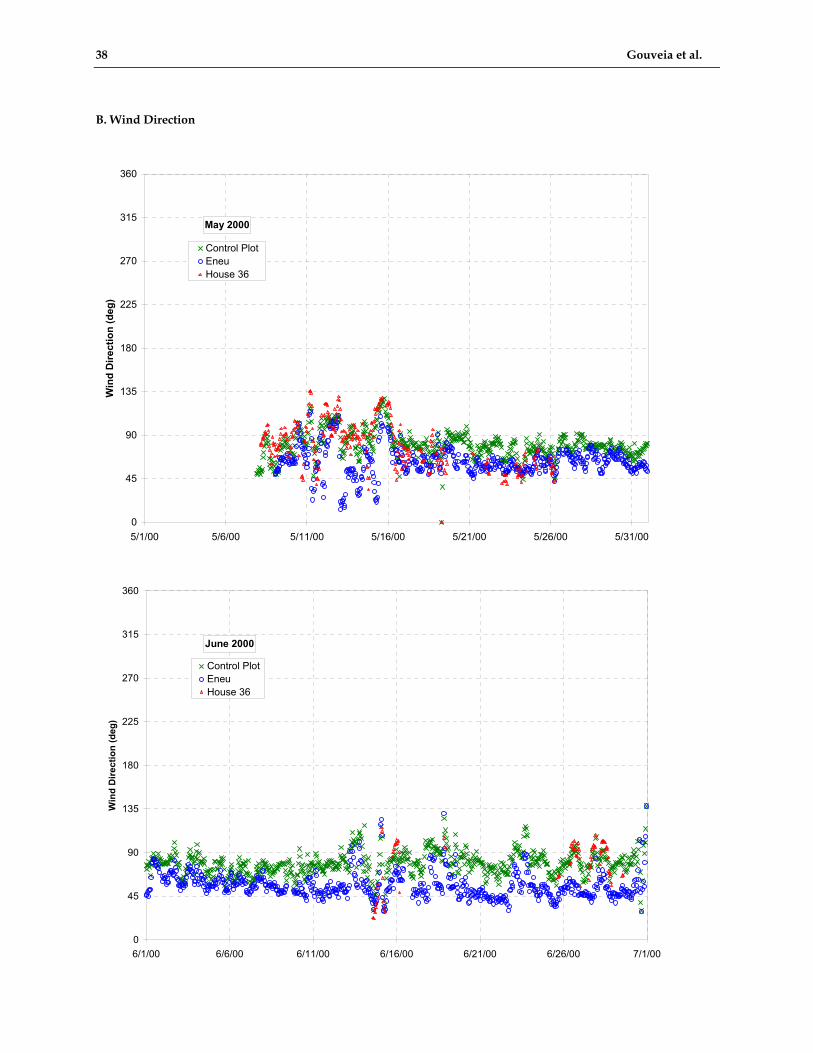
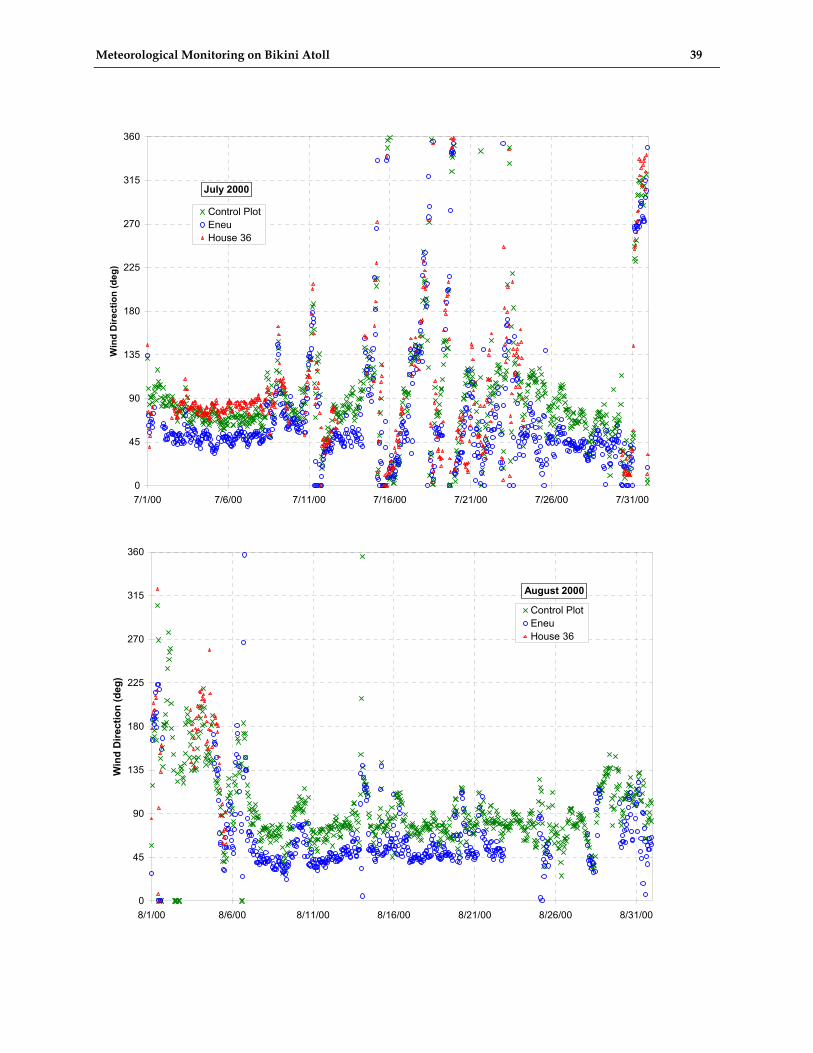
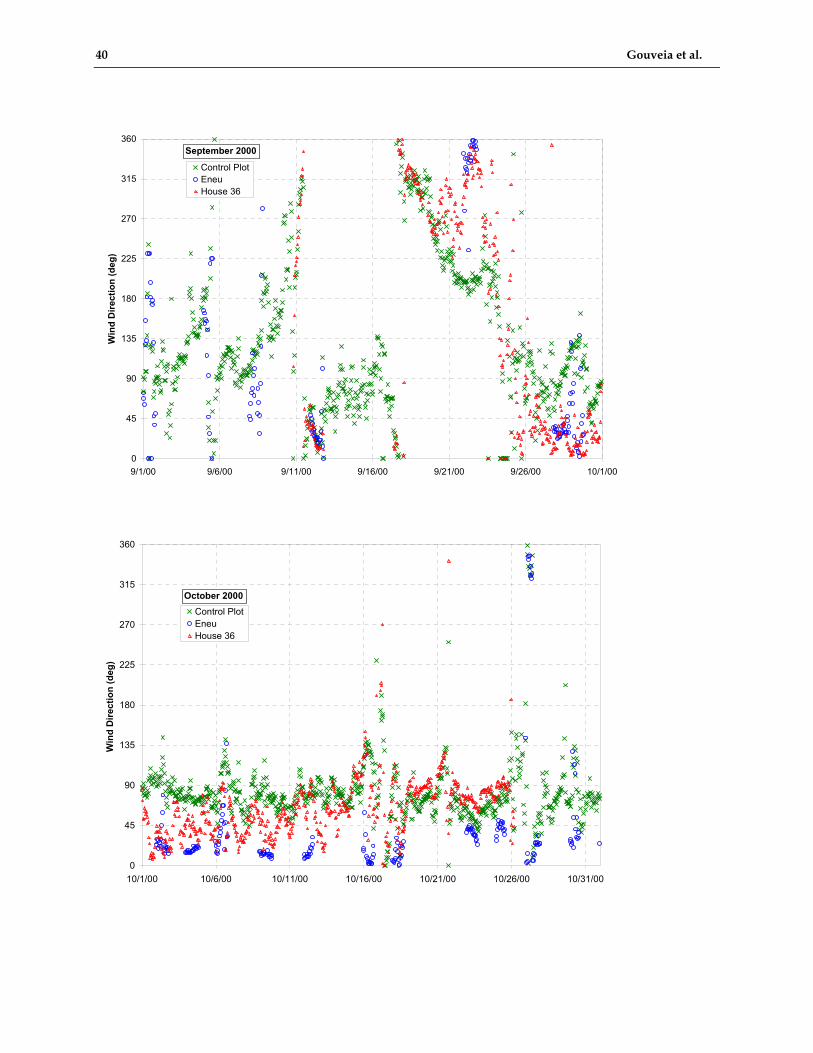
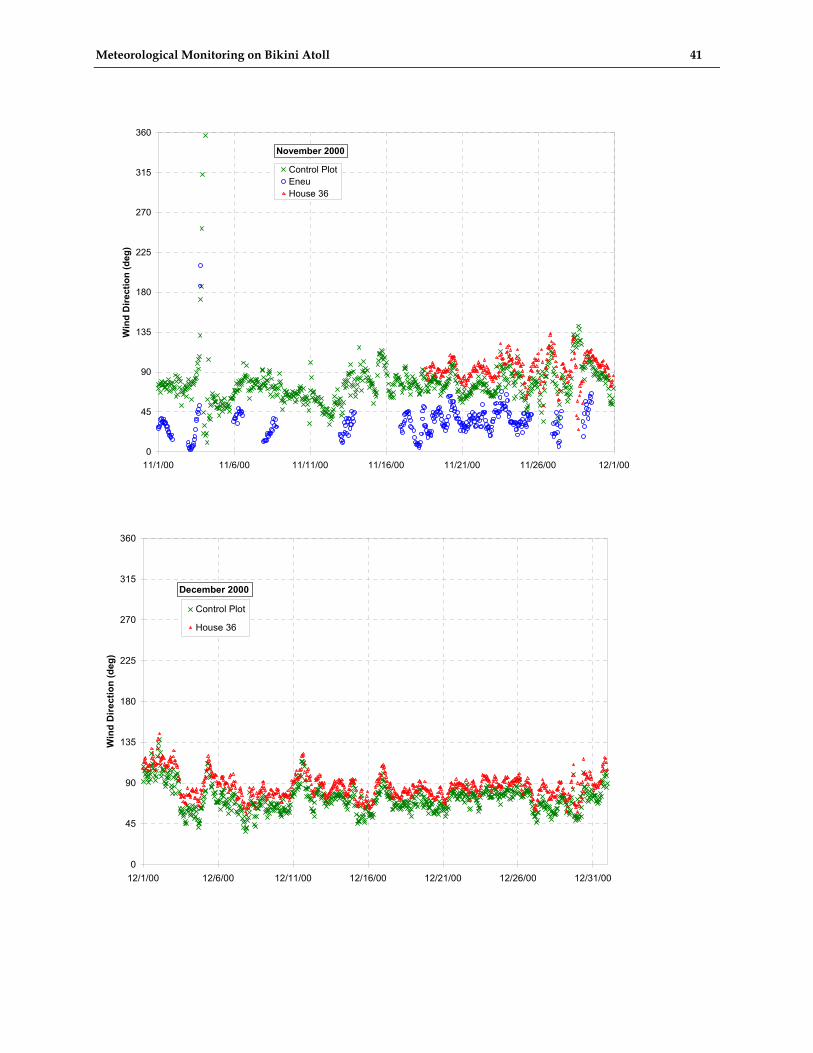
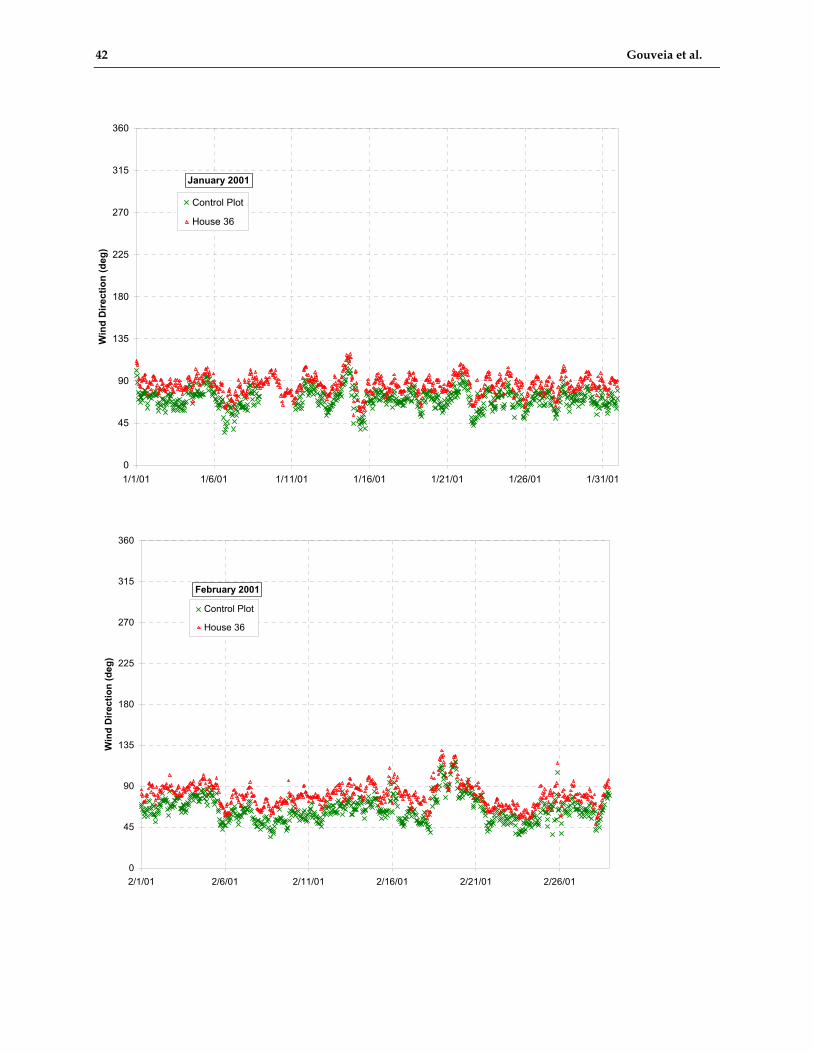
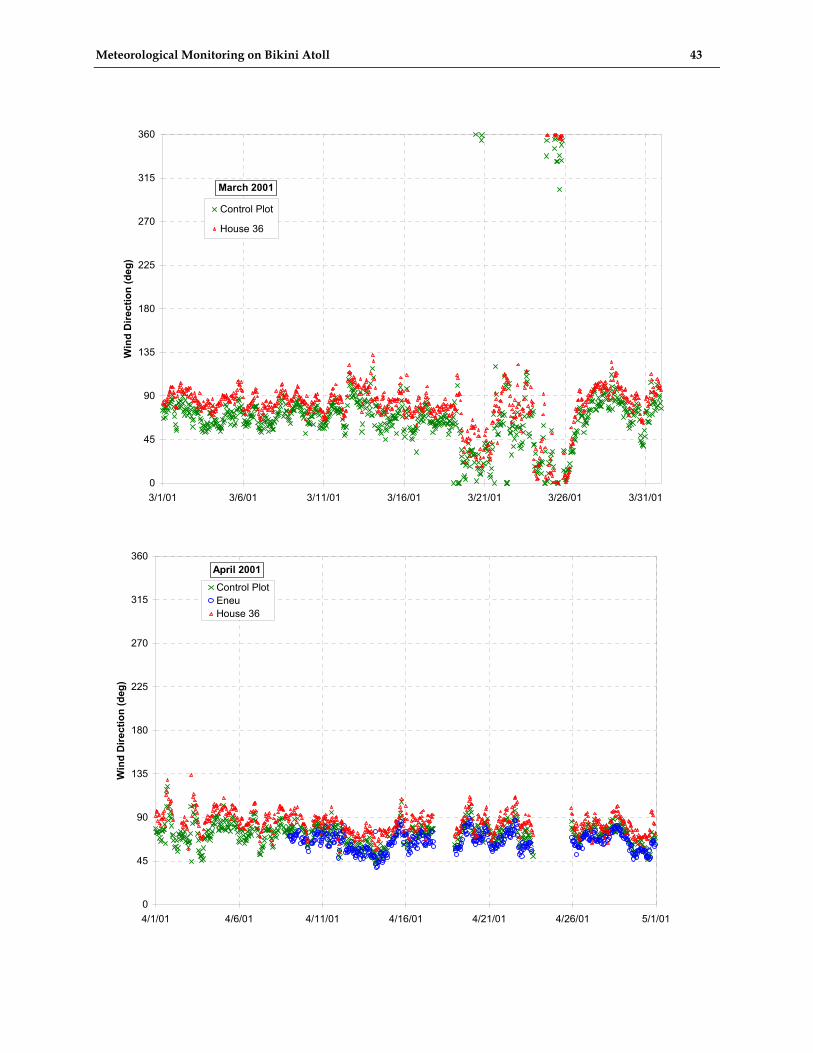
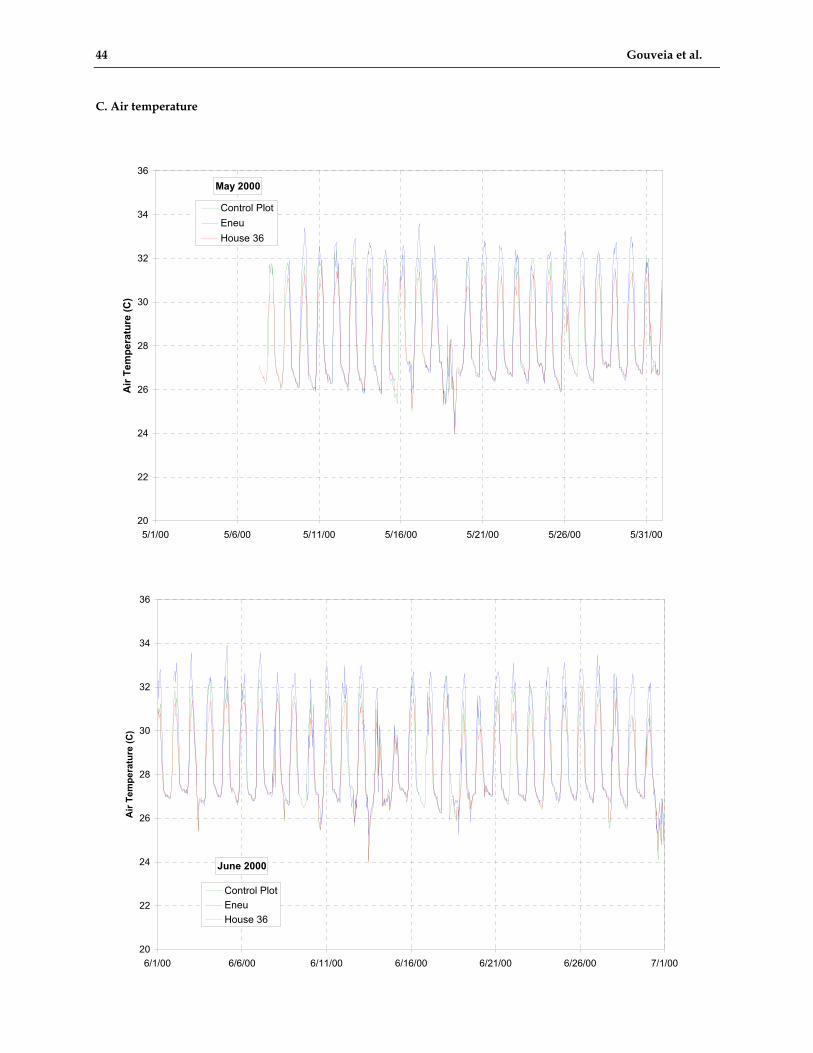
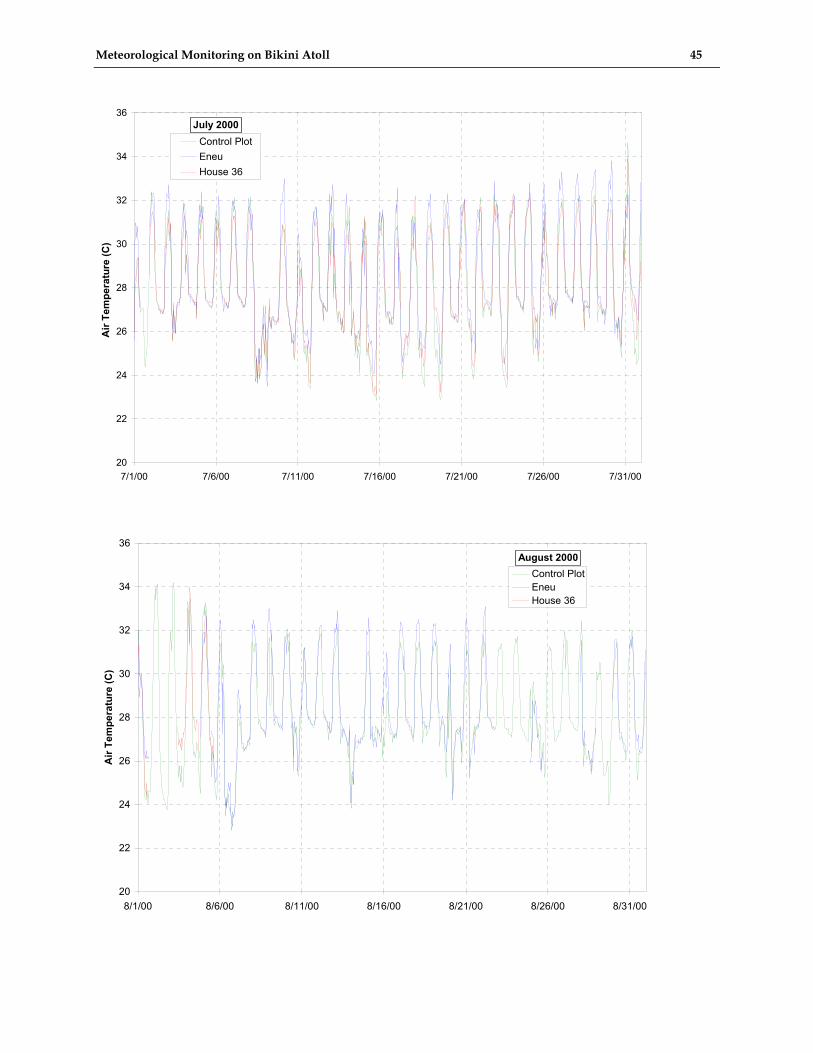
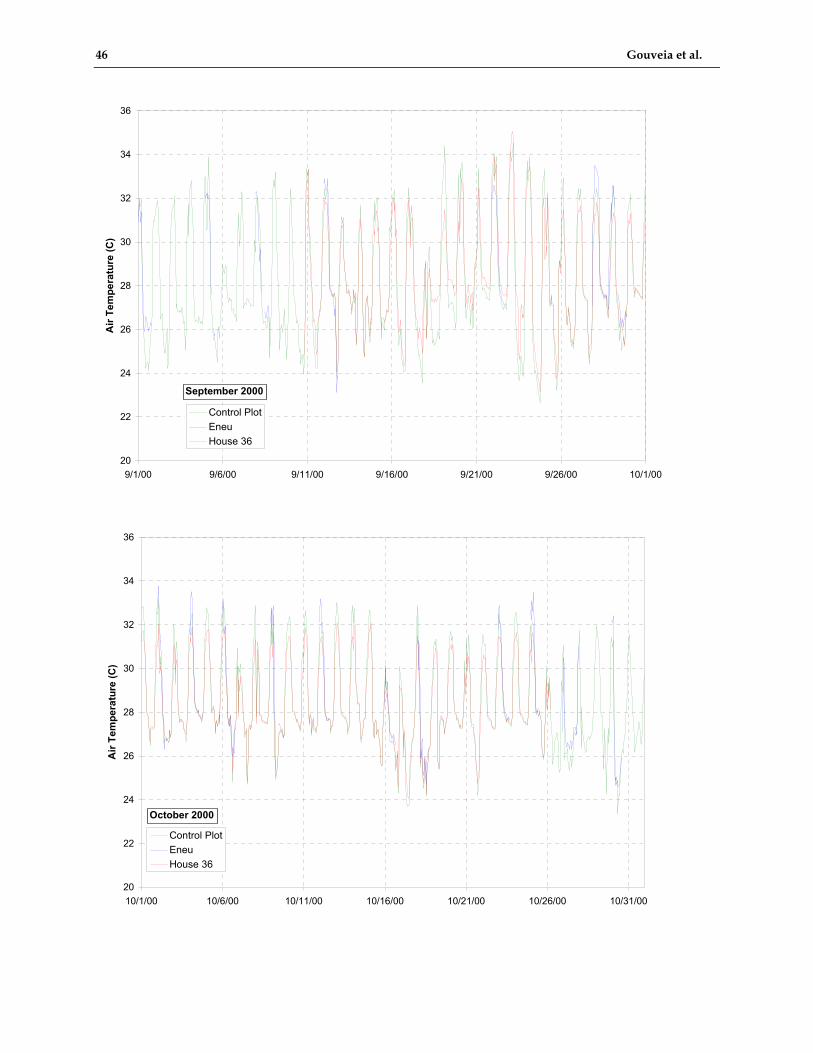
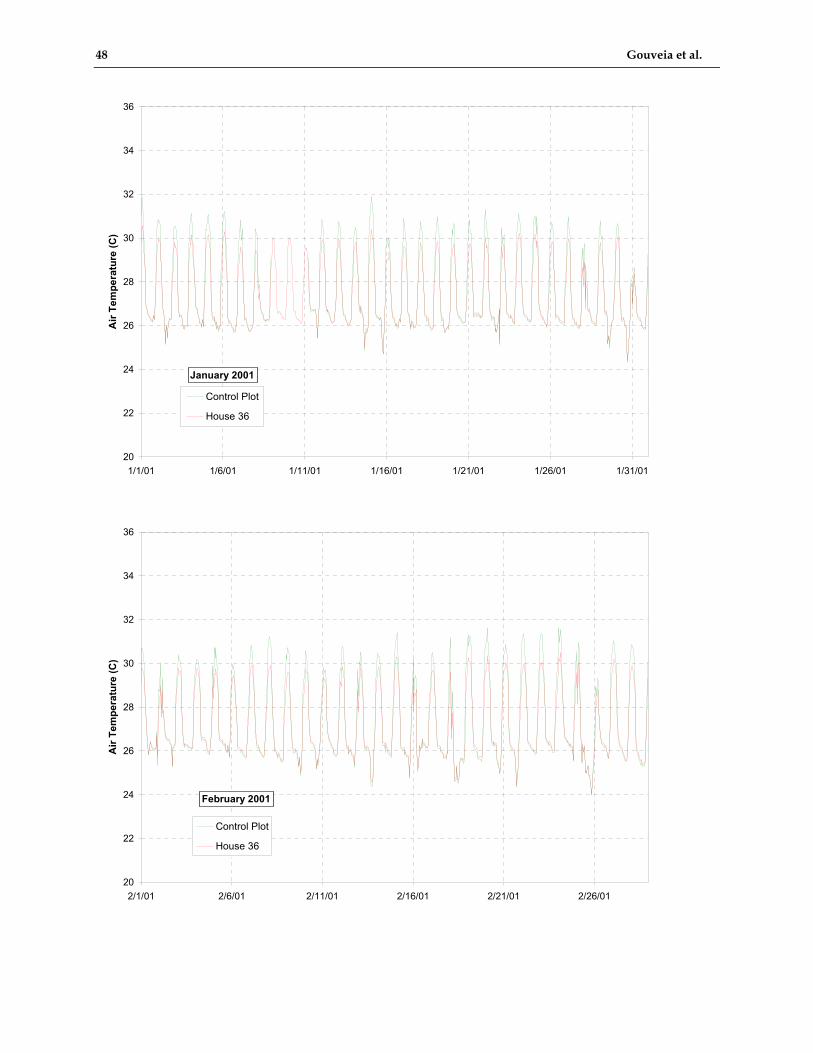
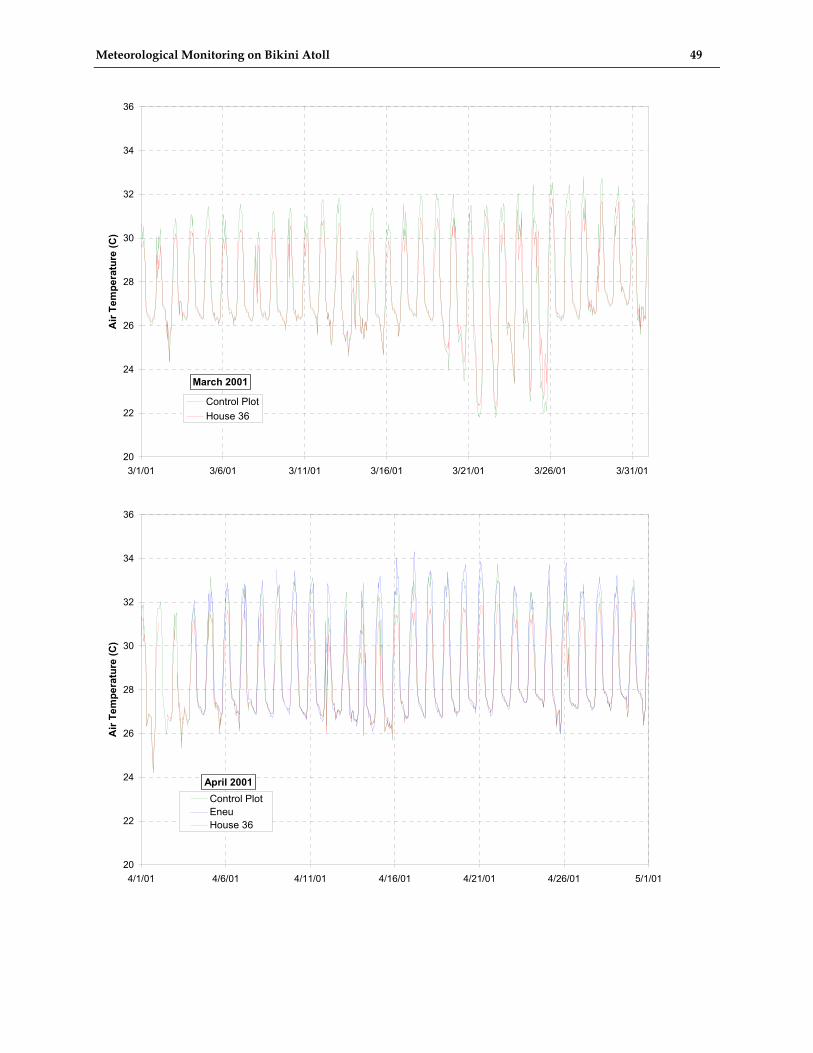
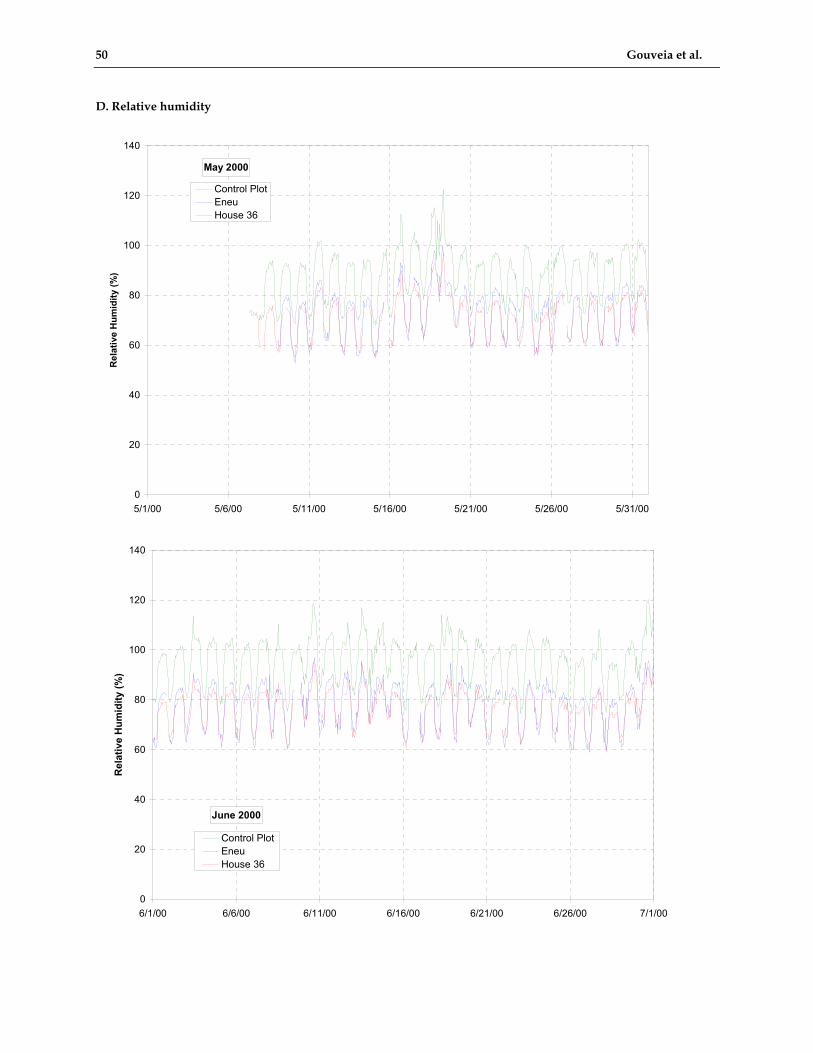
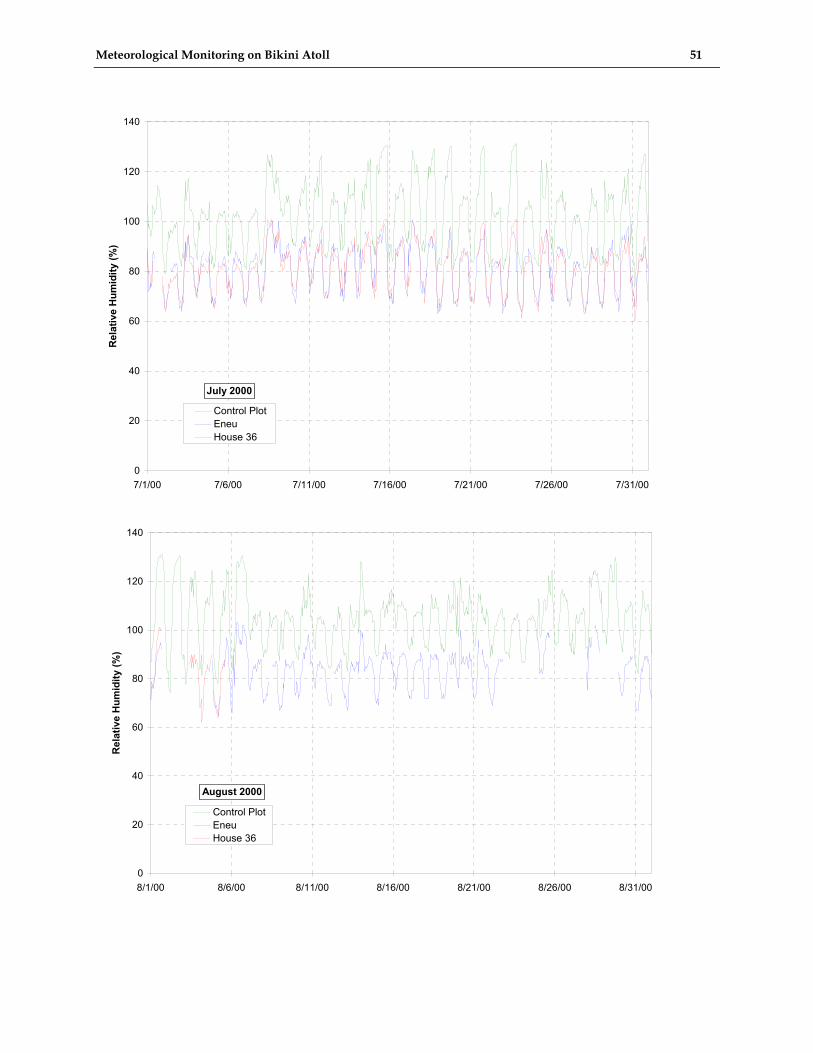
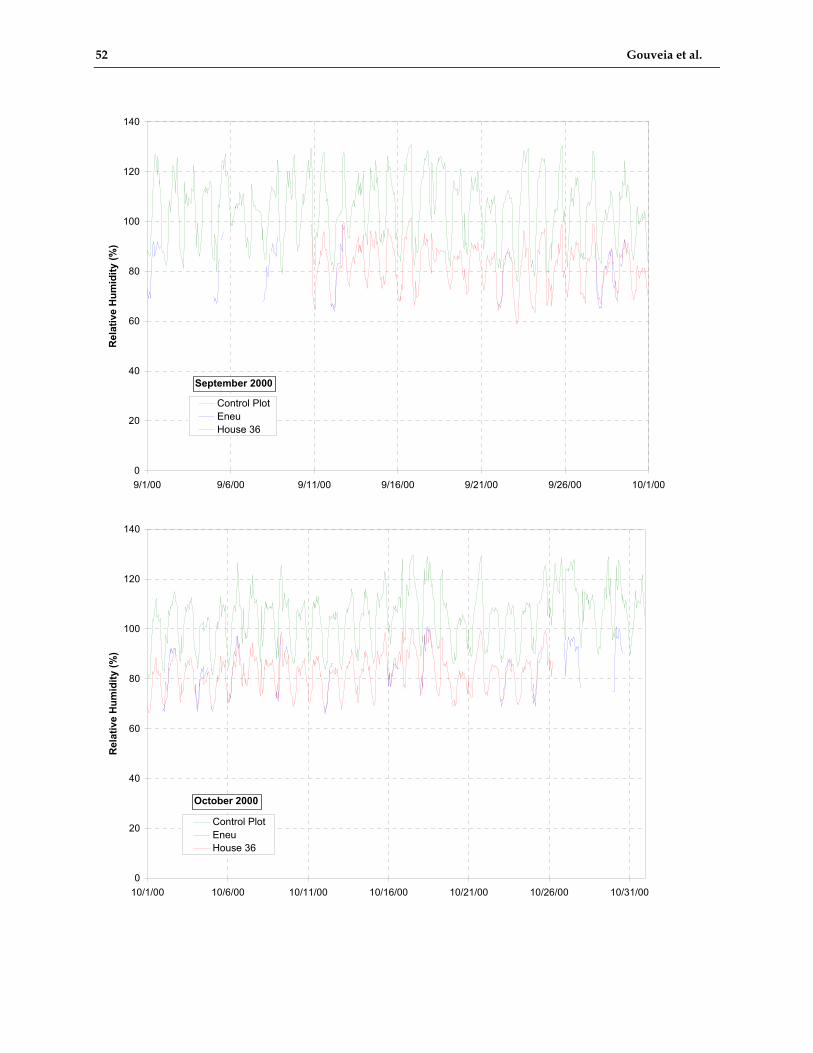
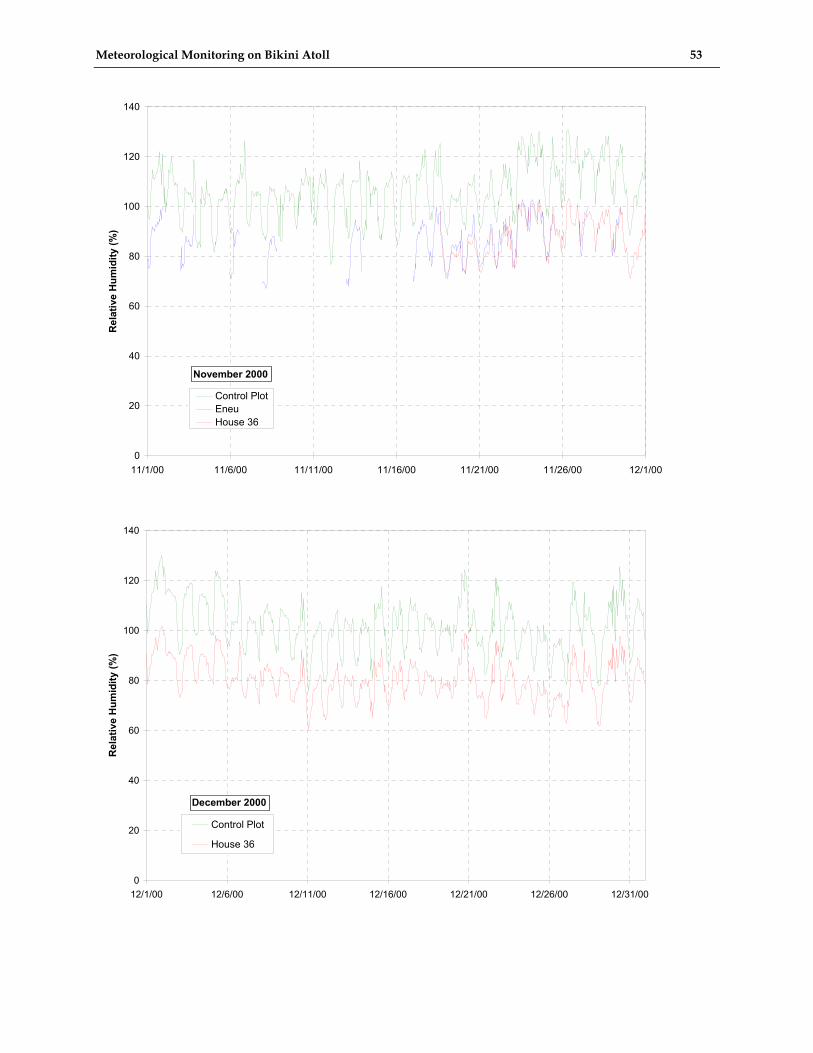
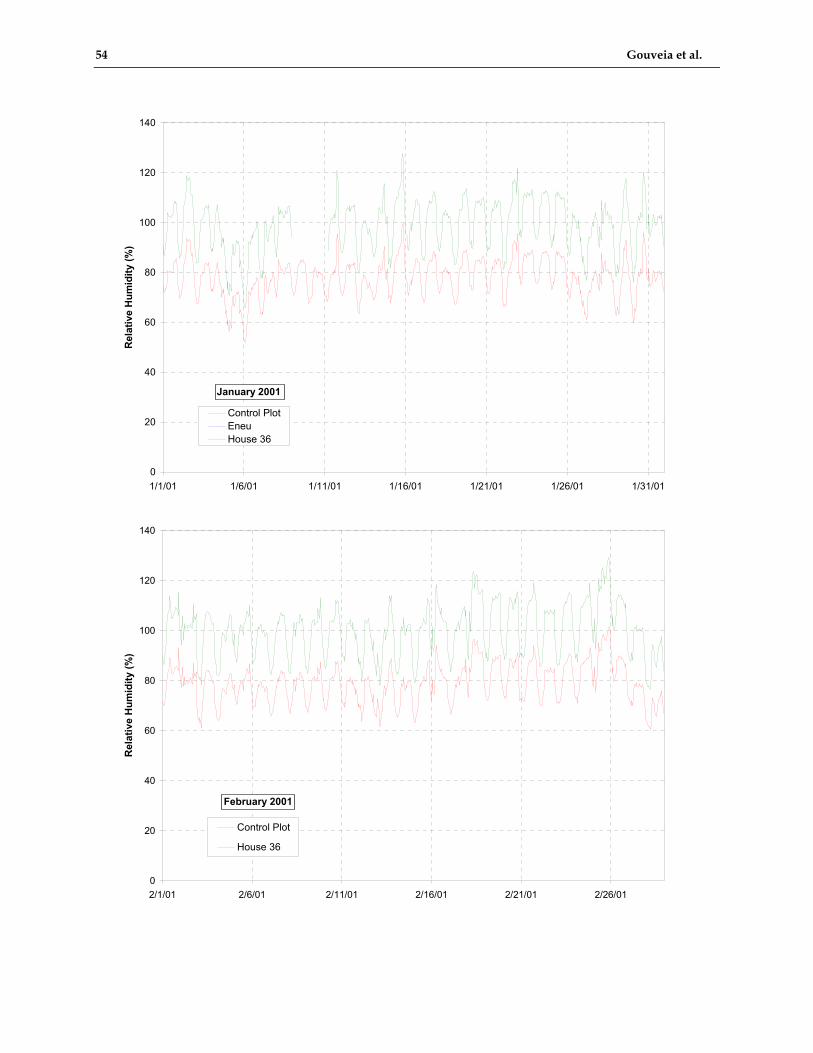
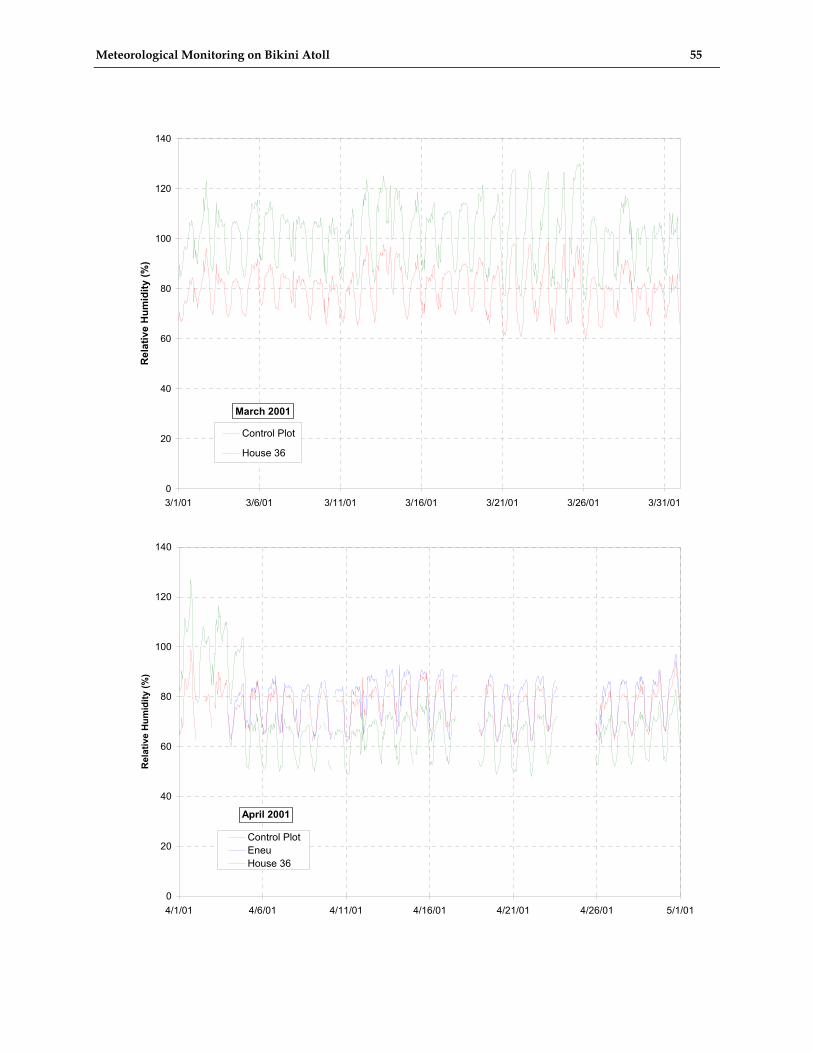
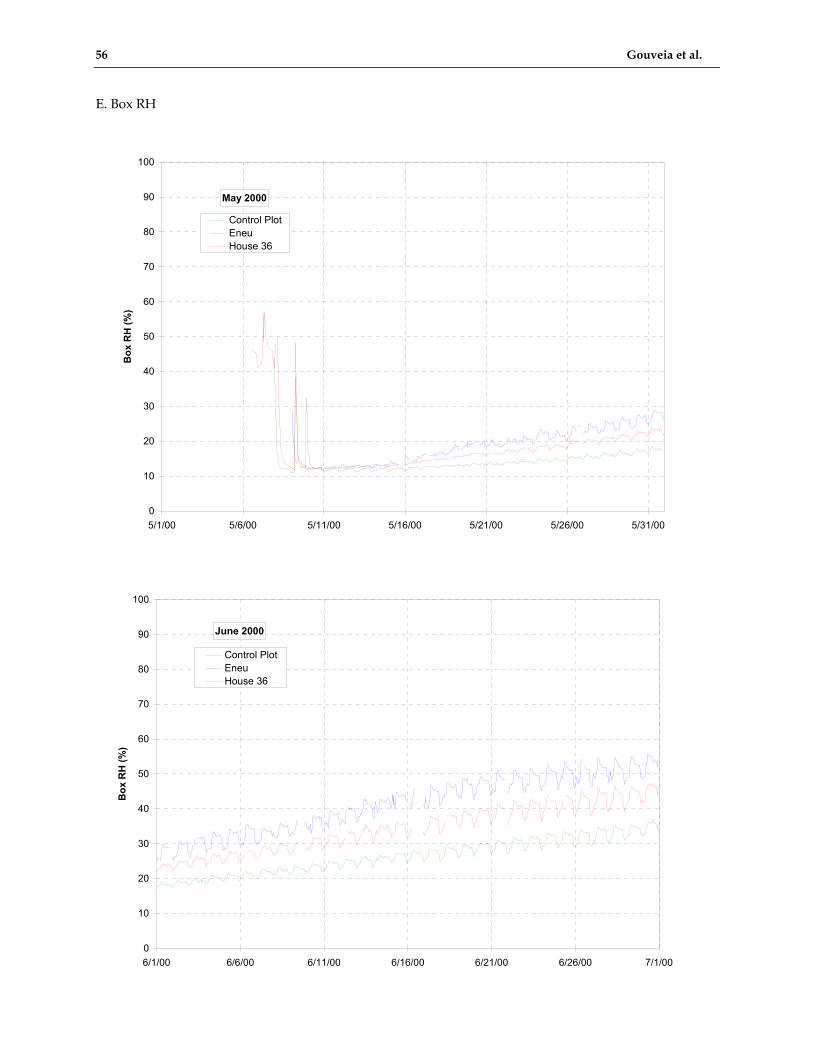
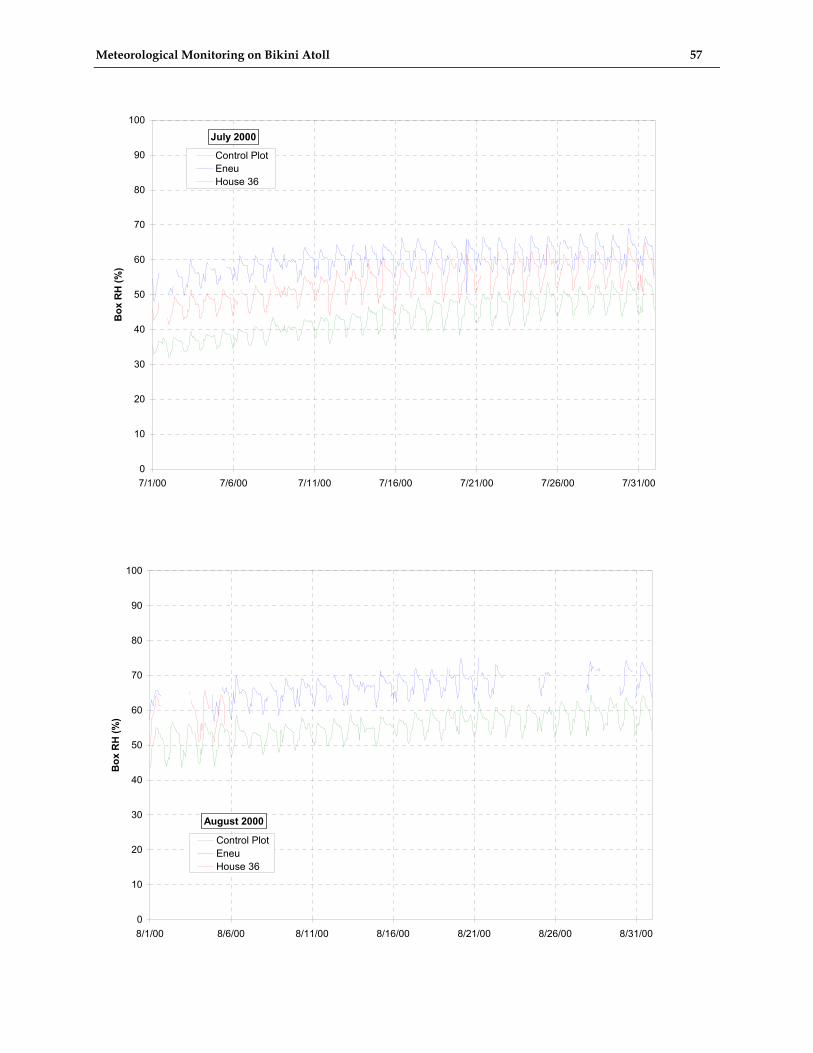
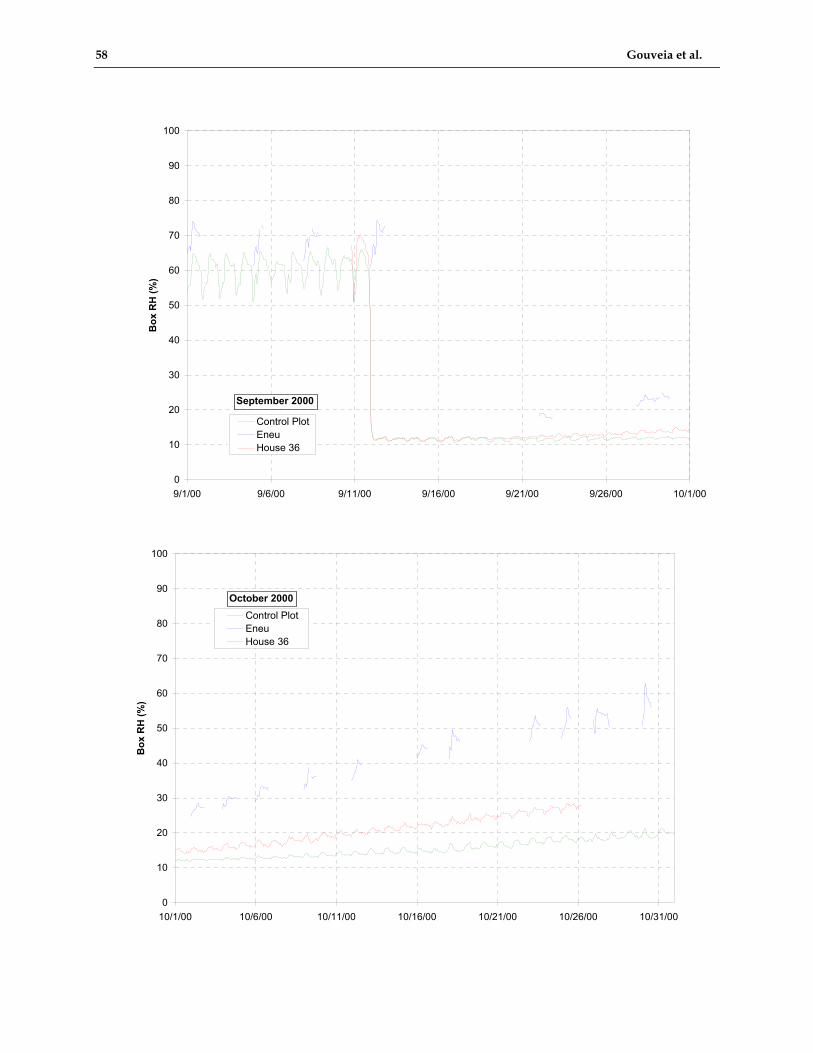
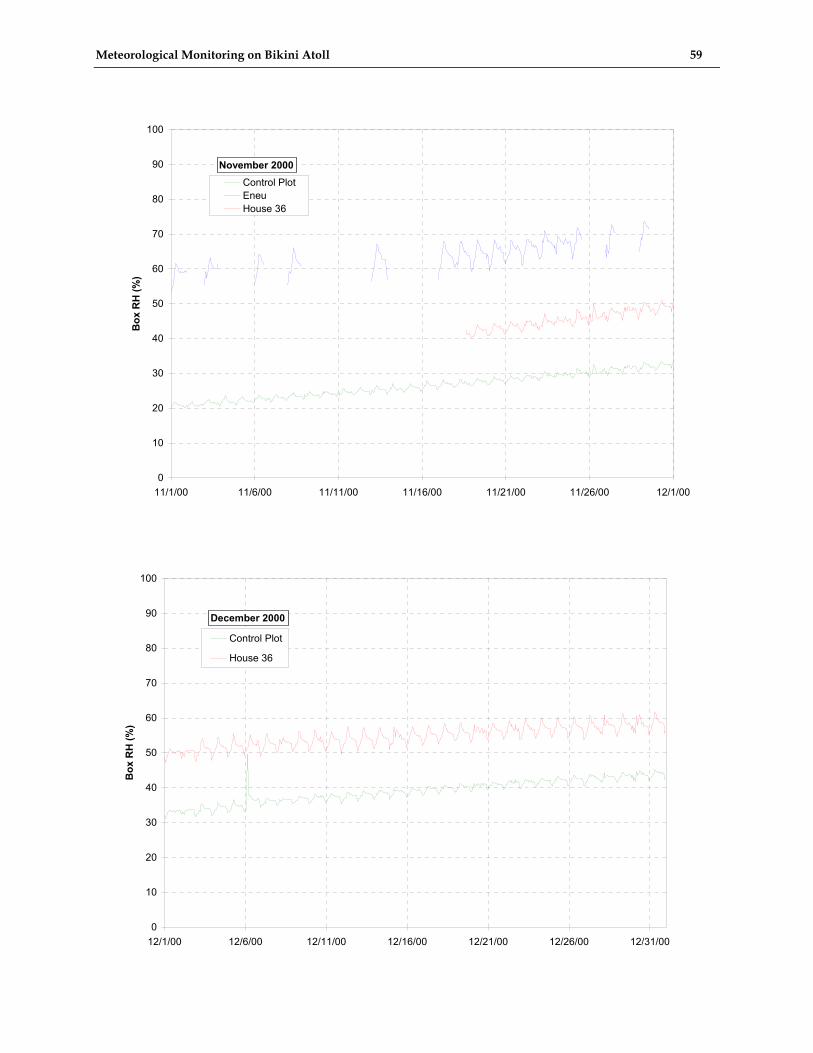
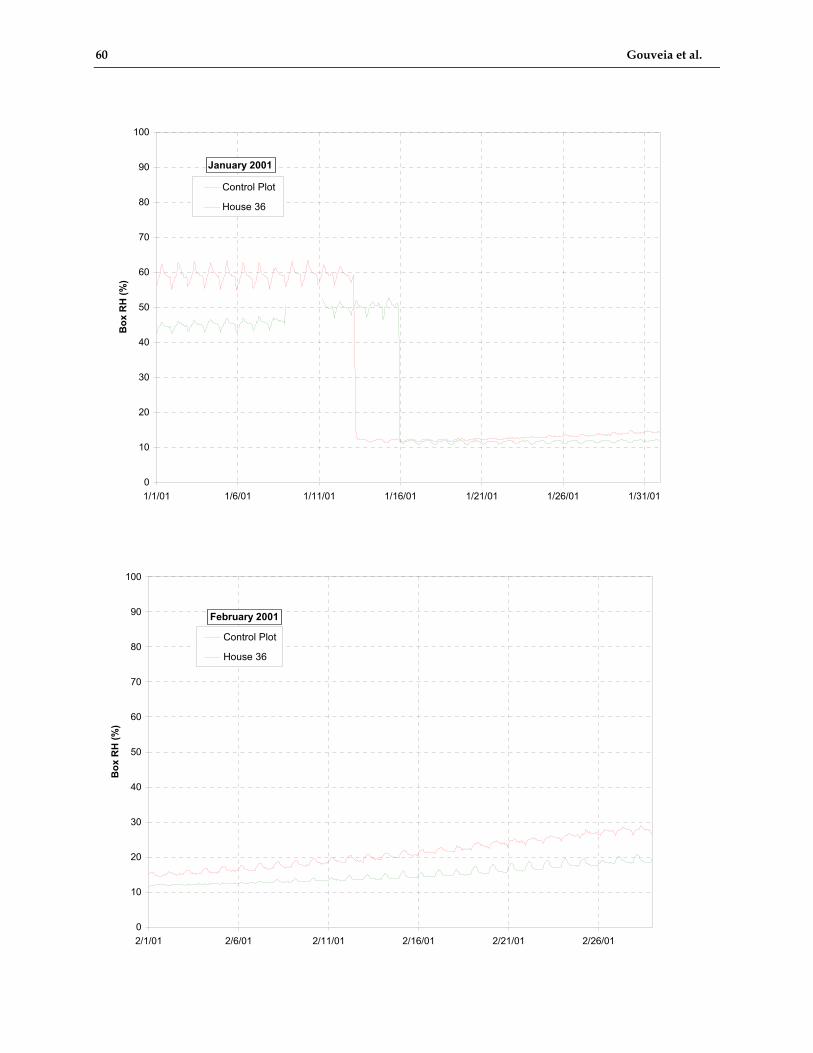
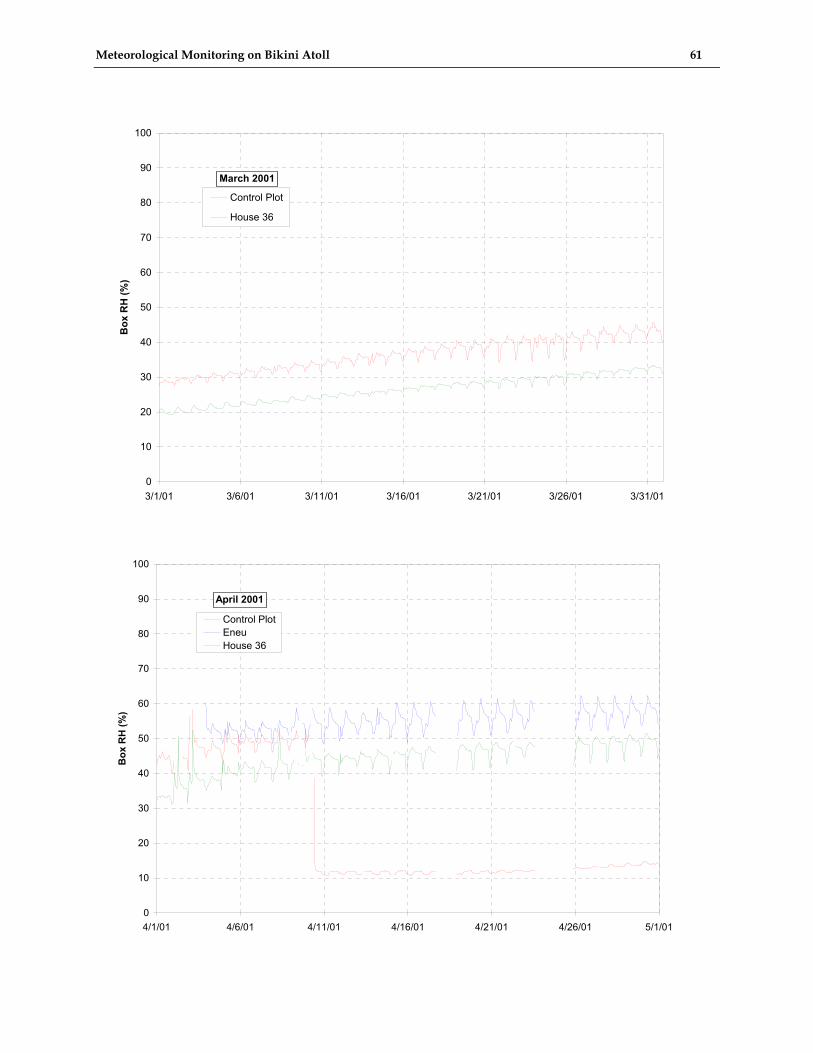
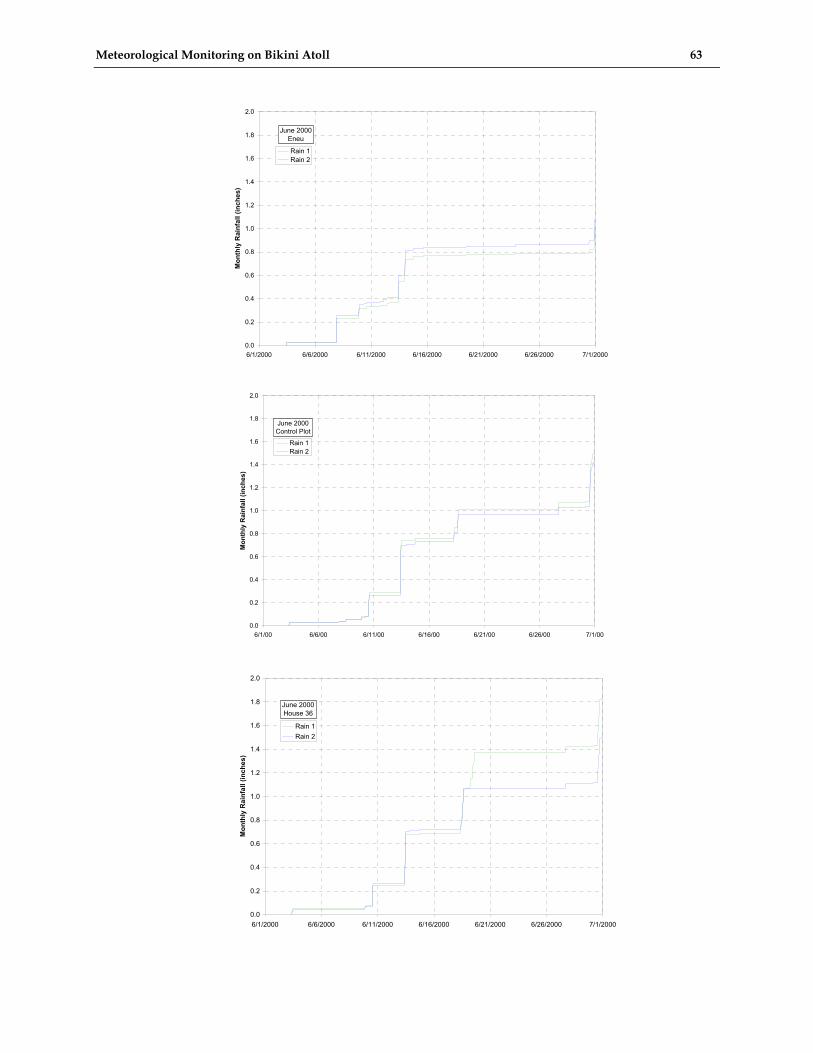
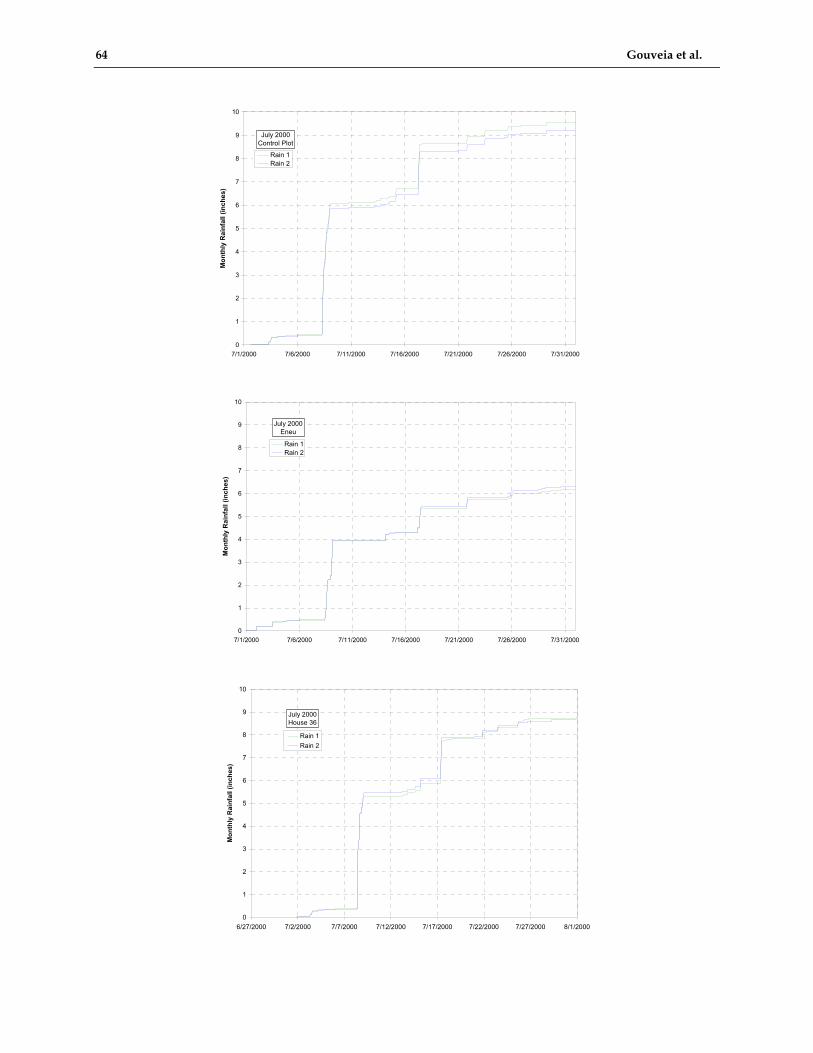
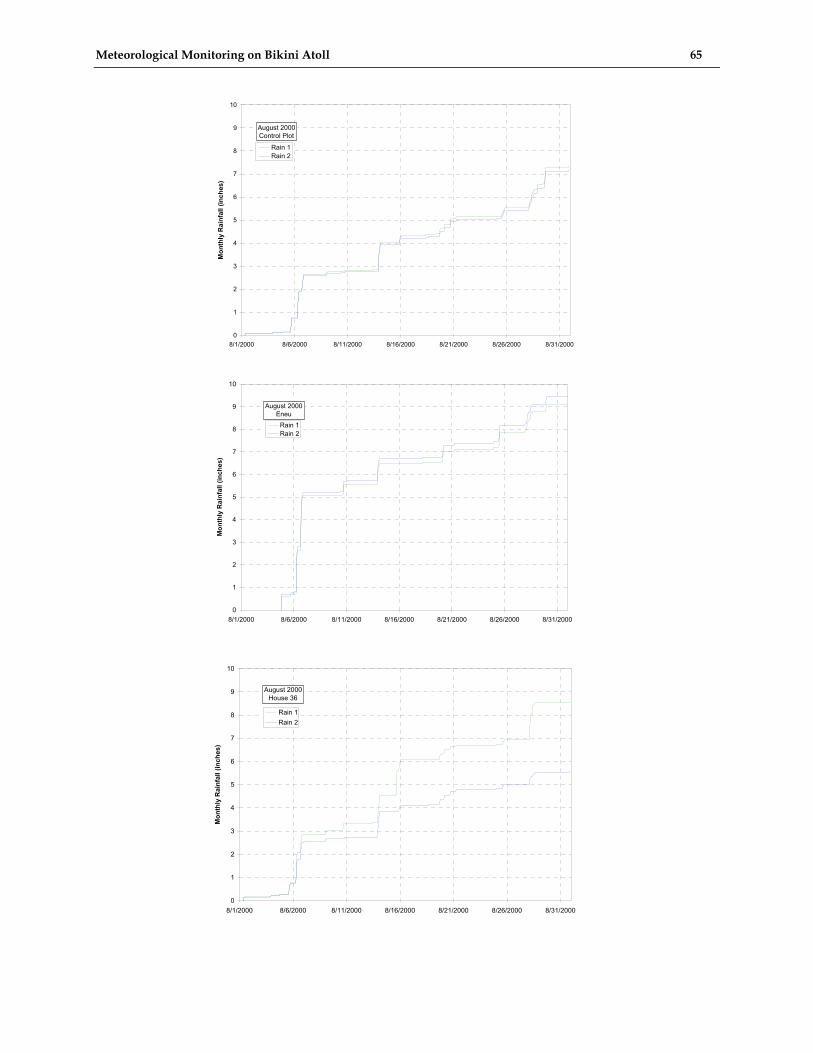
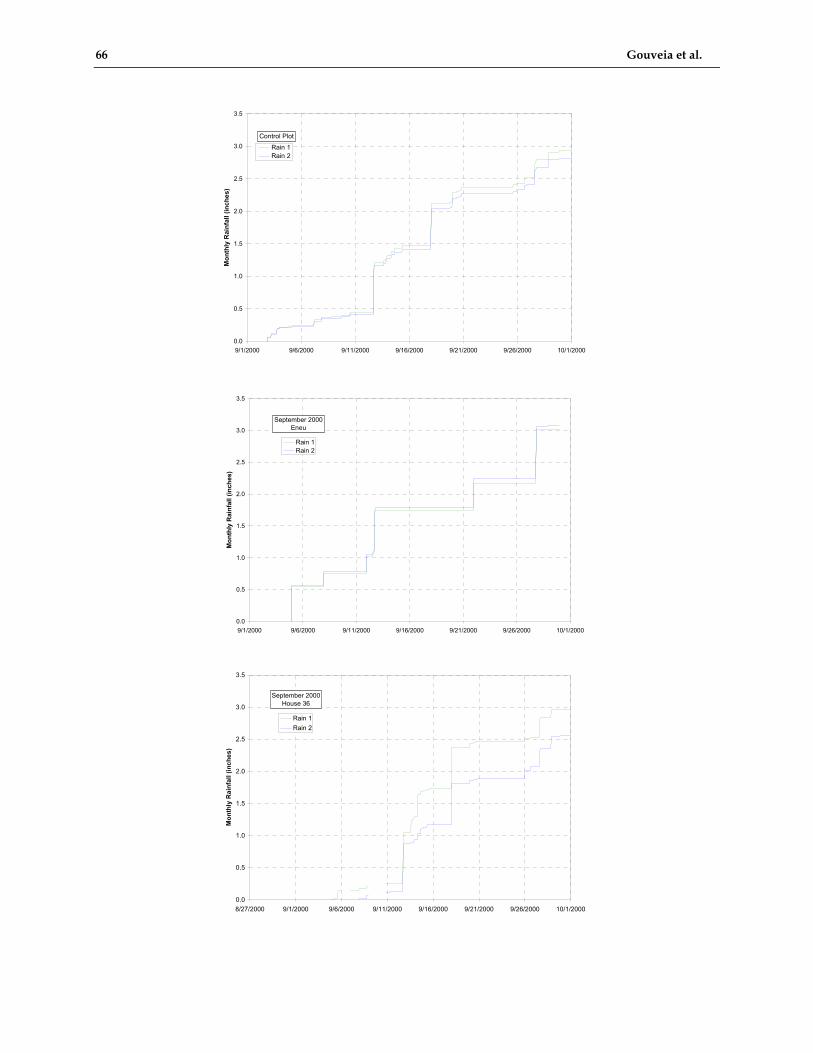
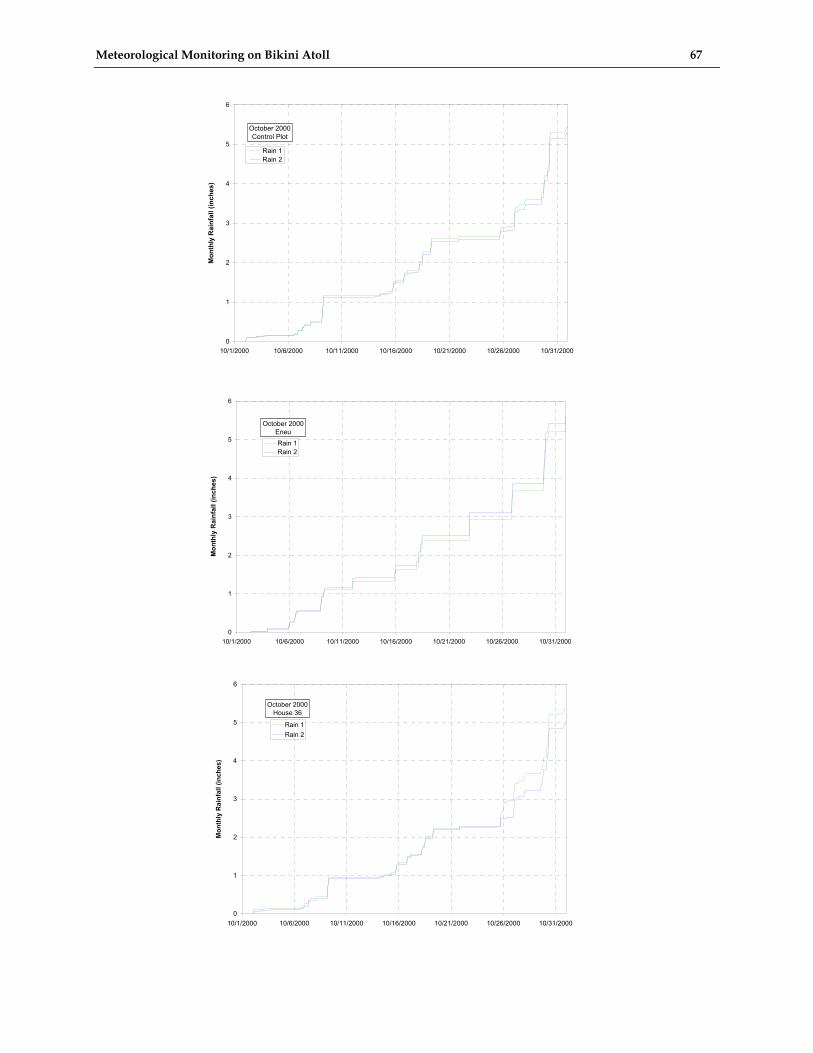
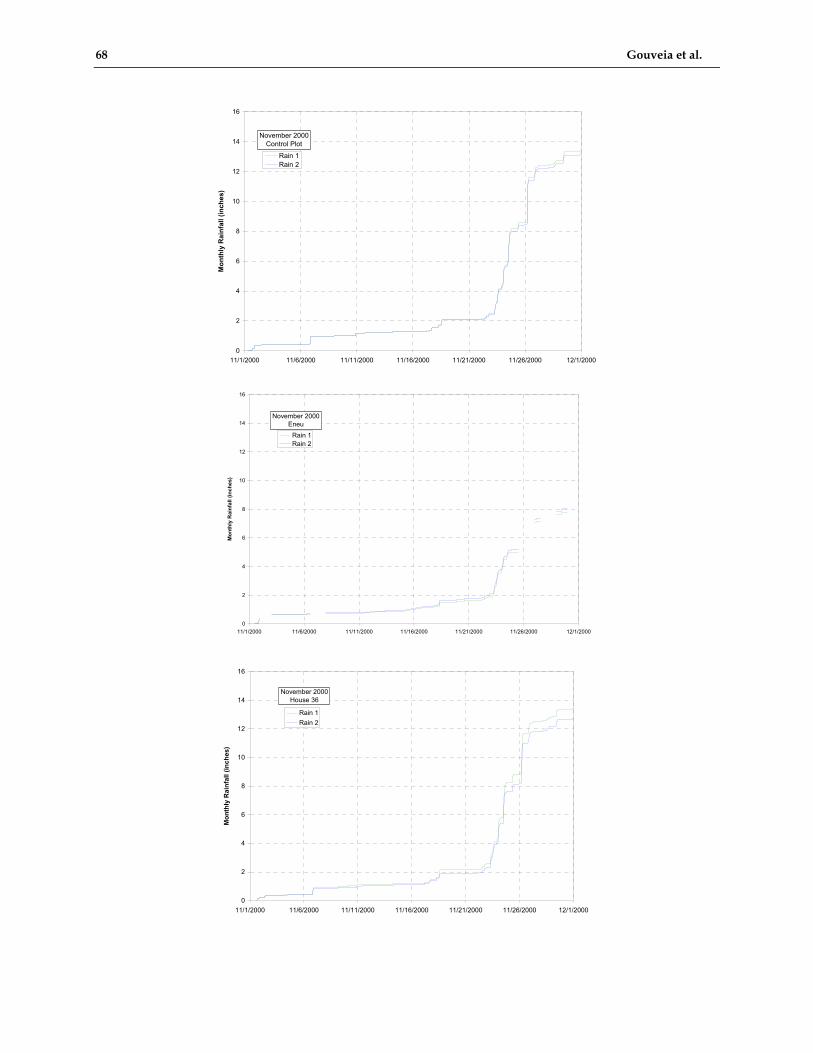
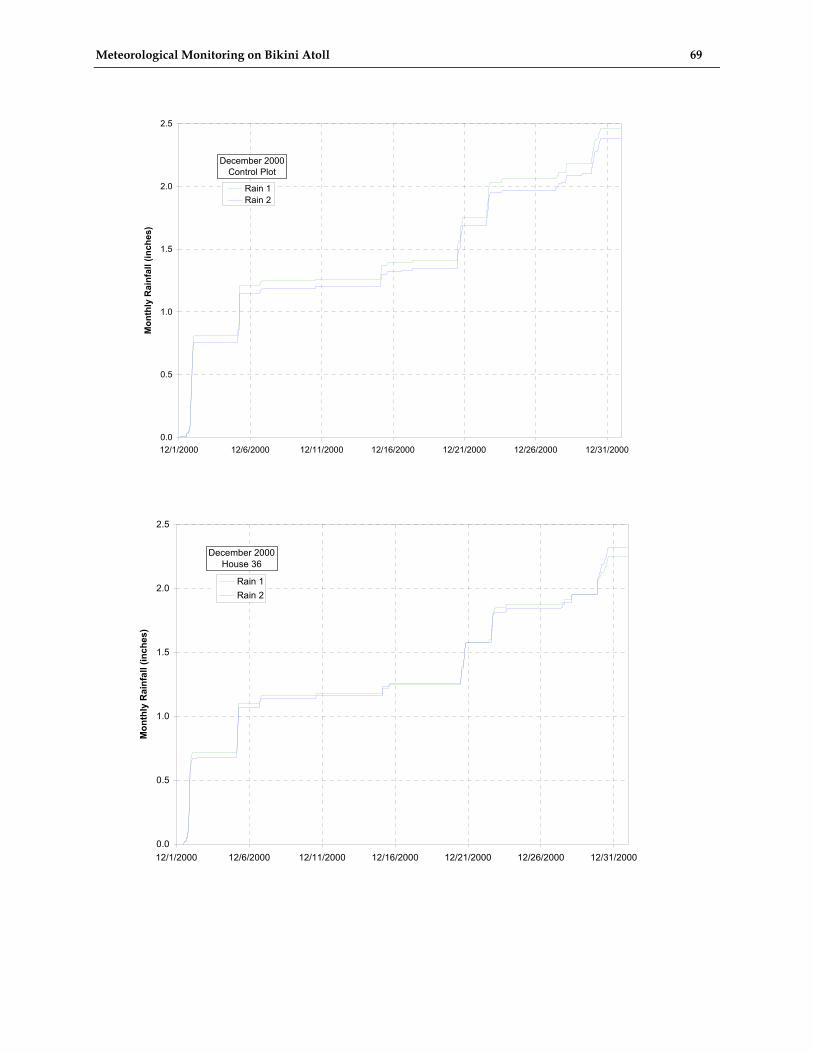
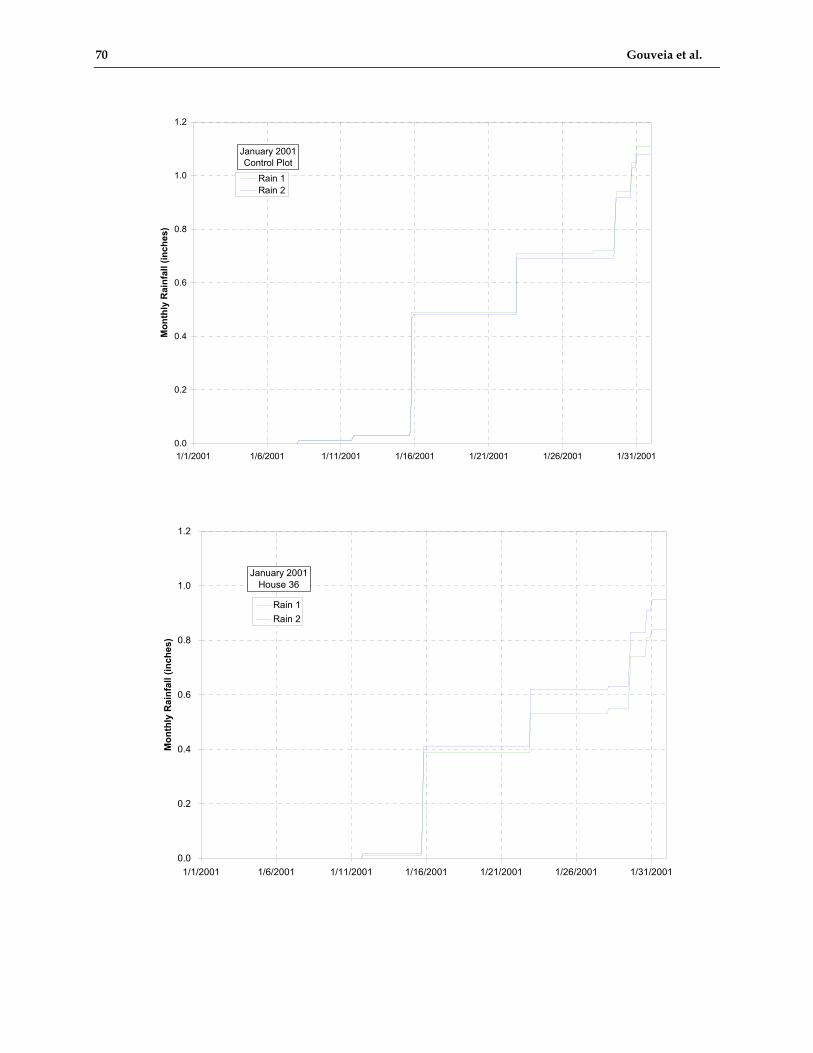
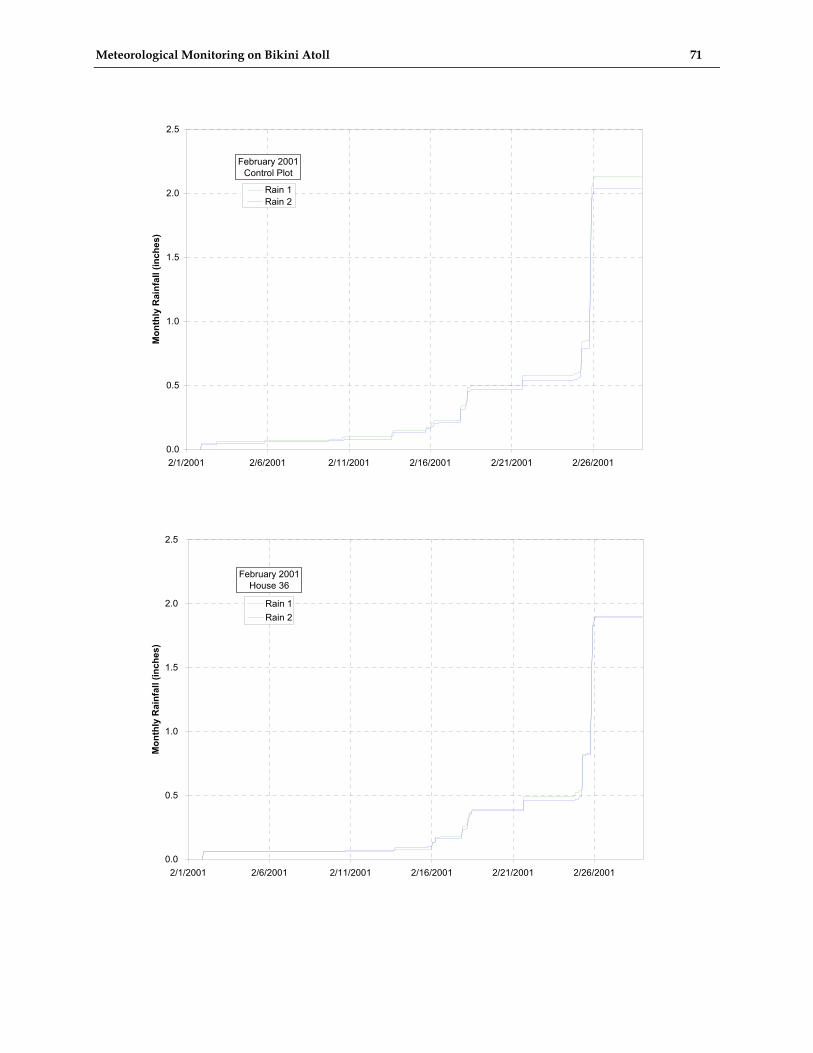
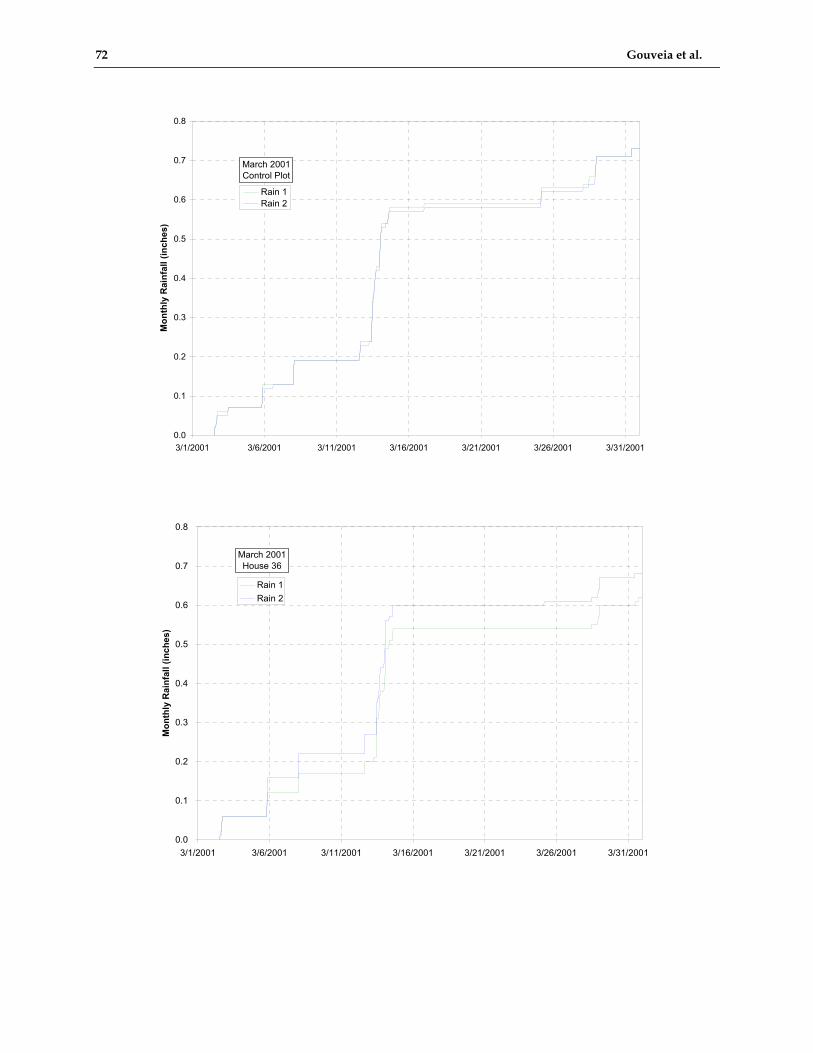
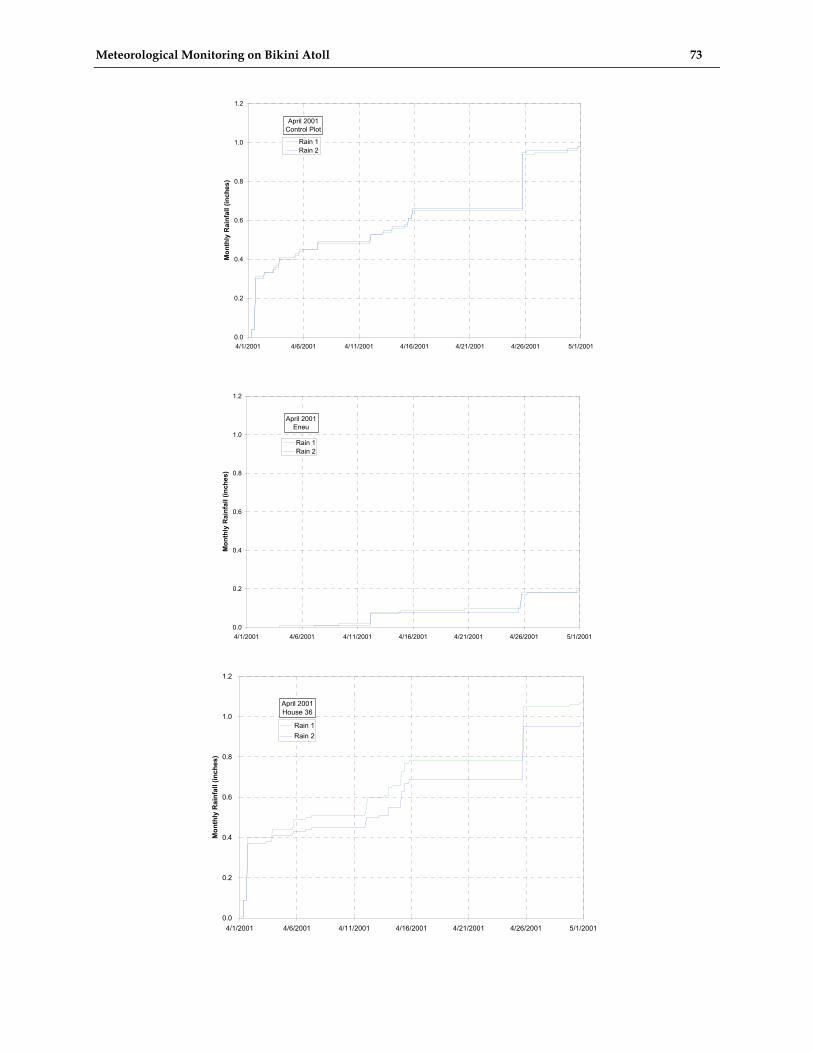
compiled into a single Excel workbook. The tables and graphs created in these workbooks should be reviewed for completeness, and crosschecked. Appendix D contains a series of plots of the Bikini meteorological data created for each month from May 2000 through February 2001.
Annual Files Selected data from every month are compiled
into an Excel workbook representing a summary of the entire year. A series of tables and charts from the year 2000-2001 is shown in Appendix E. The meteorological year for Bikini coincides with the calendar year.
Summary of 2000-2001 Data
Every year a summary of the experiences with the Bikini meteorological system should be consolidated into a report for distribution within the Marshall Islands Program. Included should be tables of daily and monthly totals of rainfall,
reports of missing data, sensor-swap reports, and any other significant data or news pertaining to the system. The following section is a summary report for the period from the installation of the new loggers
Meteorological Monitoring on Bikini Atoll 7
Table 4. Interpretation of the DAPS download message string following this example: CA30022A01131094624G46-4NN030W0000293. Example Size (bytes) Name of field Notes CA3022A 8 Address of logger 01 2 Year message was received 01 is 2001 131 3 Day of year message received 131 is 11 May for non-Leap Year 09 2 Hour message was received GMT 46 2 Minute message was received 24 2 Second message was received G 1 Status code G for Good data; ? for parity error 46 2 Signal strength Between 44 and 48 is normal -4 2 Frequency offset 50 Hz steps; -4 = -200 Hz; ±8 is normal N 1 Modulation index N is Normal N 1 Data quality N is Normal 030 3 Channel message was received 30 or 28 W 1 GOES Spacecraft W is GOES West 00 2 Uplink carrier status 00 is normal 00293 5 Length of message in bytes and transmitters in early May 2000 through the end of April 2001.
Mission and Station Reports Spring 2000 Mission
By 2 May 2000, three new Campbell Scientific CR10X loggers were installed on Bikini Atoll. The existing sensors and towers were combined with new loggers, satellite transmitters and enclosures. The circuitry was simplified, and the logger programs were standardized among the stations. The only sensors not operating at this time were the solar cells, which lacked precision resistors. All the other sensors were swapped with reconditioned sensors. The rain gauges were all checked with a rain gauge calibrator Spring 2001 Mission
Errors in satellite data transmission and timing problems when downloading caused numerous small gaps in the real-time data recovery. Most of these gaps were recovered by Richard Giles in January 2001 by on-site downloading to a storage module. A manual download was also performed during the spring mission. There was a possible 8544 hours of data collection for the period from 9 May 2000 to 30 April 2001. The proportion of data recovered that produced valid wind speed and direction data was 98.8% for Control Plot, 77.7% for House 36, and 41.7% for Eneu.
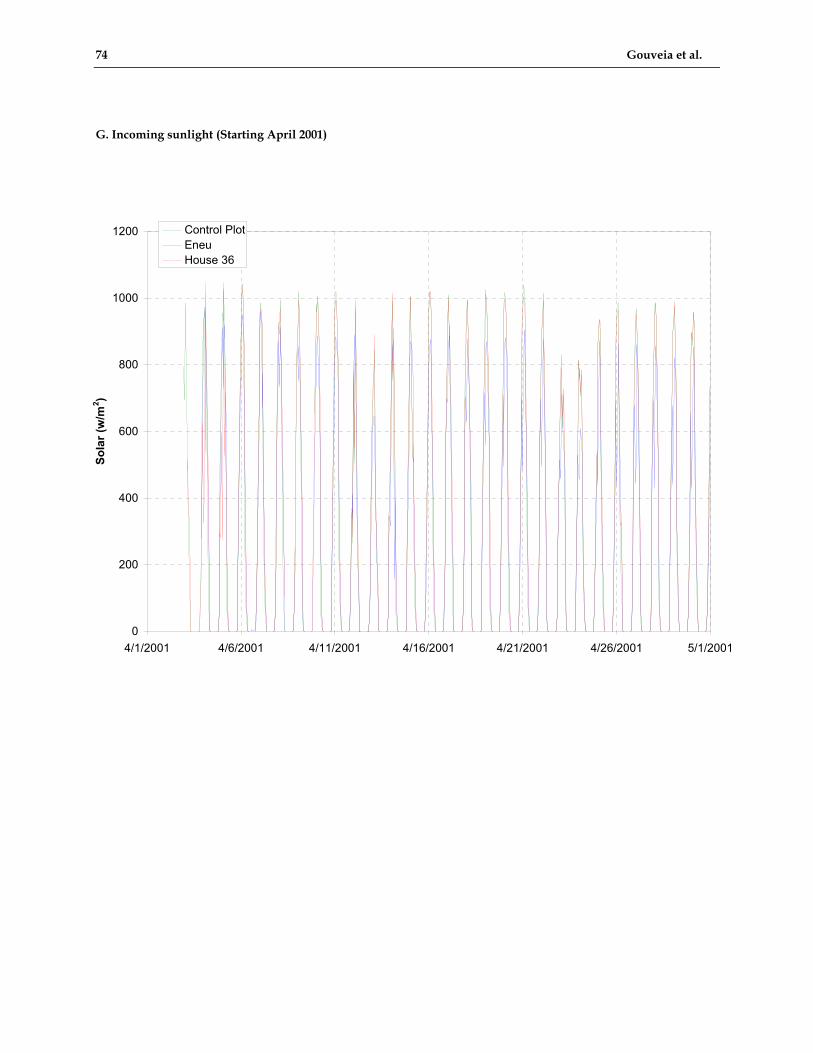
New solar sensors, complete with the proper precision resistors, were installed in all three stations. House 36 and Control Plot received new solar
sensors, while the Eneu station received an old, calibrated and accurate sensor. We manufactured new crossarms to hold the solar sensors. The new crossarms are attached to the towers a few feet above the logger enclosure. This low height ensures that there will be no need to extend the signal wire. Also, alignment of the solar sensor can be done while standing on a 6-foot ladder.
House 36
An unexplained change in the House 36 logger program starting on 5 August 2000 and ending on 9 September 2000 resulted in a loss of several data channels. During this 34-day period, most of the parameters were not recovered, although wind speed, hourly rainfall, and box temperature were unaffected. On 9 September the logger was reprogrammed. After this date, all channels were collected properly. Unfortunately, the logger was reset at that time, and it was not possible to perform an on-site recovery of the data taken before 9 September. The on-site recovery procedures done in January and April 2001 filled in all the gaps in the House 36 data to yield a complete set of data after 9 September.
Control Plot
The transmitter on the Control Plot system operated properly from the install date in May 2000 until late in October. The timing and frequency shifted outside the functioning window and data recovery via satellite was interrupted. This transmitter was replaced during the Spring 2001
8 Gouveia et al.
mission and sent to Campbell Scientific for warranty repairs. The on-site data recovery successfully retrieved all the data starting in May 2000.
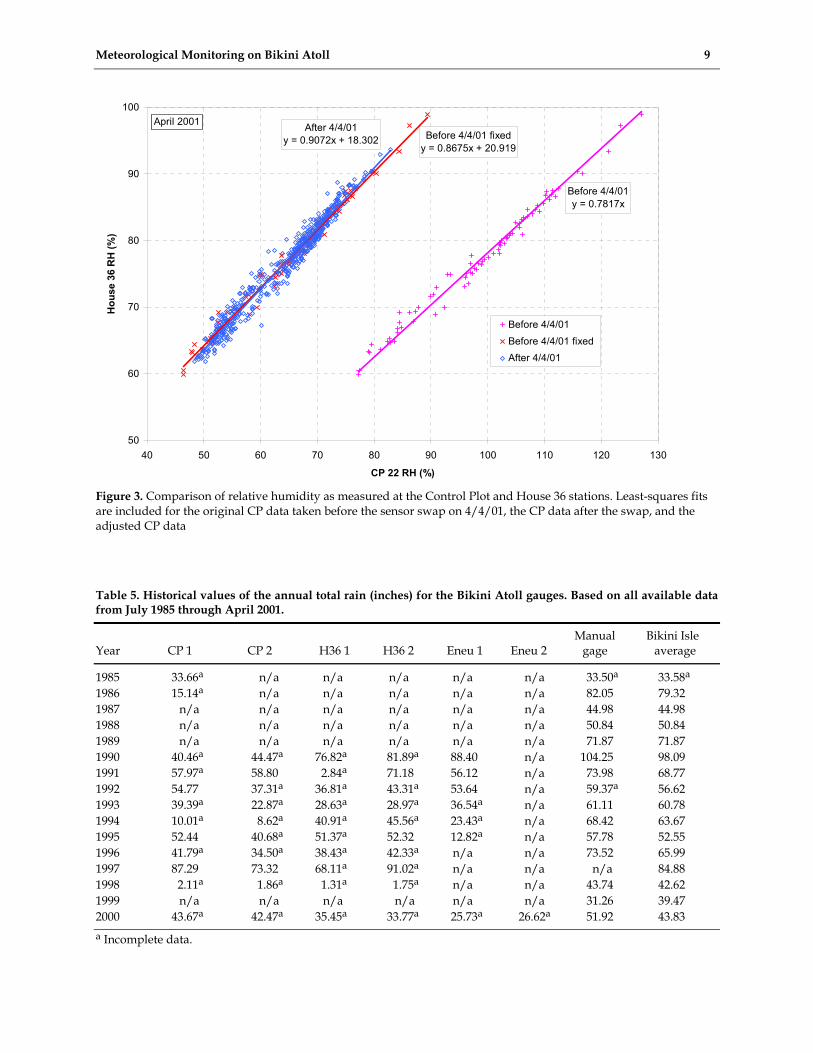
The ambient relative humidity data for the Control Plot is obviously shifted in scale, which can be seen when compared to the House 36 data (see Appendix D). The RH sensor was out of calibration from May 2000 until it was replaced on 4 April 2001. It is hoped that the data taken before 4 April can be adjusted with acceptable precision. Figure 3 illustrates one possible method to make this adjustment. The ambient humidity data taken before and after 4 April shows a roughly linear relationship between the Control Plot and House 36 stations. The data taken before the sensor replacement were adjusted by a linear equation to best fit the post-swap data. This adjustment method may not be appropriate since the House 36 humidity sensor has not been proven to be perfectly accurate. We will perform several procedures during the next field mission to calibrate the RH sensors.
Eneu
The base of the Eneu tower was corroded to the point that it was unsafe to climb or tilt the tower to swap the anemometer set. After the Spring 2000 mission, Wayne Olival and his support crew replaced the base. We were able to tilt the tower during the Spring 2001 mission and replace all sensors except the rain gauges.
The Eneu logger inexplicably stopped data transmission via satellite on 29 November 2000. The attempt to recover the lost data with an on-site download was unsuccessful in January 2001. While servicing the Eneu system during the spring mission, we found that the logger program was incorrect and actually set to sit idle. These problems were corrected on 3 April 2001 and the Eneu station is currently working properly.
Historical Rainfall Data The Marshall Islands Program has maintained
several rain gauges on Bikini Island since July 1985.
The longest and most-complete record comes from the manual gauge located near the Department of Energy (DOE) compound. This gauge is a simple graduated rain collector. Every day at 7 p.m. the gauge is read, and the total daily rain is recorded in a notebook. The rain record from this gauge is complete except for a few missing days in April, May, and July of 1992.
In April 1990, five gauges were installed as part of the automatic weather-monitoring system on Bikini Atoll. Two gauges were part of the Control Plot system, two at House 36, and one on Eneu with a second installed in May 2000.
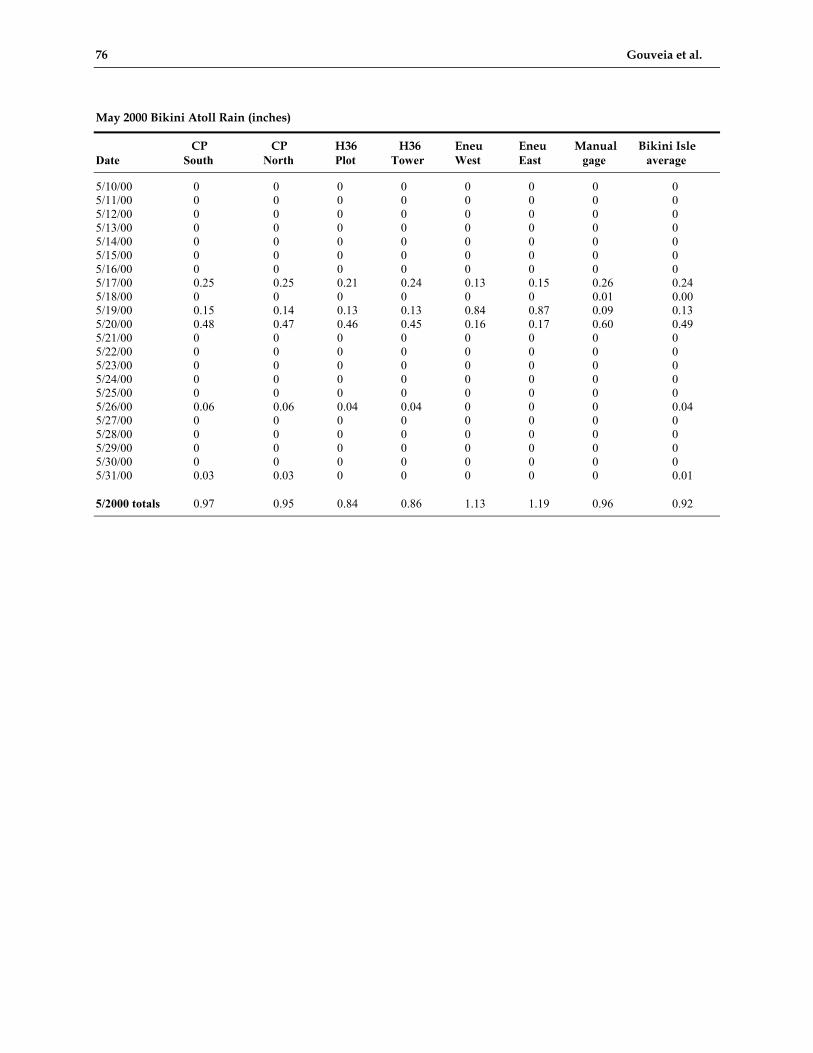
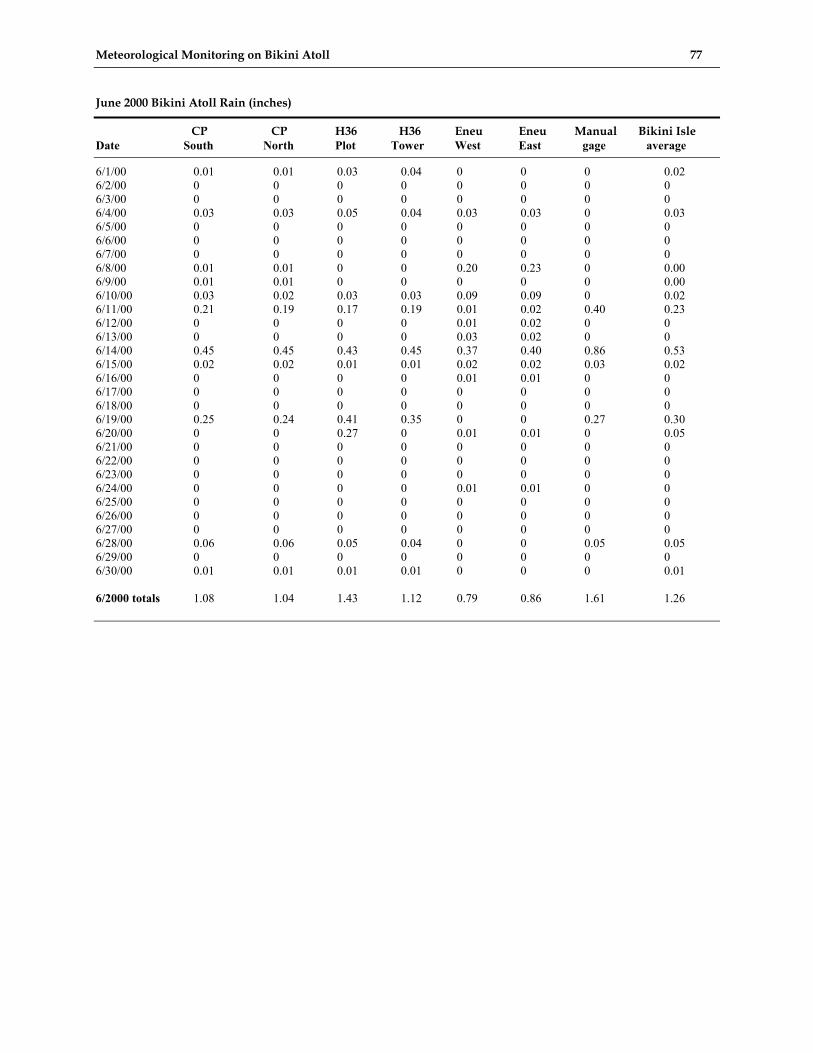
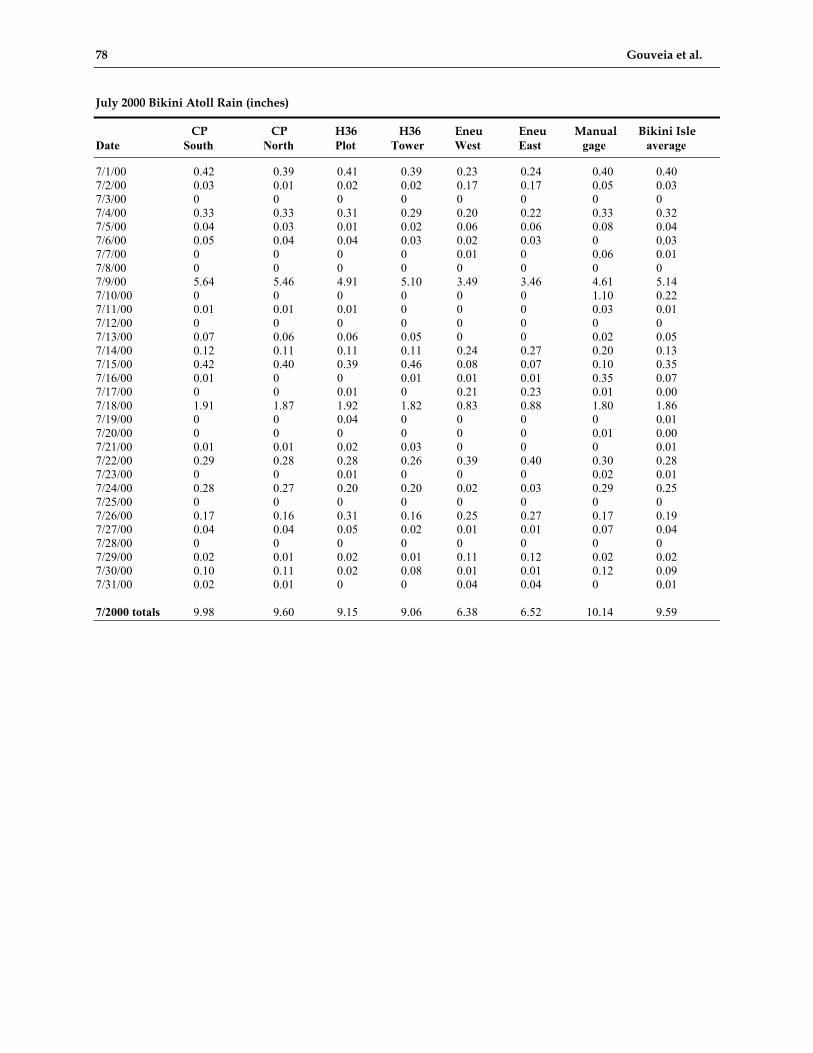
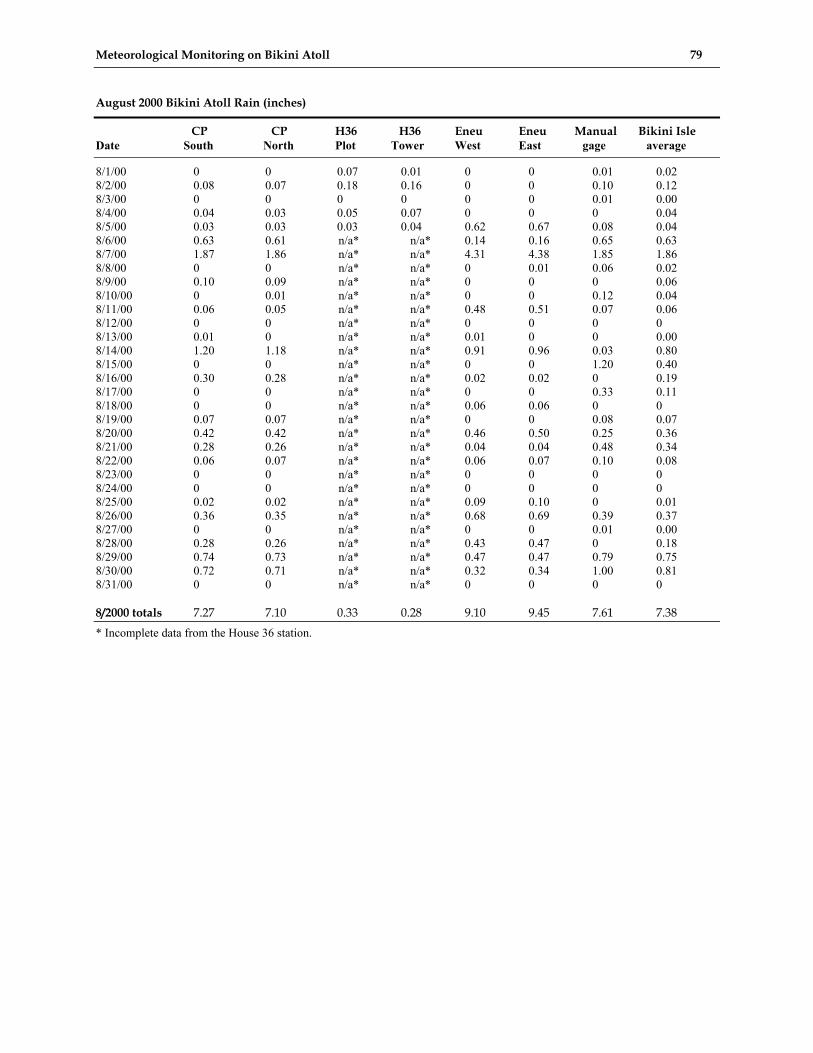
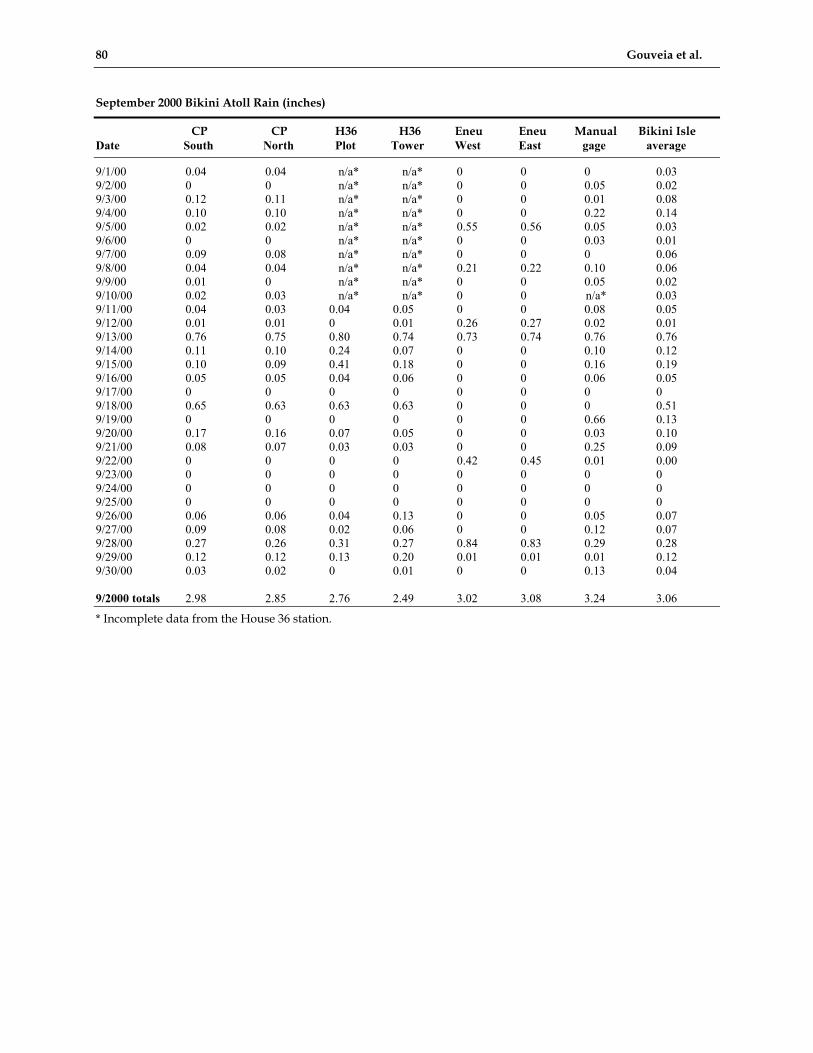
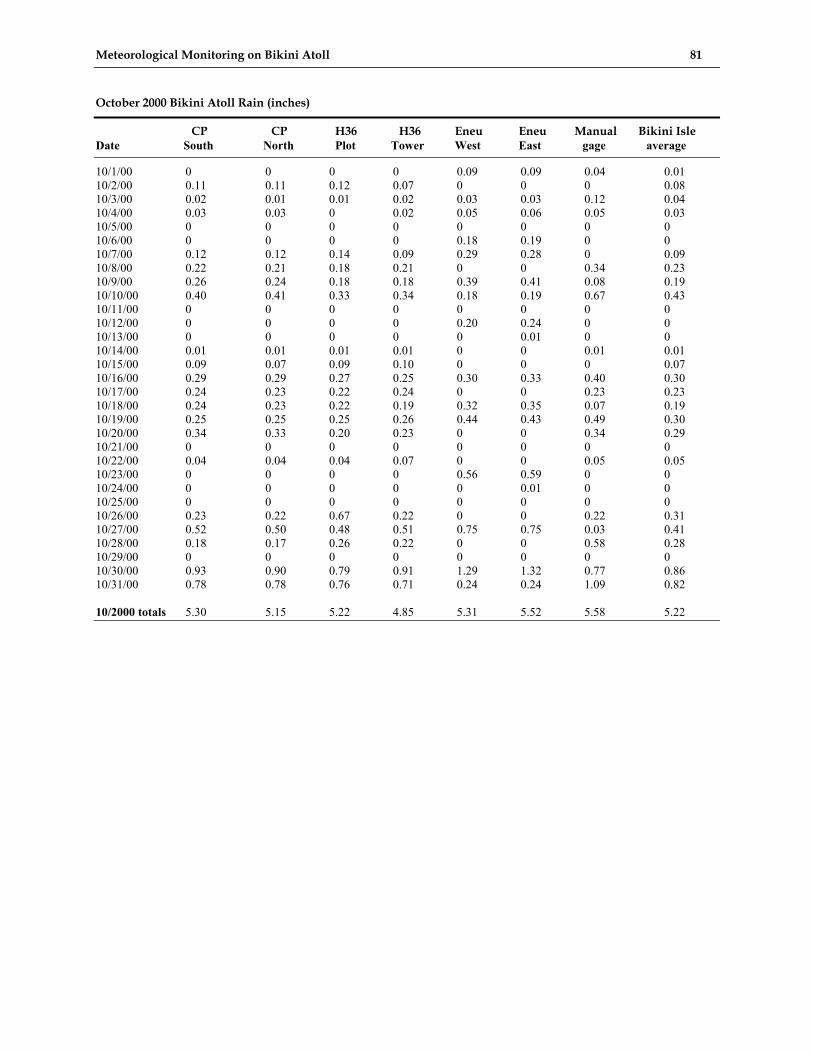
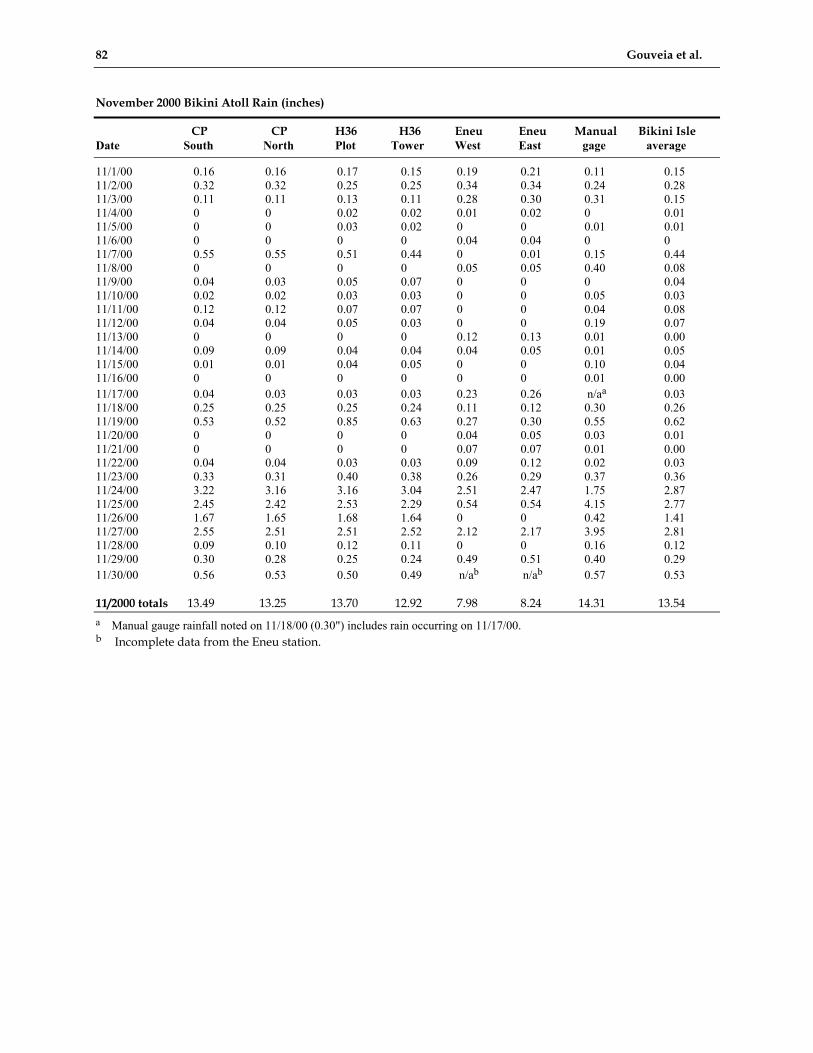
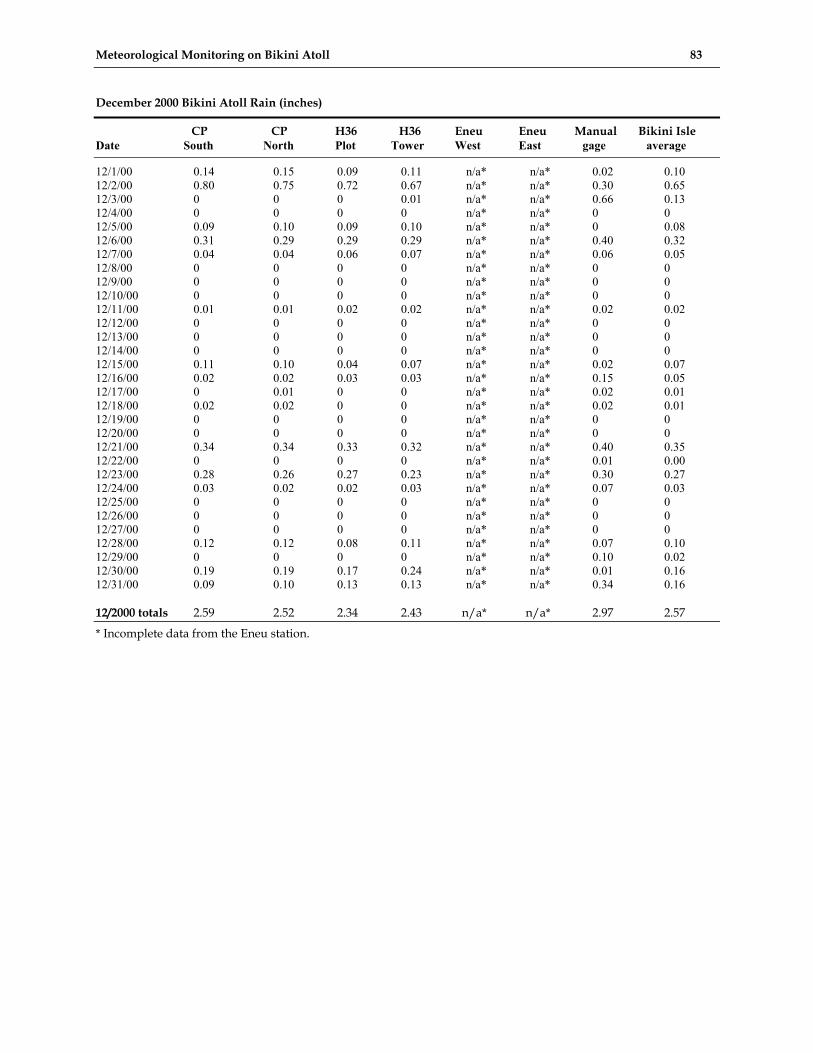
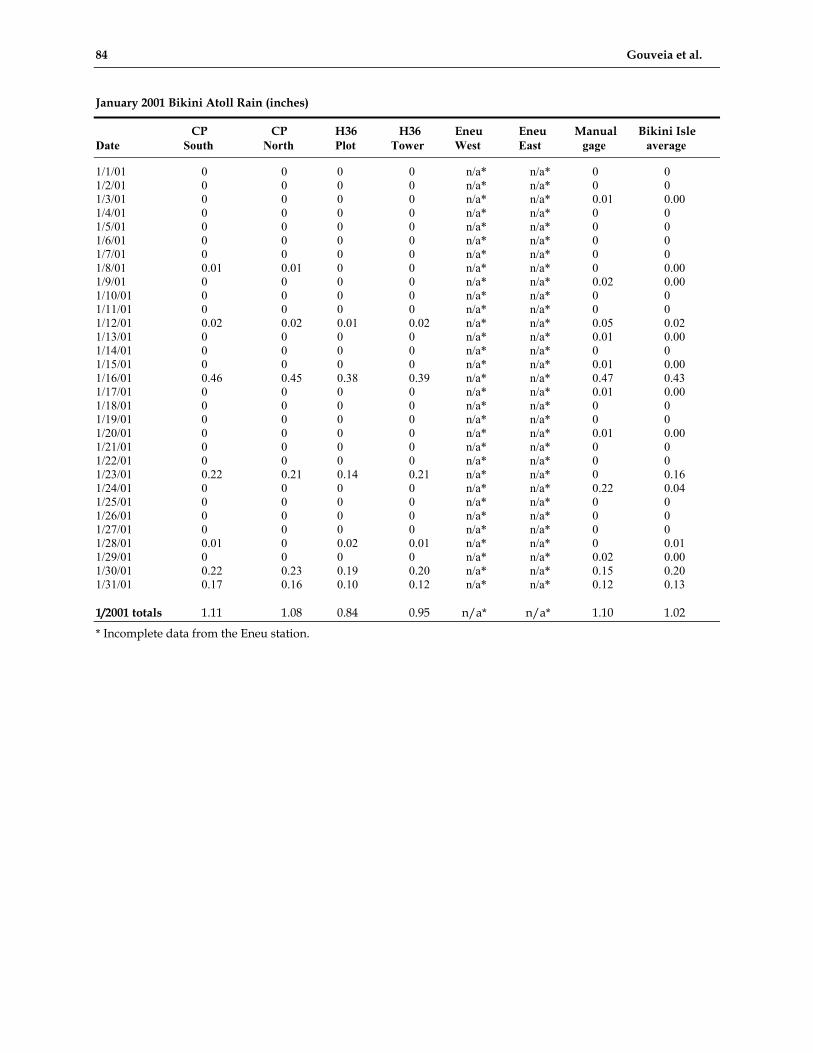
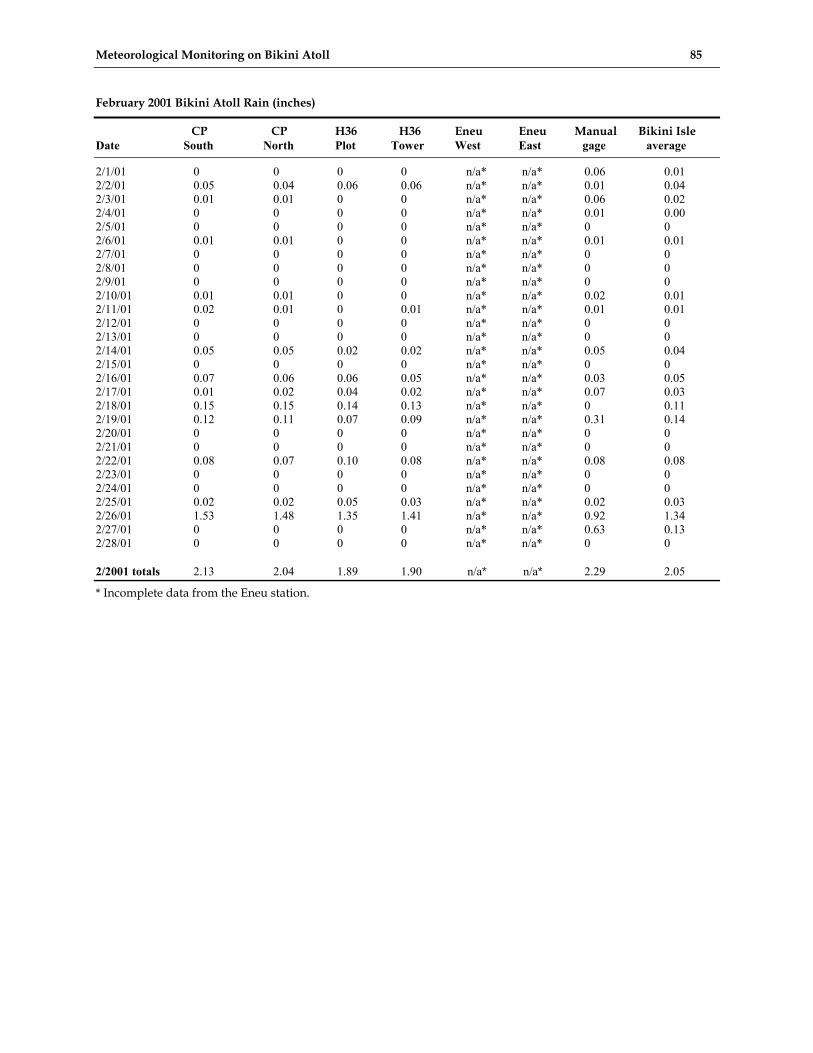
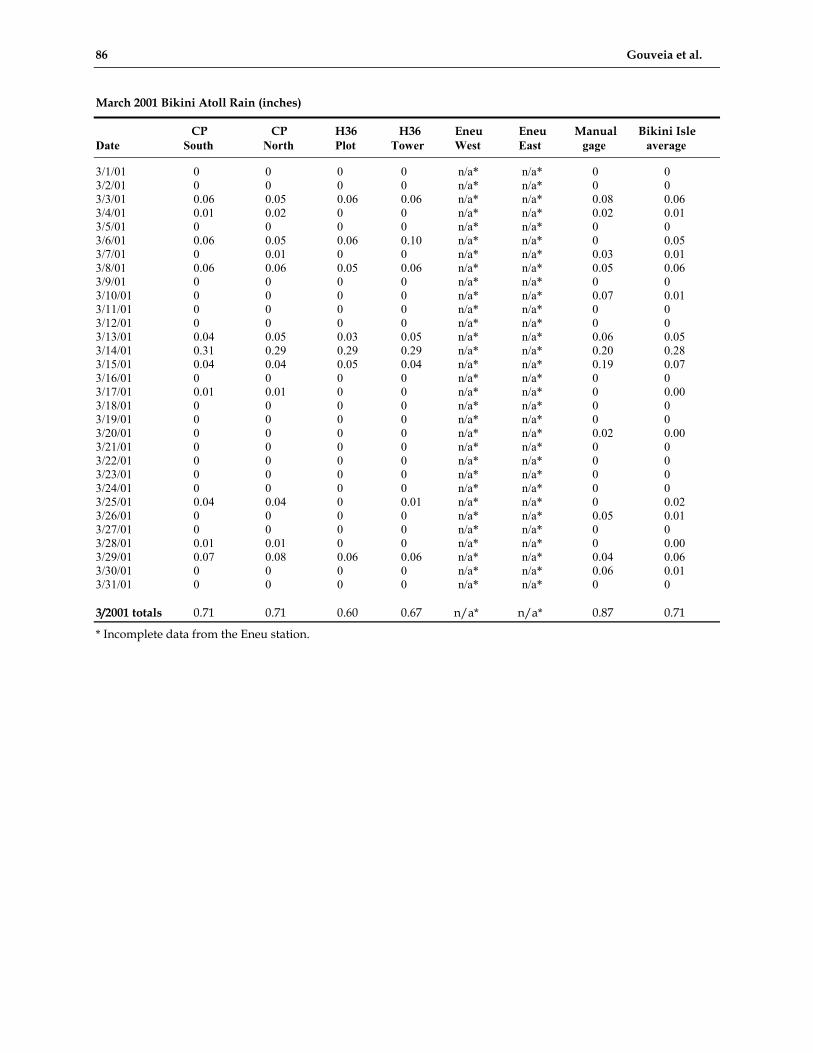
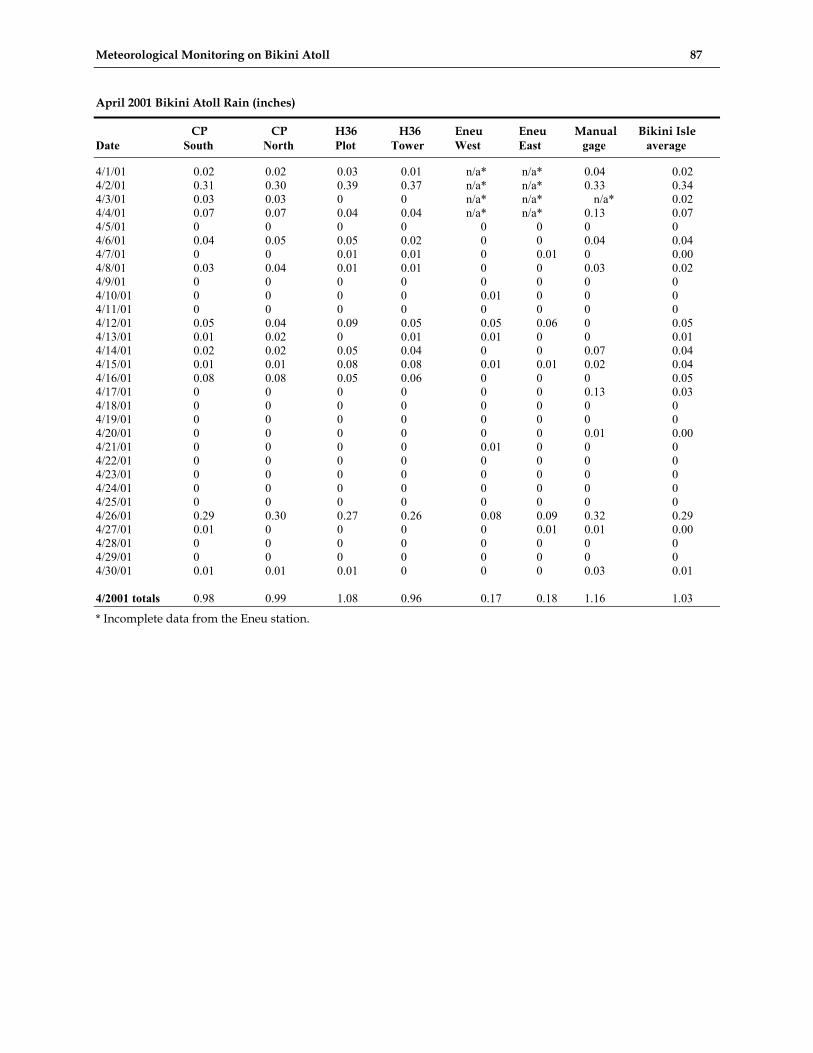
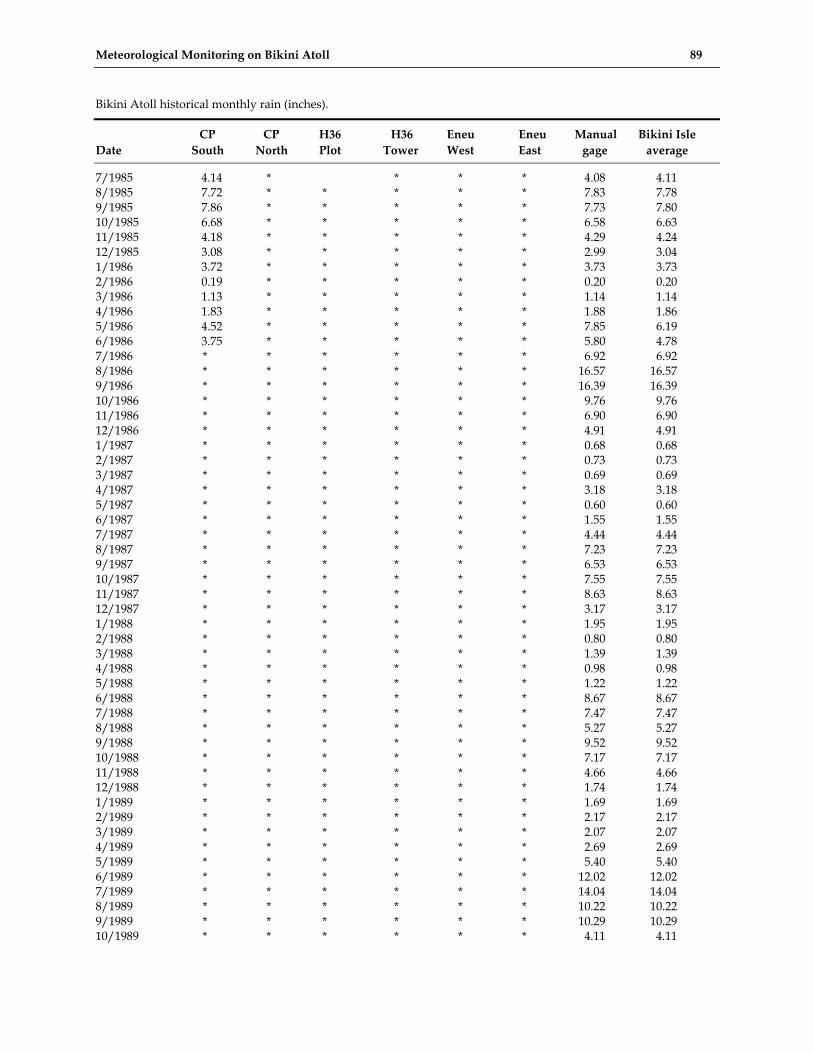
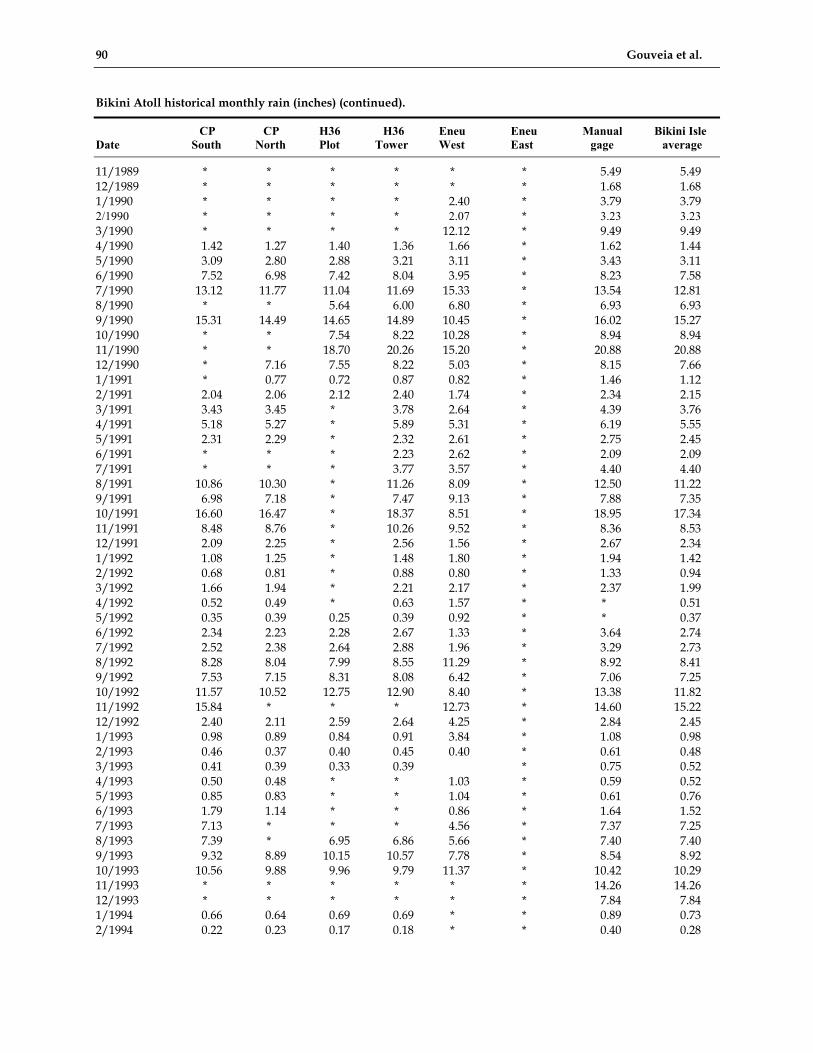
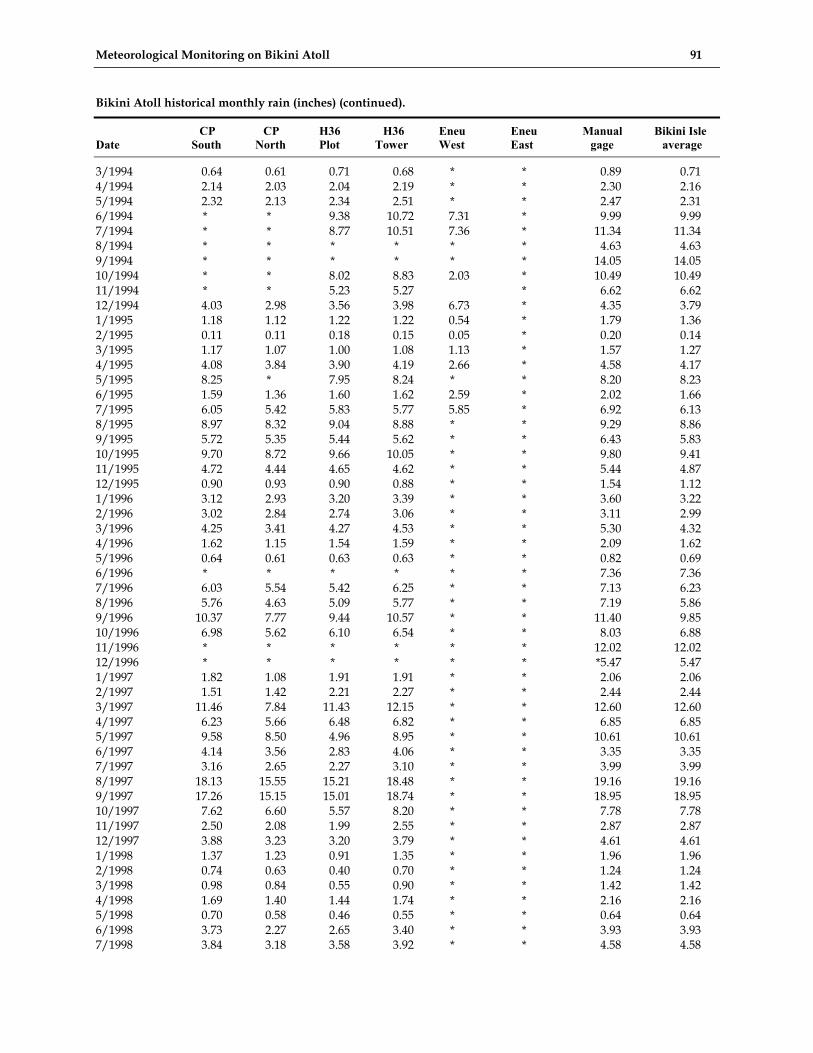
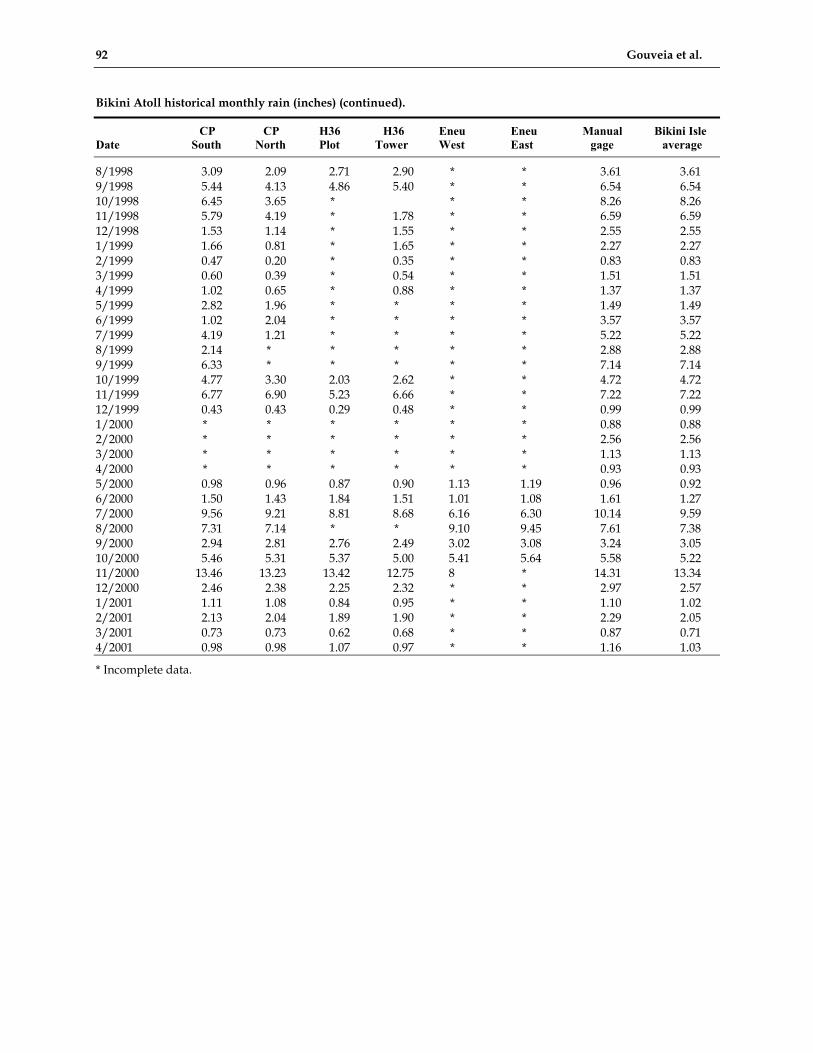
Monthly totals of rain measured by all six Bikini Atoll rain gauges are listed in Appendix F. The monthly totals are computed from daily values. Data are omitted from the monthly list when there are significant missing daily data. The column on the far right (Bikini Isle average) represents the best estimate for the monthly rainfall for Bikini Island. This column is computed from all valid data from the Bikini Island gauges (Control Plot, House 36, and the Manual gauge). Before May 2000 the Bikini Isle average was computed using monthly data. From May 2000 to present daily totals are used to compute the Bikini Isle average.
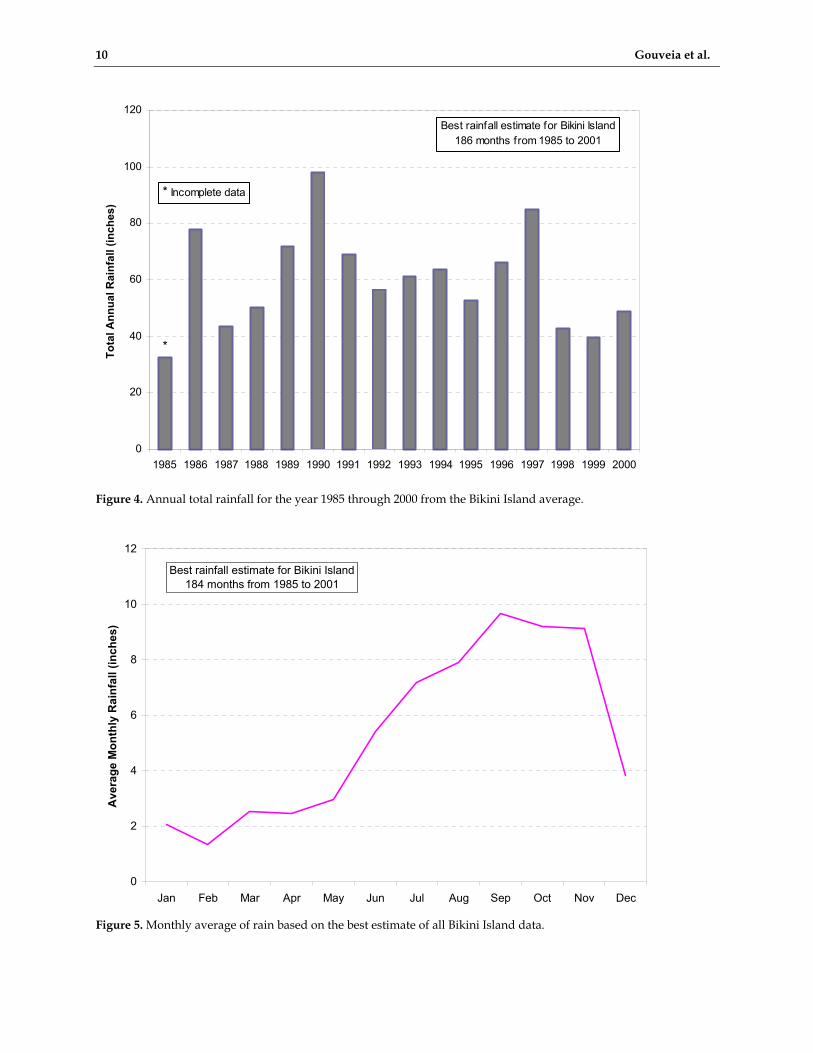
The annual summary of the monthly rain data from Appendix F appears in Table 5. The average rainfall computed from the 13 years of Bikini Isle averages (1986 through 1998) is 64.8" (164.6 cm). The column in Table 5 of Bikini Isle averages is presented in Figure 4. The asterisks above the bars for the years 1985, 1999, and 2000 indicate that the totals for these years are incomplete.
The average monthly rainfall illustrated in Figure 5 is based on the Bikini Island averages in Appendix F. Table 6 shows the monthly averages for all the rain gauges on Bikini Atoll. Differences among these monthly averages are caused, in large part, by the mixture of months that make up the individual average. The annual average computed from the
Meteorological Monitoring on Bikini Atoll 9
Before 4/4/01 fixedy = 0.8675x + 20.919
After 4/4/01y = 0.9072x + 18.302
Before 4/4/01y = 0.7817x
50
60
70
80
90
100
40 50 60 70 80 90 100 110 120 130
CP 22 RH (%)
Hou
se 3
6 R
H (%
)
Before 4/4/01Before 4/4/01 fixedAfter 4/4/01
April 2001
Figure 3. Comparison of relative humidity as measured at the Control Plot and House 36 stations. Least-squares fits are included for the original CP data taken before the sensor swap on 4/4/01, the CP data after the swap, and the adjusted CP data Table 5. Historical values of the annual total rain (inches) for the Bikini Atoll gauges. Based on all available data from July 1985 through April 2001. Manual Bikini Isle Year CP 1 CP 2 H36 1 H36 2 Eneu 1 Eneu 2 gage average 1985 33.66a n/a n/a n/a n/a n/a 33.50a 33.58a 1986 15.14a n/a n/a n/a n/a n/a 82.05 79.32 1987 n/a n/a n/a n/a n/a n/a 44.98 44.98 1988 n/a n/a n/a n/a n/a n/a 50.84 50.84 1989 n/a n/a n/a n/a n/a n/a 71.87 71.87 1990 40.46a 44.47a 76.82a 81.89a 88.40 n/a 104.25 98.09 1991 57.97a 58.80 2.84a 71.18 56.12 n/a 73.98 68.77 1992 54.77 37.31a 36.81a 43.31a 53.64 n/a 59.37a 56.62 1993 39.39a 22.87a 28.63a 28.97a 36.54a n/a 61.11 60.78 1994 10.01a 8.62a 40.91a 45.56a 23.43a n/a 68.42 63.67 1995 52.44 40.68a 51.37a 52.32 12.82a n/a 57.78 52.55 1996 41.79a 34.50a 38.43a 42.33a n/a n/a 73.52 65.99 1997 87.29 73.32 68.11a 91.02a n/a n/a n/a 84.88 1998 2.11a 1.86a 1.31a 1.75a n/a n/a 43.74 42.62 1999 n/a n/a n/a n/a n/a n/a 31.26 39.47 2000 43.67a 42.47a 35.45a 33.77a 25.73a 26.62a 51.92 43.83 a Incomplete data.
Best rainfall estimate for Bikini Island186 months from 1985 to 2001
*
* Incomplete data
Figure 4. Annual total rainfall for the year 1985 through 2000 from the Bikini Island average.
0
2
4
6
8
10
12
Jan Feb Mar Apr May Jun Jul Aug Sep Oct Nov Dec
Ave
rage
Mon
thly
Rai
nfal
l (in
ches
)
Best rainfall estimate for Bikini Island184 months from 1985 to 2001
Figure 5. Monthly average of rain based on the best estimate of all Bikini Island data.
Meteorological Monitoring on Bikini Atoll 11
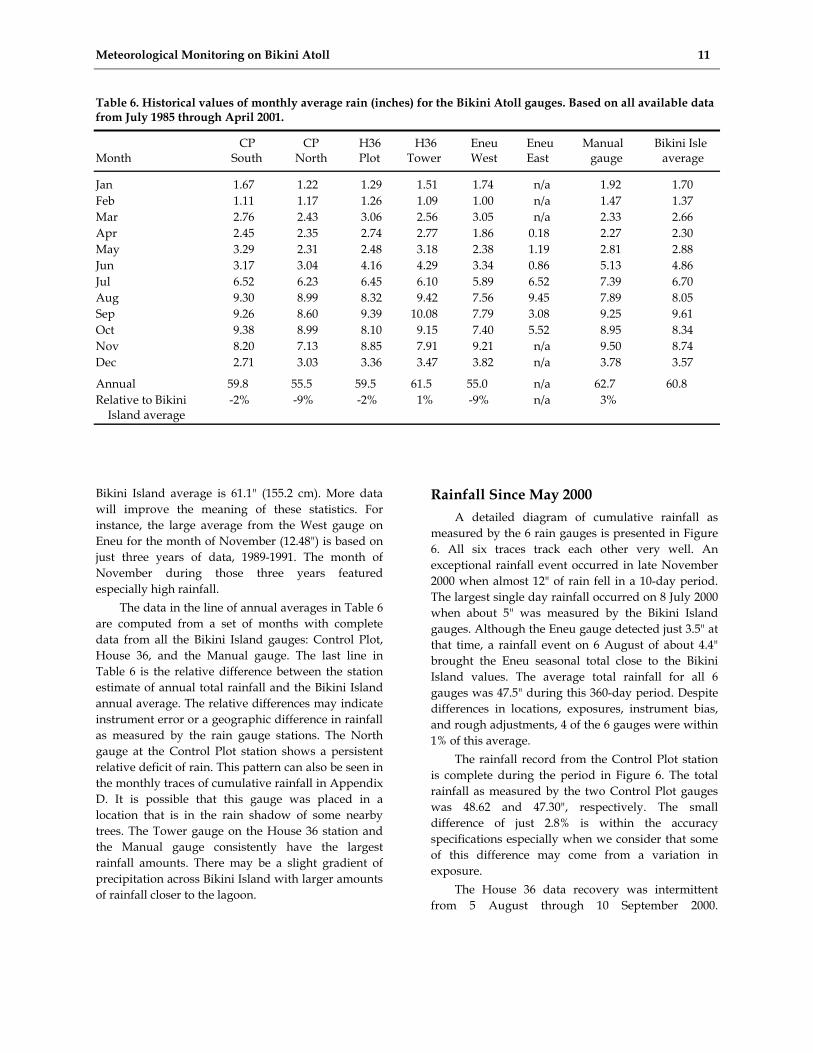
Table 6. Historical values of monthly average rain (inches) for the Bikini Atoll gauges. Based on all available data from July 1985 through April 2001. CP CP H36 H36 Eneu Eneu Manual Bikini Isle Month South North Plot Tower West East gauge average Jan 1.67 1.22 1.29 1.51 1.74 n/a 1.92 1.70 Feb 1.11 1.17 1.26 1.09 1.00 n/a 1.47 1.37 Mar 2.76 2.43 3.06 2.56 3.05 n/a 2.33 2.66 Apr 2.45 2.35 2.74 2.77 1.86 0.18 2.27 2.30 May 3.29 2.31 2.48 3.18 2.38 1.19 2.81 2.88 Jun 3.17 3.04 4.16 4.29 3.34 0.86 5.13 4.86 Jul 6.52 6.23 6.45 6.10 5.89 6.52 7.39 6.70 Aug 9.30 8.99 8.32 9.42 7.56 9.45 7.89 8.05 Sep 9.26 8.60 9.39 10.08 7.79 3.08 9.25 9.61 Oct 9.38 8.99 8.10 9.15 7.40 5.52 8.95 8.34 Nov 8.20 7.13 8.85 7.91 9.21 n/a 9.50 8.74 Dec 2.71 3.03 3.36 3.47 3.82 n/a 3.78 3.57 Annual 59.8 55.5 59.5 61.5 55.0 n/a 62.7 60.8 Relative to Bikini -2% -9% -2% 1% -9% n/a 3% Island average Bikini Island average is 61.1" (155.2 cm). More data will improve the meaning of these statistics. For instance, the large average from the West gauge on Eneu for the month of November (12.48") is based on just three years of data, 1989-1991. The month of November during those three years featured especially high rainfall.
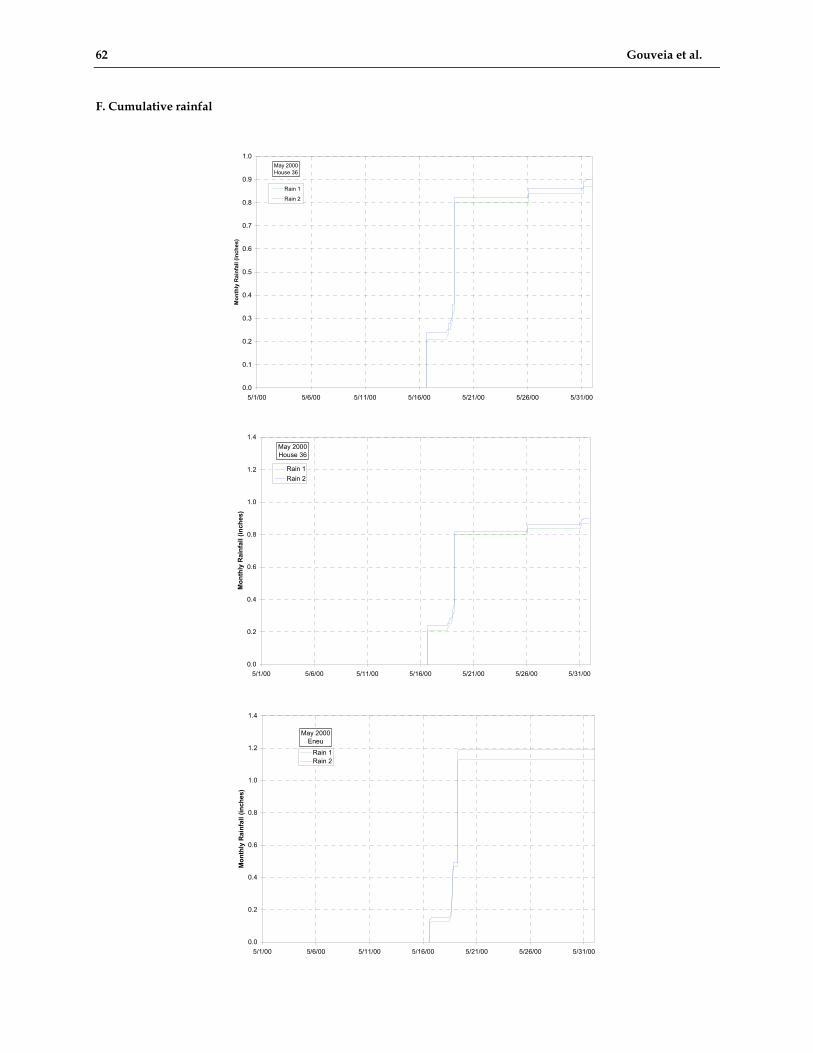
The data in the line of annual averages in Table 6 are computed from a set of months with complete data from all the Bikini Island gauges: Control Plot, House 36, and the Manual gauge. The last line in Table 6 is the relative difference between the station estimate of annual total rainfall and the Bikini Island annual average. The relative differences may indicate instrument error or a geographic difference in rainfall as measured by the rain gauge stations. The North gauge at the Control Plot station shows a persistent relative deficit of rain. This pattern can also be seen in the monthly traces of cumulative rainfall in Appendix D. It is possible that this gauge was placed in a location that is in the rain shadow of some nearby trees. The Tower gauge on the House 36 station and the Manual gauge consistently have the largest rainfall amounts. There may be a slight gradient of precipitation across Bikini Island with larger amounts of rainfall closer to the lagoon.
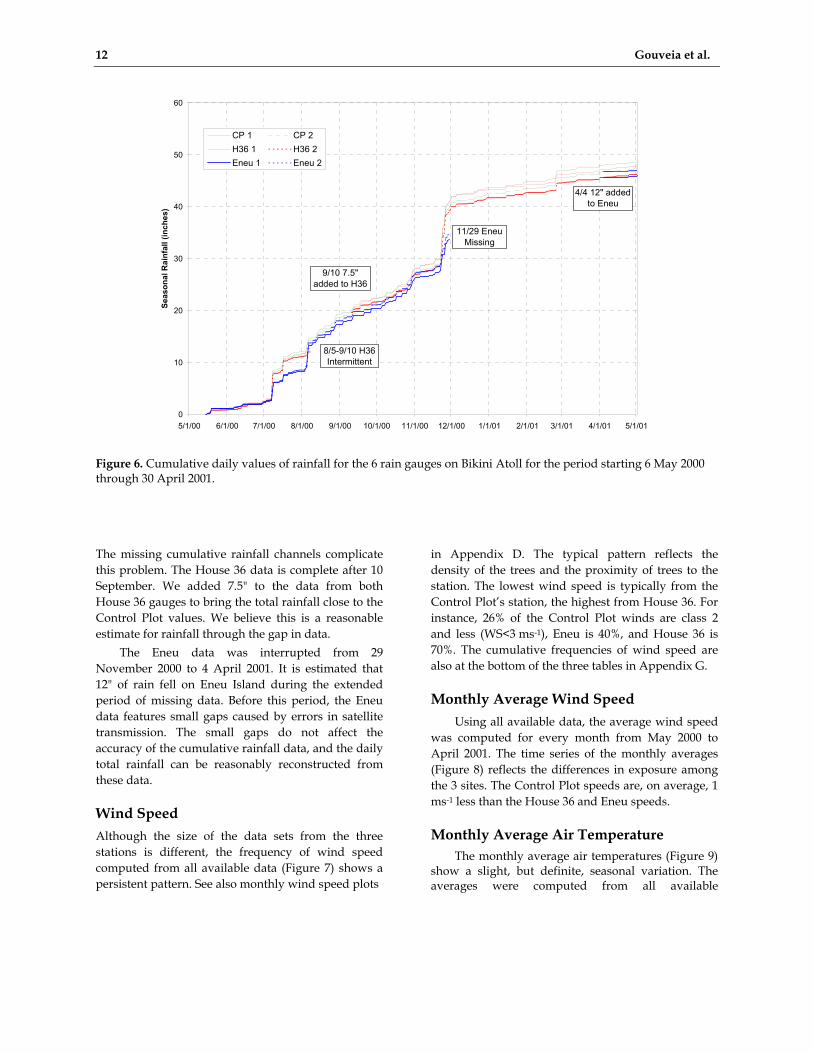
Rainfall Since May 2000 A detailed diagram of cumulative rainfall as
measured by the 6 rain gauges is presented in Figure 6. All six traces track each other very well. An exceptional rainfall event occurred in late November 2000 when almost 12" of rain fell in a 10-day period. The largest single day rainfall occurred on 8 July 2000 when about 5" was measured by the Bikini Island gauges. Although the Eneu gauge detected just 3.5" at that time, a rainfall event on 6 August of about 4.4" brought the Eneu seasonal total close to the Bikini Island values. The average total rainfall for all 6 gauges was 47.5" during this 360-day period. Despite differences in locations, exposures, instrument bias, and rough adjustments, 4 of the 6 gauges were within 1% of this average.
The rainfall record from the Control Plot station is complete during the period in Figure 6. The total rainfall as measured by the two Control Plot gauges was 48.62 and 47.30", respectively. The small difference of just 2.8% is within the accuracy specifications especially when we consider that some of this difference may come from a variation in exposure.
The House 36 data recovery was intermittent from 5 August through 10 September 2000.
12 Gouveia et al.
Figure 6. Cumulative daily values of rainfall for the 6 rain gauges on Bikini Atoll for the period starting 6 May 2000 through 30 April 2001. The missing cumulative rainfall channels complicate this problem. The House 36 data is complete after 10 September. We added 7.5" to the data from both House 36 gauges to bring the total rainfall close to the Control Plot values. We believe this is a reasonable estimate for rainfall through the gap in data.
The Eneu data was interrupted from 29 November 2000 to 4 April 2001. It is estimated that 12" of rain fell on Eneu Island during the extended period of missing data. Before this period, the Eneu data features small gaps caused by errors in satellite transmission. The small gaps do not affect the accuracy of the cumulative rainfall data, and the daily total rainfall can be reasonably reconstructed from these data.
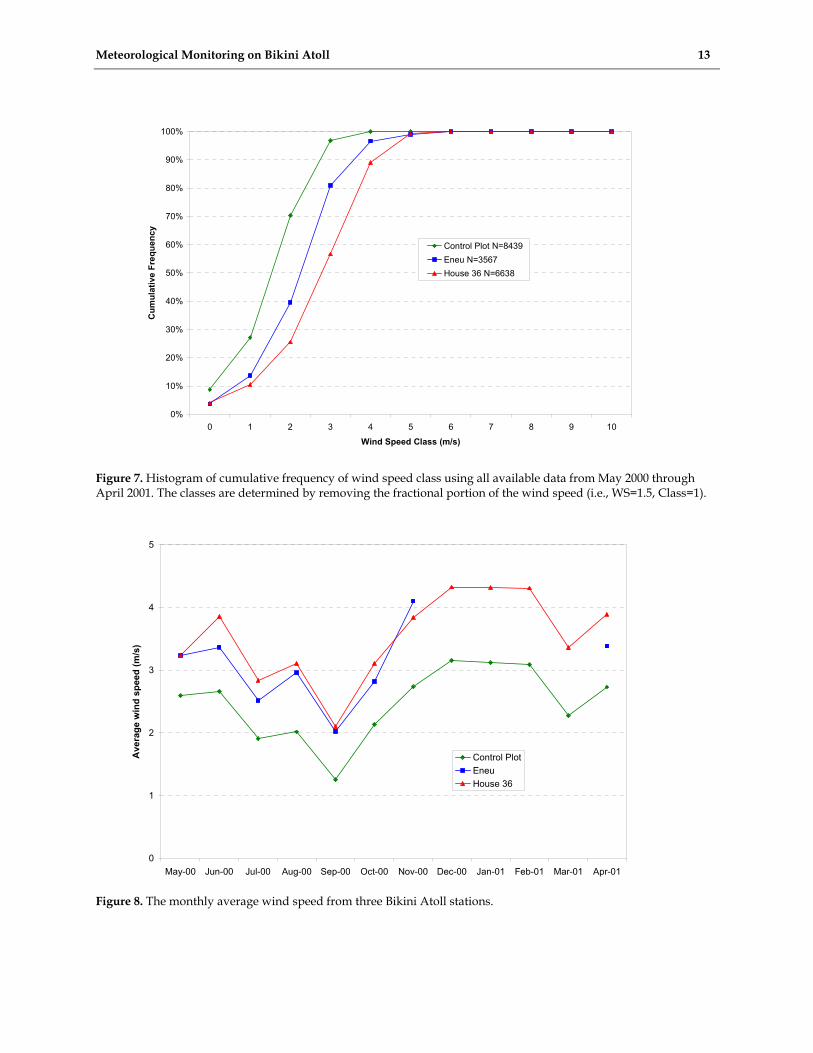
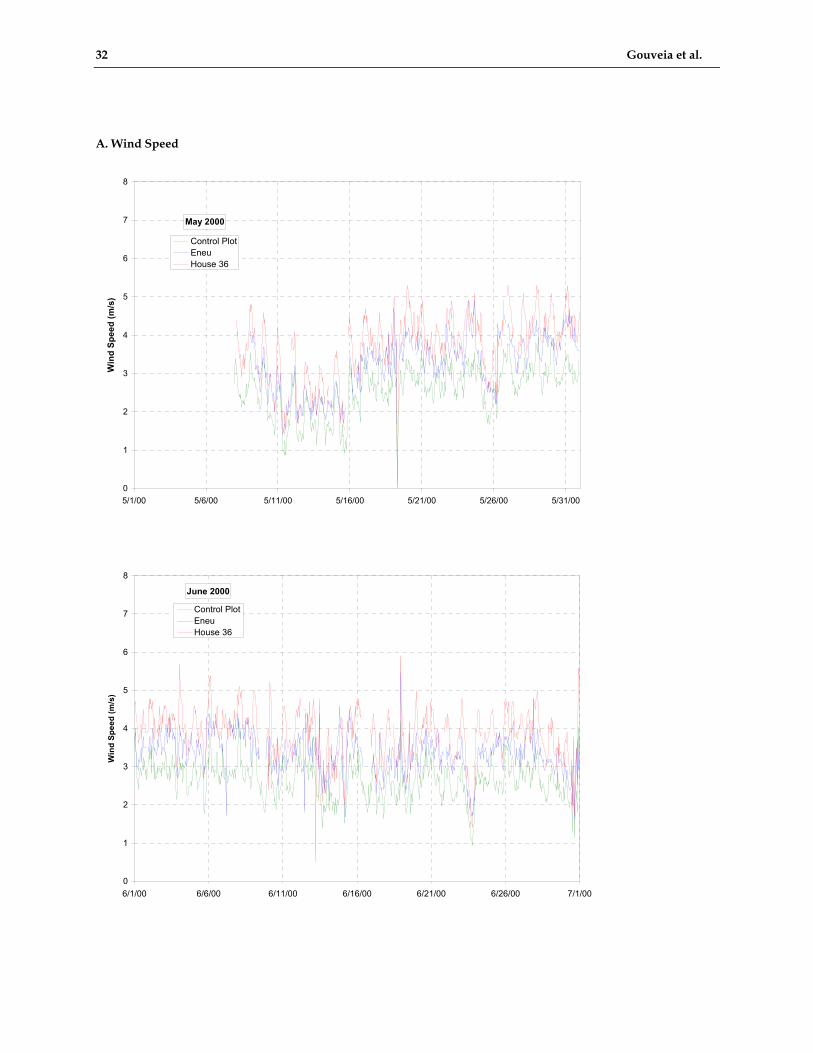
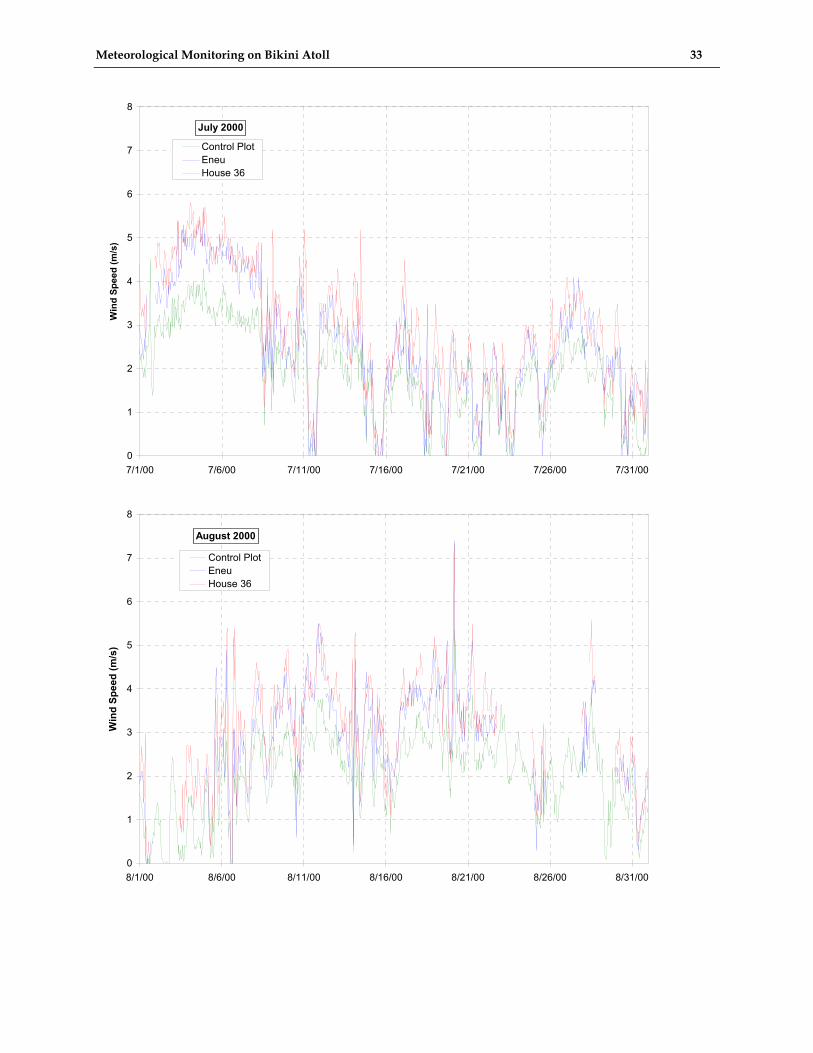
Wind Speed Although the size of the data sets from the three stations is different, the frequency of wind speed computed from all available data (Figure 7) shows a persistent pattern. See also monthly wind speed plots
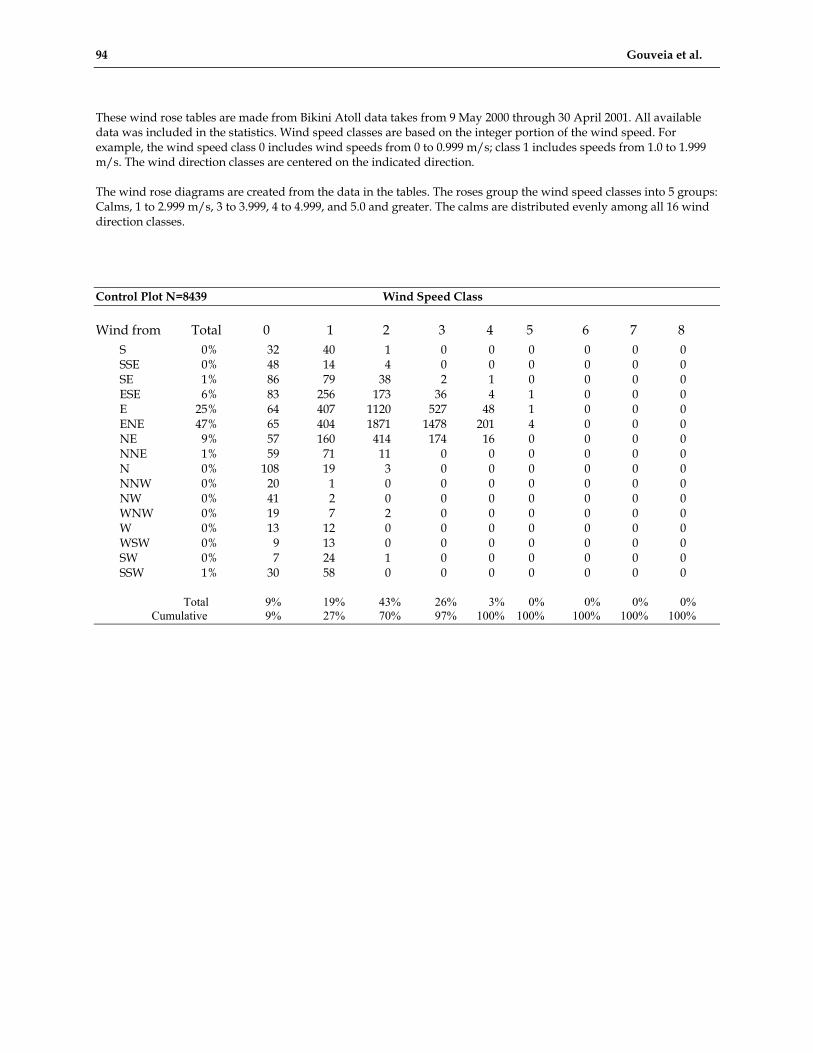
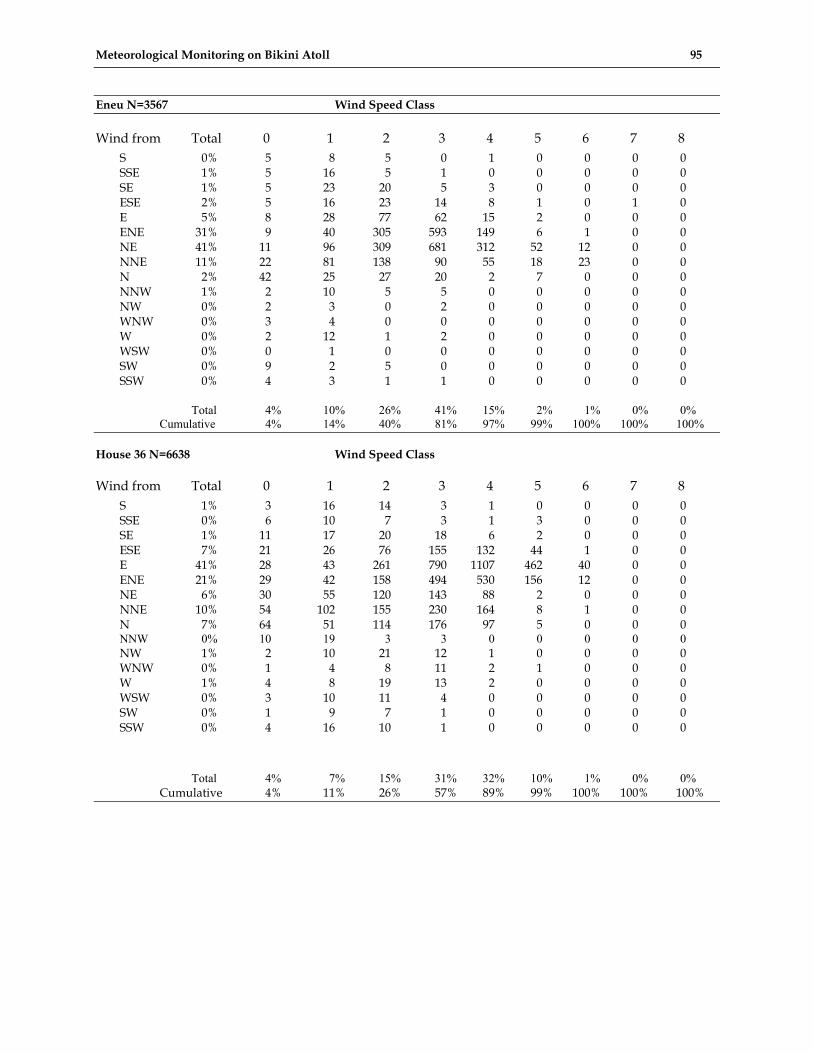
in Appendix D. The typical pattern reflects the density of the trees and the proximity of trees to the station. The lowest wind speed is typically from the Control Plot’s station, the highest from House 36. For instance, 26% of the Control Plot winds are class 2 and less (WS<3 ms-1), Eneu is 40%, and House 36 is 70%. The cumulative frequencies of wind speed are also at the bottom of the three tables in Appendix G.
Monthly Average Wind Speed Using all available data, the average wind speed
was computed for every month from May 2000 to April 2001. The time series of the monthly averages (Figure 8) reflects the differences in exposure among the 3 sites. The Control Plot speeds are, on average, 1 ms-1 less than the House 36 and Eneu speeds.
Monthly Average Air Temperature The monthly average air temperatures (Figure 9)
show a slight, but definite, seasonal variation. The averages were computed from all available
Figure 7. Histogram of cumulative frequency of wind speed class using all available data from May 2000 through April 2001. The classes are determined by removing the fractional portion of the wind speed (i.e., WS=1.5, Class=1).
Figure 8. The monthly average wind speed from three Bikini Atoll stations.
0%
10%
20%
30%
40%
50%
60%
70%
80%
90%
100%
0 1 2 3 4 5 6 7 8 9 10
Wind Speed Class (m/s)
Cum
ulat
ive
Freq
uenc
y
Control Plot N=8439Eneu N=3567House 36 N=6638
14 Gouveia et al.
Figure 9. The monthly average air temperature from three Bikini Atoll stations, and the monthly maximum and minimum temperature from the Control Plot station. hourly data. Again, the most complete data set comes from the Control Plot station so it should be viewed as the most reliable representation of air temperature. Some of the variation in the temperature from the other stations comes from the small differences in ventilation, instrument error, or incompleteness in the data set. For example, the Eneu station data set for the months of September, October, and November, in particular, have a large number of missing values.
The range of temperatures also shows a slight but detectable seasonal pattern. The difference between highest and lowest temperatures was 12°C in late summer and less than 8°C in the winter. This small amplitude cycle may be caused by the seasonal change in rainfall, cloud cover, or wind speed.
The slight decrease in speed during the summer may cause less vertical mixing, an increase in temperature at the inside the solar shield, and larger diurnal change of temperature.
Annual Windrose A complete set of wind rose tables and diagrams
appear in Appendix G. The roses show differences between the Control Plot and House 36 wind directions that were caused by instrument error in the House 36 wind direction sensor, and possibly slight misalignment at one or both sites. The Eneu windroses feature winds that are rotated towards north compared with Bikini Island stations.
This document describes in general terms the monitoring systems that collect meteorological data on Bikini Atoll. Included is a complete set of monthly time series of selected hourly data from the three current stations. Tables of daily rainfall from 14 May
2000 to present are included as well as historical totals of monthly rainfall.
This document is the first of a series of annual reports of the Marshall Islands meteorological systems. Future reports will describe significant changes in instrumentation and procedures.
Acknowledgment
The continuing scientific program on Bikini Atoll is made possible through the efforts of Lance Yamaguchi and his staff from Bechtel Nevada who provide all the logistics support for the program. We would especially like to thank Kenny Selk, Richard Giles, Wayne Olival, Jaspar
Riklon, and Mat Aiseia for helping construct and maintain the meteorological stations. This work was performed under the auspices of the U. S. Department of Energy by the University of California, Lawrence Livermore National Laboratory under Contract No. W-7405-Eng-48.
References
EPA (1990), Quality Assurance Handbook for Air Pollution Measurement Systems, Volume IV—Meteorological Measurements, EPA-600/4-90/003, U.S. Environmental Protection Agency, Office of Research and Development, Research Triangle Park, NC.
Appendix A
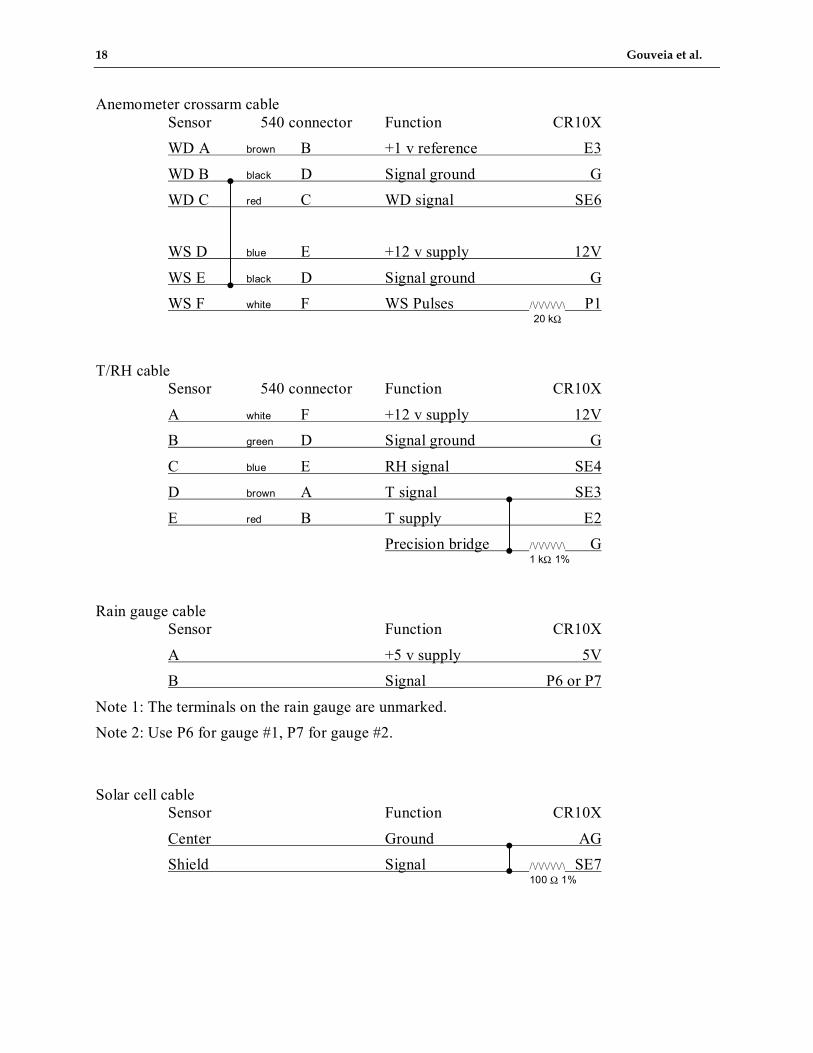
Wiring Diagrams
18 Gouveia et al.
Anemometer crossarm cableSensor 540 connector Function CR10X
WD A brown B +1 v reference E3
WD B black D Signal ground G
WD C red C WD signal SE6
WS D blue E +12 v supply 12V
WS E black D Signal ground GWS F white F WS Pulses /\/\/\/\/\/\ P1
20 kΩ
T/RH cableSensor 540 connector Function CR10X
A white F +12 v supply 12VB green D Signal ground G
C blue E RH signal SE4
D brown A T signal SE3
E red B T supply E2
Precision bridge /\/\/\/\/\/\ G1 kΩ 1%
Rain gauge cableSensor Function CR10X
A +5 v supply 5V
B Signal P6 or P7
Note 1: The terminals on the rain gauge are unmarked.Note 2: Use P6 for gauge #1, P7 for gauge #2.
Solar cell cableSensor Function CR10X
Center Ground AGShield Signal /\/\/\/\/\/\ SE7
100 Ω 1%
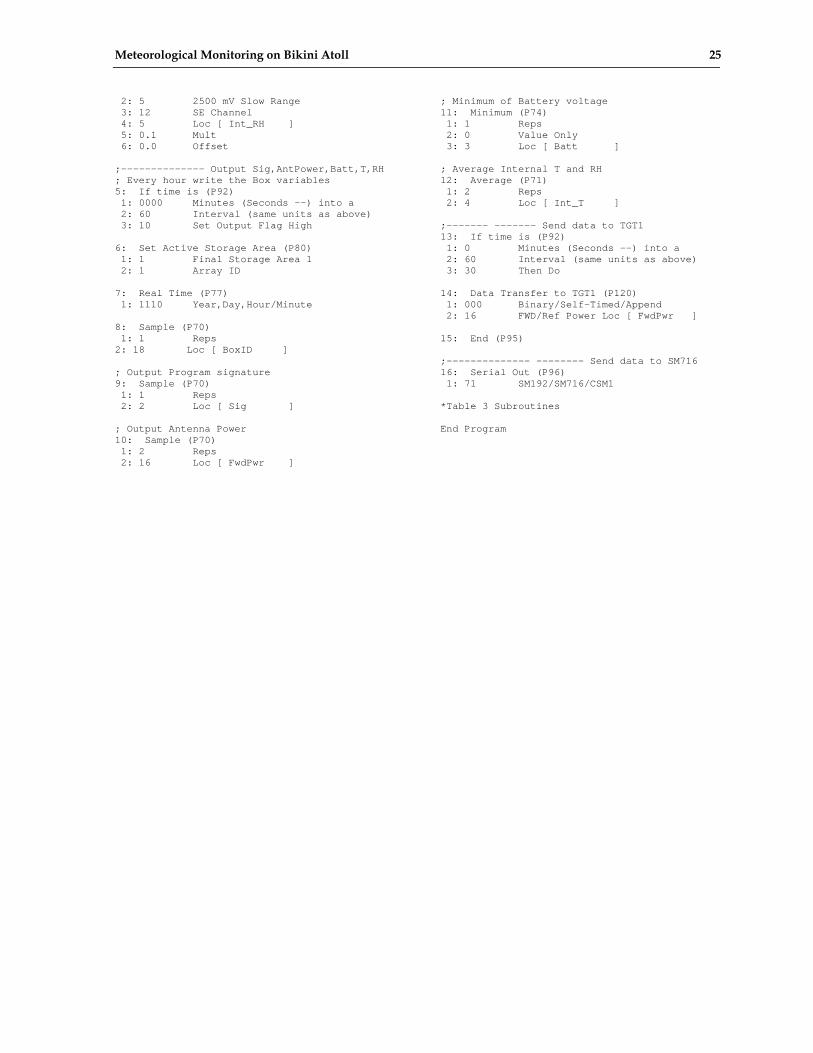
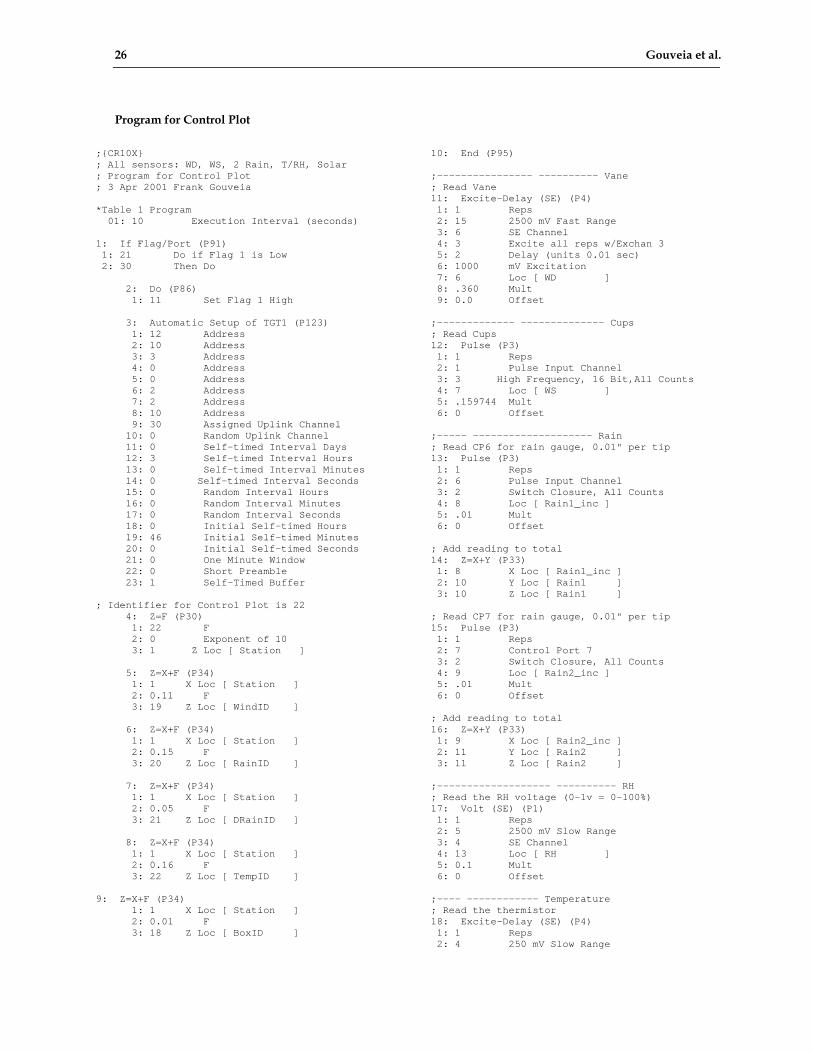
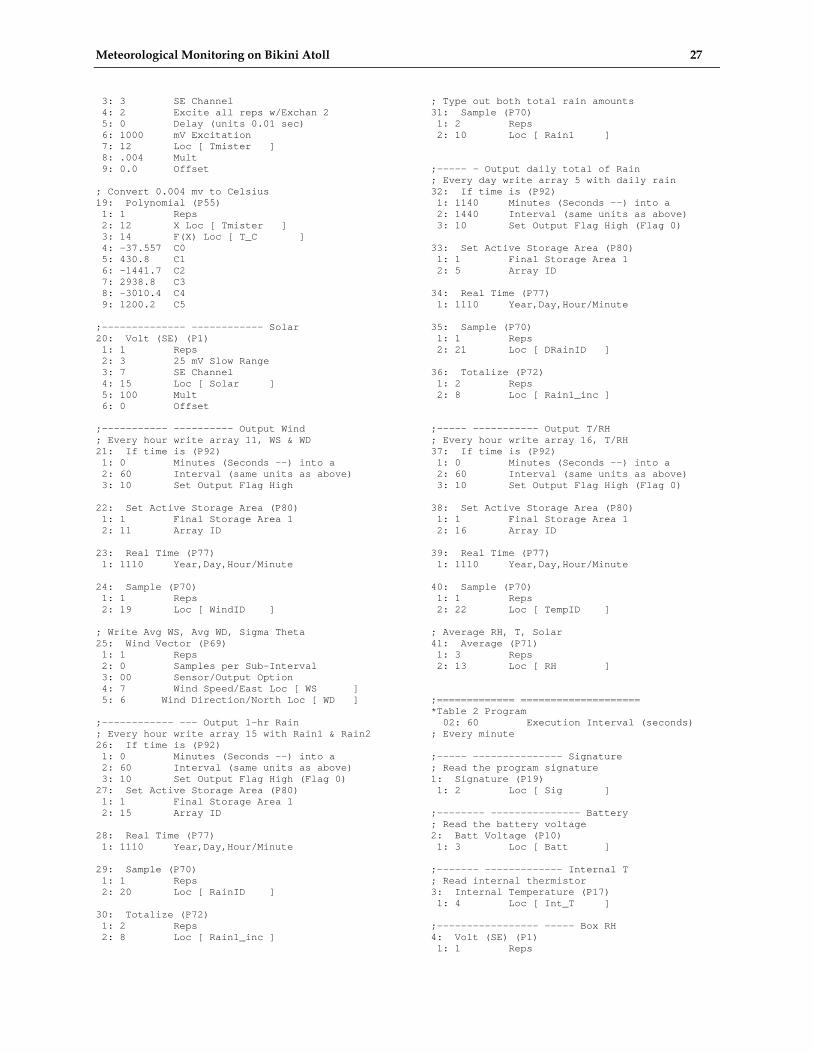
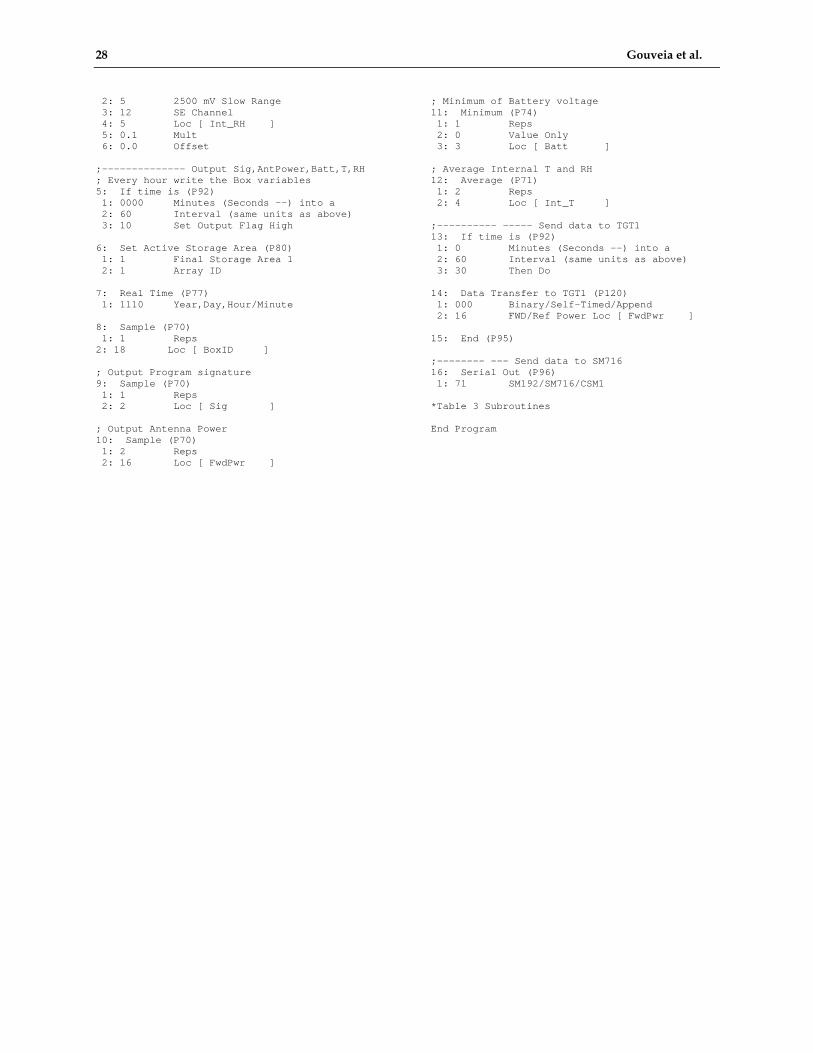
Appendix B
Logger Programs
Eneu B-2
House 36 B-5
Control Plot B-8
20 Gouveia et al.
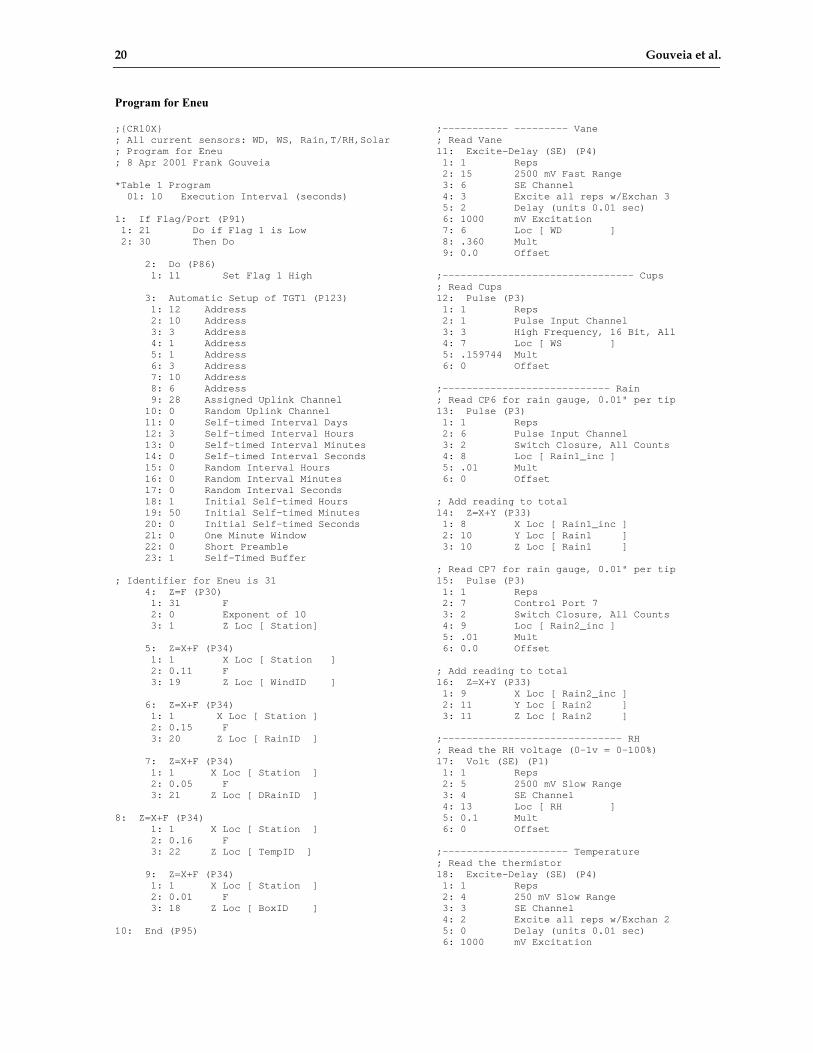
Program for Eneu
;CR10X; All current sensors: WD, WS, Rain,T/RH,Solar; Program for Eneu; 8 Apr 2001 Frank Gouveia*Table 1 Program 01: 10 Execution Interval (seconds)1: If Flag/Port (P91) 1: 21 Do if Flag 1 is Low 2: 30 Then Do 2: Do (P86) 1: 11 Set Flag 1 High 3: Automatic Setup of TGT1 (P123) 1: 12 Address 2: 10 Address 3: 3 Address 4: 1 Address 5: 1 Address 6: 3 Address 7: 10 Address 8: 6 Address 9: 28 Assigned Uplink Channel 10: 0 Random Uplink Channel 11: 0 Self-timed Interval Days 12: 3 Self-timed Interval Hours 13: 0 Self-timed Interval Minutes 14: 0 Self-timed Interval Seconds 15: 0 Random Interval Hours 16: 0 Random Interval Minutes 17: 0 Random Interval Seconds 18: 1 Initial Self-timed Hours 19: 50 Initial Self-timed Minutes 20: 0 Initial Self-timed Seconds 21: 0 One Minute Window 22: 0 Short Preamble 23: 1 Self-Timed Buffer; Identifier for Eneu is 31 4: Z=F (P30) 1: 31 F 2: 0 Exponent of 10 3: 1 Z Loc [ Station] 5: Z=X+F (P34) 1: 1 X Loc [ Station ] 2: 0.11 F 3: 19 Z Loc [ WindID ] 6: Z=X+F (P34) 1: 1 X Loc [ Station ] 2: 0.15 F 3: 20 Z Loc [ RainID ] 7: Z=X+F (P34) 1: 1 X Loc [ Station ] 2: 0.05 F 3: 21 Z Loc [ DRainID ]8: Z=X+F (P34) 1: 1 X Loc [ Station ] 2: 0.16 F 3: 22 Z Loc [ TempID ] 9: Z=X+F (P34) 1: 1 X Loc [ Station ] 2: 0.01 F 3: 18 Z Loc [ BoxID ]10: End (P95)
;----------- --------- Vane; Read Vane11: Excite-Delay (SE) (P4) 1: 1 Reps 2: 15 2500 mV Fast Range 3: 6 SE Channel 4: 3 Excite all reps w/Exchan 3 5: 2 Delay (units 0.01 sec) 6: 1000 mV Excitation 7: 6 Loc [ WD ] 8: .360 Mult 9: 0.0 Offset;-------------------------------- Cups; Read Cups12: Pulse (P3) 1: 1 Reps 2: 1 Pulse Input Channel 3: 3 High Frequency, 16 Bit, All 4: 7 Loc [ WS ] 5: .159744 Mult 6: 0 Offset;---------------------------- Rain; Read CP6 for rain gauge, 0.01" per tip13: Pulse (P3) 1: 1 Reps 2: 6 Pulse Input Channel 3: 2 Switch Closure, All Counts 4: 8 Loc [ Rain1_inc ] 5: .01 Mult 6: 0 Offset; Add reading to total14: Z=X+Y (P33) 1: 8 X Loc [ Rain1_inc ] 2: 10 Y Loc [ Rain1 ] 3: 10 Z Loc [ Rain1 ]; Read CP7 for rain gauge, 0.01" per tip15: Pulse (P3) 1: 1 Reps 2: 7 Control Port 7 3: 2 Switch Closure, All Counts 4: 9 Loc [ Rain2_inc ] 5: .01 Mult 6: 0.0 Offset; Add reading to total16: Z=X+Y (P33) 1: 9 X Loc [ Rain2_inc ] 2: 11 Y Loc [ Rain2 ] 3: 11 Z Loc [ Rain2 ];------------------------------ RH; Read the RH voltage (0-1v = 0-100%)17: Volt (SE) (P1) 1: 1 Reps 2: 5 2500 mV Slow Range 3: 4 SE Channel 4: 13 Loc [ RH ] 5: 0.1 Mult 6: 0 Offset;--------------------- Temperature; Read the thermistor18: Excite-Delay (SE) (P4) 1: 1 Reps 2: 4 250 mV Slow Range 3: 3 SE Channel 4: 2 Excite all reps w/Exchan 2 5: 0 Delay (units 0.01 sec) 6: 1000 mV Excitation
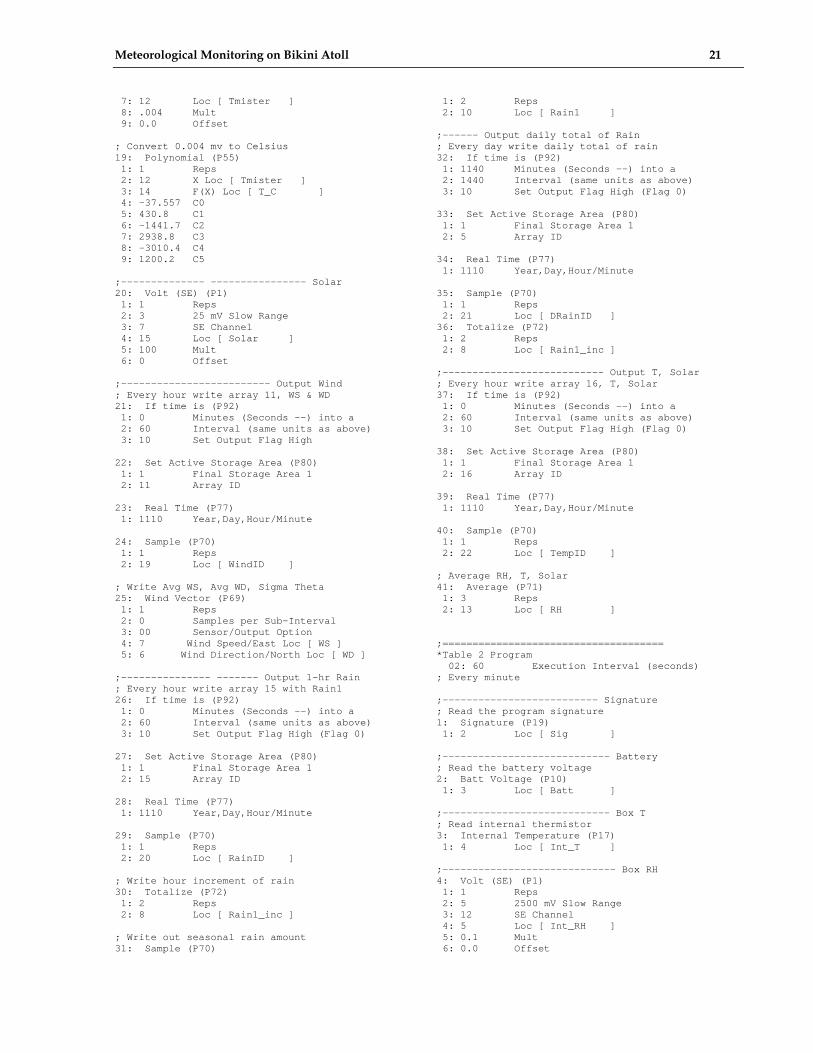
Meteorological Monitoring on Bikini Atoll 21
7: 12 Loc [ Tmister ] 8: .004 Mult 9: 0.0 Offset; Convert 0.004 mv to Celsius19: Polynomial (P55) 1: 1 Reps 2: 12 X Loc [ Tmister ] 3: 14 F(X) Loc [ T_C ] 4: -37.557 C0 5: 430.8 C1 6: -1441.7 C2 7: 2938.8 C3 8: -3010.4 C4 9: 1200.2 C5;-------------- ---------------- Solar20: Volt (SE) (P1) 1: 1 Reps 2: 3 25 mV Slow Range 3: 7 SE Channel 4: 15 Loc [ Solar ] 5: 100 Mult 6: 0 Offset;------------------------- Output Wind; Every hour write array 11, WS & WD21: If time is (P92) 1: 0 Minutes (Seconds --) into a 2: 60 Interval (same units as above) 3: 10 Set Output Flag High22: Set Active Storage Area (P80) 1: 1 Final Storage Area 1 2: 11 Array ID23: Real Time (P77) 1: 1110 Year,Day,Hour/Minute24: Sample (P70) 1: 1 Reps 2: 19 Loc [ WindID ]; Write Avg WS, Avg WD, Sigma Theta25: Wind Vector (P69) 1: 1 Reps 2: 0 Samples per Sub-Interval 3: 00 Sensor/Output Option 4: 7 Wind Speed/East Loc [ WS ] 5: 6 Wind Direction/North Loc [ WD ];--------------- ------- Output 1-hr Rain; Every hour write array 15 with Rain126: If time is (P92) 1: 0 Minutes (Seconds --) into a 2: 60 Interval (same units as above) 3: 10 Set Output Flag High (Flag 0)27: Set Active Storage Area (P80) 1: 1 Final Storage Area 1 2: 15 Array ID28: Real Time (P77) 1: 1110 Year,Day,Hour/Minute29: Sample (P70) 1: 1 Reps 2: 20 Loc [ RainID ]; Write hour increment of rain30: Totalize (P72) 1: 2 Reps 2: 8 Loc [ Rain1_inc ]; Write out seasonal rain amount31: Sample (P70)
1: 2 Reps 2: 10 Loc [ Rain1 ];------ Output daily total of Rain; Every day write daily total of rain32: If time is (P92) 1: 1140 Minutes (Seconds --) into a 2: 1440 Interval (same units as above) 3: 10 Set Output Flag High (Flag 0)33: Set Active Storage Area (P80) 1: 1 Final Storage Area 1 2: 5 Array ID34: Real Time (P77) 1: 1110 Year,Day,Hour/Minute35: Sample (P70) 1: 1 Reps 2: 21 Loc [ DRainID ]36: Totalize (P72) 1: 2 Reps 2: 8 Loc [ Rain1_inc ];--------------------------- Output T, Solar; Every hour write array 16, T, Solar37: If time is (P92) 1: 0 Minutes (Seconds --) into a 2: 60 Interval (same units as above) 3: 10 Set Output Flag High (Flag 0)38: Set Active Storage Area (P80) 1: 1 Final Storage Area 1 2: 16 Array ID39: Real Time (P77) 1: 1110 Year,Day,Hour/Minute40: Sample (P70) 1: 1 Reps 2: 22 Loc [ TempID ]; Average RH, T, Solar41: Average (P71) 1: 3 Reps 2: 13 Loc [ RH ];=====================================*Table 2 Program 02: 60 Execution Interval (seconds); Every minute;-------------------------- Signature; Read the program signature1: Signature (P19) 1: 2 Loc [ Sig ];---------------------------- Battery; Read the battery voltage2: Batt Voltage (P10) 1: 3 Loc [ Batt ];---------------------------- Box T; Read internal thermistor3: Internal Temperature (P17) 1: 4 Loc [ Int_T ];----------------------------- Box RH4: Volt (SE) (P1) 1: 1 Reps 2: 5 2500 mV Slow Range 3: 12 SE Channel 4: 5 Loc [ Int_RH ] 5: 0.1 Mult 6: 0.0 Offset
22 Gouveia et al.
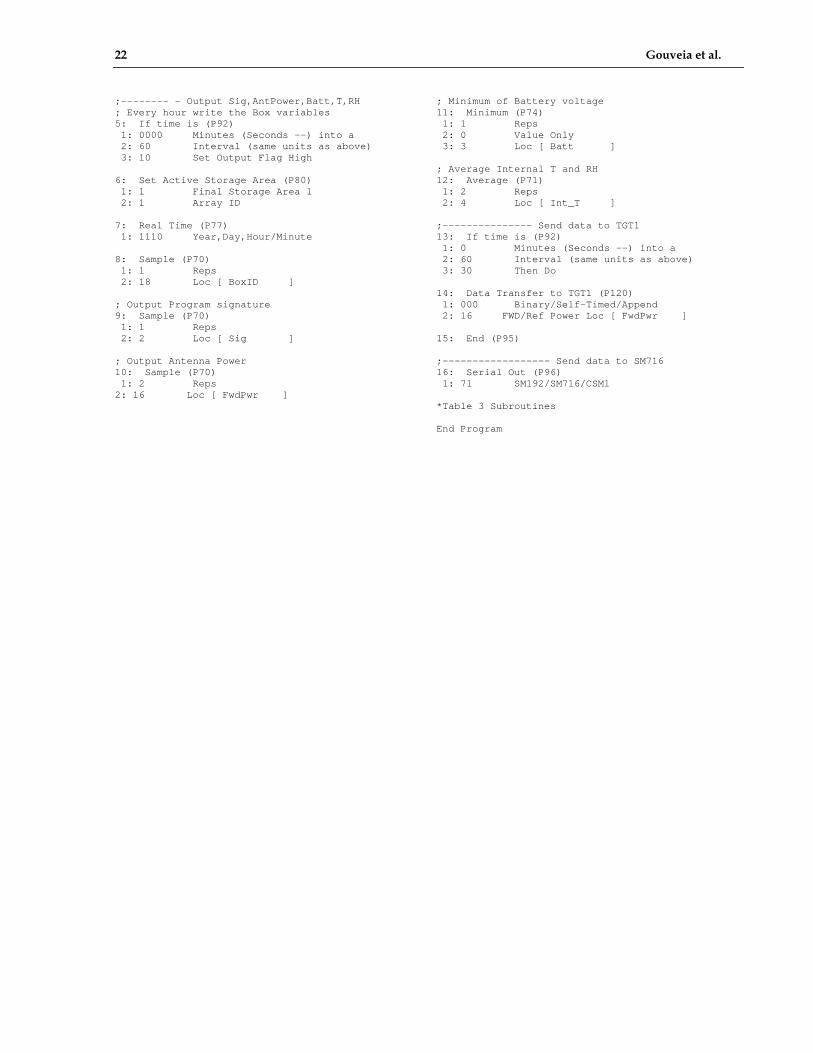
;-------- - Output Sig,AntPower,Batt,T,RH; Every hour write the Box variables5: If time is (P92) 1: 0000 Minutes (Seconds --) into a 2: 60 Interval (same units as above) 3: 10 Set Output Flag High6: Set Active Storage Area (P80) 1: 1 Final Storage Area 1 2: 1 Array ID7: Real Time (P77) 1: 1110 Year,Day,Hour/Minute8: Sample (P70) 1: 1 Reps 2: 18 Loc [ BoxID ]; Output Program signature9: Sample (P70) 1: 1 Reps 2: 2 Loc [ Sig ]; Output Antenna Power10: Sample (P70) 1: 2 Reps2: 16 Loc [ FwdPwr ]
; Minimum of Battery voltage11: Minimum (P74) 1: 1 Reps 2: 0 Value Only 3: 3 Loc [ Batt ]; Average Internal T and RH12: Average (P71) 1: 2 Reps 2: 4 Loc [ Int_T ];--------------- Send data to TGT113: If time is (P92) 1: 0 Minutes (Seconds --) into a 2: 60 Interval (same units as above) 3: 30 Then Do14: Data Transfer to TGT1 (P120) 1: 000 Binary/Self-Timed/Append 2: 16 FWD/Ref Power Loc [ FwdPwr ]15: End (P95);------------------ Send data to SM71616: Serial Out (P96) 1: 71 SM192/SM716/CSM1*Table 3 SubroutinesEnd Program
Meteorological Monitoring on Bikini Atoll 23
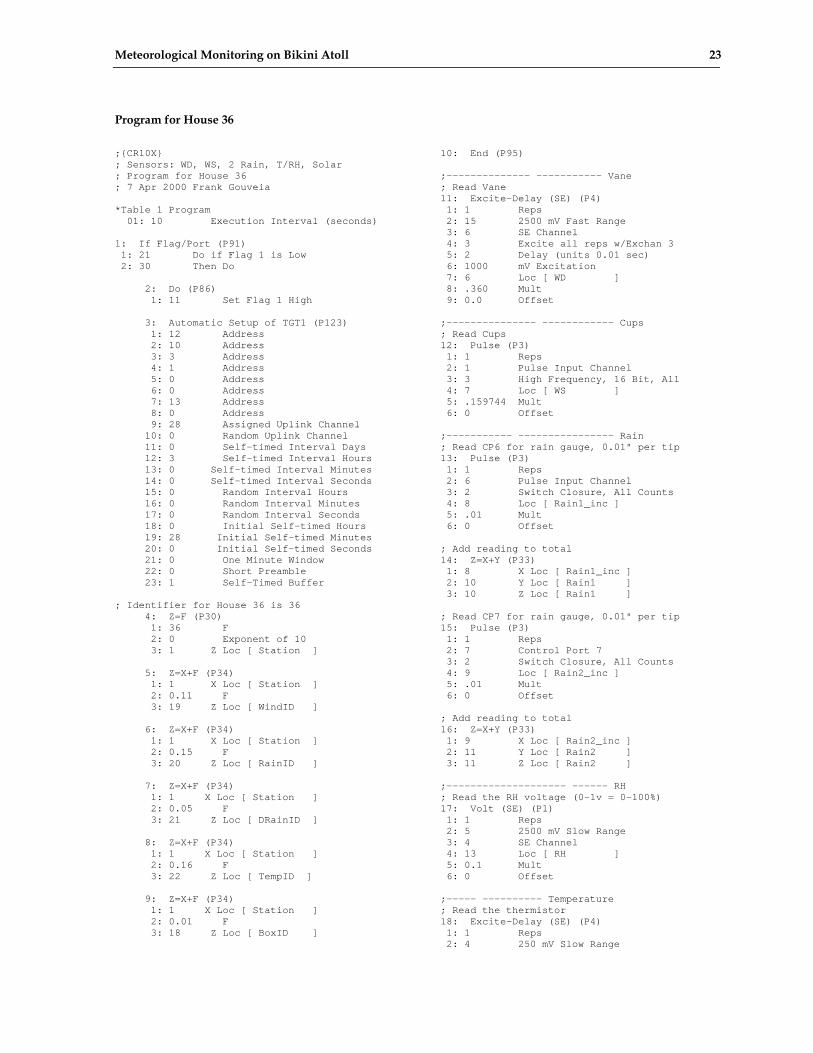
Program for House 36
;CR10X; Sensors: WD, WS, 2 Rain, T/RH, Solar; Program for House 36; 7 Apr 2000 Frank Gouveia*Table 1 Program 01: 10 Execution Interval (seconds)1: If Flag/Port (P91) 1: 21 Do if Flag 1 is Low 2: 30 Then Do 2: Do (P86) 1: 11 Set Flag 1 High 3: Automatic Setup of TGT1 (P123) 1: 12 Address 2: 10 Address 3: 3 Address 4: 1 Address 5: 0 Address 6: 0 Address 7: 13 Address 8: 0 Address 9: 28 Assigned Uplink Channel 10: 0 Random Uplink Channel 11: 0 Self-timed Interval Days 12: 3 Self-timed Interval Hours 13: 0 Self-timed Interval Minutes 14: 0 Self-timed Interval Seconds 15: 0 Random Interval Hours 16: 0 Random Interval Minutes 17: 0 Random Interval Seconds 18: 0 Initial Self-timed Hours 19: 28 Initial Self-timed Minutes 20: 0 Initial Self-timed Seconds 21: 0 One Minute Window 22: 0 Short Preamble 23: 1 Self-Timed Buffer; Identifier for House 36 is 36 4: Z=F (P30) 1: 36 F 2: 0 Exponent of 10 3: 1 Z Loc [ Station ] 5: Z=X+F (P34) 1: 1 X Loc [ Station ] 2: 0.11 F 3: 19 Z Loc [ WindID ] 6: Z=X+F (P34) 1: 1 X Loc [ Station ] 2: 0.15 F 3: 20 Z Loc [ RainID ] 7: Z=X+F (P34) 1: 1 X Loc [ Station ] 2: 0.05 F 3: 21 Z Loc [ DRainID ] 8: Z=X+F (P34) 1: 1 X Loc [ Station ] 2: 0.16 F 3: 22 Z Loc [ TempID ] 9: Z=X+F (P34) 1: 1 X Loc [ Station ] 2: 0.01 F 3: 18 Z Loc [ BoxID ]
10: End (P95);-------------- ----------- Vane; Read Vane11: Excite-Delay (SE) (P4) 1: 1 Reps 2: 15 2500 mV Fast Range 3: 6 SE Channel 4: 3 Excite all reps w/Exchan 3 5: 2 Delay (units 0.01 sec) 6: 1000 mV Excitation 7: 6 Loc [ WD ] 8: .360 Mult 9: 0.0 Offset;--------------- ------------ Cups; Read Cups12: Pulse (P3) 1: 1 Reps 2: 1 Pulse Input Channel 3: 3 High Frequency, 16 Bit, All 4: 7 Loc [ WS ] 5: .159744 Mult 6: 0 Offset;----------- ---------------- Rain; Read CP6 for rain gauge, 0.01" per tip13: Pulse (P3) 1: 1 Reps 2: 6 Pulse Input Channel 3: 2 Switch Closure, All Counts 4: 8 Loc [ Rain1_inc ] 5: .01 Mult 6: 0 Offset; Add reading to total14: Z=X+Y (P33) 1: 8 X Loc [ Rain1_inc ] 2: 10 Y Loc [ Rain1 ] 3: 10 Z Loc [ Rain1 ]; Read CP7 for rain gauge, 0.01" per tip15: Pulse (P3) 1: 1 Reps 2: 7 Control Port 7 3: 2 Switch Closure, All Counts 4: 9 Loc [ Rain2_inc ] 5: .01 Mult 6: 0 Offset; Add reading to total16: Z=X+Y (P33) 1: 9 X Loc [ Rain2_inc ] 2: 11 Y Loc [ Rain2 ] 3: 11 Z Loc [ Rain2 ];-------------------- ------ RH; Read the RH voltage (0-1v = 0-100%)17: Volt (SE) (P1) 1: 1 Reps 2: 5 2500 mV Slow Range 3: 4 SE Channel 4: 13 Loc [ RH ] 5: 0.1 Mult 6: 0 Offset;----- ---------- Temperature; Read the thermistor18: Excite-Delay (SE) (P4) 1: 1 Reps 2: 4 250 mV Slow Range
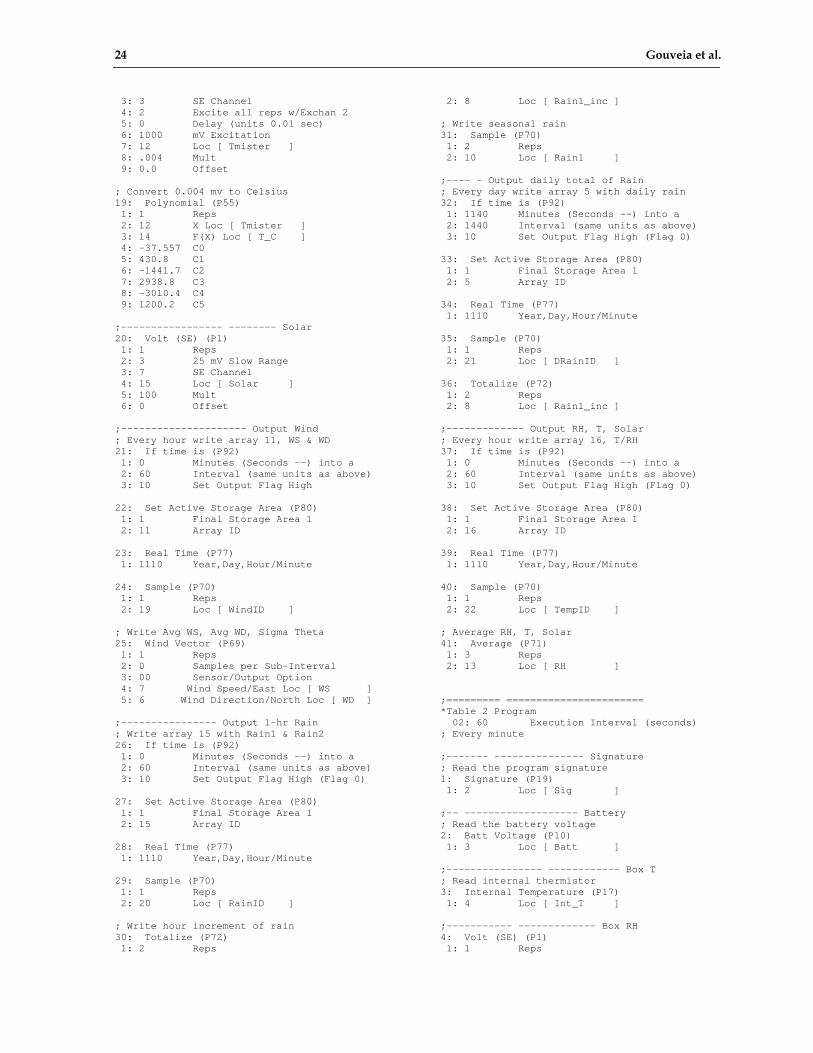
24 Gouveia et al.
3: 3 SE Channel 4: 2 Excite all reps w/Exchan 2 5: 0 Delay (units 0.01 sec) 6: 1000 mV Excitation 7: 12 Loc [ Tmister ] 8: .004 Mult 9: 0.0 Offset; Convert 0.004 mv to Celsius19: Polynomial (P55) 1: 1 Reps 2: 12 X Loc [ Tmister ] 3: 14 F(X) Loc [ T_C ] 4: -37.557 C0 5: 430.8 C1 6: -1441.7 C2 7: 2938.8 C3 8: -3010.4 C4 9: 1200.2 C5;----------------- -------- Solar20: Volt (SE) (P1) 1: 1 Reps 2: 3 25 mV Slow Range 3: 7 SE Channel 4: 15 Loc [ Solar ] 5: 100 Mult 6: 0 Offset;--------------------- Output Wind; Every hour write array 11, WS & WD21: If time is (P92) 1: 0 Minutes (Seconds --) into a 2: 60 Interval (same units as above) 3: 10 Set Output Flag High22: Set Active Storage Area (P80) 1: 1 Final Storage Area 1 2: 11 Array ID23: Real Time (P77) 1: 1110 Year,Day,Hour/Minute24: Sample (P70) 1: 1 Reps 2: 19 Loc [ WindID ]; Write Avg WS, Avg WD, Sigma Theta25: Wind Vector (P69) 1: 1 Reps 2: 0 Samples per Sub-Interval 3: 00 Sensor/Output Option 4: 7 Wind Speed/East Loc [ WS ] 5: 6 Wind Direction/North Loc [ WD ];---------------- Output 1-hr Rain; Write array 15 with Rain1 & Rain226: If time is (P92) 1: 0 Minutes (Seconds --) into a 2: 60 Interval (same units as above) 3: 10 Set Output Flag High (Flag 0)27: Set Active Storage Area (P80) 1: 1 Final Storage Area 1 2: 15 Array ID28: Real Time (P77) 1: 1110 Year,Day,Hour/Minute29: Sample (P70) 1: 1 Reps 2: 20 Loc [ RainID ]; Write hour increment of rain30: Totalize (P72) 1: 2 Reps
2: 8 Loc [ Rain1_inc ]; Write seasonal rain31: Sample (P70) 1: 2 Reps 2: 10 Loc [ Rain1 ];---- - Output daily total of Rain; Every day write array 5 with daily rain32: If time is (P92) 1: 1140 Minutes (Seconds --) into a 2: 1440 Interval (same units as above) 3: 10 Set Output Flag High (Flag 0)33: Set Active Storage Area (P80) 1: 1 Final Storage Area 1 2: 5 Array ID34: Real Time (P77) 1: 1110 Year,Day,Hour/Minute35: Sample (P70) 1: 1 Reps 2: 21 Loc [ DRainID ]36: Totalize (P72) 1: 2 Reps 2: 8 Loc [ Rain1_inc ];------------- Output RH, T, Solar; Every hour write array 16, T/RH37: If time is (P92) 1: 0 Minutes (Seconds --) into a 2: 60 Interval (same units as above) 3: 10 Set Output Flag High (Flag 0)38: Set Active Storage Area (P80) 1: 1 Final Storage Area 1 2: 16 Array ID39: Real Time (P77) 1: 1110 Year,Day,Hour/Minute40: Sample (P70) 1: 1 Reps 2: 22 Loc [ TempID ]; Average RH, T, Solar41: Average (P71) 1: 3 Reps 2: 13 Loc [ RH ];========= =======================*Table 2 Program 02: 60 Execution Interval (seconds); Every minute;------- --------------- Signature; Read the program signature1: Signature (P19) 1: 2 Loc [ Sig ];-- ------------------- Battery; Read the battery voltage2: Batt Voltage (P10) 1: 3 Loc [ Batt ];---------------- ------------ Box T; Read internal thermistor3: Internal Temperature (P17) 1: 4 Loc [ Int_T ];----------- ------------- Box RH4: Volt (SE) (P1) 1: 1 Reps
Meteorological Monitoring on Bikini Atoll 25
2: 5 2500 mV Slow Range 3: 12 SE Channel 4: 5 Loc [ Int_RH ] 5: 0.1 Mult 6: 0.0 Offset;-------------- Output Sig,AntPower,Batt,T,RH; Every hour write the Box variables5: If time is (P92) 1: 0000 Minutes (Seconds --) into a 2: 60 Interval (same units as above) 3: 10 Set Output Flag High6: Set Active Storage Area (P80) 1: 1 Final Storage Area 1 2: 1 Array ID7: Real Time (P77) 1: 1110 Year,Day,Hour/Minute8: Sample (P70) 1: 1 Reps2: 18 Loc [ BoxID ]; Output Program signature9: Sample (P70) 1: 1 Reps 2: 2 Loc [ Sig ]; Output Antenna Power10: Sample (P70) 1: 2 Reps 2: 16 Loc [ FwdPwr ]
; Minimum of Battery voltage11: Minimum (P74) 1: 1 Reps 2: 0 Value Only 3: 3 Loc [ Batt ]; Average Internal T and RH12: Average (P71) 1: 2 Reps 2: 4 Loc [ Int_T ];------- ------- Send data to TGT113: If time is (P92) 1: 0 Minutes (Seconds --) into a 2: 60 Interval (same units as above) 3: 30 Then Do14: Data Transfer to TGT1 (P120) 1: 000 Binary/Self-Timed/Append 2: 16 FWD/Ref Power Loc [ FwdPwr ]15: End (P95);-------------- -------- Send data to SM71616: Serial Out (P96) 1: 71 SM192/SM716/CSM1*Table 3 SubroutinesEnd Program
26 Gouveia et al.
Program for Control Plot
;CR10X; All sensors: WD, WS, 2 Rain, T/RH, Solar; Program for Control Plot; 3 Apr 2001 Frank Gouveia*Table 1 Program 01: 10 Execution Interval (seconds)1: If Flag/Port (P91) 1: 21 Do if Flag 1 is Low 2: 30 Then Do 2: Do (P86) 1: 11 Set Flag 1 High 3: Automatic Setup of TGT1 (P123) 1: 12 Address 2: 10 Address 3: 3 Address 4: 0 Address 5: 0 Address 6: 2 Address 7: 2 Address 8: 10 Address 9: 30 Assigned Uplink Channel 10: 0 Random Uplink Channel 11: 0 Self-timed Interval Days 12: 3 Self-timed Interval Hours 13: 0 Self-timed Interval Minutes 14: 0 Self-timed Interval Seconds 15: 0 Random Interval Hours 16: 0 Random Interval Minutes 17: 0 Random Interval Seconds 18: 0 Initial Self-timed Hours 19: 46 Initial Self-timed Minutes 20: 0 Initial Self-timed Seconds 21: 0 One Minute Window 22: 0 Short Preamble 23: 1 Self-Timed Buffer; Identifier for Control Plot is 22 4: Z=F (P30) 1: 22 F 2: 0 Exponent of 10 3: 1 Z Loc [ Station ] 5: Z=X+F (P34) 1: 1 X Loc [ Station ] 2: 0.11 F 3: 19 Z Loc [ WindID ] 6: Z=X+F (P34) 1: 1 X Loc [ Station ] 2: 0.15 F 3: 20 Z Loc [ RainID ] 7: Z=X+F (P34) 1: 1 X Loc [ Station ] 2: 0.05 F 3: 21 Z Loc [ DRainID ] 8: Z=X+F (P34) 1: 1 X Loc [ Station ] 2: 0.16 F 3: 22 Z Loc [ TempID ]9: Z=X+F (P34) 1: 1 X Loc [ Station ] 2: 0.01 F 3: 18 Z Loc [ BoxID ]
10: End (P95);---------------- ---------- Vane; Read Vane11: Excite-Delay (SE) (P4) 1: 1 Reps 2: 15 2500 mV Fast Range 3: 6 SE Channel 4: 3 Excite all reps w/Exchan 3 5: 2 Delay (units 0.01 sec) 6: 1000 mV Excitation 7: 6 Loc [ WD ] 8: .360 Mult 9: 0.0 Offset;------------- -------------- Cups; Read Cups12: Pulse (P3) 1: 1 Reps 2: 1 Pulse Input Channel 3: 3 High Frequency, 16 Bit,All Counts 4: 7 Loc [ WS ] 5: .159744 Mult 6: 0 Offset;----- -------------------- Rain; Read CP6 for rain gauge, 0.01" per tip13: Pulse (P3) 1: 1 Reps 2: 6 Pulse Input Channel 3: 2 Switch Closure, All Counts 4: 8 Loc [ Rain1_inc ] 5: .01 Mult 6: 0 Offset; Add reading to total14: Z=X+Y (P33) 1: 8 X Loc [ Rain1_inc ] 2: 10 Y Loc [ Rain1 ] 3: 10 Z Loc [ Rain1 ]; Read CP7 for rain gauge, 0.01" per tip15: Pulse (P3) 1: 1 Reps 2: 7 Control Port 7 3: 2 Switch Closure, All Counts 4: 9 Loc [ Rain2_inc ] 5: .01 Mult 6: 0 Offset; Add reading to total16: Z=X+Y (P33) 1: 9 X Loc [ Rain2_inc ] 2: 11 Y Loc [ Rain2 ] 3: 11 Z Loc [ Rain2 ];------------------- ---------- RH; Read the RH voltage (0-1v = 0-100%)17: Volt (SE) (P1) 1: 1 Reps 2: 5 2500 mV Slow Range 3: 4 SE Channel 4: 13 Loc [ RH ] 5: 0.1 Mult 6: 0 Offset;---- ------------ Temperature; Read the thermistor18: Excite-Delay (SE) (P4) 1: 1 Reps 2: 4 250 mV Slow Range
Meteorological Monitoring on Bikini Atoll 27
3: 3 SE Channel 4: 2 Excite all reps w/Exchan 2 5: 0 Delay (units 0.01 sec) 6: 1000 mV Excitation 7: 12 Loc [ Tmister ] 8: .004 Mult 9: 0.0 Offset; Convert 0.004 mv to Celsius19: Polynomial (P55) 1: 1 Reps 2: 12 X Loc [ Tmister ] 3: 14 F(X) Loc [ T_C ] 4: -37.557 C0 5: 430.8 C1 6: -1441.7 C2 7: 2938.8 C3 8: -3010.4 C4 9: 1200.2 C5;-------------- ------------ Solar20: Volt (SE) (P1) 1: 1 Reps 2: 3 25 mV Slow Range 3: 7 SE Channel 4: 15 Loc [ Solar ] 5: 100 Mult 6: 0 Offset;----------- ---------- Output Wind; Every hour write array 11, WS & WD21: If time is (P92) 1: 0 Minutes (Seconds --) into a 2: 60 Interval (same units as above) 3: 10 Set Output Flag High22: Set Active Storage Area (P80) 1: 1 Final Storage Area 1 2: 11 Array ID23: Real Time (P77) 1: 1110 Year,Day,Hour/Minute24: Sample (P70) 1: 1 Reps 2: 19 Loc [ WindID ]; Write Avg WS, Avg WD, Sigma Theta25: Wind Vector (P69) 1: 1 Reps 2: 0 Samples per Sub-Interval 3: 00 Sensor/Output Option 4: 7 Wind Speed/East Loc [ WS ] 5: 6 Wind Direction/North Loc [ WD ];------------ --- Output 1-hr Rain; Every hour write array 15 with Rain1 & Rain226: If time is (P92) 1: 0 Minutes (Seconds --) into a 2: 60 Interval (same units as above) 3: 10 Set Output Flag High (Flag 0)27: Set Active Storage Area (P80) 1: 1 Final Storage Area 1 2: 15 Array ID28: Real Time (P77) 1: 1110 Year,Day,Hour/Minute29: Sample (P70) 1: 1 Reps 2: 20 Loc [ RainID ]30: Totalize (P72) 1: 2 Reps 2: 8 Loc [ Rain1_inc ]
; Type out both total rain amounts31: Sample (P70) 1: 2 Reps 2: 10 Loc [ Rain1 ];----- - Output daily total of Rain; Every day write array 5 with daily rain32: If time is (P92) 1: 1140 Minutes (Seconds --) into a 2: 1440 Interval (same units as above) 3: 10 Set Output Flag High (Flag 0)33: Set Active Storage Area (P80) 1: 1 Final Storage Area 1 2: 5 Array ID34: Real Time (P77) 1: 1110 Year,Day,Hour/Minute35: Sample (P70) 1: 1 Reps 2: 21 Loc [ DRainID ]36: Totalize (P72) 1: 2 Reps 2: 8 Loc [ Rain1_inc ];----- ----------- Output T/RH; Every hour write array 16, T/RH37: If time is (P92) 1: 0 Minutes (Seconds --) into a 2: 60 Interval (same units as above) 3: 10 Set Output Flag High (Flag 0)38: Set Active Storage Area (P80) 1: 1 Final Storage Area 1 2: 16 Array ID39: Real Time (P77) 1: 1110 Year,Day,Hour/Minute40: Sample (P70) 1: 1 Reps 2: 22 Loc [ TempID ]; Average RH, T, Solar41: Average (P71) 1: 3 Reps 2: 13 Loc [ RH ];============= ====================*Table 2 Program 02: 60 Execution Interval (seconds); Every minute;----- --------------- Signature; Read the program signature1: Signature (P19) 1: 2 Loc [ Sig ];-------- --------------- Battery; Read the battery voltage2: Batt Voltage (P10) 1: 3 Loc [ Batt ];------- ------------- Internal T; Read internal thermistor3: Internal Temperature (P17) 1: 4 Loc [ Int_T ];----------------- ----- Box RH4: Volt (SE) (P1) 1: 1 Reps
28 Gouveia et al.
2: 5 2500 mV Slow Range 3: 12 SE Channel 4: 5 Loc [ Int_RH ] 5: 0.1 Mult 6: 0.0 Offset;-------------- Output Sig,AntPower,Batt,T,RH; Every hour write the Box variables5: If time is (P92) 1: 0000 Minutes (Seconds --) into a 2: 60 Interval (same units as above) 3: 10 Set Output Flag High6: Set Active Storage Area (P80) 1: 1 Final Storage Area 1 2: 1 Array ID7: Real Time (P77) 1: 1110 Year,Day,Hour/Minute8: Sample (P70) 1: 1 Reps2: 18 Loc [ BoxID ]; Output Program signature9: Sample (P70) 1: 1 Reps 2: 2 Loc [ Sig ]; Output Antenna Power10: Sample (P70) 1: 2 Reps 2: 16 Loc [ FwdPwr ]
; Minimum of Battery voltage11: Minimum (P74) 1: 1 Reps 2: 0 Value Only 3: 3 Loc [ Batt ]; Average Internal T and RH12: Average (P71) 1: 2 Reps 2: 4 Loc [ Int_T ];---------- ----- Send data to TGT113: If time is (P92) 1: 0 Minutes (Seconds --) into a 2: 60 Interval (same units as above) 3: 30 Then Do14: Data Transfer to TGT1 (P120) 1: 000 Binary/Self-Timed/Append 2: 16 FWD/Ref Power Loc [ FwdPwr ]15: End (P95);-------- --- Send data to SM71616: Serial Out (P96) 1: 71 SM192/SM716/CSM1*Table 3 SubroutinesEnd Program
Appendix C
FORTRAN code to interpret 3-character data
30 Gouveia et al.
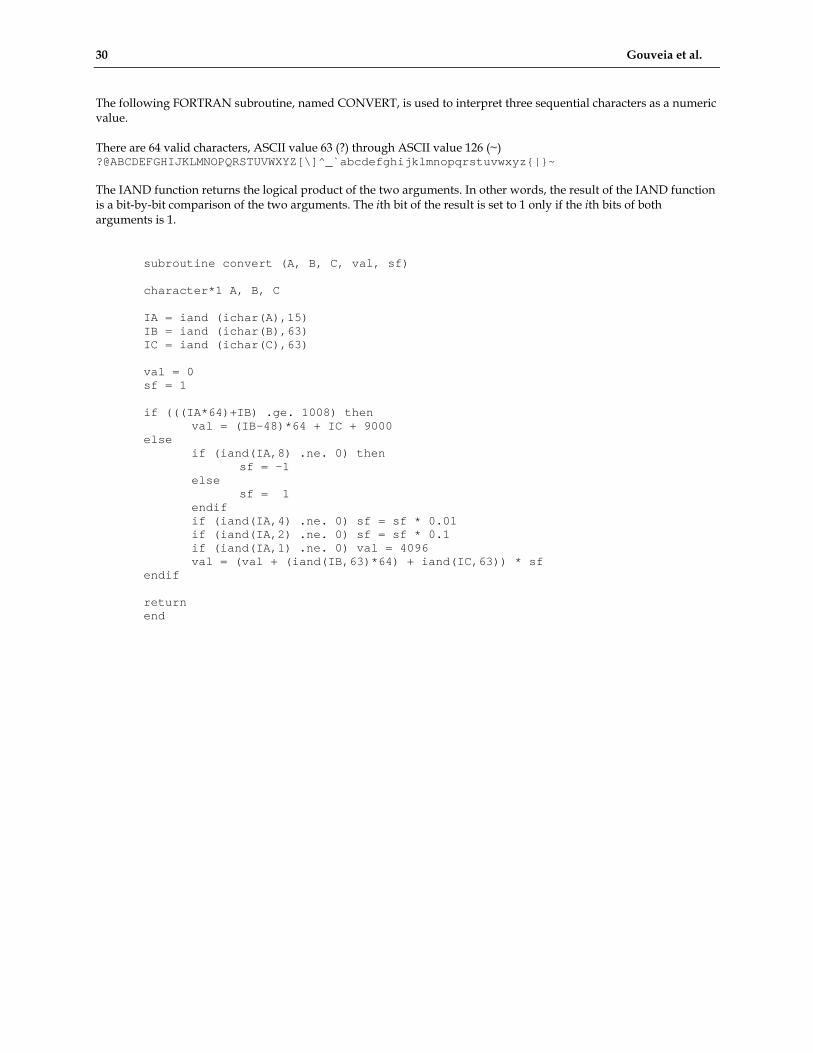
The following FORTRAN subroutine, named CONVERT, is used to interpret three sequential characters as a numeric value. There are 64 valid characters, ASCII value 63 (?) through ASCII value 126 (~)?@ABCDEFGHIJKLMNOPQRSTUVWXYZ[\]^_`abcdefghijklmnopqrstuvwxyz|~ The IAND function returns the logical product of the two arguments. In other words, the result of the IAND function is a bit-by-bit comparison of the two arguments. The ith bit of the result is set to 1 only if the ith bits of both arguments is 1. subroutine convert (A, B, C, val, sf) character*1 A, B, C IA = iand (ichar(A),15) IB = iand (ichar(B),63) IC = iand (ichar(C),63) val = 0 sf = 1 if (((IA*64)+IB) .ge. 1008) then val = (IB-48)*64 + IC + 9000 else if (iand(IA,8) .ne. 0) then sf = -1 else sf = 1 endif if (iand(IA,4) .ne. 0) sf = sf * 0.01 if (iand(IA,2) .ne. 0) sf = sf * 0.1 if (iand(IA,1) .ne. 0) val = 4096 val = (val + (iand(IB,63)*64) + iand(IC,63)) * sf endif return end
These wind rose tables are made from Bikini Atoll data takes from 9 May 2000 through 30 April 2001. All available data was included in the statistics. Wind speed classes are based on the integer portion of the wind speed. For example, the wind speed class 0 includes wind speeds from 0 to 0.999 m/s; class 1 includes speeds from 1.0 to 1.999 m/s. The wind direction classes are centered on the indicated direction. The wind rose diagrams are created from the data in the tables. The roses group the wind speed classes into 5 groups: Calms, 1 to 2.999 m/s, 3 to 3.999, 4 to 4.999, and 5.0 and greater. The calms are distributed evenly among all 16 wind direction classes. Control Plot N=8439 Wind Speed Class