48
Crude Preheat Train Training Workbook Monitor Crude Preheat (Metric Units) Page 1

Crude Preheat
Train
Training Workbook
9 July, 2004
Monitor Crude Preheat (Metric Units) Page 1

IntroductionThe Monitor simulation program has been developed specifically to monitor the fouling in heat exchanger networks. You specify measured temperatures, flowrates and properties for the network and Monitor determ-ines the fouling and a normalised furnace inlet temperature. You may then plot the calculated parameters to investigate the rate of fouling and its effect on the network. You may also examine the economic impact of the fouling and the benefits of cleaning exchangers.
About this WorkbookThis training workbook is a step-by step guide on how to set up a Monitor simulation. It aims to teach by do-ing. You are guided through the process of creating a simulation with explanations of the concepts required at each step.The workbook assumes that you have installed Monitor 5.00 (or later). If you have an earlier version of the program or need assistance with the installation, contact the helpdesk at “[email protected]”.
Workbook Conventions Text in <> indicates a key to be pressed. For example, <Esc> refers to the Escape key. Names of windows, menus and menu options are in bold text. Text which appears on a window is written in bold normal font Text that you enter is shown “bold in quotes”.
Monitor Conventions1) Menus are used for navigation around the program. Commonly used menu options also have buttons on
the toolbar.2) Context-sensitive help is available by pressing <F1> on the keyboard or by clicking the Help button on a
window. Help contains lots of useful information so look there first if you have questions or problems.3) The current input field is initially blue which indicates that its contents are selected. As soon as you type
a character, the previous contents are erased. If you wish to edit the contents, use the <Home> or <End> key to move into the field first.
4) When entering data, use <Tab> to move from field to field. <Enter> may also be used but, if you move to an option button, it may change the selection. Use <Ctrl+Tab> to move out of a table.
ColoursRed indicates action. If a field has a red border, a value must be supplied. If a button has a red caption, you must enter data in the window which opens when you click it.Green indicates default or calculated values. For example, the field where you enter the area of an exchanger is initially green to indicate that it will be calculated if a value is not supplied. Fields which do not have coloured borders are optional. However, they may be required if you want to per -form specific calculations. For example, economic data must be complete to generate Cleaning Economics reports.
Saving DataChanges to data are saved when a data entry window is closed with OK. If it is closed with Cancel, any changes made since the window opened are discarded.
If Cancel is used, any changes made in subsidiary windows will also be lost even if the subsidiary window was closed with OK.
When using multiple entry windows, e.g. for exchanger mechanical data or for Case data, changes are saved when you use Back, Next or Finish. To discard changes on the current window, click Cancel.If you want to discard changes after closing a window with OK, you must re-open the stored data file. Make sure that you click “No” when asked if you wish to save the changes first.When a window closes, the data are only saved to temporary working databases – not to permanent disk files. So, when entering data, you should save them to file at regular intervals. If you have a power loss, Monitor will attempt to recover your Network when you next run it. However, recovery cannot be guaranteed.
Page 2 Crude Preheat (Metric Units) Monitor
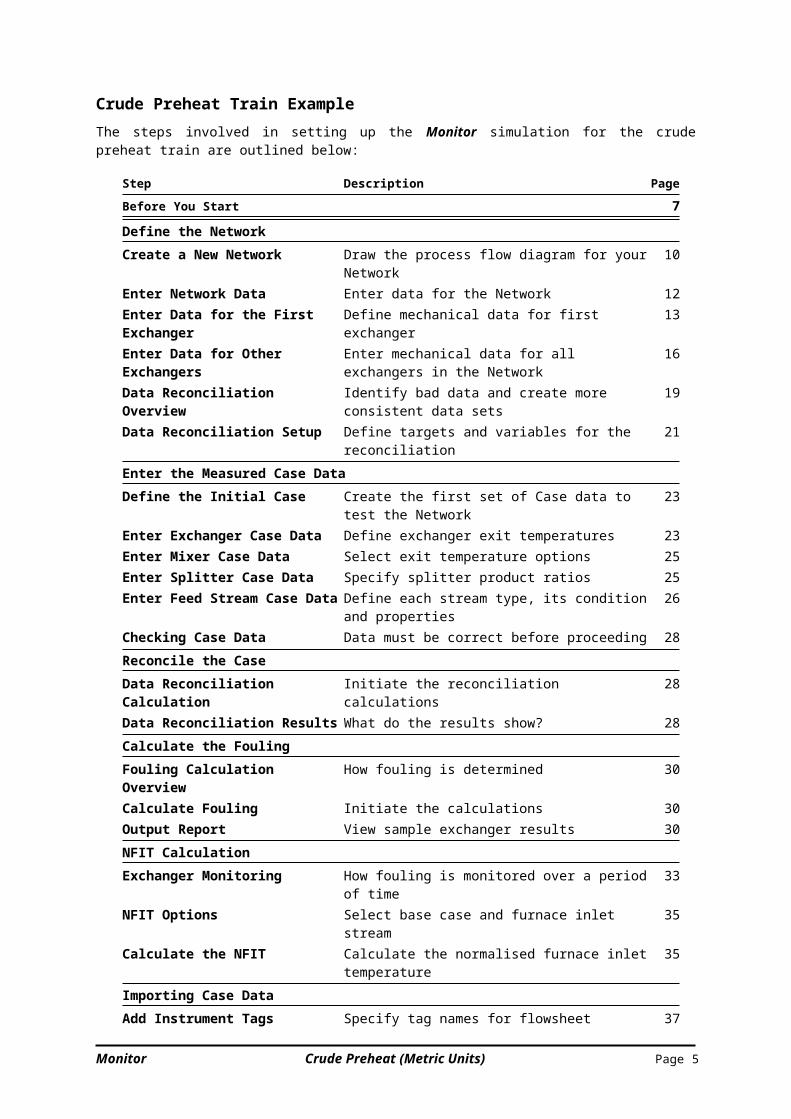
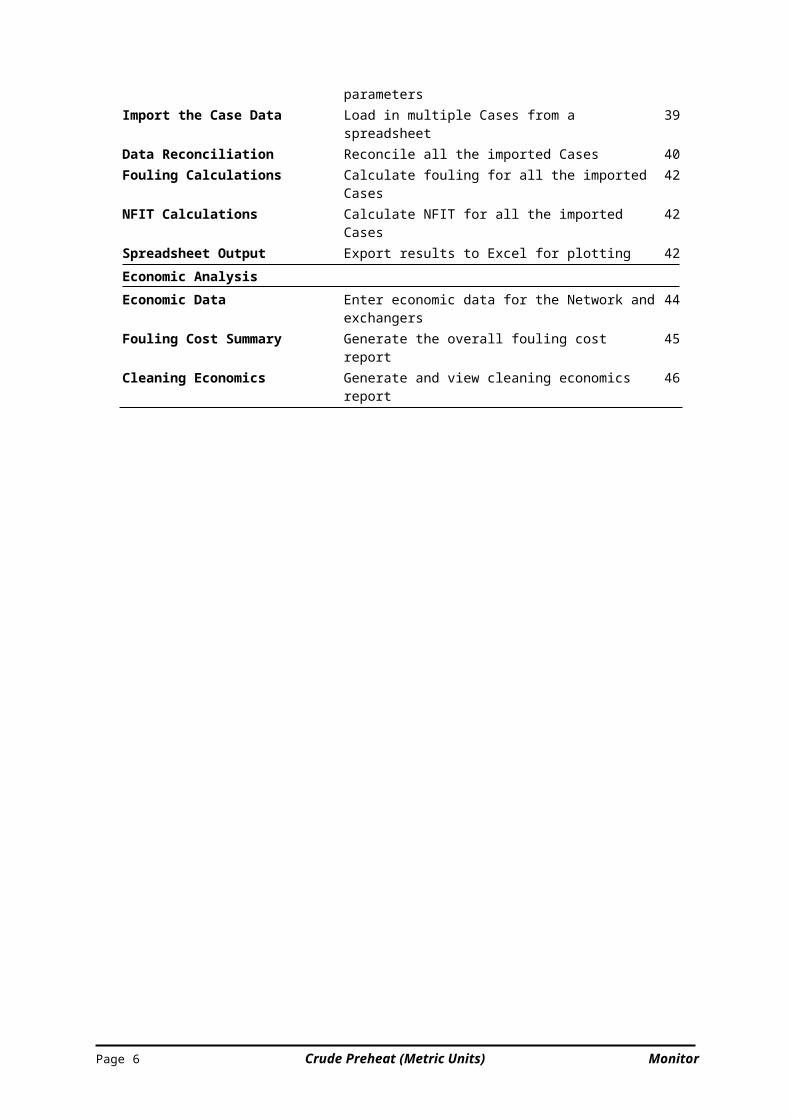
Crude Preheat Train ExampleThe steps involved in setting up the Monitor simulation for the crude preheat train are outlined below:
Step Description PageBefore You Start 4Define the NetworkCreate a New Network Draw the process flow diagram for your Network 6Enter Network Data Enter data for the Network 7Enter Data for the First Exchanger Define mechanical data for first exchanger 8Enter Data for Other Exchangers Enter mechanical data for all exchangers in the Network 11Data Reconciliation Overview Identify bad data and create more consistent data sets 13Data Reconciliation Setup Define targets and variables for the reconciliation 14Enter the Measured Case DataDefine the Initial Case Create the first set of Case data to test the Network 15Enter Exchanger Case Data Define exchanger exit temperatures 15Enter Mixer Case Data Select exit temperature options 17Enter Splitter Case Data Specify splitter product ratios 17Enter Feed Stream Case Data Define each stream type, its condition and properties 17Checking Case Data Data must be correct before proceeding 19Reconcile the CaseData Reconciliation Calculation Initiate the reconciliation calculations 19Data Reconciliation Results What do the results show? 19Calculate the FoulingFouling Calculation Overview How fouling is determined 20Calculate Fouling Initiate the calculations 20Output Report View sample exchanger results 20NFIT CalculationExchanger Monitoring How fouling is monitored over a period of time 22NFIT Options Select base case and furnace inlet stream 23Calculate the NFIT Calculate the normalised furnace inlet temperature 23Importing Case DataAdd Instrument Tags Specify tag names for flowsheet parameters 25Import the Case Data Load in multiple Cases from a spreadsheet 26Data Reconciliation Reconcile all the imported Cases 27Fouling Calculations Calculate fouling for all the imported Cases 28NFIT Calculations Calculate NFIT for all the imported Cases 28Spreadsheet Output Export results to Excel for plotting 28Economic AnalysisEconomic Data Enter economic data for the Network and exchangers 29Fouling Cost Summary Generate the overall fouling cost report 30Cleaning Economics Generate and view cleaning economics report 31
Monitor Crude Preheat (Metric Units) Page 3
Before You StartIf you are new to Monitor, you may find it useful to select the Monitor Help option on the Help menu in order to familiarise yourself with the program.Even if you are familiar with Monitor, the old adage “Garbage in, garbage out” applies to it as much as to any other computer application. Before running Monitor, you need to gather the relevant data and ensure that they are reasonable.1. The Flowsheet
When you create a Monitor simulation, you are put into the PFD Editor where you draw the process flow diagram (PFD). The flowsheet used by refineries will include equipment not required for the Monitor simulation. In addition, it will not be laid out in a concise form which is easy to translate into the PFD. Therefore your first step should always be to sketch out (on paper) a simulation flowsheet. This contains only the relevant unit operations for the simulation. It does not include instrumentation, control lines or other units (such as reactors or distillation columns) which will not be in included in the simulation. When drawing exchangers, it is useful to indicate which stream is on the tube side. This is normally done by drawing the line for the tube side through the exchanger. On the diagram for the crude preheat ex -ample, you will see that most exchangers have the crude on the tube side. You must also add specific unit operations for each flow splitting and mixing.Each unit operation and stream must then be given a unique name of up to 8 characters.If you are going to use instrument tags to import data from a spreadsheet, you will either need to add these to your simulation flowsheet or create a list of tag names and the flowsheet parameters that they represent.
2. Gather DataThere are two types of data used by Monitor. First, you must gather the Network data – primarily con-nectivity and exchanger mechanical data. If possible, you should actually look at the exchanger network and confirm that it still corresponds to any flowsheet that you have. For the exchanger data, you will nor -mally require copies of the exchanger data sheets from your client. Network data do not change and are entered only once for a monitoring project.Once the Network data are complete, you will supply sets of Case data which comprise the measured data from the exchanger network. Sets of Case data are entered regularly and held in a database so that foul -ing trends may be plotted over the monitoring period. For each exchanger, you need at least one exit temperature measurement and you need performance data (such as temperature, pressure, product splits) for other unit operations. For each feed stream you will need temperature, pressure, flowrate and prop -erty data. For hydrocarbon streams, obtaining properties is sometimes the most difficult part but it is im -portant to get the best possible data.Plant data are now usually stored directly from the control system into spreadsheet files. These can be the most convenient method of importing Case data into Monitor. You may import single Cases or histor-ical data for the period you wish to investigate.
3. BypassesWhen visiting the exchanger network, it is always a good idea to check for bypasses round exchangers. Ask the operators if they regularly use bypasses to control the system or if they are just used when taking units out of service. If a bypass is only used to remove an exchanger - i.e. a total bypass - you can specify this as part of the Case data.However, if partial bypasses are used in the network, you must model them by a splitter before, and mixer after, the exchanger. The data reconciliation feature of Monitor may be used to determine the bypass rate. Partial bypasses are most common on pumparound streams.When there is a bypass open, it is vital to know where the temperature is measured and specify it accord-ingly. In Monitor, you may specify the exit temperature from the exchanger or from the mixer after it.If the fouling calculated by Monitor for an exchanger shows a sudden very large increase, this is usually because a bypass has been opened. This causes a reduction in the heat transfer and, because Monitor is still using the full flowrate, the only way it can allow for this reduction is to increase the fouling.
Remember that the vast majority of problems which arise when using Monitor (other than typing mistakes) are due to poor data. Time spent at the beginning to get things right is time well spent.
Page 4 Crude Preheat (Metric Units) Monitor
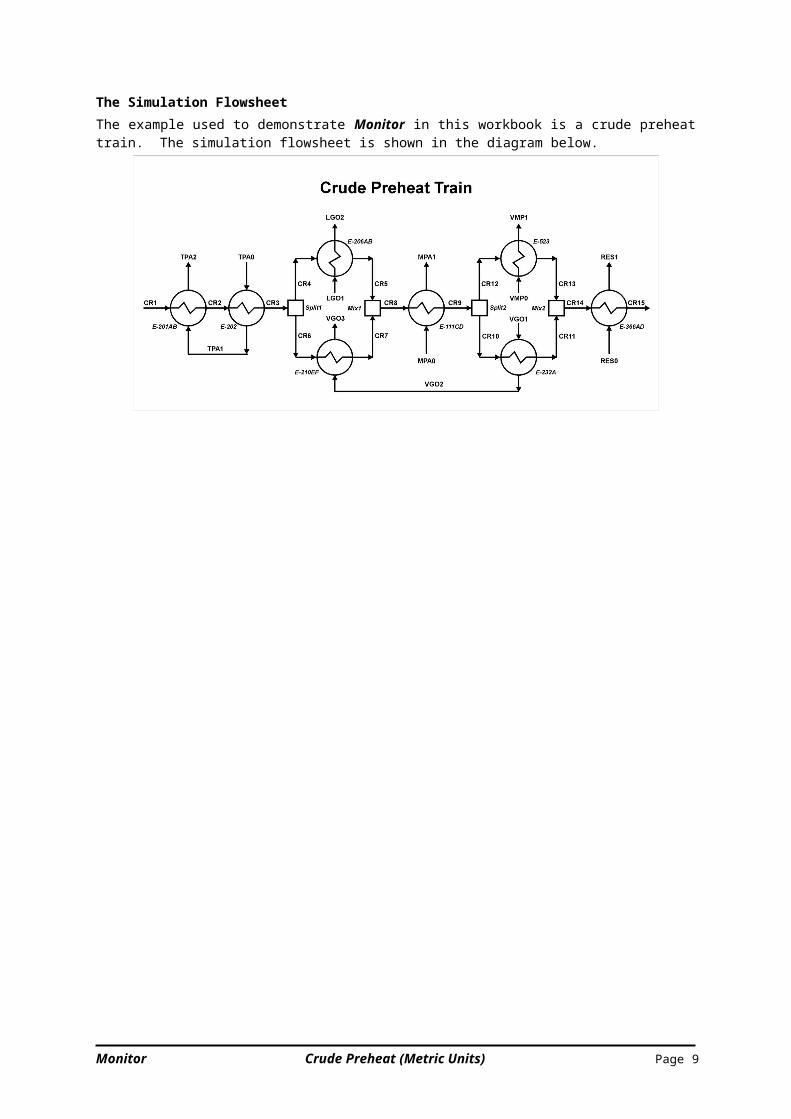
The Simulation FlowsheetThe example used to demonstrate Monitor in this workbook is a crude preheat train. The simulation flow-sheet is shown in the diagram below.
Monitor Crude Preheat (Metric Units) Page 5
Simulating the Network
Step 1 Create a New NetworkStart Monitor and create a new empty Network by selecting New from the File menu, pressing
<Ctrl+N> on the keyboard or clicking on the toolbar. You are taken into the PFD Editor where you will draw the flowsheet.You see an empty drawing area with a toolbox on the right hand side. The toolbox contains the icons for all the available unit operations.
If you need help when drawing the PFD, press <F1>.
Add Units Place each exchanger, mixer and splitter on the PFD as follows: Click with the left mouse button on the required unit in the toolbox. The mouse pointer
changes to indicate that you are in placement mode. Click with the left mouse button on the PFD where you want the new unit, enter the
unit name in the Create Unit window and click OK. If you need to change the name later, right click on the unit and select Rename from the shortcut menu.
The new unit is placed and the pointer changes back to the normal arrow.
You may place multiples of the same kind of unit by using the right mouse button to place the unit on the PFD.
The crude stream is on the shell side for exchangers E-206AB and E-523 so right-click on each, select Flip and Rotate from the shortcut menu, select Rotate Anticlockwise and repeat for Flip Left-Right. When added to the PFD, the shell side ports on the exchanger are for flow from the bottom to the top. On the flowsheet, you will see that E-202 and E-232A need to have the flow down-wards. Use the Flip Top-Bottom option on the shortcut menu to flip these exchangers.To rearrange the units on the PFD, simply click on a unit and drag it into the required position.
To align units, select a unit and then <Ctrl>-click on units which you wish to align to it. See Aligning Units in the Help for more details.
Adding Streams
Once the units have been added, connect them together by adding streams. To add the crude feed stream, click to the left of exchanger E-201AB and hold the mouse button down. This starts the stream creation. Drag the stream to the feed port on the left of the exchanger and re-lease the mouse button. Enter the stream name “CR1” in the Create Stream window and click OK.
Feed ports are blue. Product ports are red.
Now click on the product port on the right of exchanger E-201AB and drag the stream to the feed port on the left of exchanger E-202. Continue this procedure and add all the streams.
By default, streams start with S-. You can use the Autoname option on the Settings menu to change it to CR so that the crude streams are numbered automatically.
If you miss a port, you will create a feed or product stream. To reconnect it, simply click on the end of the stream and drag it to the required port. You may also change the routing of a stream by clicking on it and dragging the segment to the required position.Stream labels may also be dragged to the required position on the PFD.When all streams are connected, the status box on the toolbar will show Connectivity Com-plete.To view the complete PFD in the window, select the Fit in Window option from the View menu or from the PFD shortcut or just press <F> on the keyboard. Your PFD should look like this:
Page 6 Crude Preheat (Metric Units) Monitor
Select Save and Return from the PFD menu to save your PFD and return from the PFD Editor. After returning, you will notice that the status button on the toolbar shows Network incomplete and the labels for the exchangers are red. As long as the exchangers are connected correctly, this indicates that they have incomplete mechanical data.If you wish to modify the PFD at any time, select the Modify PFD option from the Network
menu, press <Ctrl+M> or click on the toolbar.Save your Data Although your PFD has been saved into Monitor’s temporary working databases, it is not
saved to a permanent disk file.Save it now by selecting Save or Save As from the File menu, pressing <Ctrl+S> or clicking
on the toolbar. Move to a suitable directory and name your Network “Preheat”.
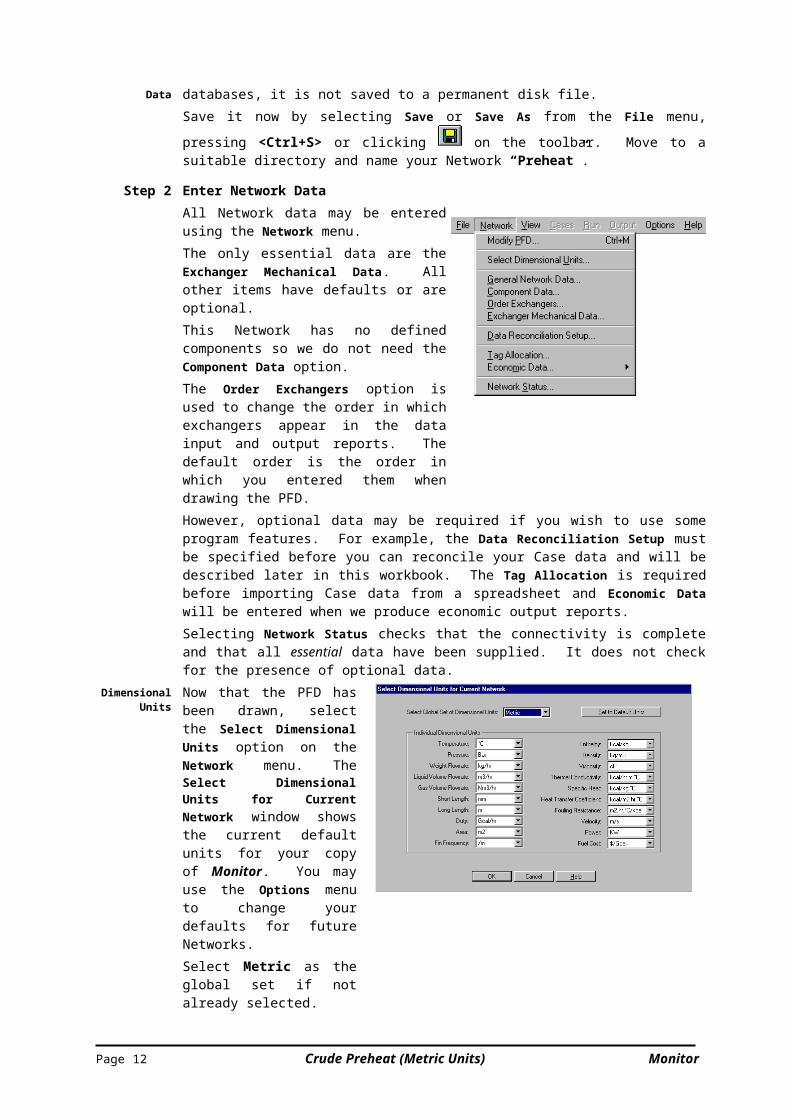
Step 2 Enter Network DataAll Network data may be entered using the Net-work menu.The only essential data are the Exchanger Mechanical Data. All other items have defaults or are optional. This Network has no defined components so we do not need the Component Data option.The Order Exchangers option is used to change the order in which exchangers appear in the data input and output reports. The default order is the order in which you entered them when draw-ing the PFD.However, optional data may be required if you wish to use some program features. For ex-ample, the Data Reconciliation Setup must be specified before you can reconcile your Case data and will be described later in this workbook. The Tag Allocation is required before im-porting Case data from a spreadsheet and Economic Data will be entered when we produce economic output reports.Selecting Network Status checks that the connectivity is complete and that all essential data have been supplied. It does not check for the presence of optional data.
Monitor Crude Preheat (Metric Units) Page 7
Dimensional Units
Now that the PFD has been drawn, select the Select Di-mensional Units option on the Network menu. The Select Di-mensional Units for Current Network window shows the current default units for your copy of Monitor. You may use the Options menu to change your defaults for future Networks.Select Metric as the global set if not already selected.
You may change the dimensional units at any time and all data will be displayed in the selected set even if entered in different units.
NetworkDescription
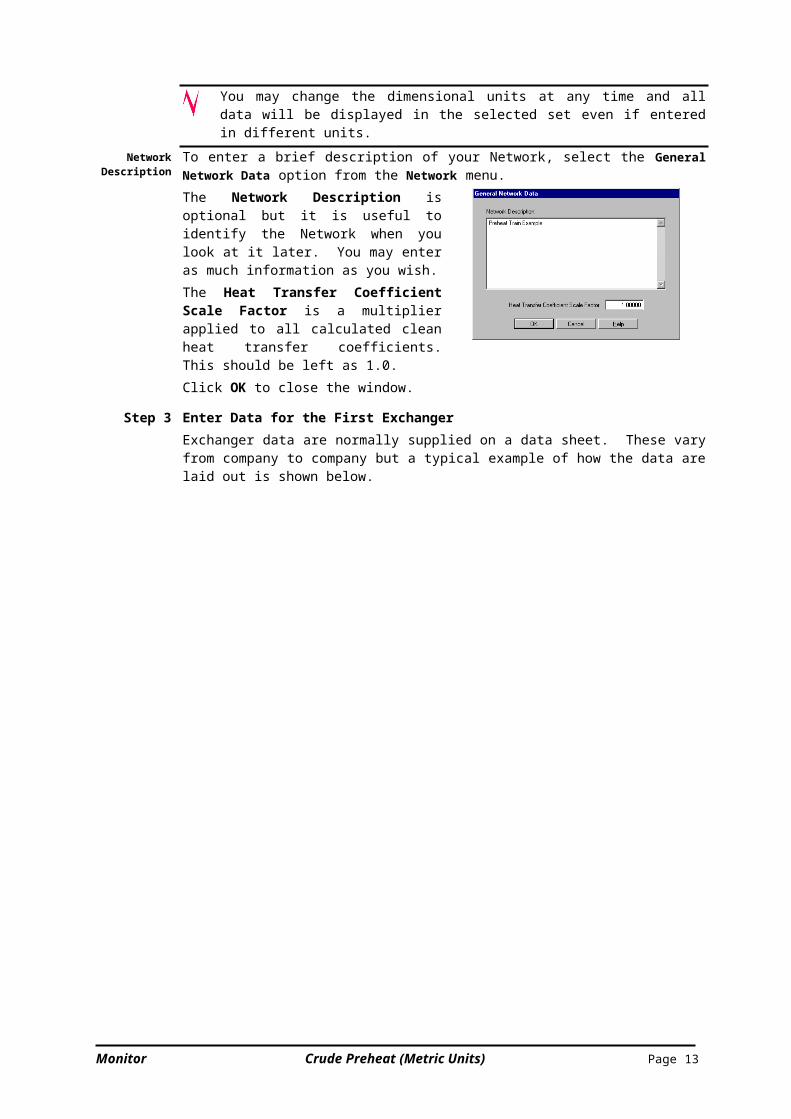
To enter a brief description of your Network, select the General Network Data option from the Network menu.The Network Description is optional but it is useful to identify the Network when you look at it later. You may enter as much information as you wish.The Heat Transfer Coefficient Scale Factor is a multiplier applied to all calculated clean heat transfer coefficients. This should be left as 1.0.Click OK to close the window.
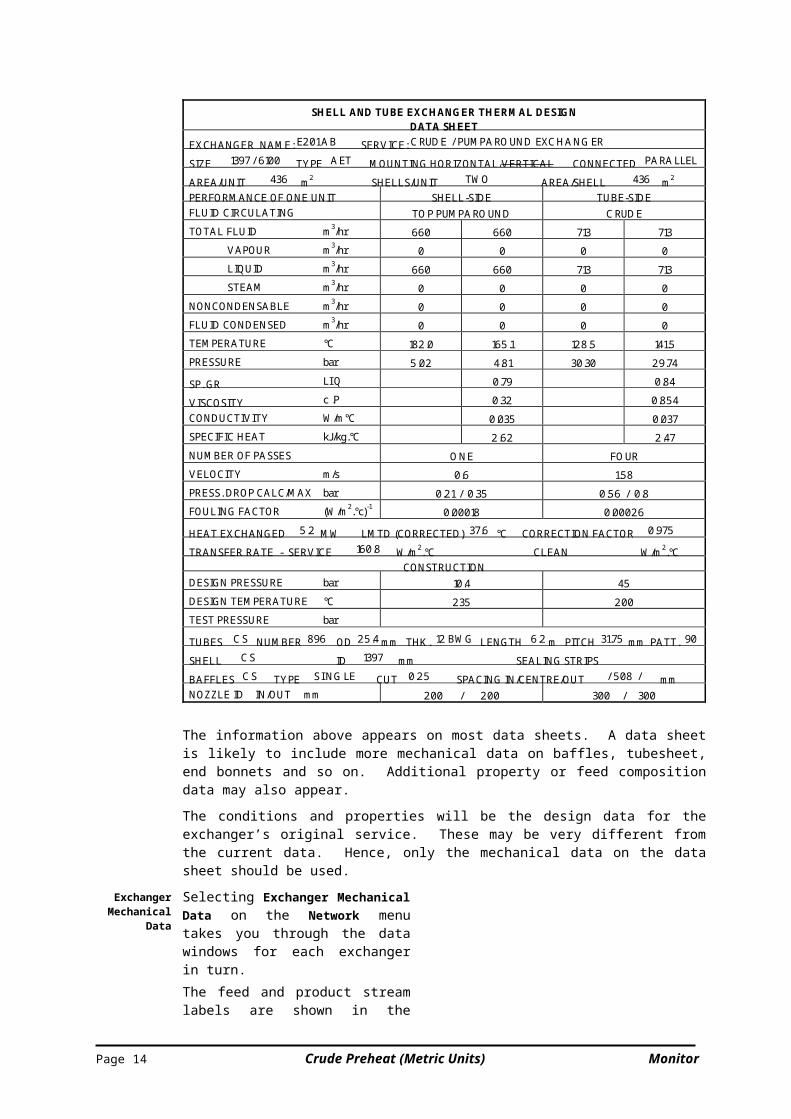
Step 3 Enter Data for the First Exchanger Exchanger data are normally supplied on a data sheet. These vary from company to company but a typical example of how the data are laid out is shown below.
Page 8 Crude Preheat (Metric Units) Monitor
SHELL AND TUBE EXCHANGER THERMAL DESIGNDATA SHEET
EXCHANGER NAME: E201 AB SERVICE: CRUDE / PUMPAROUND EXCHANGERSIZE 1397 / 6100 TYPE AET MOUNTING HORIZONTAL/VERTICAL CONNECTED PARALLELAREA/UNIT 436 m2 SHELLS/UNIT TWO AREA/SHELL 436 m2
PERFORMANCE OF ONE UNIT SHELL-SIDE TUBE-SIDEFLUID CIRCULATING TOP PUMPAROUND CRUDETOTAL FLUID m3/hr 660 660 713 713
VAPOUR m3/hr 0 0 0 0LIQUID m3/hr 660 660 713 713STEAM m3/hr 0 0 0 0
NONCONDENSABLE m3/hr 0 0 0 0FLUID CONDENSED m3/hr 0 0 0 0TEMPERATURE °C 182.0 165.1 128.5 141.5PRESSURE bar 5.02 4.81 30.30 29.74SP. GR LI Q 0.79 0.84VISCOSITY c .P 0.32 0.854CONDUCTIVITY W/m°C 0.035 0.037SPECIFIC HEAT kJ/kg.°C 2.62 2.47NUMBER OF PASSES ONE FOURVELOCITY m/s 0.6 1.58PRESS. DROP CALC/MAX bar 0.21 / 0.35 0.56 / 0.8FOULING FACTOR (W/m2.°c)-1 0.00018 0.00026HEAT EXCHANGED 5.2 MW LMTD (CORRECTED) 37.6 °C CORRECTION FACTOR 0.975TRANSFER RATE - SERVICE 160.8 W/m2.°C CLEAN W/m2.°C
CONSTRUCTIONDESIGN PRESSURE bar 10.4 45DESIGN TEMPERATURE °C 235 200TEST PRESSURE bar
TUBES CS NUMBER 896 OD 25.4 mm THK. 12 BWG LENGTH 6.2 m PITCH 31.75 mm PATT. 90SHELL CS ID 1397 mm SEALING STRIPS
BAFFLES CS TYPE SI NGLE CUT 0.25 SPACING IN/CENTRE/OUT / 508 / mmNOZZLE ID IN/OUT mm 200 / 200 300 / 300
The information above appears on most data sheets. A data sheet is likely to include more mechanical data on baffles, tubesheet, end bonnets and so on. Additional property or feed com-position data may also appear.
The conditions and properties will be the design data for the exchanger’s original service. These may be very different from the current data. Hence, only the mechanical data on the data sheet should be used.
Exchanger Mechanical
Data
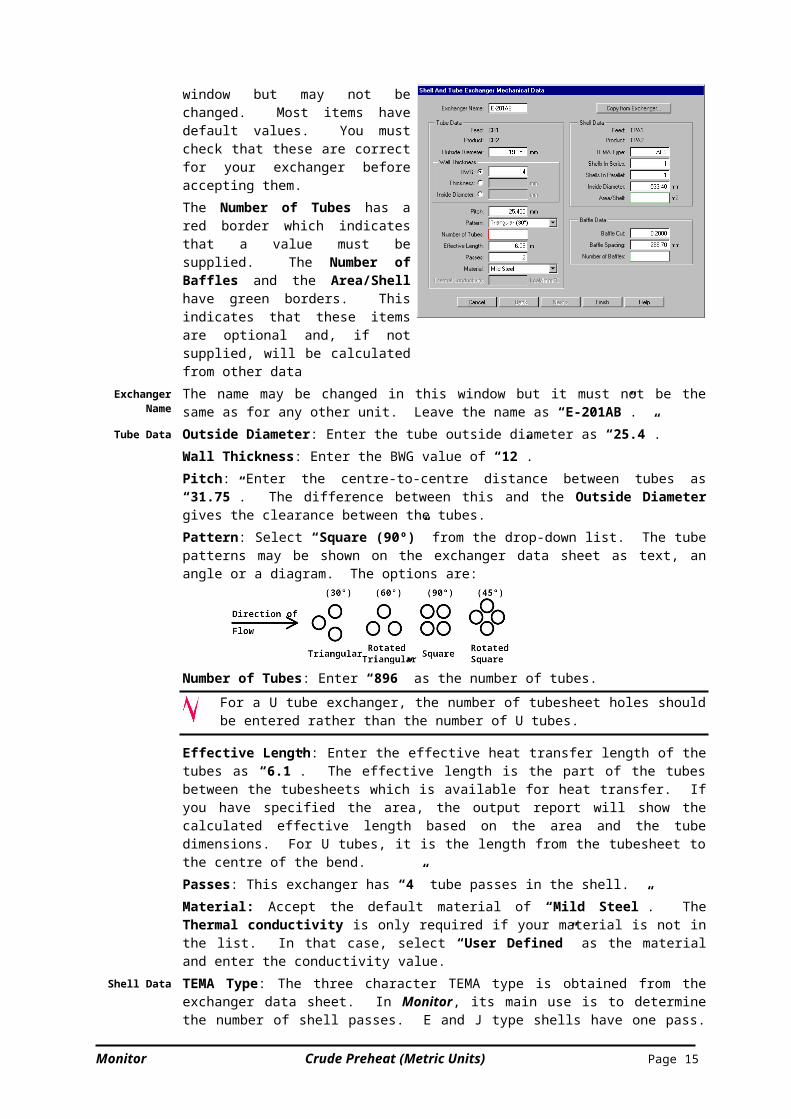
Selecting Exchanger Mechanical Data on the Network menu takes you through the data windows for each exchanger in turn.The feed and product stream labels are shown in the window but may not be changed. Most items have default values. You must check that these are correct for your exchanger before accepting them.The Number of Tubes has a red border which indicates that a value must be sup-plied. The Number of Baffles and the
Monitor Crude Preheat (Metric Units) Page 9
Area/Shell have green borders. This in-dicates that these items are optional and, if not supplied, will be calculated from other data
Exchanger Name
The name may be changed in this window but it must not be the same as for any other unit. Leave the name as “E-201AB”.
Tube Data Outside Diameter: Enter the tube outside diameter as “25.4”.Wall Thickness: Enter the BWG value of “12”.Pitch: Enter the centre-to-centre distance between tubes as “31.75”. The difference between this and the Outside Diameter gives the clearance between the tubes.Pattern: Select “Square (90º)” from the drop-down list. The tube patterns may be shown on the exchanger data sheet as text, an angle or a diagram. The options are:
Number of Tubes: Enter “896” as the number of tubes. For a U tube exchanger, the number of tubesheet holes should be entered rather than the number of U tubes.
Effective Length: Enter the effective heat transfer length of the tubes as “6.1”. The effective length is the part of the tubes between the tubesheets which is available for heat transfer. If you have specified the area, the output report will show the calculated effective length based on the area and the tube dimensions. For U tubes, it is the length from the tubesheet to the centre of the bend.Passes: This exchanger has “4” tube passes in the shell.Material: Accept the default material of “Mild Steel”. The Thermal conductivity is only re-quired if your material is not in the list. In that case, select “User Defined” as the material and enter the conductivity value.
Shell Data TEMA Type: The three character TEMA type is obtained from the exchanger data sheet. In Monitor, its main use is to determine the number of shell passes. E and J type shells have one pass. Any other type has two. Enter “AET”.
Page 10 Crude Preheat (Metric Units) Monitor

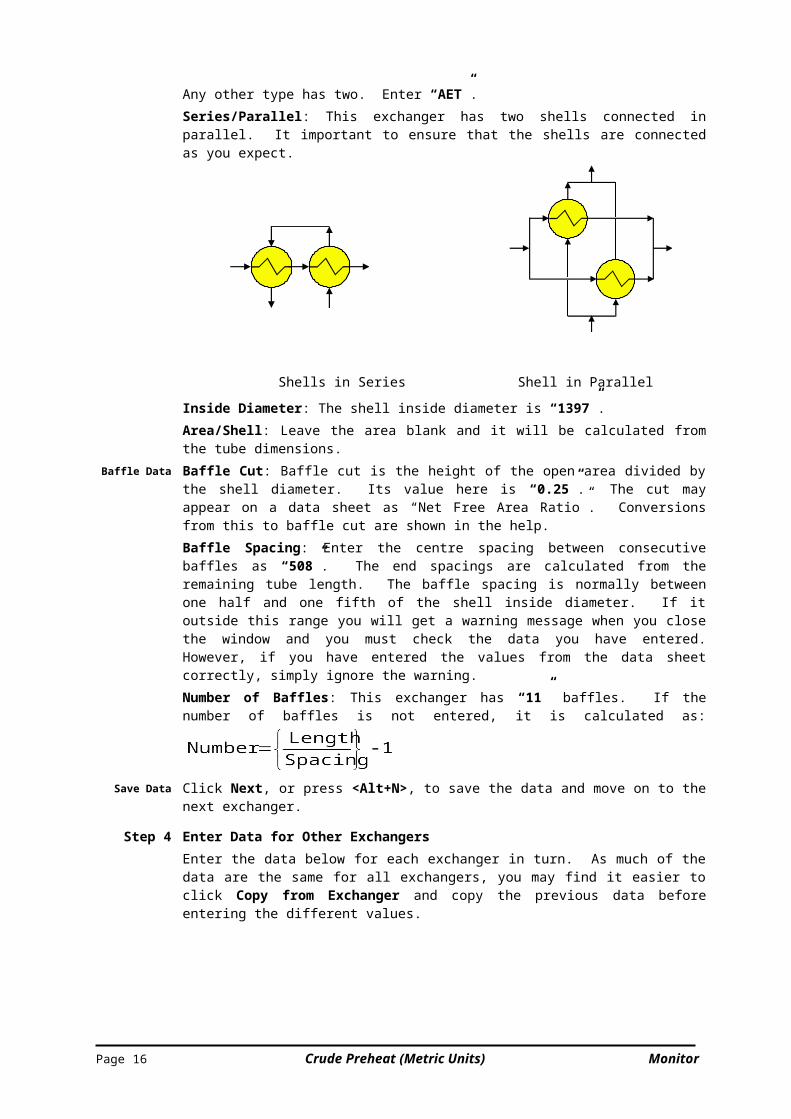
Series/Parallel: This exchanger has two shells connected in parallel. It important to ensure that the shells are connected as you expect.
Shells in Series Shell in Parallel
Inside Diameter: The shell inside diameter is “1397”.Area/Shell: Leave the area blank and it will be calculated from the tube dimensions.
Baffle Data Baffle Cut: Baffle cut is the height of the open area divided by the shell diameter. Its value here is “0.25”. The cut may appear on a data sheet as “Net Free Area Ratio”. Conversions from this to baffle cut are shown in the help.Baffle Spacing: Enter the centre spacing between consecutive baffles as “508”. The end spa-cings are calculated from the remaining tube length. The baffle spacing is normally between one half and one fifth of the shell inside diameter. If it outside this range you will get a warning message when you close the window and you must check the data you have entered. However, if you have entered the values from the data sheet correctly, simply ignore the warning.Number of Baffles: This exchanger has “11” baffles. If the number of baffles is not entered, it
is calculated as:
Save Data Click Next, or press <Alt+N>, to save the data and move on to the next exchanger.
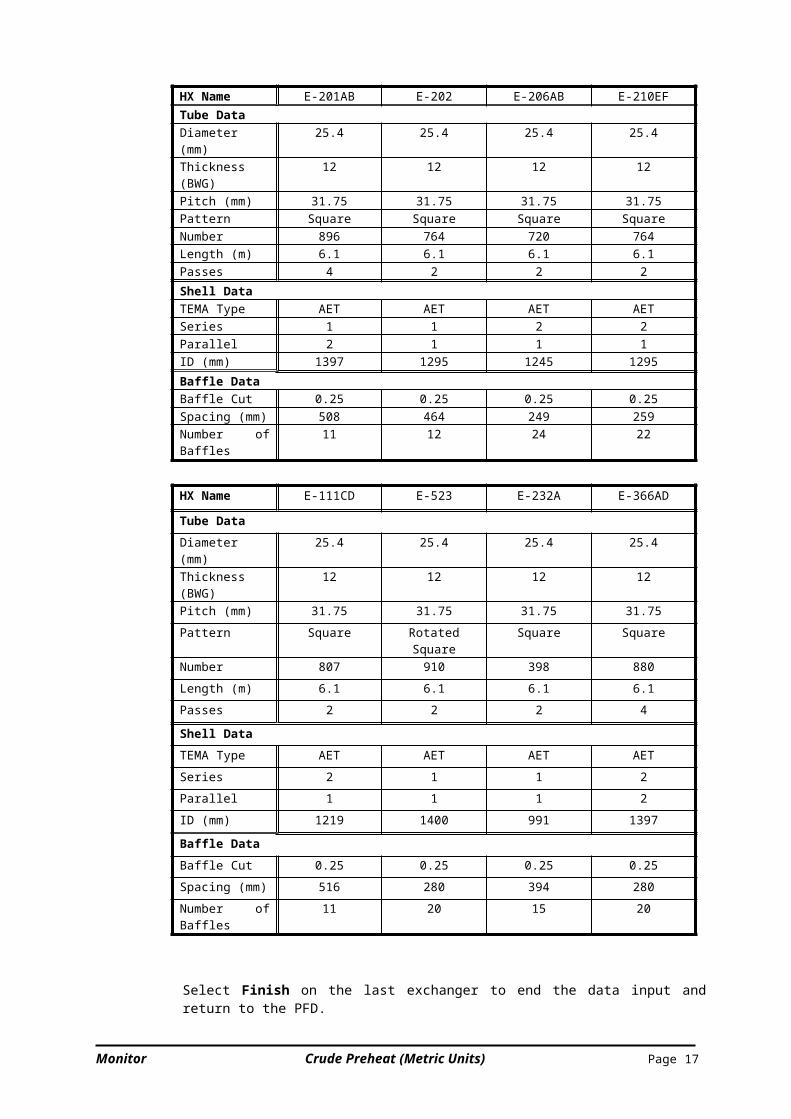
Step 4 Enter Data for Other ExchangersEnter the data below for each exchanger in turn. As much of the data are the same for all ex -changers, you may find it easier to click Copy from Exchanger and copy the previous data be-fore entering the different values.
HX Name E-201AB E-202 E-206AB E-210EFTube DataDiameter (mm) 25.4 25.4 25.4 25.4Thickness (BWG) 12 12 12 12Pitch (mm) 31.75 31.75 31.75 31.75Pattern Square Square Square SquareNumber 896 764 720 764Length (m) 6.1 6.1 6.1 6.1Passes 4 2 2 2Shell DataTEMA Type AET AET AET AETSeries 1 1 2 2Parallel 2 1 1 1ID (mm) 1397 1295 1245 1295Baffle DataBaffle Cut 0.25 0.25 0.25 0.25Spacing (mm) 508 464 249 259Number of Baffles
11 12 24 22
Monitor Crude Preheat (Metric Units) Page 11
HX Name E-111CD E-523 E-232A E-366AD
Tube DataDiameter (mm) 25.4 25.4 25.4 25.4Thickness (BWG) 12 12 12 12Pitch (mm) 31.75 31.75 31.75 31.75Pattern Square Rotated Square Square SquareNumber 807 910 398 880Length (m) 6.1 6.1 6.1 6.1Passes 2 2 2 4
Shell DataTEMA Type AET AET AET AETSeries 2 1 1 2Parallel 1 1 1 2ID (mm) 1219 1400 991 1397
Baffle DataBaffle Cut 0.25 0.25 0.25 0.25Spacing (mm) 516 280 394 280Number of Baffles
11 20 15 20
Select Finish on the last exchanger to end the data input and return to the PFD.After the data have been entered, none of the exchanger labels will be shown as red and the Cases menu will be available. The status button on the toolbar will display No Cases.
If you wish to modify the mechanical data for a single exchanger, right-click on the ex-changer and select Mechanical Data from the shortcut menu.
Save your Data Remember that, although your data have been saved into Monitor’s temporary working data-bases, they are not yet saved to permanent disk file. Save them now by selecting Save from the
File menu, pressing <Ctrl+S> or clicking on the toolbar.
Remember to use the Help if you need more information.
Page 12 Crude Preheat (Metric Units) Monitor
Data Reconciliation OverviewOne of the major problems with any set of measured plant data is that it is not consistent. In -consistencies arise in hot and cold side measured exit temperatures and in feed stream measured temperatures and flowrates. In addition, uncertainties in the physical properties affect all calcu -lated results. The data reconciliation feature in Monitor detects inconsistencies in the data you supply and determines new values for selected parameters which will provide more consistent data. It can also be used to determine missing plant data such as bypass rates.You must specify which exchangers and mixers will be targets for the reconciliation. Target mixers require an exit temperature in the Case data. For target exchangers, you must supply both exit temperatures. Then for each target, you must select a parameter which will be varied to meet the target temperature.The Monitor reconciliation calculation first uses the temperatures and flowrates that you sup-ply to determine duties on the hot and cold sides of the target exchangers. Although the calcu -lated values for each side are generally different, these duties must be equal in real exchangers. The reconciliation uses an optimisation procedure to reduce the differences between the duties by varying the parameters which you have specified. If you have entered mixer temperatures as reconciliation targets, the calculation will try to meet these temperatures at the same time.If you have only one measured exit temperature for an exchanger, it cannot be a target and the other temperature is determined from the exchanger heat balance (see below). If none of the exchangers has both exit temperatures measured, the Case cannot be reconciled.
The parameters which may be varied by the reconciliation are feed stream flowrates and temperatures and splitter specifications. You may also vary a mixer product stream as long as all its feeds are feeds to the Network. At least one feed stream flowrate must be fixed.When selecting a variable, you must en-sure that it affects the exit temperature of the associated target. Otherwise, non-unique solutions may occur. The pro-gram will detect these and give an errorFlowrates are usually varied in prefer-ence to temperatures because temperat-ure measurement is generally considered to be more accurate. When reconciling the data, all input val-ues are considered either right or wrong. Those that you indicate may be wrong (the variables) are recalculated.
Heat BalanceThe heat (or enthalpy) balance calculation across an exchanger ensures that the amount of heat re-moved from the hot feed stream is the same as the amount added to the cold stream.For the calculation, you must know the flowrate, temperature and properties of each feed stream and one exit temperature.The duty is equal to the enthalpy change between inlet and exit on the side with the specified exit temperature.
The enthalpy of the other exit stream (Hout) is then calculated and, from this, its temperature is de-termined.For a mixer, the heat balance adds the feed enthal-pies to get the exit enthalpy and then derives the temperature from the enthalpy.
Parameters which are not selected as variables are held at the specified value - i.e. they are as -sumed to be measured accurately. Hence, you should always vary the parameters in which you have the least confidence. If you make any changes to the data for a Case, the reconciliation results for that Case are no longer valid and are discarded. The set of targets and variables is used for all Cases. If you change any of these, previous results are inconsistent and will be deleted.It is important to note that errors between the exchanger hot and cold side duties may not re -duce to zero. Discrepancies may still exist because of inconsistencies in the measured data or because you have insufficient variable parameters.
You should aim to have as many variables as exchangers being reconciled. This is not always possible – it depends on the data available and on the Network configuration.
When Monitor calculates the exchanger fouling, the results from the data reconciliation are automatically used unless you specify otherwise.
Monitor Crude Preheat (Metric Units) Page 13
Crude Preheat Example - Data Reconciliation
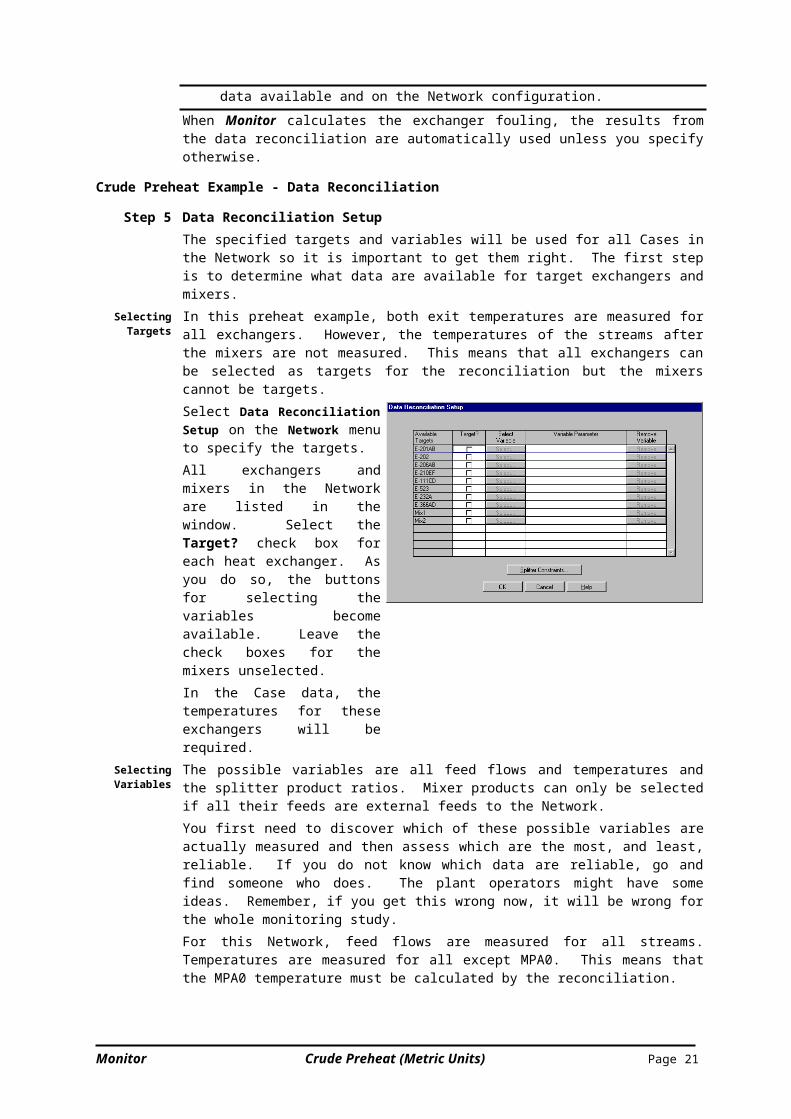
Step 5 Data Reconciliation SetupThe specified targets and variables will be used for all Cases in the Network so it is important to get them right. The first step is to determine what data are available for target exchangers and mixers.
SelectingTargets
In this preheat example, both exit temperatures are measured for all exchangers. However, the temperatures of the streams after the mixers are not measured. This means that all exchangers can be selected as targets for the reconciliation but the mixers cannot be targets.Select Data Reconciliation Setup on the Network menu to specify the targets.All exchangers and mixers in the Network are listed in the window. Select the Target? check box for each heat exchanger. As you do so, the buttons for selecting the vari-ables become available. Leave the check boxes for the mixers unselec-ted.In the Case data, the temperatures for these exchangers will be re-quired.
Selecting Vari-ables
The possible variables are all feed flows and temperatures and the splitter product ratios. Mixer products can only be selected if all their feeds are external feeds to the Network.You first need to discover which of these possible variables are actually measured and then as-sess which are the most, and least, reliable. If you do not know which data are reliable, go and find someone who does. The plant operators might have some ideas. Remember, if you get this wrong now, it will be wrong for the whole monitoring study.For this Network, feed flows are measured for all streams. Temperatures are measured for all except MPA0. This means that the MPA0 temperature must be calculated by the reconcilia -tion.
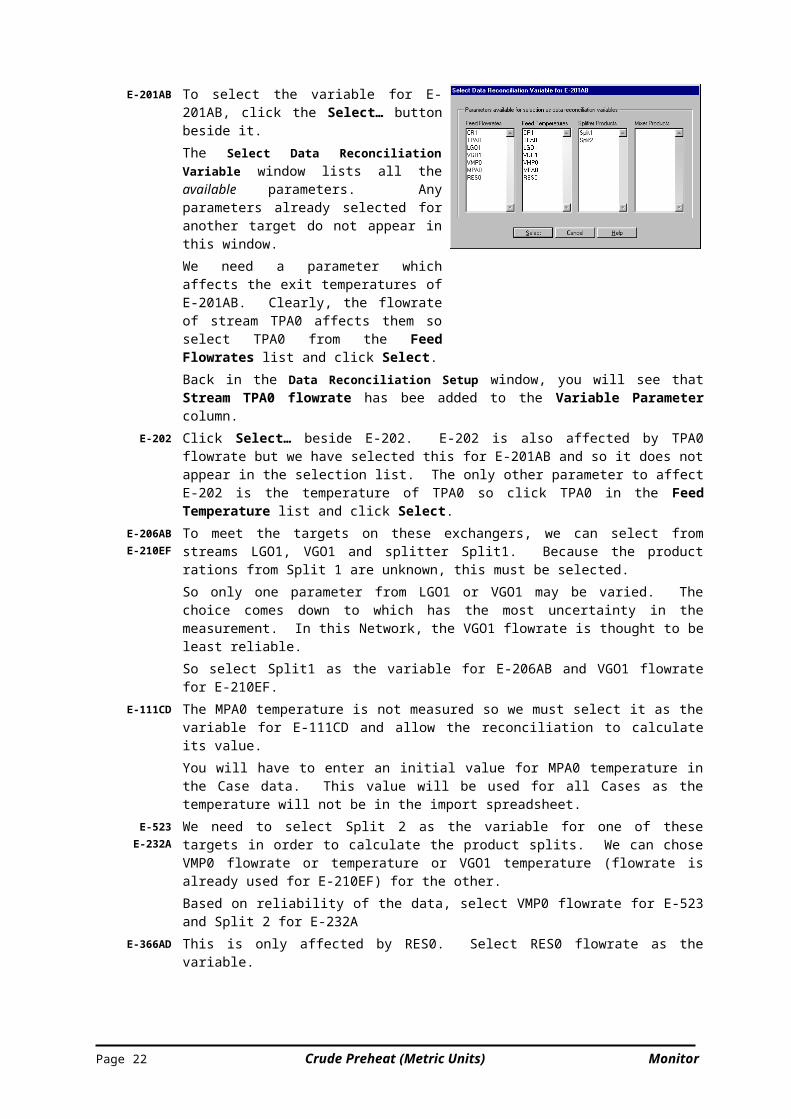
E-201AB To select the variable for E-201AB, click the Select… button beside it.The Select Data Reconciliation Variable win-dow lists all the available parameters. Any parameters already selected for another target do not appear in this window.We need a parameter which affects the exit temperatures of E-201AB. Clearly, the flowrate of stream TPA0 affects them so select TPA0 from the Feed Flowrates list and click Select.Back in the Data Reconciliation Setup window, you will see that Stream TPA0 flowrate has bee added to the Variable Parameter column.
E-202 Click Select… beside E-202. E-202 is also affected by TPA0 flowrate but we have selected this for E-201AB and so it does not appear in the selection list. The only other parameter to af -fect E-202 is the temperature of TPA0 so click TPA0 in the Feed Temperature list and click Select.
E-206ABE-210EF
To meet the targets on these exchangers, we can select from streams LGO1, VGO1 and splitter Split1. Because the product rations from Split 1 are unknown, this must be selected.So only one parameter from LGO1 or VGO1 may be varied. The choice comes down to which has the most uncertainty in the measurement. In this Network, the VGO1 flowrate is thought to be least reliable. So select Split1 as the variable for E-206AB and VGO1 flowrate for E-210EF.
E-111CD The MPA0 temperature is not measured so we must select it as the variable for E-111CD and
Page 14 Crude Preheat (Metric Units) Monitor
allow the reconciliation to calculate its value.You will have to enter an initial value for MPA0 temperature in the Case data. This value will be used for all Cases as the temperature will not be in the import spreadsheet.
E-523E-232A
We need to select Split 2 as the variable for one of these targets in order to calculate the product splits. We can chose VMP0 flowrate or temperature or VGO1 temperature (flowrate is already used for E-210EF) for the other.Based on reliability of the data, select VMP0 flowrate for E-523 and Split 2 for E-232A
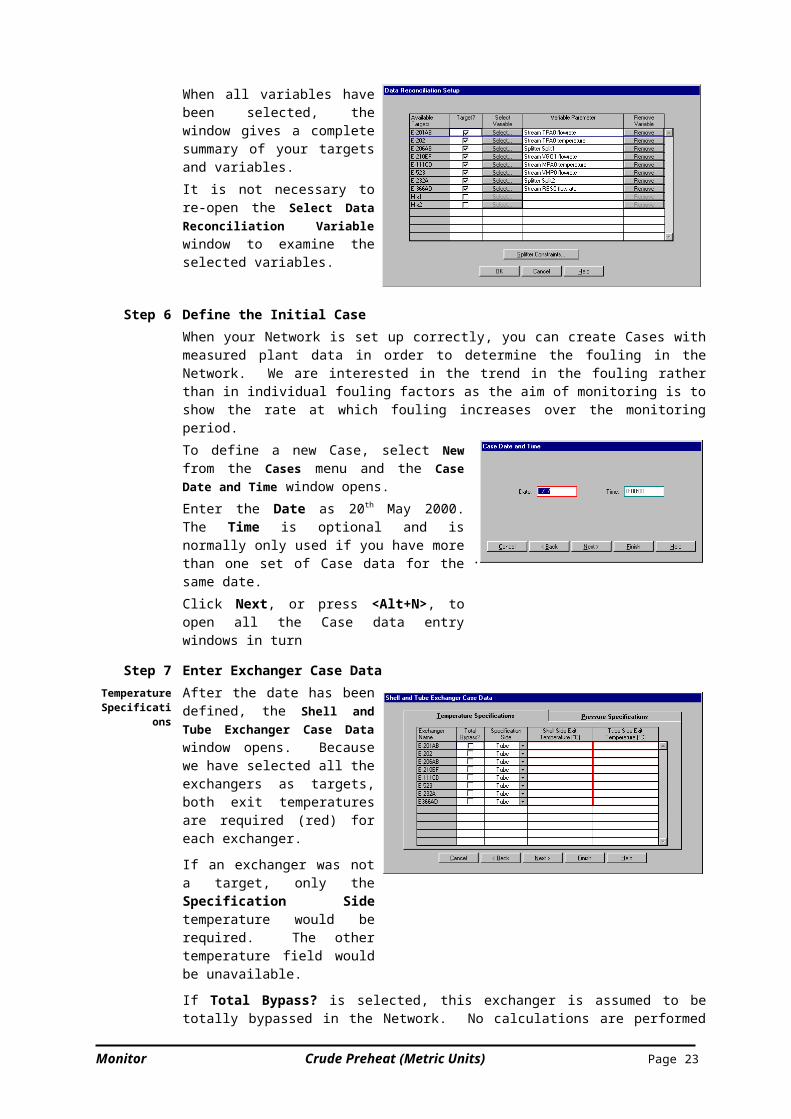
E-366AD This is only affected by RES0. Select RES0 flowrate as the variable.When all variables have been se-lected, the window gives a com-plete summary of your targets and variables.It is not necessary to re-open the Select Data Reconciliation Vari-able window to examine the selec-ted variables.
Step 6 Define the Initial CaseWhen your Network is set up correctly, you can create Cases with measured plant data in order to determine the fouling in the Network. We are interested in the trend in the fouling rather than in individual fouling factors as the aim of monitoring is to show the rate at which fouling increases over the monitoring period.To define a new Case, select New from the Cases menu and the Case Date and Time window opens.Enter the Date as 20th May 2000. The Time is op-tional and is normally only used if you have more than one set of Case data for the same date.Click Next, or press <Alt+N>, to open all the Case data entry windows in turn
.
Step 7 Enter Exchanger Case DataTemperature
SpecificationsAfter the date has been defined, the Shell and Tube Exchanger Case Data window opens. Be-cause we have selected all the ex-changers as targets, both exit tem-peratures are required (red) for each exchanger.
If an exchanger was not a target, only the Specification Side tem-perature would be required. The other temperature field would be unavailable.
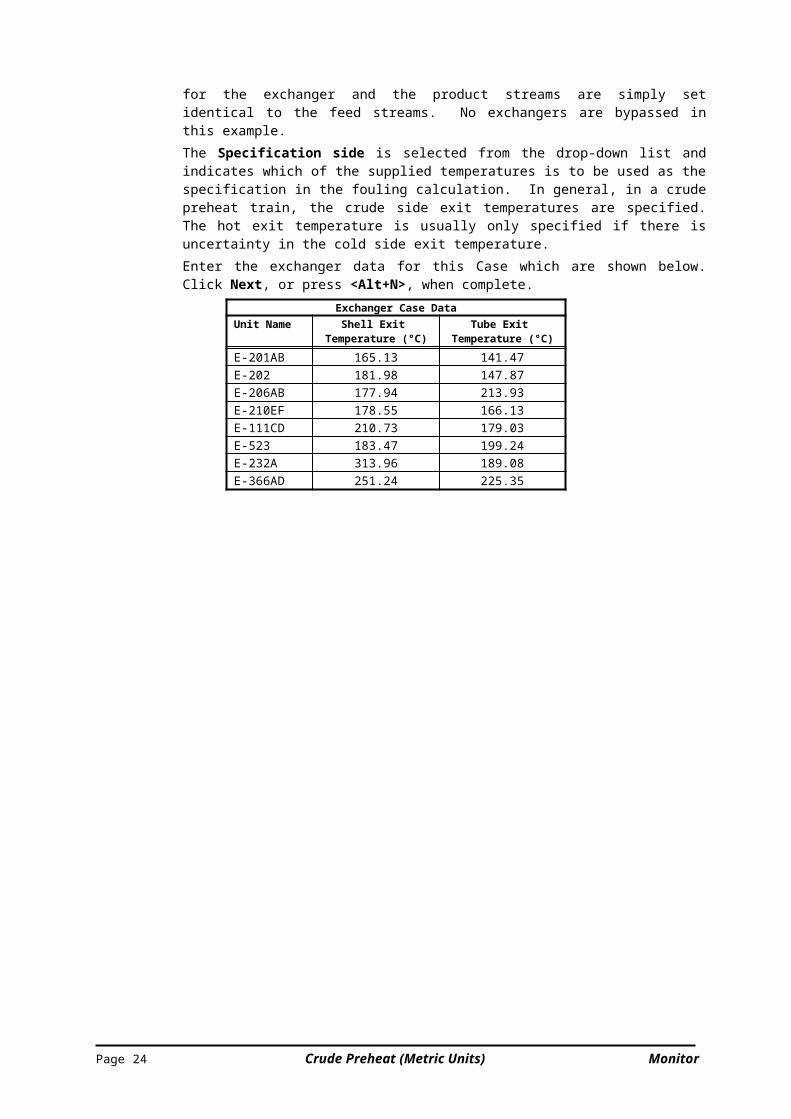
If Total Bypass? is selected, this exchanger is assumed to be totally bypassed in the Network. No calculations are performed for the exchanger and the product streams are simply set identical to the feed streams. No exchangers are bypassed in this example.The Specification side is selected from the drop-down list and indicates which of the supplied temperatures is to be used as the specification in the fouling calculation. In general, in a crude preheat train, the crude side exit temperatures are specified. The hot exit temperature is usually only specified if there is uncertainty in the cold side exit temperature.Enter the exchanger data for this Case which are shown below. Click Next, or press <Alt+N>,
Monitor Crude Preheat (Metric Units) Page 15
when complete.Exchanger Case Data
Unit Name Shell Exit Temperature (°C)
Tube Exit Temperature (°C)
E-201AB 165.13 141.47E-202 181.98 147.87E-206AB 177.94 213.93E-210EF 178.55 166.13E-111CD 210.73 179.03E-523 183.47 199.24E-232A 313.96 189.08E-366AD 251.24 225.35
Page 16 Crude Preheat (Metric Units) Monitor
Check the flowsheet for the cold side of each exchanger and use it for the specification.
You can use <Tab> to move through the table. <Ctrl+Tab> moves you out of the table.
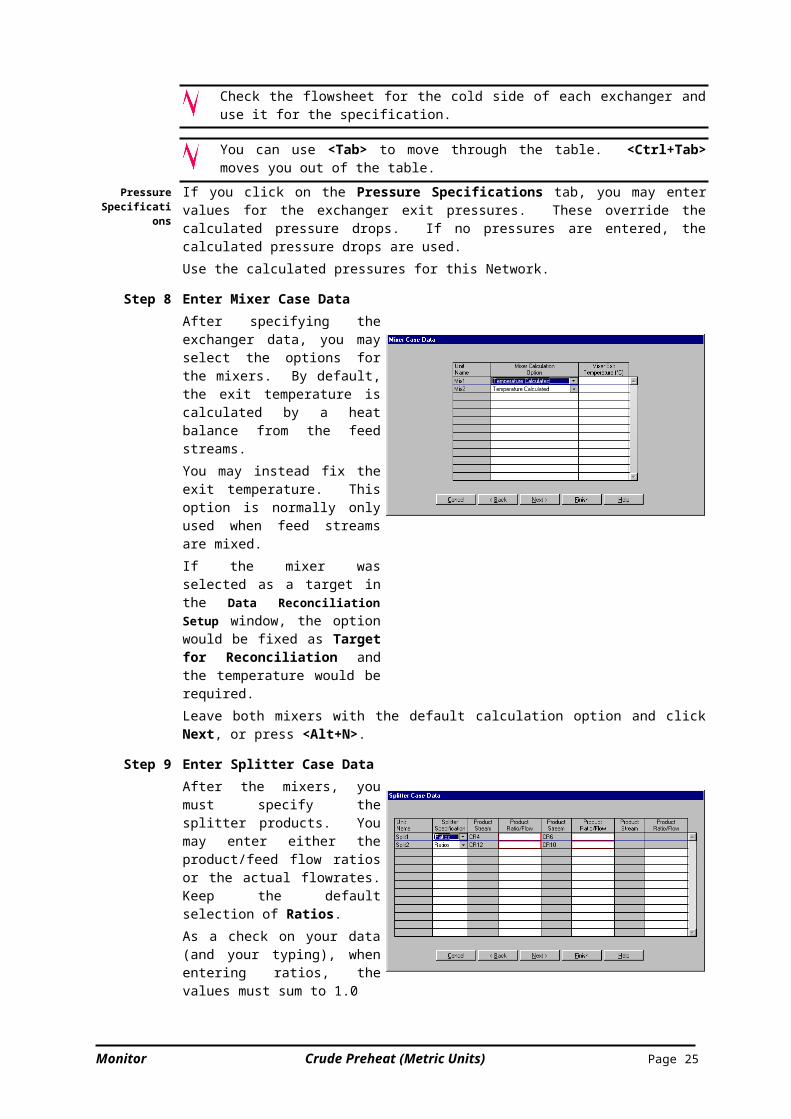
Pressure Spe-cifications
If you click on the Pressure Specifications tab, you may enter values for the exchanger exit pressures. These override the calculated pressure drops. If no pressures are entered, the calcu-lated pressure drops are used.Use the calculated pressures for this Network.
Step 8 Enter Mixer Case DataAfter specifying the exchanger data, you may select the options for the mixers. By default, the exit temper-ature is calculated by a heat balance from the feed streams. You may instead fix the exit tem-perature. This option is normally only used when feed streams are mixed.If the mixer was selected as a target in the Data Reconciliation Setup window, the option would be fixed as Target for Reconciliation and the temperature would be required.Leave both mixers with the default calculation option and click Next, or press <Alt+N>.
Step 9 Enter Splitter Case DataAfter the mixers, you must specify the splitter products. You may enter either the product/feed flow ratios or the actual flowrates. Keep the default selection of Ratios.As a check on your data (and your typing), when entering ratios, the values must sum to 1.0
The splitter data are not known so simply enter 0.5 for each and click Next, or press <Alt+N>, when com-plete. The values will be calculated by the reconciliation.
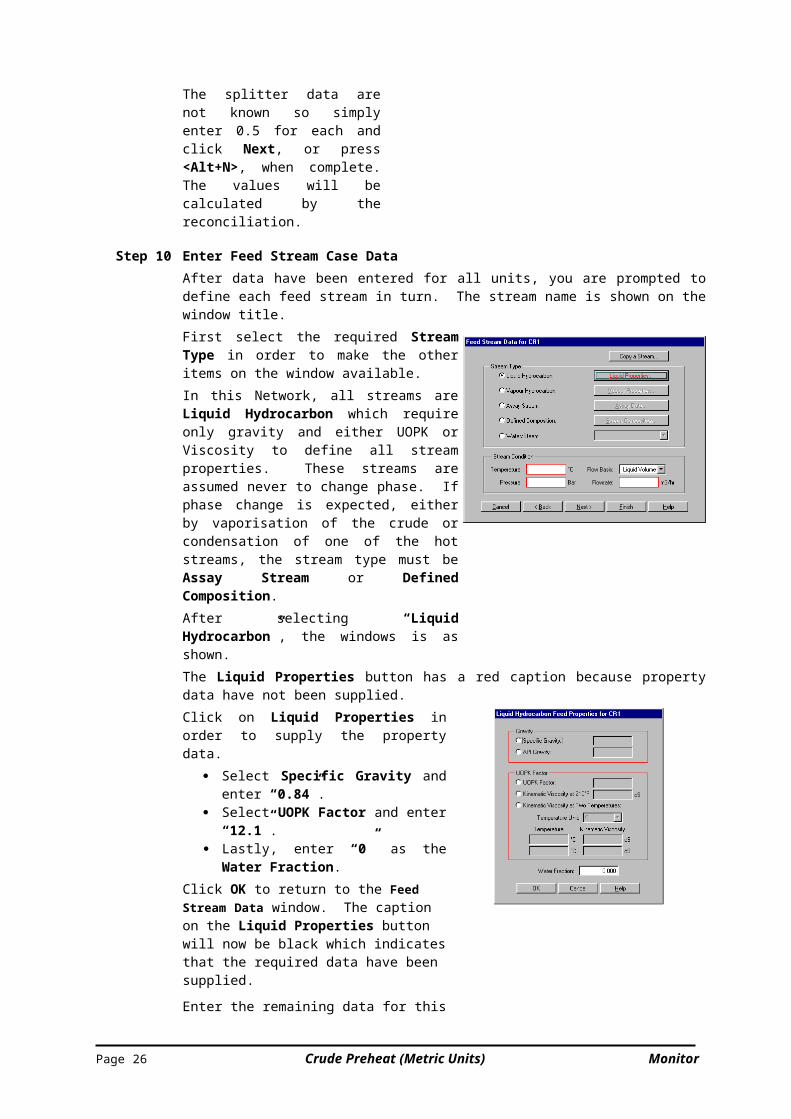
Step 10 Enter Feed Stream Case DataAfter data have been entered for all units, you are prompted to define each feed stream in turn. The stream name is shown on the window title.First select the required Stream Type in order to make the other items on the window available.In this Network, all streams are Liquid Hydro-carbon which require only gravity and either UOPK or Viscosity to define all stream properties. These streams are assumed never to change phase. If phase change is expected, either by vaporisation of the crude or condensation of one of the hot streams, the stream type must be Assay Stream or Defined Composition.After selecting “Liquid Hydrocarbon”, the win-dows is as shown.
The Liquid Properties button has a red caption because property data have not been supplied.
Monitor Crude Preheat (Metric Units) Page 17
Click on Liquid Properties in order to supply the property data.
Select Specific Gravity and enter “0.84”.
Select UOPK Factor and enter “12.1”. Lastly, enter “0” as the Water Fraction.
Click OK to return to the Feed Stream Data window. The caption on the Liquid Properties button will now be black which indicates that the required data have been supplied.
Enter the remaining data for this stream and for the other streams in turn using the data below. The order of the streams in your Network depends on the order that you entered them on the PFD so it may not be the same as shown here.
Feed Stream Data
Stream Name CR1 TPA0 LGO1 MPA0 VGO1 VMP0 RES0 Stream Type Liquid Liquid Liquid Liquid Liquid Liquid Liquid Temperature (°C) 128.52 188.14 235.53 250.00 347.20 244.68 339.75Pressure (Bar) 30.30 6.00 6.30 5.70 7.50 18.50 24.50Flowrate (m3/hr) 713.11 659.88 171.31 367.09 70.02 49.35 261.51
Specific gravity 0.840 0.790 0.850 0.860 0.910 0.860 0.967UOPK factor 12.10 11.98 11.87 11.84 11.79 11.83 11.71
Page 18 Crude Preheat (Metric Units) Monitor

The MPA0 temperature is not known and an estimate is entered here.
New values for UOPK factor are rarely available for each Case. If the type of oil does not change significantly, the UOPK factor is assumed constant and previous values are generally used. However, if the type of crude is changed, you may find it easier to get Kinematic Viscosity data – either at 210F or at two other temperatures. The UOPK is then determined from the viscos-ity.
Step 11 Checking Case DataAfter the last feed stream has been defined or you click Finish on any window, you are returned to the Existing Cases window. The data are checked and you are informed of any missing or invalid data. If errors are reported, press the Edit button. This takes you back through the data entry windows in order to correct your data. You must correct any data errors before you can calculate the Case.
If you wish to modify the Case data for a single unit or feed, right-click on the icon on the PFD and select Case Data from the shortcut menu.
2
Your first Case is now complete so close the Existing Cases window and save your data.
Step 12 Data Reconciliation CalculationThe targets and variables have already been selected in the Data Reconciliation Setup window. To initiate the reconciliation, click Run on the Run Network Calculations window and select the Data Reconciliation option. If you want to check the setup before calculating, click Re-conciliation Setup. Click Run to start the reconciliation.
Step 13 Data Reconciliation ResultsReconciliation
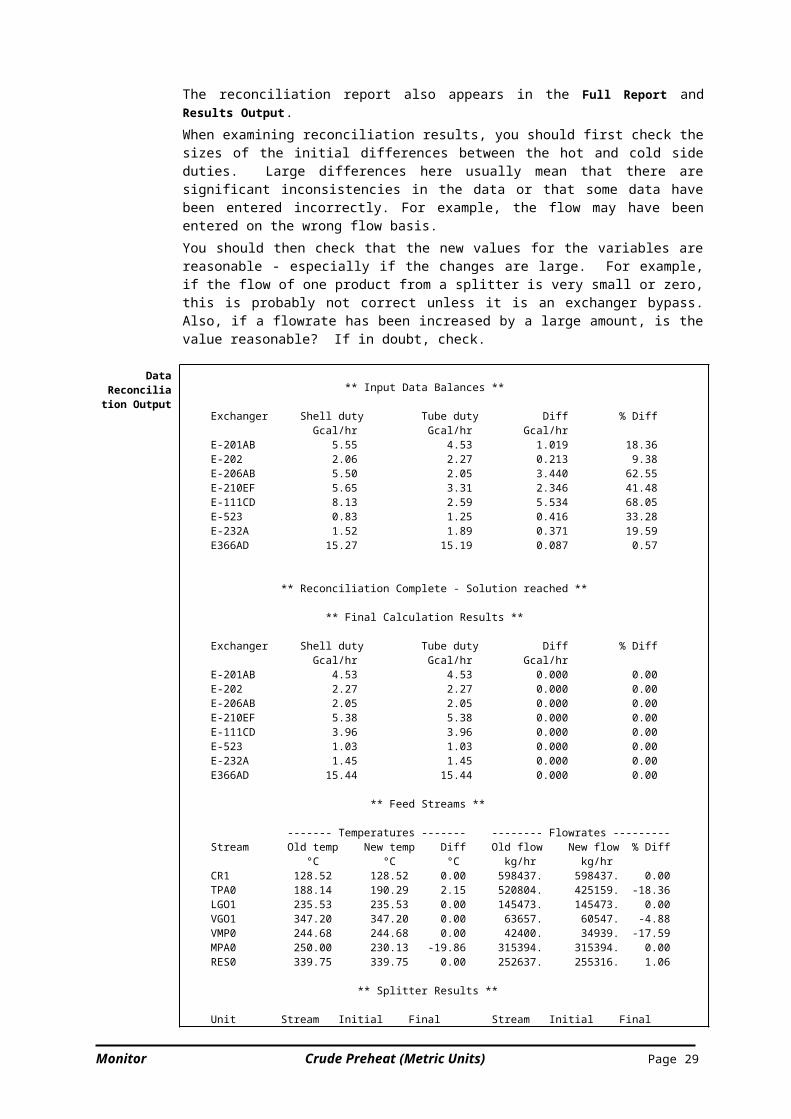
OutputSelect the Data Reconciliation Output option from the Output menu to view the report. If there are significant differences from the output below, you have some data error.The reconciliation report also appears in the Full Report and Results Output. When examining reconciliation results, you should first check the sizes of the initial differences between the hot and cold side duties. Large differences here usually mean that there are signi -ficant inconsistencies in the data or that some data have been entered incorrectly. For example, the flow may have been entered on the wrong flow basis.You should then check that the new values for the variables are reasonable - especially if the changes are large. For example, if the flow of one product from a splitter is very small or zero, this is probably not correct unless it is an exchanger bypass. Also, if a flowrate has been in -creased by a large amount, is the value reasonable? If in doubt, check.
Data Reconciliation
Output ** Input Data Balances **
Exchanger Shell duty Tube duty Diff % Diff Gcal/hr Gcal/hr Gcal/hr E-201AB 5.55 4.53 1.019 18.36 E-202 2.06 2.27 0.213 9.38 E-206AB 5.50 2.05 3.440 62.55 E-210EF 5.65 3.31 2.346 41.48 E-111CD 8.13 2.59 5.534 68.05 E-523 0.83 1.25 0.416 33.28 E-232A 1.52 1.89 0.371 19.59 E366AD 15.27 15.19 0.087 0.57
** Reconciliation Complete - Solution reached **
** Final Calculation Results **
Exchanger Shell duty Tube duty Diff % Diff Gcal/hr Gcal/hr Gcal/hr E-201AB 4.53 4.53 0.000 0.00 E-202 2.27 2.27 0.000 0.00 E-206AB 2.05 2.05 0.000 0.00
Monitor Crude Preheat (Metric Units) Page 19
E-210EF 5.38 5.38 0.000 0.00 E-111CD 3.96 3.96 0.000 0.00 E-523 1.03 1.03 0.000 0.00 E-232A 1.45 1.45 0.000 0.00 E366AD 15.44 15.44 0.000 0.00
** Feed Streams **
------- Temperatures ------- -------- Flowrates --------- Stream Old temp New temp Diff Old flow New flow % Diff °C °C °C kg/hr kg/hr CR1 128.52 128.52 0.00 598437. 598437. 0.00 TPA0 188.14 190.29 2.15 520804. 425159. -18.36 LGO1 235.53 235.53 0.00 145473. 145473. 0.00 VGO1 347.20 347.20 0.00 63657. 60547. -4.88 VMP0 244.68 244.68 0.00 42400. 34939. -17.59 MPA0 250.00 230.13 -19.86 315394. 315394. 0.00 RES0 339.75 339.75 0.00 252637. 255316. 1.06
** Splitter Results **
Unit Stream Initial Final Stream Initial Final Split1 CR4 0.5000 0.1872 CR6 0.5000 0.8127 Split2 CR12 0.5000 0.6176 CR10 0.5000 0.3823
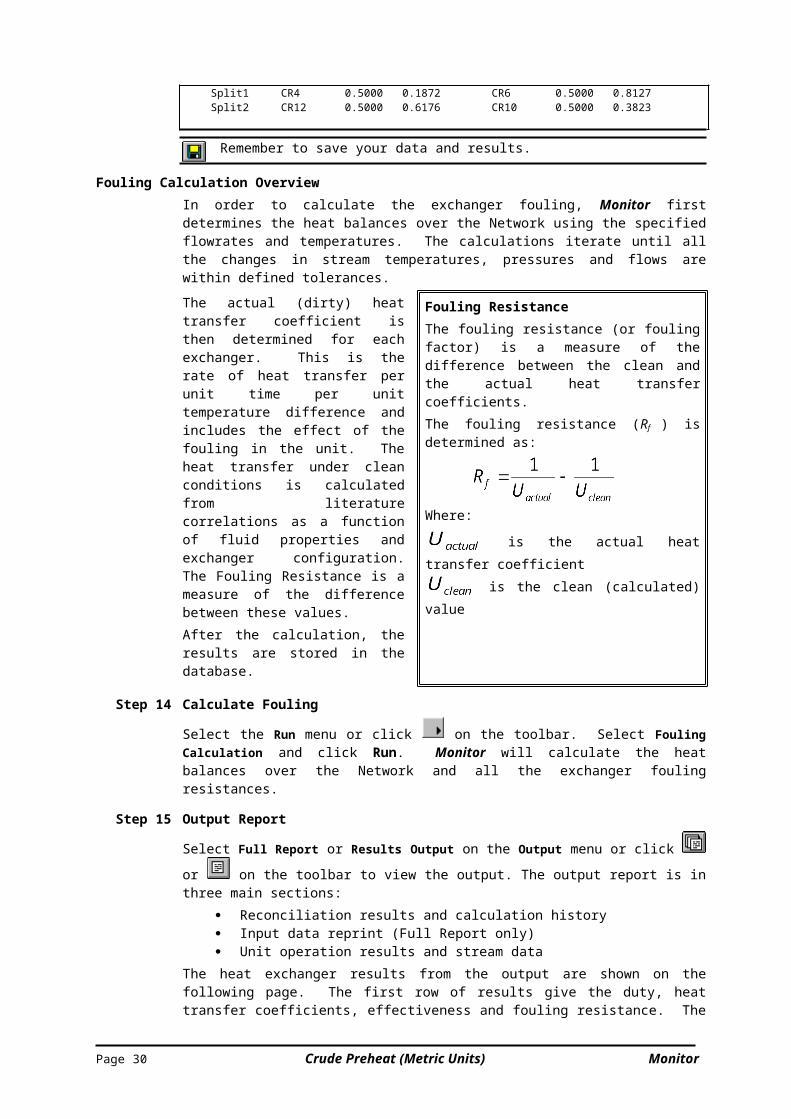
Remember to save your data and results.
Fouling Calculation OverviewIn order to calculate the exchanger fouling, Monitor first determines the heat balances over the Network using the specified flowrates and temperatures. The calculations iterate until all the changes in stream temperatures, pressures and flows are within defined tolerances.
The actual (dirty) heat transfer coeffi-cient is then determined for each ex-changer. This is the rate of heat transfer per unit time per unit temperature differ-ence and includes the effect of the foul-ing in the unit. The heat transfer under clean conditions is calculated from liter-ature correlations as a function of fluid properties and exchanger configuration. The Fouling Resistance is a measure of the difference between these values.After the calculation, the results are stored in the database.
Fouling ResistanceThe fouling resistance (or fouling factor) is a measure of the difference between the clean and the actual heat transfer coefficients.The fouling resistance (Rf ) is determined as:
Where:
is the actual heat transfer coefficient is the clean (calculated) value
Step 14 Calculate Fouling
Select the Run menu or click on the toolbar. Select Fouling Calculation and click Run. Monitor will calculate the heat balances over the Network and all the exchanger fouling resist -ances.
Step 15 Output Report
Select Full Report or Results Output on the Output menu or click or on the toolbar to view the output. The output report is in three main sections:
Reconciliation results and calculation history Input data reprint (Full Report only) Unit operation results and stream data
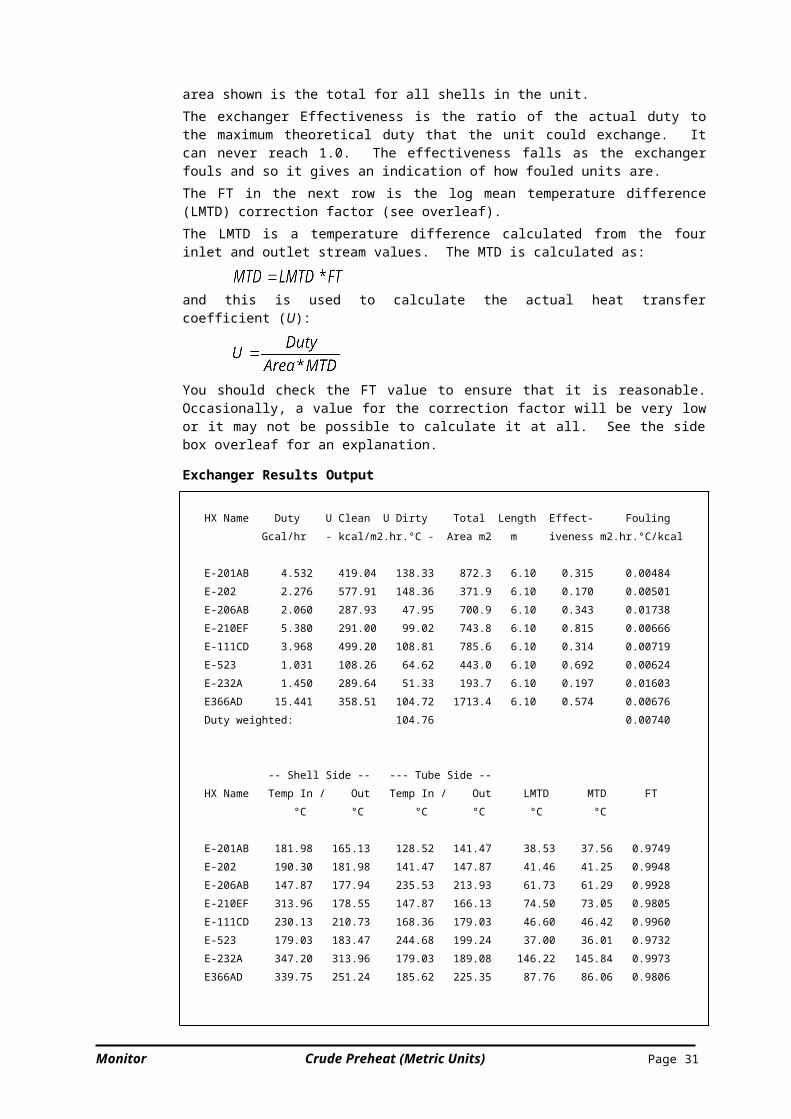
The heat exchanger results from the output are shown on the following page. The first row of results give the duty, heat transfer coefficients, effectiveness and fouling resistance. The area shown is the total for all shells in the unit. The exchanger Effectiveness is the ratio of the actual duty to the maximum theoretical duty that the unit could exchange. It can never reach 1.0. The effectiveness falls as the exchanger fouls and so it gives an indication of how fouled units are.
Page 20 Crude Preheat (Metric Units) Monitor
The FT in the next row is the log mean temperature difference (LMTD) correction factor (see overleaf). The LMTD is a temperature difference calculated from the four inlet and outlet stream values. The MTD is calculated as:
and this is used to calculate the actual heat transfer coefficient (U):
You should check the FT value to ensure that it is reasonable. Occasionally, a value for the cor-rection factor will be very low or it may not be possible to calculate it at all. See the side box overleaf for an explanation.
Exchanger Results Output
HX Name Duty U Clean U Dirty Total Length Effect- Fouling Gcal/hr - kcal/m2.hr.°C - Area m2 m iveness m2.hr.°C/kcal
E-201AB 4.532 419.04 138.33 872.3 6.10 0.315 0.00484 E-202 2.276 577.91 148.36 371.9 6.10 0.170 0.00501 E-206AB 2.060 287.93 47.95 700.9 6.10 0.343 0.01738 E-210EF 5.380 291.00 99.02 743.8 6.10 0.815 0.00666 E-111CD 3.968 499.20 108.81 785.6 6.10 0.314 0.00719 E-523 1.031 108.26 64.62 443.0 6.10 0.692 0.00624 E-232A 1.450 289.64 51.33 193.7 6.10 0.197 0.01603 E366AD 15.441 358.51 104.72 1713.4 6.10 0.574 0.00676 Duty weighted: 104.76 0.00740
-- Shell Side -- --- Tube Side -- HX Name Temp In / Out Temp In / Out LMTD MTD FT °C °C °C °C °C °C
E-201AB 181.98 165.13 128.52 141.47 38.53 37.56 0.9749 E-202 190.30 181.98 141.47 147.87 41.46 41.25 0.9948 E-206AB 147.87 177.94 235.53 213.93 61.73 61.29 0.9928 E-210EF 313.96 178.55 147.87 166.13 74.50 73.05 0.9805 E-111CD 230.13 210.73 168.36 179.03 46.60 46.42 0.9960 E-523 179.03 183.47 244.68 199.24 37.00 36.01 0.9732 E-232A 347.20 313.96 179.03 189.08 146.22 145.84 0.9973 E366AD 339.75 251.24 185.62 225.35 87.76 86.06 0.9806
-- Shell Side -- --- Tube Side -- HX Name Pres In / Out Pres In / Out Shell Flow Tube Flow Bar Bar Bar Bar kg/hr kg/hr
E-201AB 5.020 4.813 30.300 29.736 425159.9 598437.3 E-202 6.000 5.020 29.736 29.361 425159.9 598437.3 E-206AB 29.361 28.273 6.300 6.238 112057.4 145473.7 E-210EF 7.436 7.116 29.361 28.860 60547.2 486379.9 E-111CD 5.700 4.769 28.273 27.600 315394.3 598437.3 E-523 27.600 24.711 18.500 18.499 369612.8 34939.9 E-232A 7.500 7.436 27.600 27.397 60547.2 228824.5 E366AD 24.500 23.566 24.711 23.582 255316.2 598437.3
---- Shell Side ---- ---- Tube Side ----- Normalised
Monitor Crude Preheat (Metric Units) Page 21
HX Name Reynolds Velocity Reynolds Velocity U Value Number m/s Number m/s kcal/m2.hr.°C E-201AB 34382.48 0.63 26160.44 1.57 138.32 E-202 87308.66 1.50 33668.58 1.86 148.36 E-206AB 17967.31 0.68 17254.36 0.52 47.95 E-210EF 8541.65 0.33 30628.62 1.53 99.03 E-111CD 36635.28 0.97 41042.95 1.82 108.81 E-523 54199.61 1.80 2927.46 0.10 64.62 E-232A 11796.50 0.31 34458.63 1.42 51.33 E366AD 10482.34 0.56 47753.37 1.72 104.72
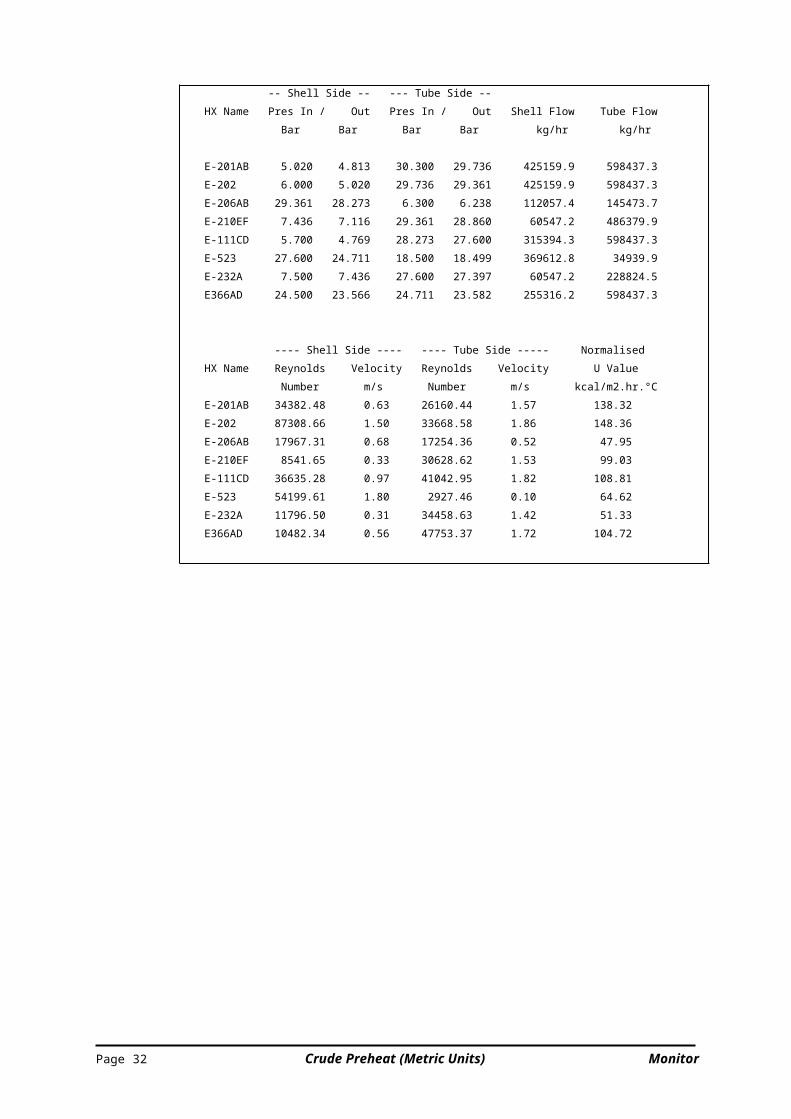
Output Report (Cont.)
You also ought to check the tube side Reynolds Number (Re). Exchangers are designed to operate with turbulent flow (Re > 10,000). If Re is less than this, it means either that you have a data error or the exchanger is being used for a dif-ferent service than it was designed for. If Reynolds Number is less than 2000, there may be a problem as Monitor does not model laminar flow. E-523 has a value for Re of less than 10,000 which is caused by the low tube velocity. The velocity would be expec-ted to be in the range 0.5 - 3 m/sec. Low velocities may lead to increased fouling. However, the fouling resist-ances table shows that this is not a prob-lem in this Network as this exchanger does not have high fouling.The Normalised U Value is the actual heat transfer coefficient from the NFIT Calculation and only appears if the NFIT has been calculated. This is the value generated from the current fouling using the Base Case conditions. A fall in the value of this coefficient will cor-respond to the increase in the fouling factor.
LMTD Correction factorThe LMTD is only correct for true counter-current (one shell and one tube pass) exchangers. The LMTD Correction Factor (FT) is used to correct the calculated LMTD for exchangers with more than one shell and/or tube pass. Values for the correction factor are calculated by literature meth-ods. For a single shell and tube pass exchanger, FT is always 1.0.The factor is a function of the four exchanger stream temperatures and the number of shell passes in the unit. The more shell passes, the higher the value of FT. A very low value of FT
(less than 0.75) means that the exchanger will not operate. It usually means that you are trying to specify much too close an approach and so there is insufficient area.If you have a low value for FT , then either:
- the exchanger is not operating correctly - you have incorrect measured dataUsually it is the data which are incorrect. First ensure that you have the correct number of shell side passes - check TEMA type and number of shells in series/parallel. If correct, then one, or more, of the four temperatures must be wrong.
Exchanger MonitoringOverview Monitoring involves determining how fouling in a heat exchanger network changes with time.
This enables you to: calculate the cost of fouling determine when exchangers require cleaning establish which exchangers need to be cleaned demonstrate the efficacy of an antifoulant treatment programme identify other problems which affect the heat transfer
How is Fouling Monitored?Temperatures, flowrates and stream properties are measured regularly and used in Monitor to calculate the fouling in each heat exchanger. Individual sets of fouling factors are of limited value other than to indicate which exchangers may be more heavily fouled. What matters is the rate at which the fouling is increasing. Cases of measured data are entered over a period of time and results are stored in Monitor’s database. The fouling trends can then be exported to Excel and plotted over the required monit -oring period.
Page 22 Crude Preheat (Metric Units) Monitor
Cost of FoulingFouling costs money. The loss of duty in fouled exchangers must be made up in the furnace or throughput will drop. Also, the deposits may reduce the diameter of the tube which leads to in-creased pressure drops and higher pumping costs.What you need to determine is the additional cost incurred by the fouling - or the saving by us-ing a treatment program to control it. As the additional cost involved is primarily the increased furnace duty, we can monitor the fouling by studying the temperature of the furnace inlet stream.However, we cannot simply measure the furnace inlet temperature and plot it or use it to calculate additional furnace costs. All the Case data, such as flowrates, feed temperatures and properties, change all the time. When a different type of crude is introduced, there will be changes throughout the Network. The effect of these changes on the measured furnace inlet temper-ature will swamp any changes due to fouling.NFIT (Normalised Furnace Inlet Temperature)We need a way of determining the effect of the fouling resistances on the furnace inlet temperature which is not affected by process changes. We therefore select a Base Case set of Case data. The set of flows, feed temper-atures, properties, etc. from the Base Case are then used with the calculated fouling resistances from the current Case to calculate all the exchanger exit temperatures and the NFIT. The only data which change in the NFIT calculation for different Cases are the calculated fouling resistances. Hence, the change in NFIT over the mon-itoring period are due only to changes in the fouling. Monitor can then calcu-late the fouling loss which is the cost of the additional duty required to re-store the NFIT to its original value. See the Economic Analyses section of this workbook for more information.The first set of Case data in the monitoring period is generally used as the Base Case although any data could be used. The main criterion is that the data are the same for all NFIT calculations.
Crude Preheat Example – NFIT Calculation
Step 16 NFIT OptionsSelect a Base
CaseThe Base Case is selected in the Run Network Calcula-tions window before running the NFIT Calculation.
Select the Run menu or click on the toolbar and se-lect NFIT Calculation. Because no Base Case has been selected, the caption on the Select Base Case but-ton is red. Click on the button to select a Base Case.Select the Case that you have just run and click Select. This Case will be used as the Base Case for all future Cases unless you change the selection
.Specify the
Furnace Inlet Stream
The Furnace Inlet Stream button is also red be-cause no stream has been selected. Click on the but-ton and select stream “CR15” from the drop-down list for the first furnace inlet stream.Click OK to save the selection. This will be used for all future Cases unless you change the selection. It is also used for Cleaning Economics and Splitter Optimisation calculations
Step 17 Calculate the NFITClick Run to calculate the NFIT. Monitor uses the data from the Base Case, with the fouling factors from the current Case, to calculate all the exchanger exit temperatures. The only data from the NFIT Calculation which are stored in the database with the current Case are the tem -
Monitor Crude Preheat (Metric Units) Page 23
perature and enthalpy of the furnace inlet stream.Select the NFIT Calculation option from the Output menu to view the results.
** Solving Network Balances **
Iteration Max Temp error Max Pres error Max Flow error 1 0.0016 0.0001 0.0000
** Network Converged **
** NFIT Calculation Results **
Exchanger Fouling Shell exit Tube Exit Name Factor Temperature Temperature m2.hr.°C/kcal °C °C E-201AB 0.00484 165.13 141.47 E-202 0.00501 181.98 147.87 E-206AB 0.01738 177.94 213.93 E-210EF 0.00666 178.55 166.13 E-111CD 0.00718 210.73 179.03 E-523 0.00623 183.47 199.23 E-232A 0.01602 313.96 189.08 E366AD 0.00676 251.23 225.35
Normalised Furnace Inlet Temperature: CR15 225.35 °C
The NFIT is also printed at the foot of the first page of the Full Report and Results Output.
Remember to save your data and your results.
Page 24 Crude Preheat (Metric Units) Monitor
Importing DataWhen monitoring a Network, you may enter sets of Case data individually. However, refineries usually have their information systems linked to a spreadsheet and the data can be imported dir -ectly into Monitor. You may also import historical process data from a spreadsheet and use them to demonstrate the cost of fouling in the past.
Crude Preheat Example - Data Import
Step 18 Add Instrument TagsIn order to import the Case data, you must first allocate the instrument tags to the process para -meters so that Monitor can set the values. When importing property data, property identifiers must be supplied. Select Tag Allocation from the Network Menu to open all the windows for tag allocation in turn.
Supply tag names
The tag names are first entered for the exit temperatures on each exchanger. There are no tags for the exchanger pressures or for the mixers or splitters.Enter the exchanger tag names below ensuring that you include the space after the first two char-acters. Click Next three times, to pass over the mixers and splitters and then enter the tags for the feed stream temperatures and flowrates.
Exchanger Temperature Tags Feed Temperature and Flowrate Tags
Unit Name
Shell ExitTemperature
Tube ExitTemperature
Feed Name
Feed Temperature
Feed Flowrate
E-201AB TI 0301 TI 0311 CR1 TI 0151 F3 F003E-202 TI 0133 TI 0193 TPA0 TI 0005 F3 F023E-206AB TI 0032 TI 0021 LGO1 TI 0241 FH F321E-210EF TI 0182 TI 0065 MPA0 - F3 F232E-111CD TI 0026 TI 0039 VGO1 TI 0103 F3 F110E-523 TI 0087 TI 0091 VMP0 TI 0009 F3 F521E-232A TI 0062 TI 0055 RES0 KR 2123 F3 2123
E-366AD TI 0190 TI 0175
Enter PropertyIdentifiers
Property identifiers are used in the same way as tag names except they identify feed stream properties rather than measured temperatures, pres-sures and flowrates.They are entered in the Property Identifiers window. This is opened from the Feed Stream Tag Alloca-tion window by clicking Enter Iden-tifiers for the required feed. In this network, we have gravity data for the crude feed so click Enter Identifiers for stream CR1.
Monitor Crude Preheat (Metric Units) Page 25
You must first select a Stream Type for your feed. This does not specify the type for the stream – that is done in the Case data. It merely makes available the fields which are appli-cable for the selected type.Identifiers are only supplied for the measured data values. Temperatures for two-point viscosity or percent cut points for assays are supplied in the Case data.Components must have already been selected if you are entering composi-tion or lightend identifiers.For CR1, select the Liquid Hydro-carbon type.The only data that we have for CR1 is the gravity so enter “CR1 Grav” for the Gravity identi-fier.
You can enter/modify tag names and property identifiers for individual units or streams by right-clicking and then selecting Tag Allocation from the shortcut menu.
Step 19 Import the Case DataSpreadsheet The data are in the spreadsheet named “Met-
ric Preheat.xls” which accompanies this work-book. If you did not install the workbooks from the CD-ROM, run setup again to do so. Use Excel to view the spreadsheet and examine the format. A section of the spreadsheet is shown here. The Tag and identifier names must be in a row with the word Date at the beginning. The rows with column 1 blank are comments. The order of the tags and identifiers in the spreadsheet does not matter.
Select Case All the required data for a Case are not included in the spreadsheet. It only contains feed temperatures and rates and specifications for exchangers and other unit operations. For example, it does not contain information about the stream types.To avoid having to enter these data for all imported Cases, they are copied from an existing Case which you specify.Select the Import from Spreadsheet option on the Cases Menu. This opens the window where you select the default Case to supply missing data.As you only have one Case in your Network, it is already selected in the list and you can simply press <Enter> to se-lect it.
Select Spread-sheet
You are now asked for the spreadsheet name. If you are using Excel 5 or later, you may also enter the worksheet name. If no worksheet is specified, the first sheet is used. You may either enter the spreadsheet name “Metric Preheat.xls”, with its path if required, or use Browse to locate it on your computer.
If you use Browse to locate the worksheet, Monitor opens (and closes) the spreadsheet and presents the names for you to select from in a list.
Page 26 Crude Preheat (Metric Units) Monitor

Import Data When you click OK, you are warned that there is a missing tag name for stream MPA0. There is no measured temperature and so no tag. You would also be warned about potential problems such as tags which have no data in the spread-sheet or duplicate tags in the spreadsheet.Click “Yes” to continue.The Cases will be loaded into the Monitor database and then checked. The progress is shown in your screen.
After the Cases have been imported, you are told that there are errors in the spreadsheet data so click “Yes” to view the error log. This shows that the first few Cases had a missing tube side temperature value for E-232A. As this is the exchanger specification, these Cases cannot be calculated.The best course of action is to use the Delete option in the Existing Cases window to delete the Cases between 21/05/2000 and 24/05/2000 which have missing data.
Remember to save your data.
Step 20 Data Reconciliation for a Range of CasesOn the Run Network Calculations window, select Data Reconciliation. If you have a current Case selected, select the Range of Cases option. If you do not have a current Case, this option will already be selected. The default dates shown in the selection boxes are the range of impor -ted Cases. Click Run to initiate the calculations.At the end of the calculation, you are informed that four of the Cases failed and one has a warning. To see which Cases failed, open the Existing Cases window. All Cases will show Solved, Failed or Warning in the Recon column.To view the reconciliation results, select the Calculation Histories option from the Output menu. This will show the results for all Cases and you can browse the report to see the reasons for the failures. In this Network, the failed Cases all had temperature errors in the exchanger Case data. This is the most common cause of failed reconciliations. Another frequent problem is when a flowrate has a large increase which causes a very high pressure drop. This can lead to a negative pressure in the network. The warning was for a flowrate going to zero.
To see the output from the failed calculations, use the Find feature to locate occurrences of the word “Error”.
Step 21 Reconciliation Spreadsheet OutputThe easiest way to compare reconciliation results for a range of Cases is to plot them in Excel.Select the Spreadsheet Output option from the Output menu and select the Reconcili-ation Report. Then select the required Cases for Report and click Export.One worksheet is created in the spreadsheet for each exchanger and feed stream.
E-232A The Initial Duty Error plot for E-232A shows that the difference between shell and tube side duties is fairly constantThe Initial Duties plot shows that the duty curves have very similar shapes.
Monitor Crude Preheat (Metric Units) Page 27
This suggests that there is a measurement error but it is reasonably constant for all Cases.
Exchanger E-232A Initial Duties
0
0.5
1
1.5
2
2.5
3
14-May-00 24-May-00 03-J un-00 13-J un-00 23-J un-00 03-J ul-00 13-J ul-00 23-J ul-00 02-Aug-00 12-Aug-00
Case Date
Dut
y G
cal/h
r
Shell Data Tube Data
E-523 For exchanger E-523, the Initial Duties plot shows very little correspondence between the shell and tube side duties.This is caused by large variations in the VMP0 flowrate. In this situation, it is always worth checking that the flowrate does fluc-tuate. Otherwise it may be faulty instrumentation.Even though the initial er-rors were large, the Final Duties plot shows that the reconciliation has brought the duties into line. The shell side duty has been changed by Split 2 but much of the change is on the tube side by the variation in the flowrate of VMP0.
Exchanger E-523 Initial Duties
0
0.5
1
1.5
2
2.5
3
14-May-00 24-May-00 03-J un-00 13-J un-00 23-J un-00 03-J ul-00 13-J ul-00 23-J ul-00 02-Aug-00 12-Aug-00
Case Date
Dut
y G
cal/h
r
Shell Data Tube Data
Exchanger E-523 Final Duties
0
1
2
3
4
5
6
14-May-00 24-May-00 03-J un-00 13-J un-00 23-J un-00 03-J ul-00 13-J ul-00 23-J ul-00 02-Aug-00 12-Aug-00
Case Date
Dut
y G
cal/h
r
Shell Data Tube Data
All exchangers and streams are included in the report even if not varied by the reconciliation.
Step 22 Fouling Calculations for a Range of CasesOn the Run Network Calculations window, select Fouling Calculation. Ensure that the Range of Cases option is selected and click Run. You are asked if you wish to calculated the failed reconciliation Cases. Including reconciled and unreconciled cases in output plots will introduce inconsistencies in the trends so click “No”. As with reconciliation, if any Cases had failed you could see which they were in the Existing Cases window and the Calculation Histories output report would show the errors in the histor-ies from the calculations.
Step 23 NFIT Calculations for a Range of CasesRepeat the procedure to run the NFIT Calculations. Only those Cases where the Fouling Calcu-lation solved will be run.Again, you could see which Cases failed in the Existing Cases window and the Calculation Histories output report will show the histories from the calculations.
Remember to save your results.
Step 24 Spreadsheet Output
Page 28 Crude Preheat (Metric Units) Monitor
After calculating a range of Cases, the best way to view the results is graphically. Plots are created in Excel using the Spreadsheet Output option from the Out-put menu. You may select a predefined report or you may create your own by clicking New for a User Defined Report.Select the Heat Transfer Report.As well as the NFIT for the furnace inlet streams, this report shows the following for each exchanger:
- duty - fouling resistance - clean, actual and normalised heat transfer coefficients- shell and tube side velocities- tube side velocity- exchanger effectiveness (ratio of actual to maximum duty exchanged)
Accept the default dates (which include all Cases) and options and click OK. Excel will be opened to create the plots. When Excel opens, it may ask if you wish to enable macros. You must select the Enable Macros option to load the data and generate the plots.
If you have Excel 97, you may get a “Not enough memory” error. This is due to a known problem in Excel. As long as you have Excel 97 SR-2, there is a fix for this in your Monitor program directory. See the “Excel Memory Problem” help topic for de-tails.
If the Plot data in spreadsheet option is selected, the NFITs (if calculated) are plotted on the first worksheet. The data for each exchanger are then plotted on separate worksheets. There is an initial slow drop in the NFIT which suggests that the fouling is under control. The temperature increases due to exchanger cleaning on the 11/6/00 and slowly falls again. After about the 17/7/00, the rate of de-crease in the NFIT in-creases significantly.
Stream CR15 NFIT Plot
205
210
215
220
225
230
235
14-May-00 24-May-00 03-J un-00 13-J un-00 23-J un-00 03-J ul-00 13-J ul-00 23-J ul-00 02-Aug-00 12-Aug-00
Case Date
NFI
T °C
This must correspond to a change in the treatment program or the introduction of a more foul-ing, crude. The rate of fouling seems to have been reduced by the end of the monitoring period. The spreadsheet can be saved in the normal way to a named file before closing Excel.
Economic AnalysisFouling trends can be shown by plotting the fouling factors or the NFIT (normalised furnace in-let temperature). However, what you want to know is how much this is costing and what to do about it. A dollar means more than a Btu or a degree temperature change.Monitor can show the cost of fouling over the monitoring period in terms of the additional fur-nace duty which is required to make up for the reduced heat transfer in the preheat exchangers. You can then analyse Cases to see where the loss is greatest and the benefits of cleaning ex-changers – both individually or in groups.
Step 25 Economic DataEconomic
DataBefore using economic results, ensure that you are using the correct economic data. Select the Economic Data option on the Network Menu. Select Global Data from the sub-menu and check the values for
Monitor Crude Preheat (Metric Units) Page 29
Fuel Cost, Furnace Efficiency and Length of Plant Run.
The default Fuel Cost is for oil based on Solomon’s performance analysis.Selecting Exchanger Economic Data en-ables you to supply or modify items for each exchanger.The Date Last Cleaned must be supplied in order to determine the optimum clean-ing cycles. From the plot of the NFIT, we can see when the network was last cleaned. Enter the date “17/07/00” for all exchangers. Leave all other data at the de-fault values.
The cleaning analyses will always be calculated for each exchanger individually. You could also investigate the effect of cleaning combinations of exchangers by selecting the User Defined Combinations option from the sub-menu and specifying the required combinations.
Step 26 Fouling Cost SummaryAs long as you have calculated the NFIT for the required Cases, you may generate a Fouling Cost Summary spreadsheet report. The report shows the additional costs when the furnace makes up the duty lost because of the fouling.
Cost ofFoulingReport
Select the Spreadsheet Output option on the Output Menu and select the Fouling Cost Summary report. By default, the Cases for Report includes all Cases. From the plot of the NFIT, we can see that the network has been cleaned so select the From Case as “17/07/00” to start after the exchangers were cleaned.
The report shows:
The Cost/day of the additional furnace duty required to make up for the network duty loss caused by the current level of fouling.
The cumulative additional furnace duty required since the start of the specified period. The cumulative fuel cost of the exchanger fouling since the start of the specified
period. The normalised furnace inlet temperature - the additional furnace duty required to
maintain the furnace e xit temperature is a direct result of the drop of this temperature.
Click OK to transfer the data to Excel. Part of the output is shown below.
If the Plot data in spreadsheet option is selected, the a plot is created for each column in the
Page 30 Crude Preheat (Metric Units) Monitor
worksheet. The spreadsheet can be saved in the normal way to a named file.
Cost/day
0
200
400
600
800
1000
1200
1400
1600
1800
2000
13-J ul-00 18-J ul-00 23-J ul-00 28-J ul-00 02-Aug-00 07-Aug-00 12-Aug-00
Case Date
$/d
ay
The Cost/day plot shows a steady increase in the cost/day over most of the period although the rate of increase has fallen towards the end.
Step 27 Cleaning EconomicsThe Fouling Cost Summary report can show that action is needed to reduce the fouling in an ex -changer network. The next question is likely to be “Which exchangers are fouled and what do we gain by cleaning them?”. This is the question that the Cleaning Economics feature in Mon-itor has been designed to answer. It also determines the optimum cleaning cycle for each ex -changer, and defined group of exchangers, in the Network.Select the last Case (07/08/2000) for the Network either in the Existing Cases window or from the Current Case drop-down list on the toolbar. There is little point in looking at cleaning eco-nomics for any Case other than the most recent. Then select Cleaning Economics in the Run Network Calculations window and click Run to initiate the calculation.The calculation solves the Network with each exchanger in turn bypassed to calculate the cost of removing the exchangers. It then sets each exchanger in turn to its clean fouling factor and solves the Network to obtain the increase in performance.
Cleaning Economics
Report
Select the Cleaning Report on the Output Menu to generate the report. This is shown on the next page.The report is in three sections:1. Cost of removing exchangers: This shows the effect on furnace duty or throughput when the unit is removed for cleaning. The report shows the current duty of the unit along with the decrease in network duty which must be made up by the furnace. The lost network duty ap-proaches the unit duty for exchangers nearer to the furnace. The cost of removing the ex-changer is shown both as the additional fuel cost/day to make up the duty and as the loss in throughput if the duty was not made up by the furnace.
2. Savings from Cleaning: This shows the increase in network duty after a unit has been cleaned. The savings are shown both as a reduced furnace cost to maintain current operation and as an increased throughput which could be achieved if furnace duty was not reduced.3. Optimum Cleaning Cycles: The optimum shown is the period which provides the lowest an-nualised cost of fouling. This cost includes the additional furnace duty caused by the fouling, the fixed cleaning cost and the cost of taking the exchanger offline. The savings shown are compared with the cost of cleaning once at the end of the plant run.
Cleaning Economics Report
Monitor Cleaning Economics Report ---------------------------------
Network: preheat.mon
Monitor Crude Preheat (Metric Units) Page 31
Case: 07/08/2000 0:00:00
Cost of removing exchangers for cleaning
Exchanger Current Network Duty Additional Throughput CR15 Removed Duty Decrease Fuel Cost Loss Temp Gcal/hr Gcal/hr $/day kg/day °C
NONE - - - 205.45E-201AB 5.97 3.018 840 1,190,142 197.17E-202 2.48 0.880 245 347,082 203.04E-206AB 2.56 1.692 471 667,192 200.81E-210EF 4.25 2.765 770 1,090,576 197.86E-111CD 2.71 2.018 562 795,781 199.92E-523 2.25 1.820 507 717,941 200.46E-232A 1.48 0.449 125 177,247 204.22E366AD 12.69 12.690 3,535 5,003,944 169.97
Savings by cleaning selected exchangers
Exchanger Duty Fuel Additional CR15 Cleaned Increase Savings Throughput Temp Gcal/hr $/day kg/day °C
ALL 21.235 5,916 8,373,780 261.35E-201AB 1.652 460 651,498 209.94E-202 1.506 420 593,967 209.54E-206AB 0.598 167 235,922 207.08E-210EF 0.714 199 281,703 207.39E-111CD 6.750 1,881 2,662,027 223.64E-523 5.060 1,410 1,995,465 219.13E-232A 0.819 228 322,989 207.68E366AD 10.001 2,786 3,943,771 232.26
Optimum Cleaning Cycles
Exchanger Optimum Cycle Cost of Fouling Savings Days $/yr $/yr
E-201AB 301 36,314 34,532E-202 296 32,546 31,890E-206AB 482 21,031 7,448E-210EF 456 23,711 9,694E-111CD 145 71,334 202,415E-523 166 61,401 144,932E-232A 397 23,672 13,260E366AD 152 110,807 295,447
This report shows that E-366AD is the best candidate for cleaning. It has the largest duty and virtually half of the savings which could be generated by cleaning the entire Network will be realised by cleaning only this exchanger.The other exchangers which should be considered for cleaning are E-111CD and E-523.
The Optimum Cleaning Cycle results will be different because of the length of time since last cleaning.
Page 32 Crude Preheat (Metric Units) Monitor


