16
Microsimulation approach in fertility projections Paweł Strzelecki Warsaw School of Economics GRAPE internal seminar 2015.10.23 Group for Research in Applied Economics
| Date post: | 12-Apr-2017 |
| Category: |
Economy & Finance |
| Upload: | grape |
| View: | 224 times |
| Download: | 2 times |

Microsimulation approach in fertility projections
Paweł Strzelecki
Warsaw School of Economics
GRAPE internal seminar 2015.10.23
Group for Research in Applied Economics
Outline
1. Fertility assumptions in classical population projections
2. Microsimulation and agent based models
3. Application of microsimulation in the project: AGEING „Fiscal and welfare effects of changes in fertility and health in an aging society –
insights from OLG modelling”
2
1.1 Idea of ASFR
3
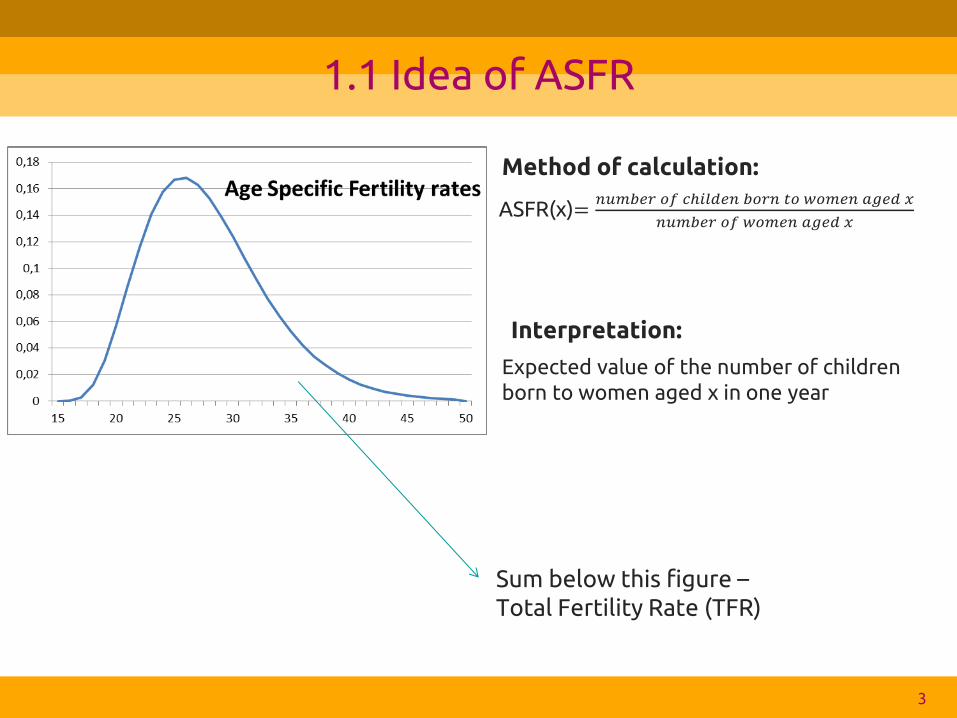
Sum below this figure – Total Fertility Rate (TFR)
ASFR(x)=𝑛𝑢𝑚𝑏𝑒𝑟 𝑜𝑓 𝑐ℎ𝑖𝑙𝑑𝑒𝑛 𝑏𝑜𝑟𝑛 𝑡𝑜 𝑤𝑜𝑚𝑒𝑛 𝑎𝑔𝑒𝑑 𝑥
𝑛𝑢𝑚𝑏𝑒𝑟 𝑜𝑓 𝑤𝑜𝑚𝑒𝑛 𝑎𝑔𝑒𝑑 𝑥
Method of calculation:
Interpretation:
Expected value of the number of children
born to women aged x in one year
1.2 Cohort-component method
4
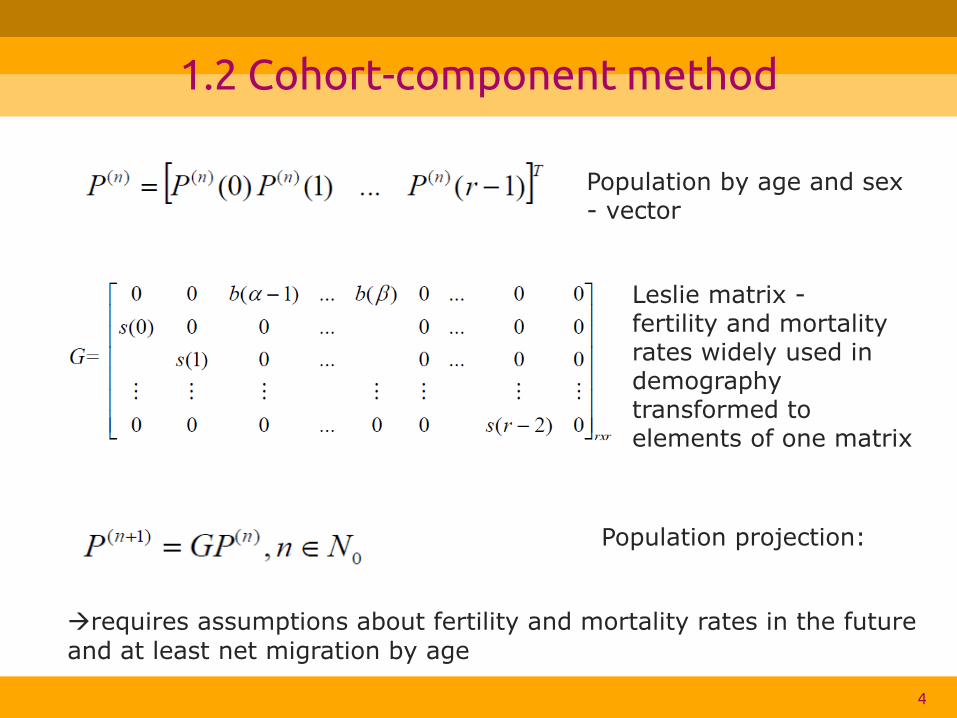
Population by age and sex - vector
Leslie matrix - fertility and mortality rates widely used in demography transformed to elements of one matrix
Population projection:
requires assumptions about fertility and mortality rates in the future
and at least net migration by age
1.3 ASFRs – projections in practice
5
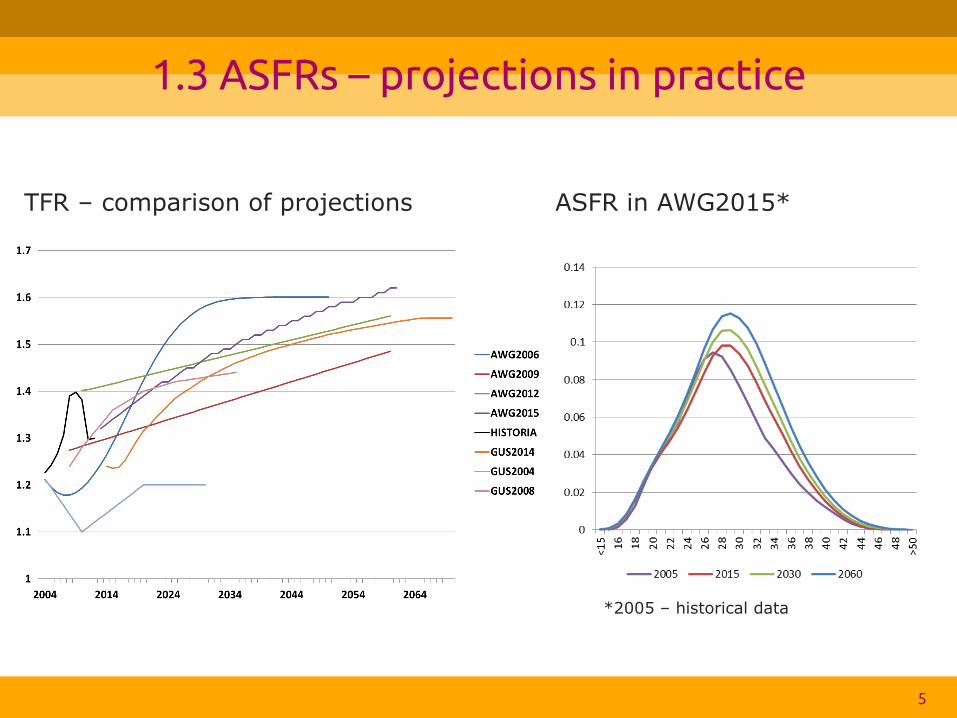
TFR – comparison of projections ASFR in AWG2015*
*2005 – historical data
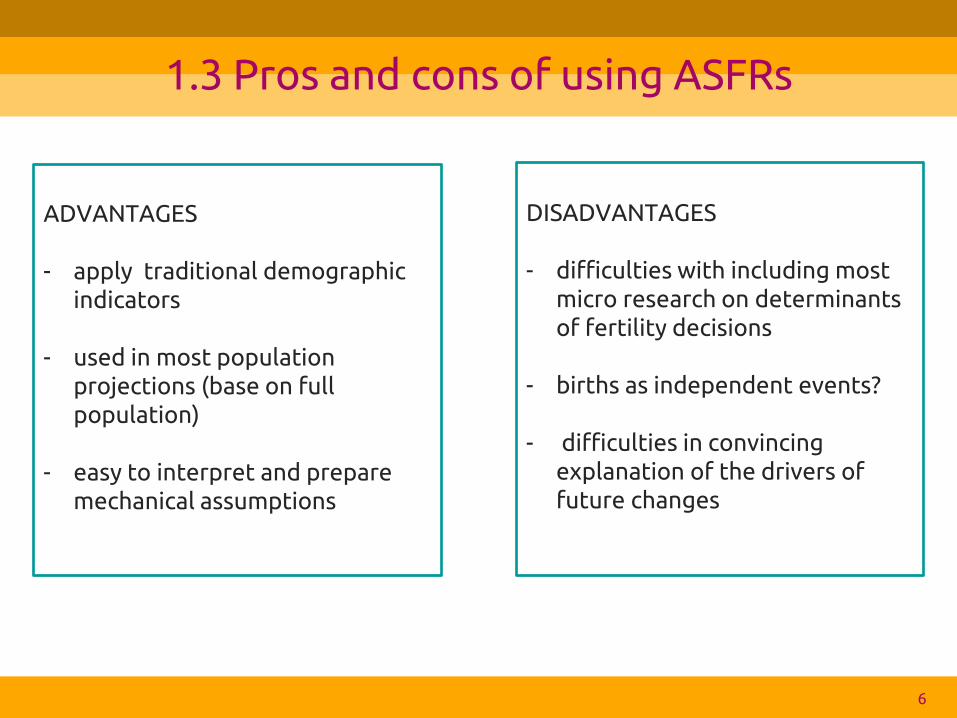
1.3 Pros and cons of using ASFRs
6
DISADVANTAGES
- difficulties with including most
micro research on determinants of fertility decisions
- births as independent events?
- difficulties in convincing explanation of the drivers of future changes
ADVANTAGES - apply traditional demographic
indicators
- used in most population projections (base on full population)
- easy to interpret and prepare
mechanical assumptions
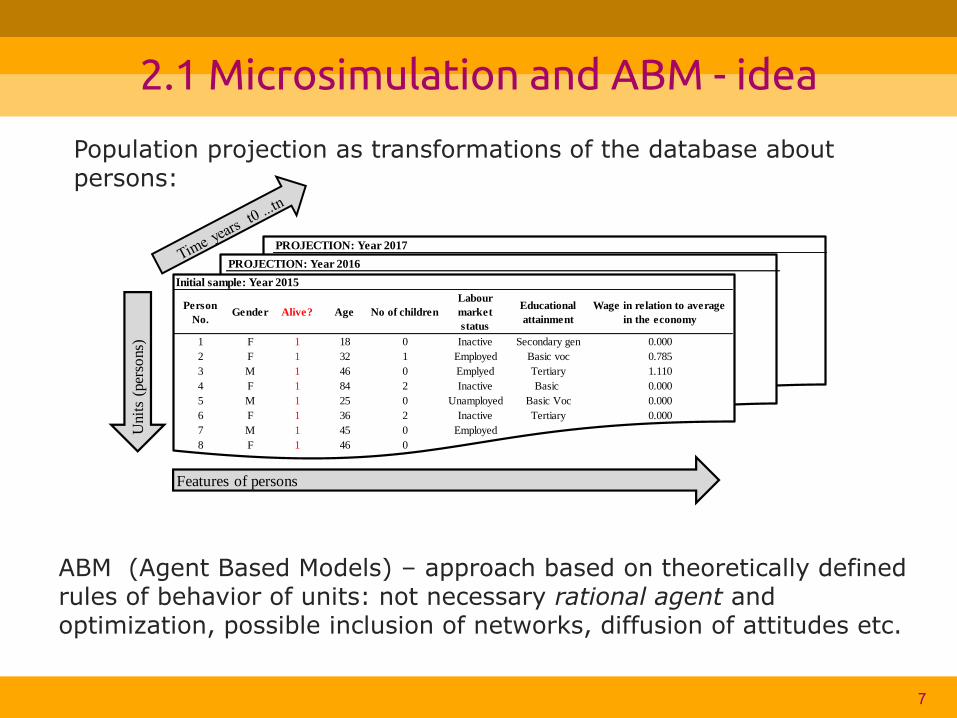
2.1 Microsimulation and ABM - idea
7
PROJECTION: Year 2017
PROJECTION: Year 2016
Initial sample: Year 2015
Person
No.Gender Alive? Age No of children
Labour
market
status
Educational
attainment
Wage in relation to average
in the economy
1 F 1 18 0 Inactive Secondary gen 0.000
2 F 1 32 1 Employed Basic voc 0.785
3 M 1 46 0 Emplyed Tertiary 1.110
4 F 1 84 2 Inactive Basic 0.000
5 M 1 25 0 Unamployed Basic Voc 0.000
6 F 1 36 2 Inactive Tertiary 0.000
7 M 1 45 0 Employed
8 F 1 46 0
Unit
s (p
erso
ns)
Features of persons
ABM (Agent Based Models) – approach based on theoretically defined rules of behavior of units: not necessary rational agent and optimization, possible inclusion of networks, diffusion of attitudes etc.
Population projection as transformations of the database about persons:
8
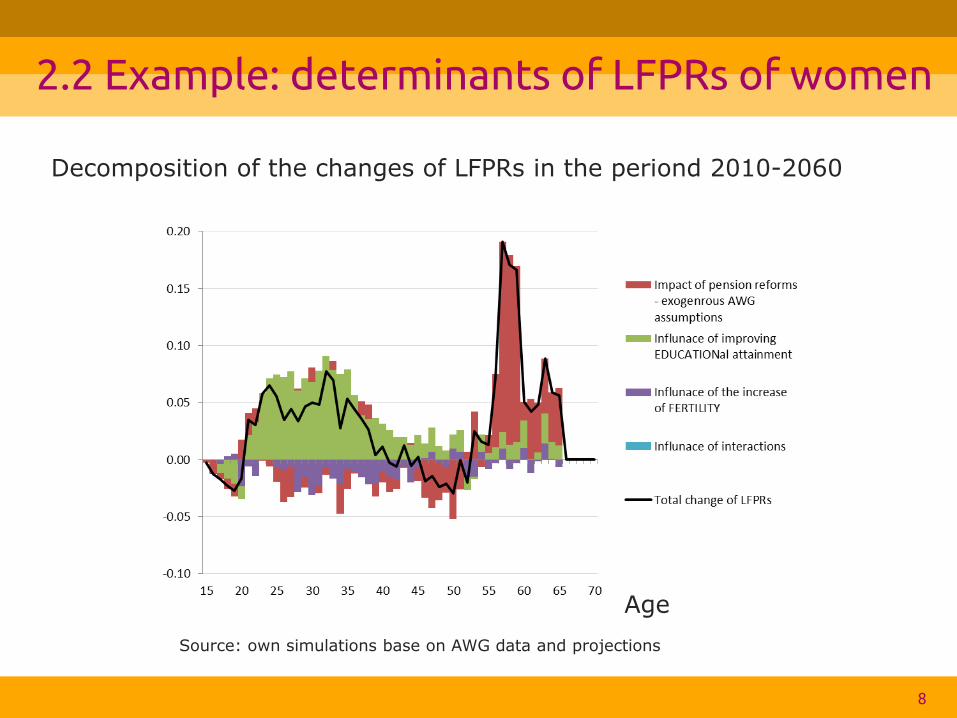
2.2 Example: determinants of LFPRs of women
Decomposition of the changes of LFPRs in the periond 2010-2060
Source: own simulations base on AWG data and projections
Age
9
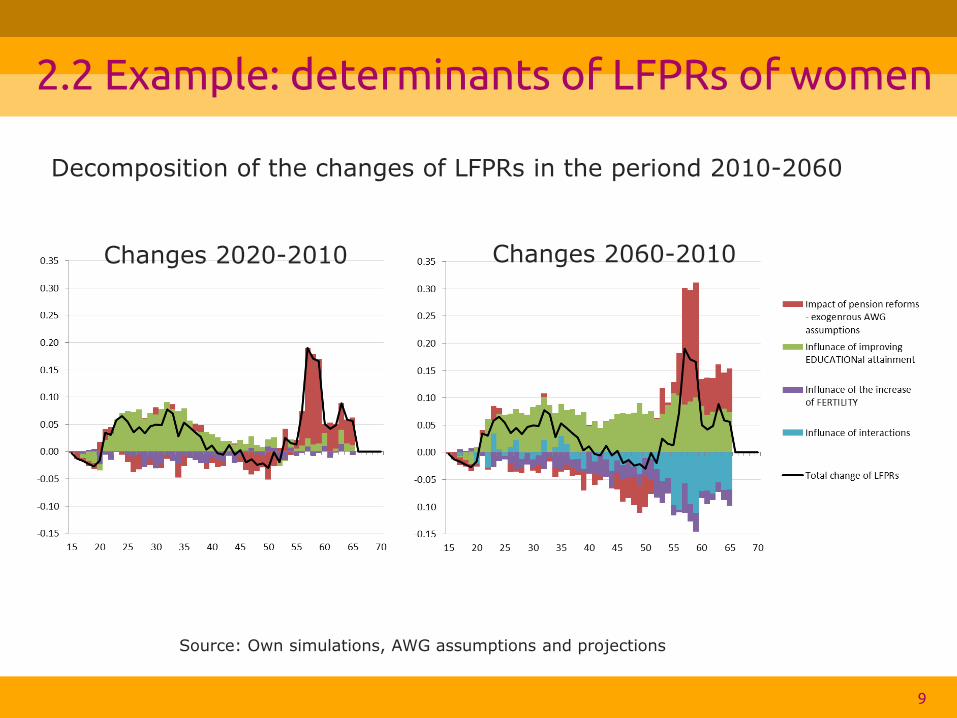
2.2 Example: determinants of LFPRs of women
Decomposition of the changes of LFPRs in the periond 2010-2060
Source: Own simulations, AWG assumptions and projections
Changes 2020-2010 Changes 2060-2010
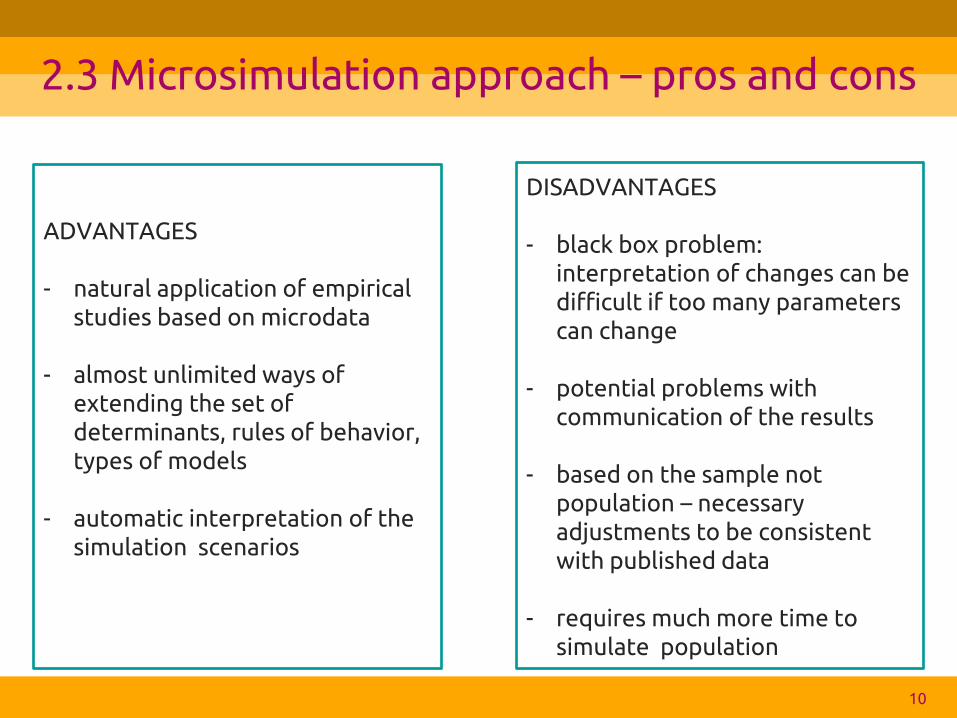
2.3 Microsimulation approach – pros and cons
10
DISADVANTAGES - black box problem:
interpretation of changes can be difficult if too many parameters can change
- potential problems with communication of the results
- based on the sample not
population – necessary adjustments to be consistent with published data
- requires much more time to simulate population
ADVANTAGES - natural application of empirical
studies based on microdata
- almost unlimited ways of extending the set of determinants, rules of behavior, types of models
- automatic interpretation of the
simulation scenarios
3.1 Application to AGEING project
11
Aim of microsimulation – preparing fertility scenarios in the form of ASFRs but with reliable interpretation based on empirical research
Idea in the OLG model: differences in behavior of households with different number of children
Microsimulation should include the number of children
but also factors influencing fertility.
12
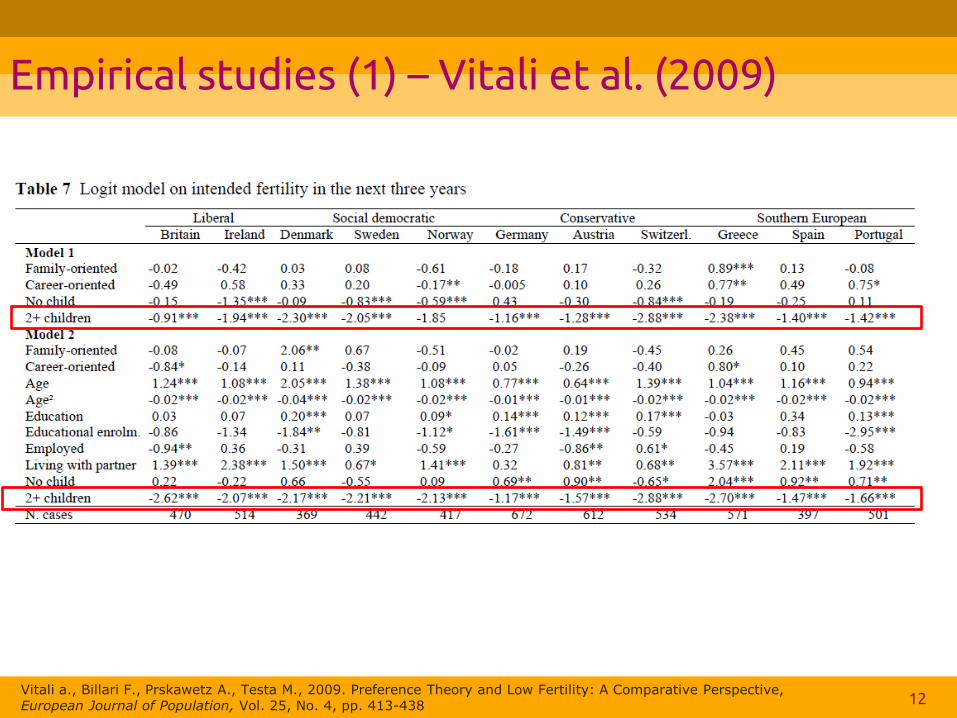
Empirical studies (1) – Vitali et al. (2009)
Vitali a., Billari F., Prskawetz A., Testa M., 2009. Preference Theory and Low Fertility: A Comparative Perspective, European Journal of Population, Vol. 25, No. 4, pp. 413-438
13
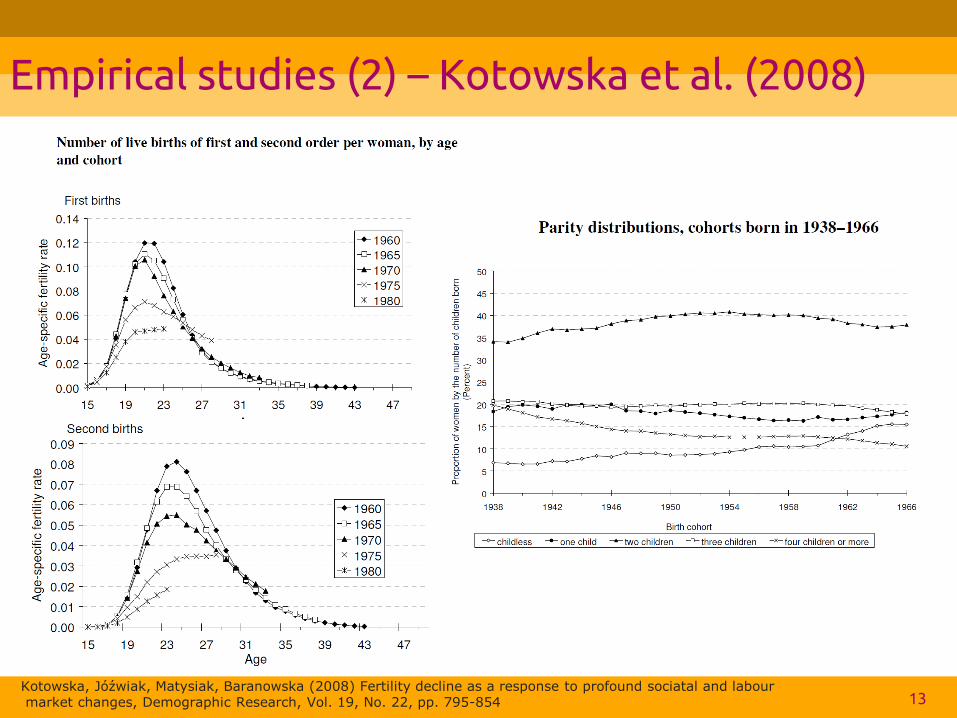
Empirical studies (2) – Kotowska et al. (2008)
Kotowska, Jóźwiak, Matysiak, Baranowska (2008) Fertility decline as a response to profound sociatal and labour market changes, Demographic Research, Vol. 19, No. 22, pp. 795-854
14
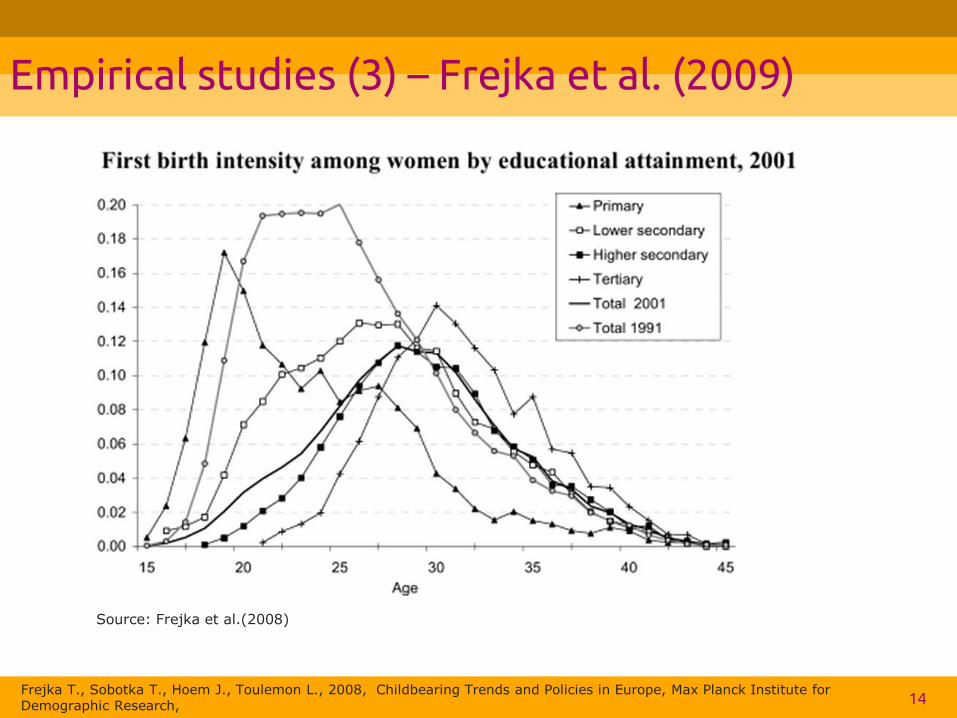
Empirical studies (3) – Frejka et al. (2009)
Frejka T., Sobotka T., Hoem J., Toulemon L., 2008, Childbearing Trends and Policies in Europe, Max Planck Institute for Demographic Research,
Source: Frejka et al.(2008)
15
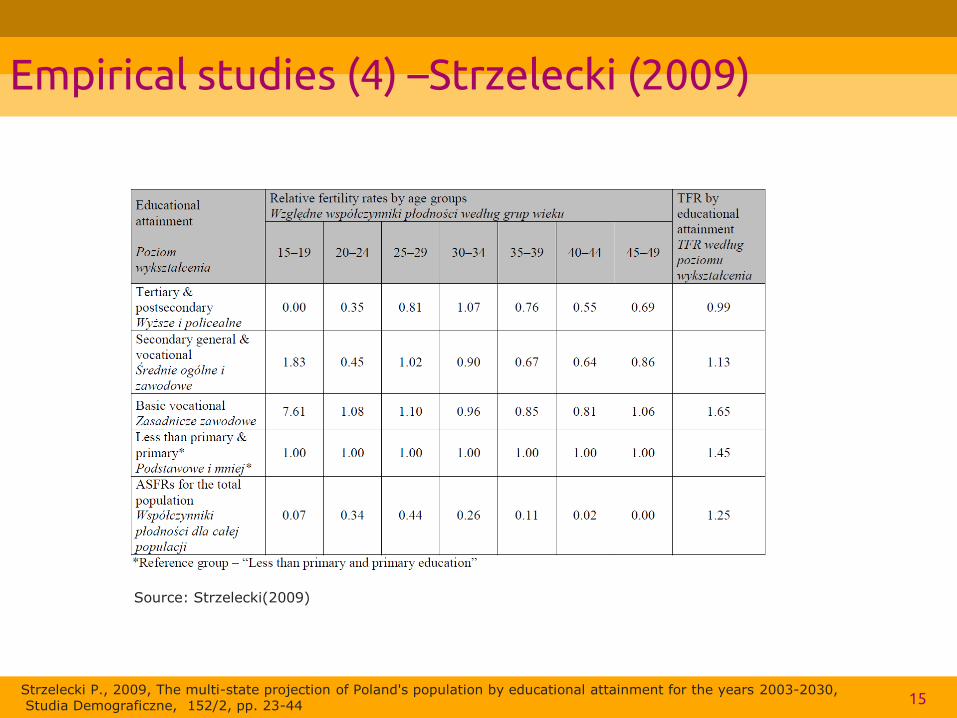
Empirical studies (4) –Strzelecki (2009)
Strzelecki P., 2009, The multi-state projection of Poland's population by educational attainment for the years 2003-2030, Studia Demograficzne, 152/2, pp. 23-44
Source: Strzelecki(2009)

Thank you for your attention!


