MODELING MONTHLY RAINFALL RECORDS IN ARID ZONES USING MARKOV CHAINS: SAUDI ARABIA CASE STUDY 02/19/2022 ELFEKI&ALAMRI ( ICWRAE 2010) Amro Elfeki and Nassir Al-Amri Dept. of Hydrology and Water Resources Management ,Faculty of Meteorology, Environment & Arid Land Agriculture, King Abdulaziz University , P.O. Box 80208 Jeddah 21589 Saudi Arabia
Transcript
05/02/2023 ELFEKI&ALAMRI ( ICWRAE 2010)
MODELING MONTHLY RAINFALL RECORDS IN ARID ZONES USING
MARKOV CHAINS: SAUDI ARABIA CASE STUDY
Amro Elfeki and Nassir Al-Amri
Dept. of Hydrology and Water Resources Management ,Faculty of Meteorology, Environment & Arid Land Agriculture, King
Abdulaziz University , P.O. Box 80208 Jeddah 21589 Saudi Arabia
05/02/2023 ELFEKI&ALAMRI ( ICWRAE 2010)
Outline Research Objectives Typical Rainfall Station Data Methodology and Model Development Results Conclusions Outlook
05/02/2023 ELFEKI&ALAMRI ( ICWRAE 2010)
Research Objectives Modeling monthly rainfall records in arid
zones for future predictions of monthly rainfall.
Application on a case study in Saudi Arabia (Three Stations).
05/02/2023 ELFEKI&ALAMRI ( ICWRAE 2010)
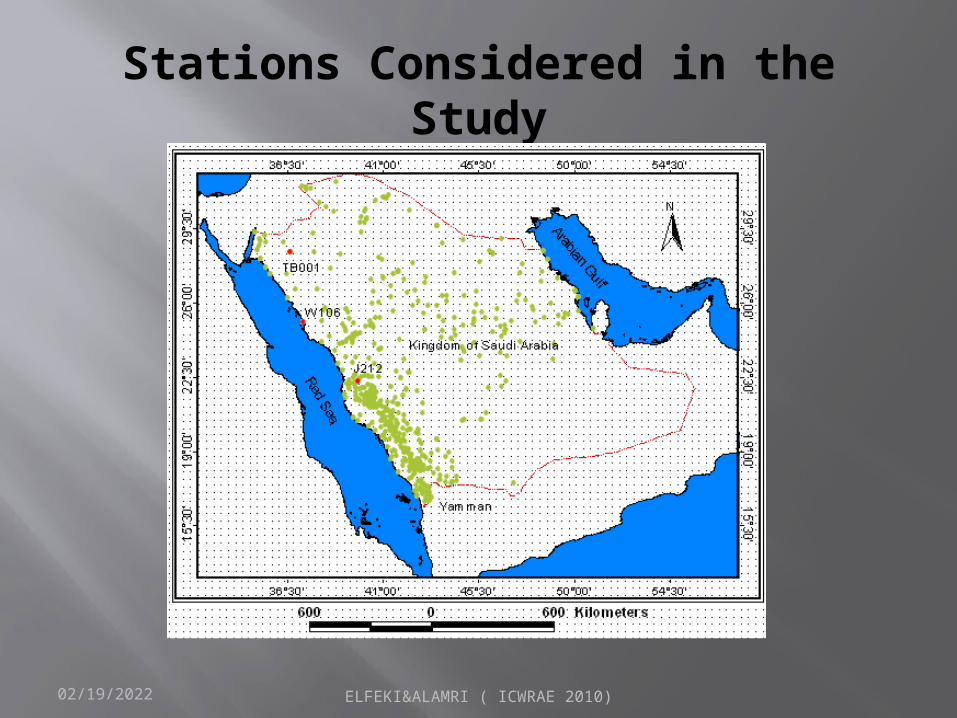
Stations Considered in the Study
05/02/2023 ELFEKI&ALAMRI ( ICWRAE 2010)
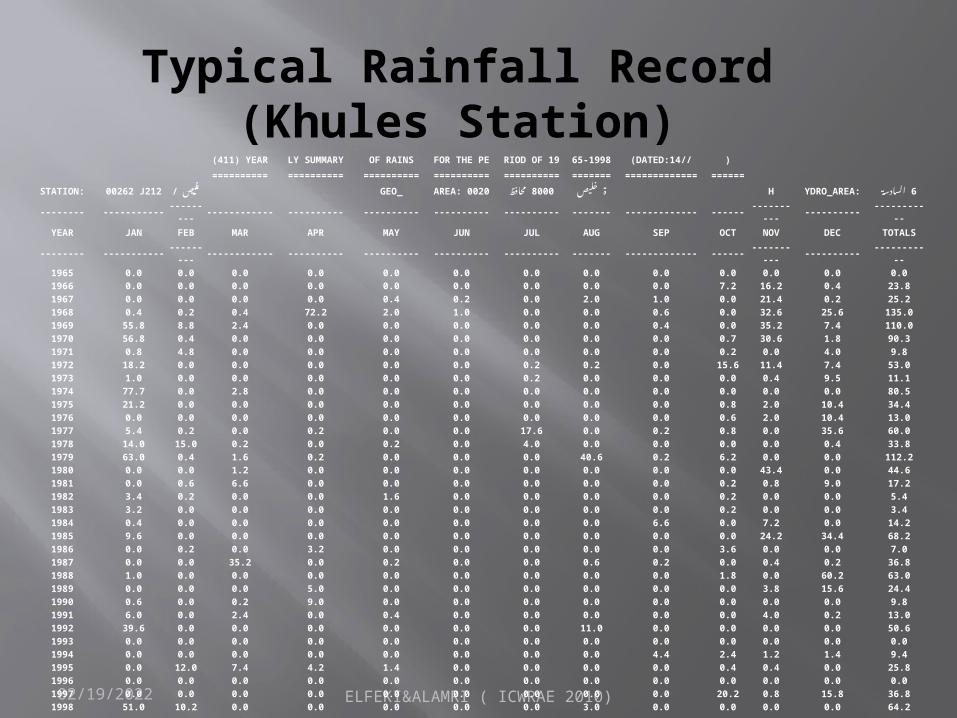
Typical Rainfall Record (Khules Station)
(411) YEAR LY SUMMARY OF RAINS FOR THE PE RIOD OF 19 65-1998 (DATED:14// )
Visualization of a Monthly Rainfall Record (Khules Station)
05/02/2023 ELFEKI&ALAMRI ( ICWRAE 2010)
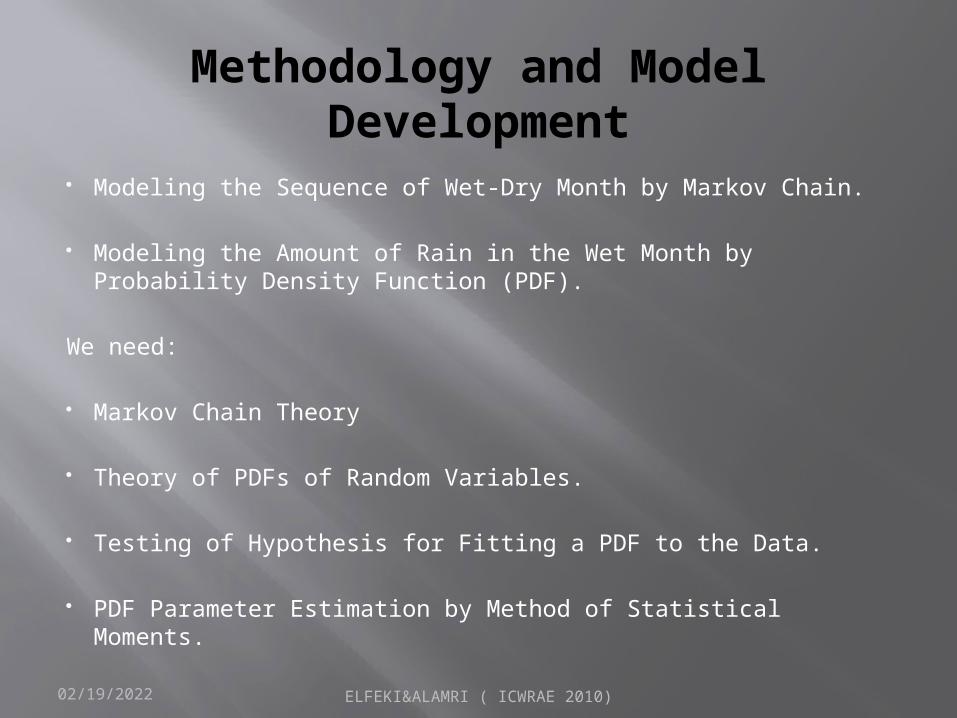
Methodology and Model Development
Modeling the Sequence of Wet-Dry Month by Markov Chain.
Modeling the Amount of Rain in the Wet Month by Probability Density Function (PDF).
We need:
Markov Chain Theory
Theory of PDFs of Random Variables.
Testing of Hypothesis for Fitting a PDF to the Data.
PDF Parameter Estimation by Method of Statistical Moments.
05/02/2023 ELFEKI&ALAMRI ( ICWRAE 2010)
Theory of Markov ChainSS S
i0 1 i+ 1i-1 N2
l k q
Pr( )
Pr( ) : ,i i -1 i - 2 i -3 0k l n pr
i i -1k l lk
, , S ,..., S S S SX X X X X pS SX X
................
..
1
21
11211
nnn
lk
n
pp
pp
ppp
p 1,...,0
1
ppn
klklk
( )limN
Nklk p
1
1
...,
0, 1
n
k klkl
n
k kk
, k 1 , n p
Marginal prob.
Transition prob.
05/02/2023 ELFEKI&ALAMRI ( ICWRAE 2010)
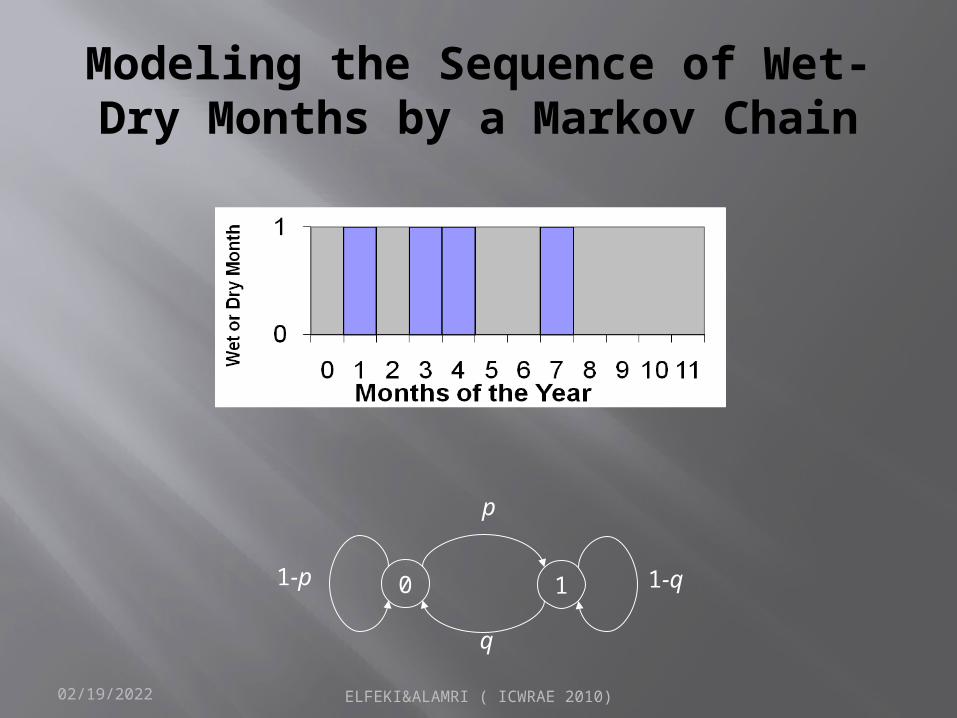
Modeling the Sequence of Wet-Dry Months by a Markov Chain
10
p
q
1-q1-p
05/02/2023 ELFEKI&ALAMRI ( ICWRAE 2010)
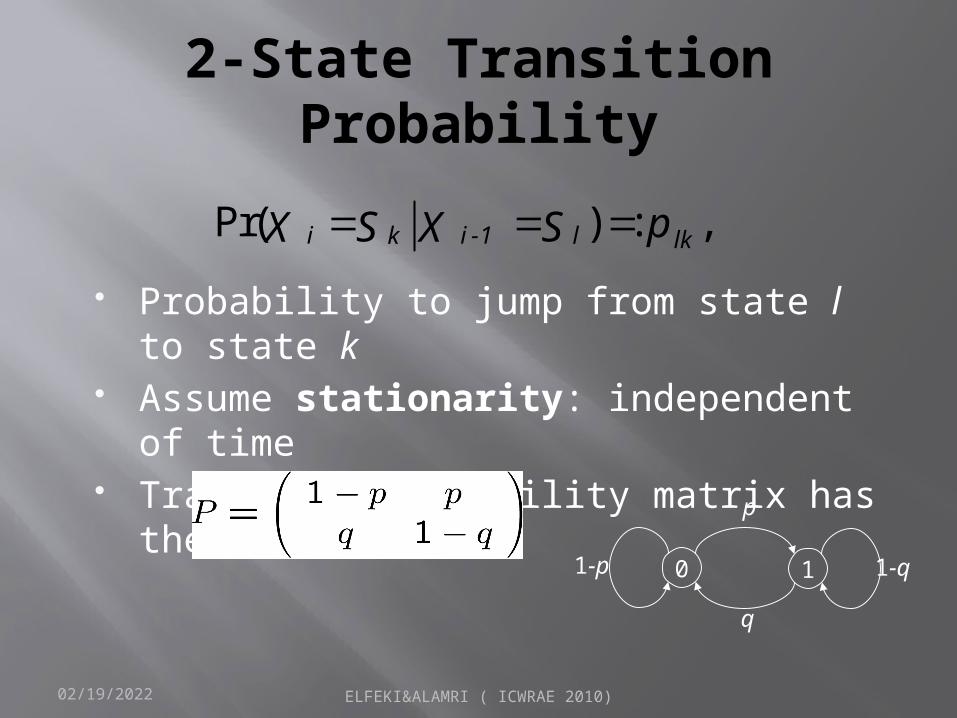
2-State Transition Probability
Probability to jump from state l to state k
Assume stationarity: independent of time
Transition probability matrix has the form:
Pr( ) : ,i i -1k l lk pS SX X
10
p
q
1-q1-p
05/02/2023 ELFEKI&ALAMRI ( ICWRAE 2010)
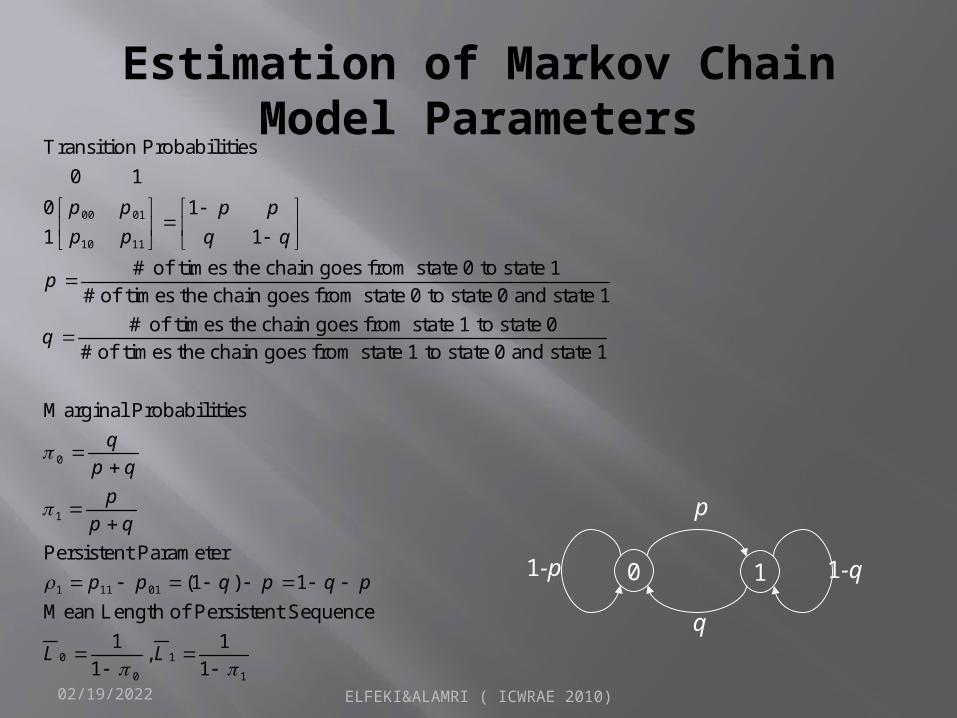
Estimation of Markov Chain Model Parameters
00 01
10 11
Transition Probabilities 0 10 11 1
# of times the chain goes from state 0 to state 1# of times the chain goes from state 0 to state 0 and state 1
# of times the chain
p p p pp p q q
p
q
0
1
1 11 01
goes from state 1 to state 0# of times the chain goes from state 1 to state 0 and state 1
Marginal Probabilities
Persistent Parameter(1 ) 1
Mean Length of Persistent Sequ
qp q
pp q
p p q p q p
0 1
0 1
ence1 1,
1 1L L
10
p
q
1-q1-p
05/02/2023 ELFEKI&ALAMRI ( ICWRAE 2010)
Coding Sequence of Wet and Dry
05/02/2023 ELFEKI&ALAMRI ( ICWRAE 2010)
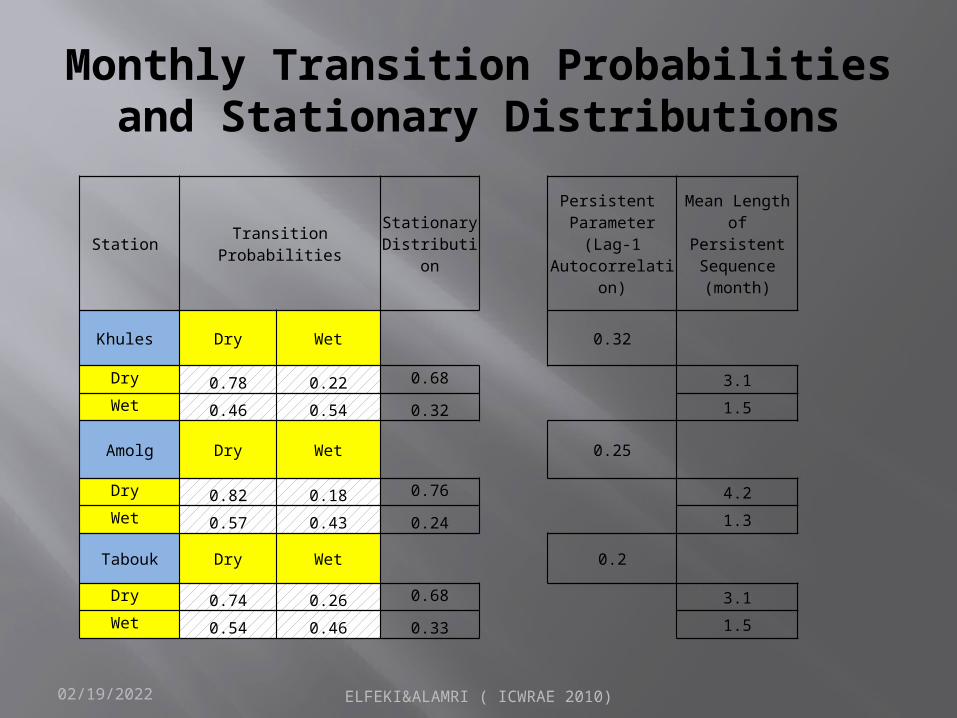
Monthly Transition Probabilities and Stationary Distributions
Station Transition Probabilities Stationary Distribution
Persistent Parameter (Lag-1 Autocorrelation)
Mean Length of Persistent
Sequence (month)
Khules Dry Wet 0.32
Dry 0.78 0.22
0.68 3.1Wet
0.46 0.54 0.32 1.5
Amolg Dry Wet 0.25
Dry 0.82 0.18
0.76 4.2Wet
0.57 0.43 0.24 1.3
Tabouk Dry Wet 0.2
Dry 0.74 0.26
0.68 3.1Wet
0.54 0.46 0.33 1.5
05/02/2023 ELFEKI&ALAMRI ( ICWRAE 2010)
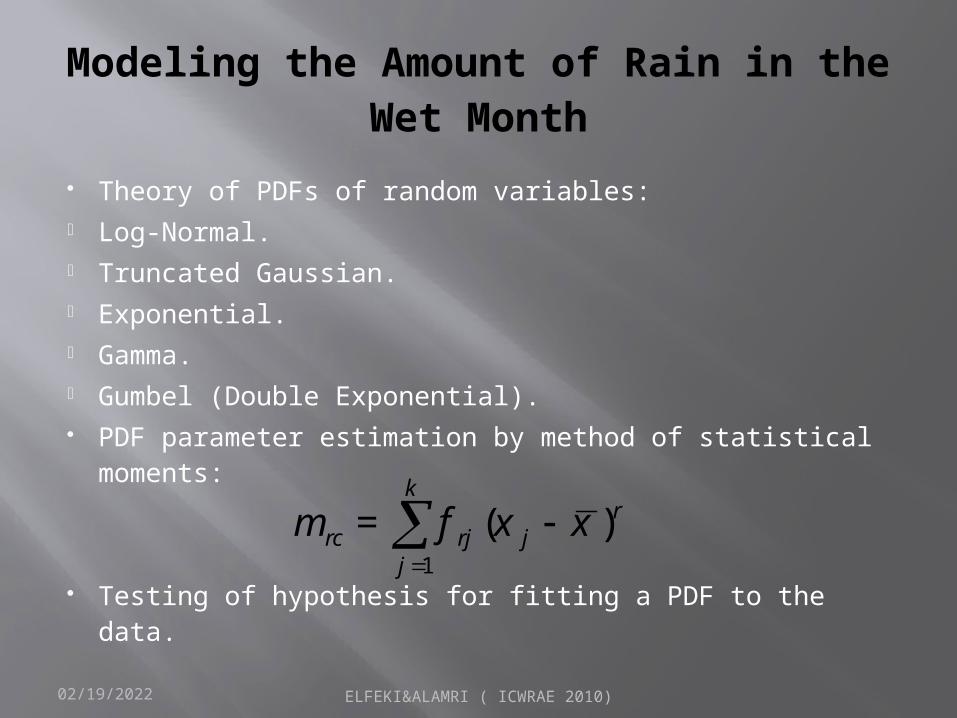
Modeling the Amount of Rain in the Wet Month
Theory of PDFs of random variables:- Log-Normal.- Truncated Gaussian.- Exponential.- Gamma.- Gumbel (Double Exponential). PDF parameter estimation by method of
statistical moments:
Testing of hypothesis for fitting a PDF to the data.1
( )k
rrc rj j
j
m = f x x
05/02/2023 ELFEKI&ALAMRI ( ICWRAE 2010)
Fitting PDF by Χ2 TestHo: the data follows the claimed distribution
H1: the data does not follow the claimed distribution
05/02/2023 ELFEKI&ALAMRI ( ICWRAE 2010)
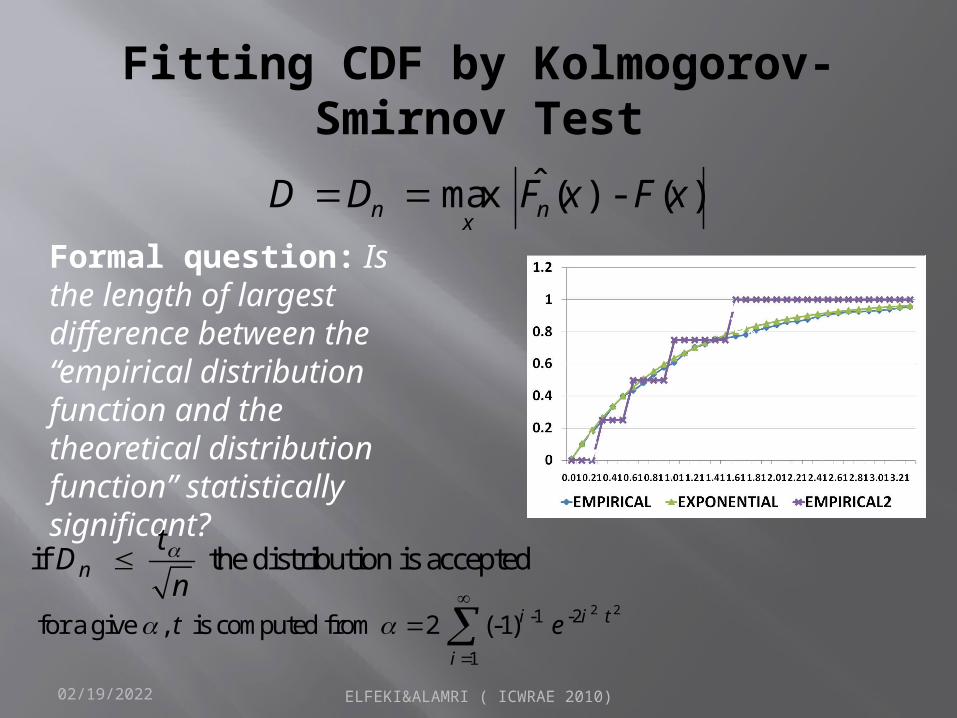
Fitting CDF by Kolmogorov-Smirnov Test
ˆ max ( ) - ( )n nxD D F x F x
Formal question: Is the length of largest difference between the “empirical distribution function and the theoretical distribution function” statistically significant?
if the distribution is acceptednt
Dn
2 2-1 -2
1
for a give , is computed from 2 (-1) i i t
i
t e
Dmax
05/02/2023 ELFEKI&ALAMRI ( ICWRAE 2010)
Spreadsheet Model for Statistical Analysis (Khules Statistics)
ungroupedmean 9.934090909var 258.9335618sd 16.09141267skew 2.296349169kurt 5.062391357Median 2.4Mode 0.2Geomean 2.479539251harmonic mean 0.709048777Quadratic mean 18.85889992
average deviation 11.1768595range 77.5relative range 7.80141844CV 1.619817336
mean(ln)= 0.908072757sd (ln)= 1.843922054
Arithmatic mean 10.956harmonic mean 0.5306quadratic mean 19.184variance 247.98sd 15.747skew 2.3485kurt 8.2063
groupedAn Excel Sheet has been developed tocalculate the descriptive statistics and perform hypothesis testing to fit a distribution
Spreadsheet Model for Markov Chain Analysis and Predictions
An Excel Sheet has been developed to
perform coding of the station record,
calculate the transition probability of the sequence,
and
perform simulationsof the sequence based on the data and the parameters estimated from the other sheet.
05/02/2023 ELFEKI&ALAMRI ( ICWRAE 2010)
Results of Khules Station
Log-normal Gamma
05/02/2023 ELFEKI&ALAMRI ( ICWRAE 2010)
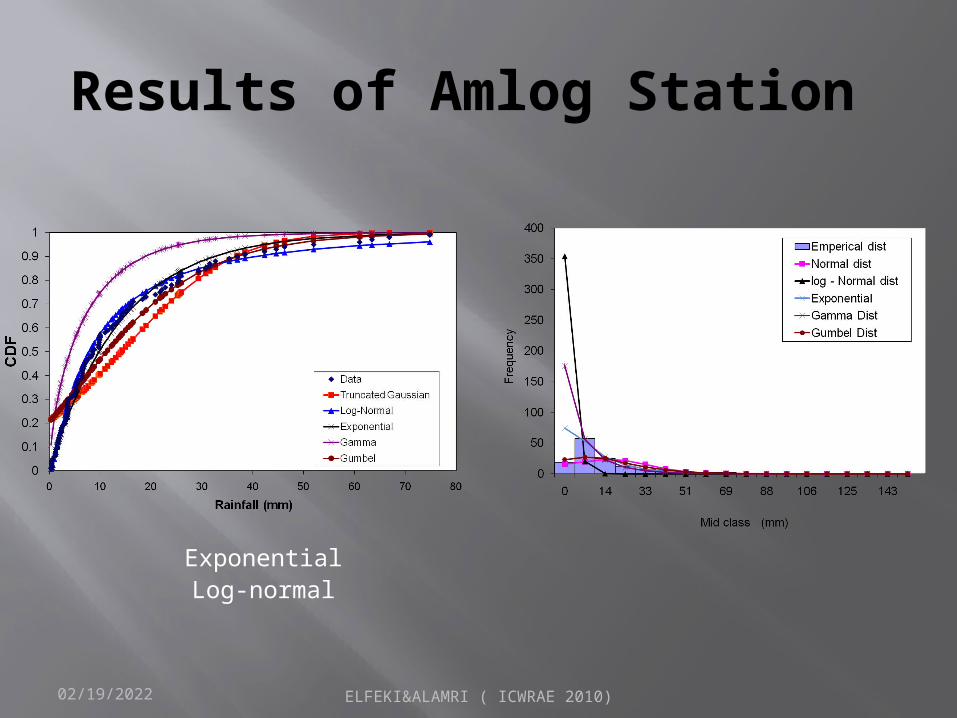
Results of Amlog Station
ExponentialLog-normal
05/02/2023 ELFEKI&ALAMRI ( ICWRAE 2010)
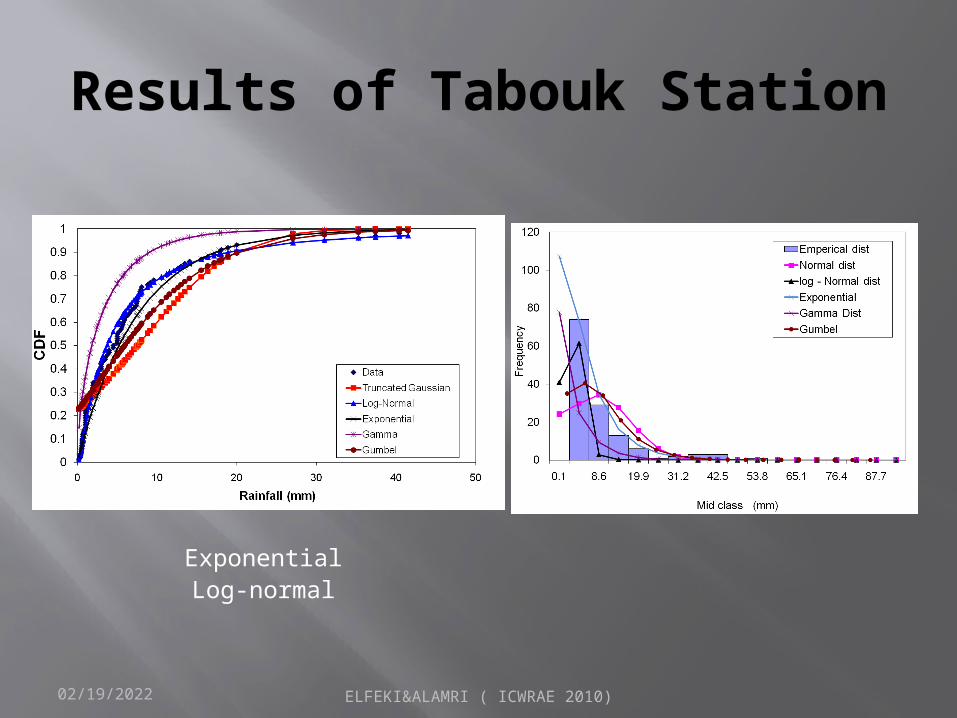
Results of Tabouk Station
ExponentialLog-normal
05/02/2023 ELFEKI&ALAMRI ( ICWRAE 2010)
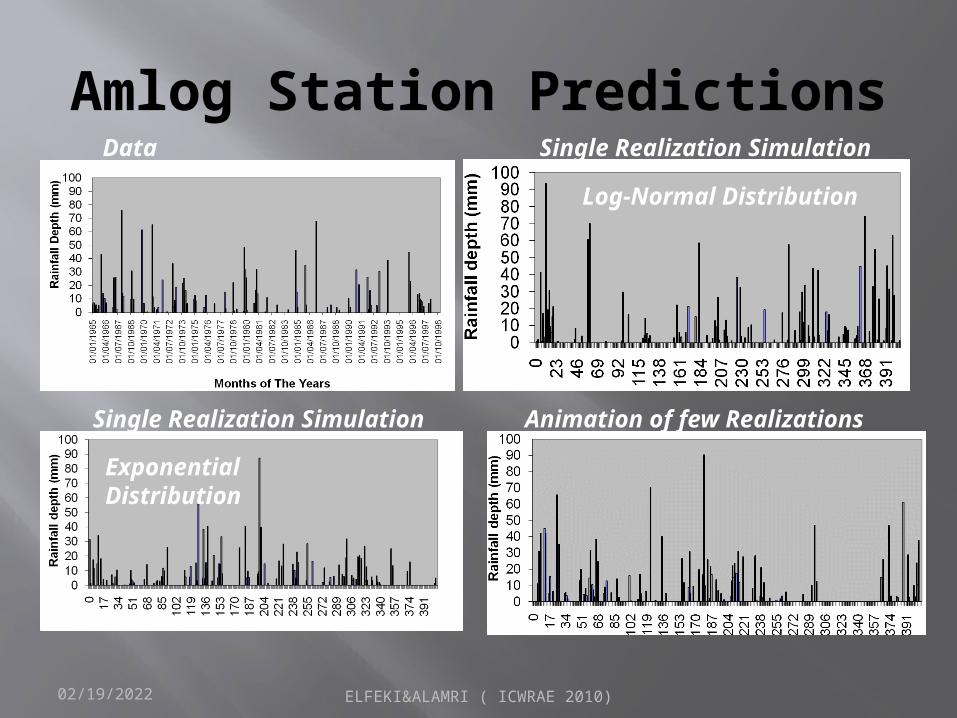
Amlog Station PredictionsData
Single Realization Simulation Animation of few Realizations
Log-Normal Distribution
Exponential Distribution
Single Realization Simulation
05/02/2023 ELFEKI&ALAMRI ( ICWRAE 2010)
Khules Station Predictions
Exponential Distribution
Data
Single Realization Simulation
05/02/2023 ELFEKI&ALAMRI ( ICWRAE 2010)
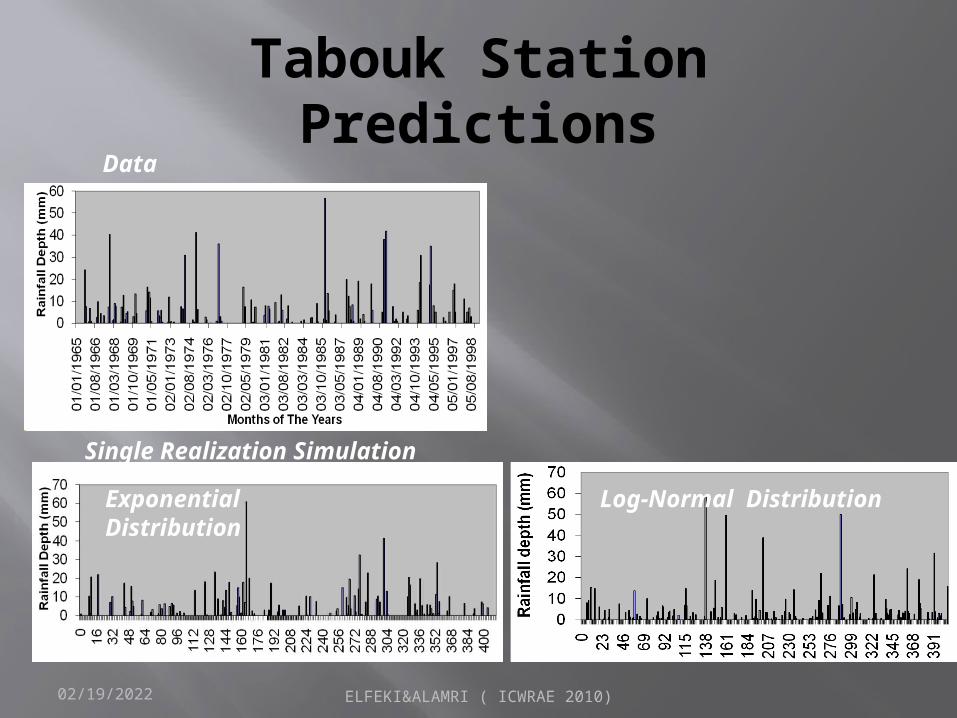
Tabouk Station Predictions
Log-Normal Distribution
Data
Single Realization Simulation
Exponential Distribution
05/02/2023 ELFEKI&ALAMRI ( ICWRAE 2010)
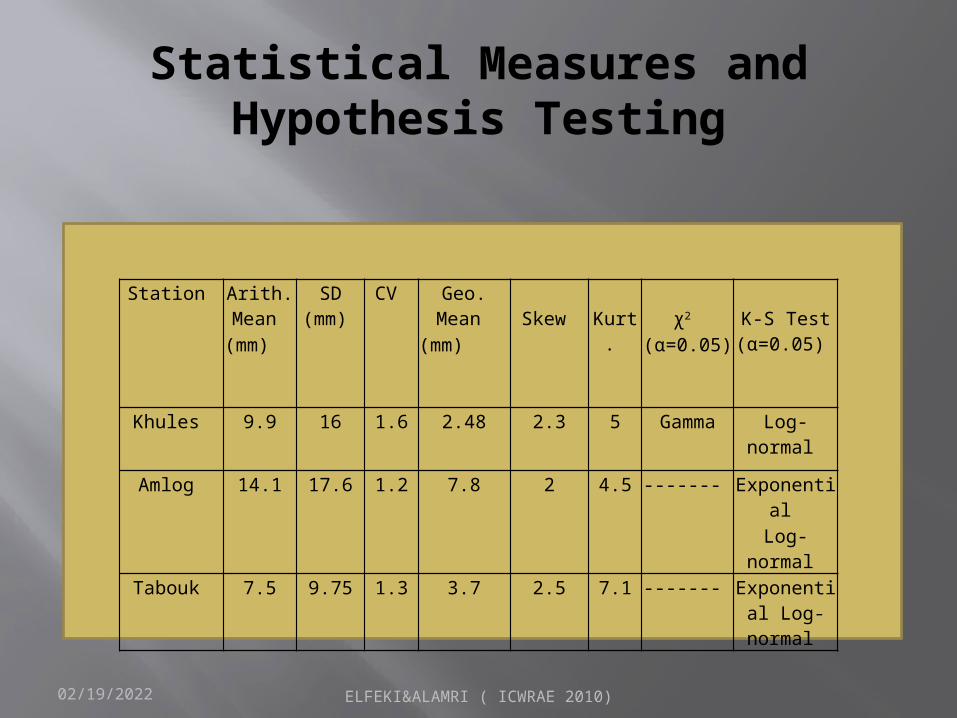
Conclusions K-S test shows that Log-normal and Exponential distributions are best
suited to the monthly data at 5% significant level.
Chi2 test rejects the probability distributions considered except at Khules station where the Gamma distribution seems to fit the data, however, for Amlog and Tabouk, the exponential distribution seems to fit the monthly data visually.
The Markov chain analysis shows that (q > p): q(w→d) and p(d→w) and therefore ( 1-p > 1-q): 1-p (d→d) and 1-q (w→w)
On average, 30% of the year is rainy and 70% of the year is dry.
Mean length of rainy months ~ 1.5 month.
Mean length of dry months ~ 4 month.
05/02/2023 ELFEKI&ALAMRI ( ICWRAE 2010)
Outlook Improving the model by:
1. Incorporating non-stationary transition probability (Seasonality).
2. Providing uncertainty bounds in the predicted rainfall records.
3. Introducing more pdfs.
4. Applying the developed model on many stations in the Kingdom.