Page 1
FORENSIC ANALYSIS OF GASOLINE IN MOLOTOV COCKTAIL USING GAS
CHROMATOGRAPHY – MASS SPECTROMETRY AND CHEMOMETRIC
PROCEDURES
by
MOHAMAD ISMAIL BIN JAMALUDDIN
Thesis submitted in fulfilment of the requirements for the degree of
Master of Science
October 2014
Page 2
2
DECLARATION
I declare that the material presented in this thesis is all my own work. The thesis has not been
previously submitted for any other degree.
Date: 27 October 2014 MOHAMAD ISMAIL BIN JAMALUDDIN P-SKM0008/12(R)
Page 3
i
ACKNOWLEDGEMENTS
In the name of Allah, the Most Gracious and the Most Merciful. First and foremost,
I would like to thank my supervisor, Dr. Ahmad Fahmi Lim Abdullah for giving me
the opportunity to conduct this very interesting and at the same time very challenging
research topic. I would also like to thank him for his fruitful guidance, knowledge
and advices during my two years at the Forensic Science Programme, School of
Health Sciences, Universiti Sains Malaysia in Kubang Kerian. Without his non-stop,
continuous motivational support, I am very much sure, this thesis will not be
completed let alone a successful ones.
I would also like to convey my gratitude to my second supervisor, Dr. Dzulkiflee
Ismail for „lending his ears‟, for his helps on the statistical software and spending his
time with me throwing the Molotov Cocktails. Thanks also go to Dr. Wan Nur
Syuhaila Mat Desa and Dr. Noor Zuhartini Md Muslim for her invaluable advices
and support.
I would also like to acknowledge the Royal Malaysian Police (RMP) for the
scholarship awarded and countless assistance given to me throughout my two years
of postgraduate study. Without their support, I would not been able, let alone the
chance to conduct this research and brought back the invaluable knowledge and
experience that I had gained to share with them.
A very big thank to Mr. Chang Kah Haw, a PhD student under the supervision of Dr.
Ahmad Fahmi Lim Abdullah for his persistency in helping me out dealing with the
Page 4
ii
massive GC-MS dataset. Thanks to all my fellow course mates especially to Miss
Raihanah, Mr. Hafezul Helmi, Mrs. Nor Hafizah, Mrs. Rahayu and Mr. Zaihairul for
their friendship, advices, undivided and phenomenal moral support.
Above all, I would like to express my deepest gratitude to my nearest and dearest,
my beloved wife Mrs. Siti Sara Ahmad Zulkifli, my son and daughter and my parents
Mr. Jamaluddin Musa and Mrs. Zalihah Noot and my parents in law, Mr. Ahmad
Zulkifli and Mrs. Zabedah Saleh and to all my friends for their never ending support.
I dedicated this thesis to them. I would not have made it this far without them.
Page 5
iii
TABLE OF CONTENTS
ACKNOWLEDGEMENTS ........................................................................................ i
TABLE OF CONTENTS .......................................................................................... iii
LIST OF ABBREVIATIONS, ACRONYMS AND SYMBOLS .......................... vii
LIST OF TABLES .................................................................................................. viii
LIST OF FIGURES .................................................................................................. ix
ABSTRAK ............................................................................................................... xiii
ABSTRACT .............................................................................................................. xv
CHAPTER 1: INTRODUCTION ............................................................................. 1
1.1 Introduction......................................................................................................... 1
1.2 Statement of the Problems .................................................................................. 1
1.3 Definition of Molotov Cocktail .......................................................................... 2
1.4 Molotov Cocktail as an Improvised Explosive Device (IED) ............................ 3
1.5 Gasoline as Fuels in Molotov Cocktail ............................................................... 7
1.6 Chemistry of Gasoline ........................................................................................ 7
1.6.1 Molecular Component of Gasoline ........................................................ 8
1.6.2 Alkanes ................................................................................................... 9
1.6.2.1 Normal Alkanes ................................................................................ 10
1.6.2.2 Branched-alkanes ............................................................................. 10
1.6.2.3 Cycloalkanes .................................................................................... 11
1.6.3 Aromatic Compounds .......................................................................... 12
1.7 Analytical Methods for Gasoline as Fuels in Molotov Cocktail ...................... 13
1.7.1 Gas Chromatography – Flame Ionisation Detector .............................. 14
1.7.2 Gas Chromatography – Mass Spectrometry ........................................ 14
1.7.3 Gas Chromatography of Gasoline ........................................................ 15
1.7.4 Peak Normalisation .............................................................................. 16
1.8 Pattern Recognition .......................................................................................... 18
1.8.1 Principal Component Analysis ............................................................. 20
1.9 Analytical Methods ........................................................................................... 21
1.10 Weathering of Gasoline as Fuel in Molotov Cocktail ................................. 23
Page 6
iv
1.11 Significance of Study .................................................................................. 24
1.11 Aim and Objectives ..................................................................................... 24
CHAPTER 2: EXPERIMENTAL .......................................................................... 26
2.1 Samples Collection .......................................................................................... 26
2.1.1 Sources of Samples .............................................................................. 26
2.1.2 Samples from Service Stations Over Time .......................................... 27
2.1.3 Samples Collection Procedures ............................................................ 28
2.2 Preparation of Weathered and Molotov Cocktail Samples .............................. 29
2.2.1 Evaporation of Gasoline ....................................................................... 29
2.2.2 Dissolution ........................................................................................... 30
2.2.3 Preparation of Molotov Cocktail .......................................................... 31
2.2.4 Molotov Cocktail Exercise ................................................................... 32
2.3 Gas Chromatography-Mass Spectrometry Analysis ......................................... 33
CHAPTER 3: DATA TREATMENT AND ANALYSIS ...................................... 36
3.1 Data Analysis .................................................................................................... 36
3.2 Choice of Peaks ................................................................................................ 37
3.3 Peak Normalisation ........................................................................................... 40
3.4 Extracted Ion Chromatograms (EIC) of Gasoline ............................................ 40
3.5 Data Presentation .............................................................................................. 43
3.5.1 Interpreting a Score Plot....................................................................... 45
3.5.2 Interpreting a Dendrogram ................................................................... 45
CHAPTER 4: CHARACTERISATION OF FRESH GASOLINE ..................... 46
4.1 Introduction....................................................................................................... 46
4.2 Standard Compounds ....................................................................................... 46
4.3 GC-MS of Gasoline .......................................................................................... 48
4.4 Comparison of Shell and Petronas Samples ..................................................... 52
4.4.1 Total Ion Chromatograms .................................................................... 52
4.4.2 Alkane Profile ...................................................................................... 53
4.4.3 Aromatic Profiles ................................................................................. 54
4.4.4 TIC of Shell Samples ........................................................................... 56
4.4.5 TIC of Petronas Samples ...................................................................... 57
4.5 Discrimination of Gasoline Using 16 Peaks of TIC ......................................... 58
4.5.1 Comparison between Shell and Petronas Sample Using 16 Peaks ...... 59
Page 7
v
4.5.2 Comparison of Shell Gasoline Samples Using 16 Peaks ..................... 60
4.5.3 Comparison of Petronas Gasoline Samples Using 16 Peaks ............... 61
4.6.4 Summary .............................................................................................. 63
4.6 Discrimination of Gasoline Using 15 Peaks of EIC ......................................... 64
4.6.1 Comparison between Shell and Petronas Samples............................... 64
4.6.2 Comparison of Shell Samples Using 15 Peaks of EIC ........................ 65
4.6.3 Comparison of Petronas Samples Using 15 Peaks from EIC .............. 66
4.6.4 Summary .............................................................................................. 69
4.7 Multivariate Analysis of Fresh Gasoline Data ................................................. 69
4.7.1 TIC Data ............................................................................................... 69
4.7.1.1 Shell Samples ................................................................................... 71
4.7.1.2 Petronas Samples .............................................................................. 72
4.7.1.3 Dendrogram of Fresh Gasoline ........................................................ 73
4.7.2 EIC Data ............................................................................................... 74
4.7.2.1 Shell Samples ................................................................................... 75
4.7.2.2 Petronas Samples .............................................................................. 76
4.7.2.3 Dendrogram of Fresh Gasoline Samples Using EIC Data ............... 76
4.8 Summary ........................................................................................................... 77
CHAPTER 5: POTENTIAL CHANGES TO GASOLINE PROFILE AS
FUEL OF A MOLOTOV COCKTAIL ................................................................. 81
5.1 Introduction....................................................................................................... 81
5.2 Investigation of Profile Changes Over Time .................................................... 82
5.2.1 Sample Source ...................................................................................... 82
5.2.2 GC-MS Data ........................................................................................ 83
5.2.2.1 Shell Gasoline Over Time ................................................................ 84
5.2.2.2 Petronas Gasoline Over Time ........................................................... 86
5.2.3 Summary .............................................................................................. 87
5.3 Investigation of the Profile Due to Weathering ................................................ 88
5.3.1 Evaporation of Gasoline ....................................................................... 89
5.3.2 Dissolution of Gasoline Sample ........................................................... 90
5.3.3 PCA of Weathered Samples ................................................................. 91
5.3.3.1 Evaporation of Shell Samples .......................................................... 92
5.3.3.2 Evaporation of Petronas Gasoline .................................................... 93
5.3.3.3 Dissolution of Shell Gasoline .......................................................... 94
Page 8
vi
5.3.3.4 Dissolution of Petronas Gasoline ..................................................... 95
5.3.4 Summary .............................................................................................. 96
5.4 Molotov Cocktail Exercise .......................................................................... 97
CHAPTER 6: CONCLUSION .............................................................................. 101
6.1 Variability of Gasoline Samples ..................................................................... 102
6.2 Variability of Gasoline Samples from a Service Station Overtime ................ 103
6.3 Data Analysis and Discrimination Protocol .................................................. 103
6.4 Profile Changes Due to Weathering ............................................................... 104
6.5 Molotov Cocktail Fragment ............................................................................ 105
6.6 Future Recommendations ............................................................................... 106
REFERENCES ....................................................................................................... 107
APPENDIX 1 .......................................................................................................... 112
APPENDIX II ......................................................................................................... 114
APPENDIX III ....................................................................................................... 116
LIST OF PUBLICATION ..................................................................................... 120
Page 9
vii
LIST OF ABBREVIATIONS, ACRONYMS AND SYMBOLS
% percentage
°C degree Celsius
cm centimetre
cm2
square centimetre
et al. and others
g gram
i.e. that is
kg kilogram
m3 cubic metre
µm micrometre
min minute
mm millimetre
mL millilitre
r2
r-squared value
v/v volume/volume
ASTM American Society for Testing and Material
EIC Extracted Ion Chromatogram
GC Gas Chromatography
GC-MS Gas Chromatography-Mass Spectrometry
ID Internal Diameter
MS Mass Spectrometry
NIST National Institute of Standards and Technology
PAH Polycyclic Aromatic Hydrocarbons
RON Research Octane Number
RT Retention Time
SD Standard Deviation
SIM Selected Ion Monitoring
SPME Solid Phase Micro Extraction
TIC Total Ion Current *Chromatogram
UCM Unresolved Complex Mixtures
Page 10
viii
LIST OF TABLES
Table 1.1: Number of cases and sections charged for cases involving
Molotov cocktail in Kelantan. 6
Table 2.1: Samples code for samples Shell and Petronas 28
Table 2.2: Sample code for Shell and Petronas in dissolution process 31
Table 2.3: Parameters setting for Gas Chromatography 34
Table 3.1: Sixteen peaks selected from TIC 38
Table 3.2: 15 peaks integrated from the Total Ion Chromatogram 42
Table 3.3: TIC from difference classes 43
Table 5.1: Samples code for Shell in evaporation process 88
Table 5.2: Samples code for Petronas in evaporation process 88
Table 5.3: Statistical sample gasoline exploded/unexploded 98
Page 11
ix
LIST OF FIGURES
Figure 1.1: A typical Molotov cocktail as an IED 4
Figure 1.2: Different mechanisms used as the ignition source: (Left) A wick
inserted through the bottle neck; (middle) a rag saturated with fuel
liquid and wrapped around the bottle neck, and (right) matches
tied together and inserted inside the bottle neck 4
Figure 1.3: Schematic flowchart of a modern complex refinery used in the
production of gasoline petroleum products 9
Figure 1.4: n-decane with ten carbons in a long chain 10
Figure 1.5: Structure of 2-methylbutane 11
Figure 1.6: Cycloalkanes found in gasoline 11
Figure 1.7: Chemical structure of aromatic compounds 12
Figure 1.8: The structure of indane 13
Figure 1.9: Peak patterns for alkylbenzenes found in gasoline 16
Figure 1.10: Ratio of the two peaks of different dilutions 17
Figure 1.11: A peak with (a) peak shoulder and (b) an unresolved peak 18
Figure 1.12: The chromatogram was divided into different windows for step by
step comparison 19
Figure 2.1: Examples of Molotov cocktail prepared in the study 32
Figure 3.1: Total Ion Chromatograms of Shell and Petronas gasoline 36
Figure 3.2: Portion chromatograms showing relative (a) peak height
differences and (b) minor peak differences between two gasoline
types 37
Figure 3.3: The 16 peaks selected for chromatogram data analysis for both
gasoline samples 39
Page 12
x
Figure 3.4: Extracted ion chromatograms of simple aromatics using ions at
m/z 91, 105, 119 and 133, showing 15 peaks used for data
analysis 41
Figure 4.1: TIC of standard hydrocarbon for C8-C20. 47
Figure 4.2: TIC of toluene, ethylbenzenes and xylenes peaks from standard
mixture solution of 1000 mg/L. 48
Figure 4.3: GC-MS Chromatogram for gasoline. 49
Figure 4.4: Comparison between TIC of gasoline and its EIC for alkanes
(data extracted using ions at m/z 43, 57, 71, 85 and 99) 50
Figure 4.5: Comparison between TIC of gasoline and its EIC for simple
aromatics (data extracted using ions at m/z 91, 105, 119, 133) 51
Figure 4.6: Comparison between TIC of gasoline and its EIC for polynuclear
aromatics (data extracted using ions at m/z 128, 142, and 156) 52
Figure 4.7: TIC of Shell sample and Petronas sample 53
Figure 4.8: EIC of alkanes for Shell sample and Petronas samples 54
Figure 4.9: EIC for aromatic hydrocarbons for Shell and Petronas sample 55
Figure 4.10: EIC of polynuclear aromatics for Shell sample and Petronas
sample 55
Figure 4.11: Comparison of chromatograms of three Shell samples 56
Figure 4.12: Comparison of chromatogram of three Petronas samples 57
Figure 4.13: Location of peaks in the chromatograms used for data comparison 58
Figure 4.14: Comparison of Shell and Petronas gasoline using 16 compounds
normalised to peak 14 59
Figure 4.15: Comparison of Shell gasoline using 16 peaks from TIC
normalised to peak 14 60
Figure 4.16: Comparison of sample profile based on 16 peaks from TIC
normalised to peak 14 61
Figure 4.17: Comparison of Petronas gasoline using 16 peaks from TIC
normalised to peak 14 62
Page 13
xi
Figure 4.18: Comparison of sample profile based on 16 peaks from TIC
normalised to peak 14 63
Figure 4.19: Comparison of Shell and Petronas gasoline using 15 compounds
normalised to peak 12 64
Figure 4.20: Comparison of Shell gasoline using 15 peaks from EIC
normalised to peak 12 65
Figure 4.21: Comparison of Shell sample profiles using 15 compounds
normalised to P12 66
Figure 4.22: Comparison of 15 compounds found in Petronas samples using
peaks normalised to P12 67
Figure 4.23: Histogram showing variability when Figure 4.22 was zoomed in
at y-axis 68
Figure 4.24: Comparison of 15 compounds in Petronas samples using peaks
normalised to P12 68
Figure 4.25: Score plot for PCA analysis of TIC data from fresh gasoline
samples 70
Figure 4.26: Enlargement of Shell gasoline cluster from Figure 4.25 71
Figure 4.27: Dendrogram of fresh gasoline using 16 peak of TIC 73
Figure 4.28: Score plot for PCA analysis of EIC data from fresh gasoline
samples 75
Figure 4.29: Dendrogram of fresh gasoline samples using 15 peaks of EIC 77
Figure 5.1: Score plot for gasoline samples collected over time using GC-MS
data of EIC normalised to P12 83
Figure 5.2: Enlargement of Figure 5.1 showing the clustering of Shell
samples collected overtime 85
Figure 5.3: Enlargement of Figure 5.1 showing the clustering of Petronas
samples collected overtime 86
Figure 5.4: Histogram showing the intensity of peaks of 15 compounds
extracted from EIC for samples with different degree of
evaporation 90
Page 14
xii
Figure 5.5: Histogram showing the intensity of peaks of 15 compounds
extracted from EIC for samples with different degree of
dissolution 91
Figure 5.6: Enlargement of Figure 5.1 showing the Shell evaporated samples 93
Figure 5.7: Enlargement Figure 5.1 showing the of Petronas evaporated
sample 94
Figure 5.8: Enlargement of Figure 5.1 showing the Shell samples subject to
dissolution 95
Figure 5.9: Enlargement of Figure 5.1 showing Petronas samples subject to
dissolution 96
Figure 5.10: Combustion of a Molotov cocktail 97
Figure 5.11: A Molotov cocktail with gasoline was thrown at Royal Malaysia
Police Shooting Range, Gunong, Kelantan 99
Figure 5.12: GC-MS profiles of samples from Molotov cocktail exercise 100
Page 15
xiii
ANALISIS FORENSIK TERHADAP GASOLIN YANG DIGUNAKAN
SEBAGAI MOLOTOV KOKTEL DENGAN MENGGUNAKAN
KROMATOGRAFI GAS–SPEKTROMETRI JISIM DAN KAEDAH
KEMOMETRIK
ABSTRAK
Terdapat peningkatan yang ketara dalam rampasan Molotov koktel oleh Polis Diraja
Malaysia, terutamanya semasa demonstrasi jalanan, ketegangan agama dan konflik
sosial. Semasa penyiasatan forensik, pengumpulan maklumat dan siasatan terhadap
komposisi bahan boleh menjadi penghubung antara kes-kes yang berbeza, atau
sumber dan kumpulan orang yang terlibat. Tesis ini mengkaji kepelbagaian gasolin
yang biasa digunakan sebagai bahan api dalam Molotov koktel dengan menggunakan
kromatografi gas-spektrometri jisim (GC-MS) dan teknik kemometrik untuk analisis
data lanjutan termasuk analisis komponen utama (PCA) dan analisa hiraki kelompok.
Dua puluh tujuh sample telah dikumpul dari stesen minyak berbeza. Gasolin yang
didapati daripada dua stesen minyak terpilih pada selang masa yang berbeza selama
28 hari telah dikaji untuk melihat perubahan profil dari masa ke masa. Dua jenama
gasolin juga telah dikaji bagi mengetahui perubahan profil selepas terdedah kepada
penyejatan dan pelarutan. Kesemua sampel telah dianalisa dengan GC-MS dan
puncak terpilih telah digunakan untuk analisis data seterusnya. Keputusan kajian
menunjukkan bahawa analisis GC-MS dapat mendiskriminasi sampel gasolin segar
kepada dua kumpulan utama mengikut jenama. Dengan menggunakan puncak
terpilih dari kromatogram, sampel segar diambil dari masa ke masa dari stesen
minyak tertentu dapat dibezakan walaupun ada yang dikelompokkan dengan agak
Page 16
xiv
rapat. Kedua-dua sampel menunjukkan trend yang dapat diramalkan pada plot skor
PCA yang boleh digunakan untuk menganggar tahap penyejatan suatu sampel. Data
ion kromatografi terekstrak bagi sampel gasolin yang terdedah kepada air kelihatan
hanya berubah sedikit. Penyiasatan terhadap perolehan semula bahan api daripada
Molotov koktel yang sudah diletupkan menunjukkan hanya 80% daripada Molotov
koktel terbakar sepenuhnya. Bilasan pelarut ke atas serpihan kaca yang diperoleh
memberikan keputusan negatif terhadap kesan gasolin. Ia memberi indikasi bahawa
pengumpulan serpihan kaca dari Molotov koktel yang telah diletupkan untuk
pemulihan bahan api tidak digalakkan bagi pegawai-pegawai penyiasat kecuali untuk
tujuan lain seperti untuk mendapatkan kesan cap jari. Kesimpulannya, kajian ini
menunjukkan gasolin segar daripada sumber yang berbeza boleh dibezakan
sekurang-kurangnya mengikut jenama yang berlainan atau ke dalam kelompok kecil
dalam jenama yang sama dengan menggunakan prosedur kemometrik. Maklumat ini
berguna bagi menyiasat kes-kes yang melibatkan Molotov koktel yang telah
dirampas. Sampel yang telah tersejat dilonggokan dalam kumpulan yang berbeza
oleh PCA dengan corak yang boleh dijangkakan sementara pelarutan hanya
memberikan sedikit kesan ke atas profil gasolin. Dalam kes Molotov koktel yang
telah terbakar, bahan api akan lesap disebabkan keamatan pembakaran dan haba.
Page 17
xv
FORENSIC ANALYSIS OF GASOLINE IN MOLOTOV COCKTAIL USING
GAS CHROMATOGRAPHY – MASS SPECTROMETRY AND
CHEMOMETRIC PROCEDURES
ABSTRACT
There has been a significant increase in the number of seizure of Molotov cocktail by
the Royal Malaysia Police (RMP) during street demonstrations, religious tensions
and society conflicts in Malaysia recently. In a forensic science investigation,
information gathered for intelligence purposes and investigation on the composition
of a material of interest may serve as a link between different cases, or to a particular
source or group of people involved. This thesis studies the variability (in term of
chemical profiles) of gasoline commonly used as accelerant in Molotov cocktail
using gas chromatography-mass spectrometry (GC-MS) coupled with chemometric
techniques for advanced data analysis including principal component analysis (PCA)
and hierarchical cluster analysis (HCA). A total of 27 samples of fresh gasoline were
collected from different service stations. Collection of gasoline samples from two
selected service stations at different time interval over 28 days was conducted to
study their profiles changes over time. Two brands of gasoline were also used to
investigate the profiles change after being subjected to evaporation and dissolution.
All samples were analysed using GC-MS and selected peaks were used for
subsequent data analysis. The results show that the GC-MS analyses were able to
discriminate the fresh gasoline samples into two main groups on the basis of the
different brands of gasoline. Using selected peaks from chromatogram, , the fresh
samples collected over time from a particular service station were able to be
Page 18
xvi
discriminated though some were tightly clustered. Both samples showed a
predictable trend on PCA score plot that could possibly be used to estimate the extent
of evaporation of a sample. The extracted ion chromatography data of the gasoline
samples in contact with water appeared to be only slightly changed. The
investigation of the recovery of accelerant on spent Molotov cocktail found that only
80% of the Molotov cocktails were completely combusted. Solvent rinse (of the
recovered glass fragments) has shown negative result which could suggest that
collection of glass fragment of exploded Molotov cocktail for accelerant recovery is
not advisable unless for other forensic purposes such as fingerprint recovery. In
conclusion, the fresh gasoline from different sources could be differentiated
according to their different brands or into small clusters (within brand) using the
chemometrics techniques. This information is useful for the investigation of seized
Molotov cocktail cases. Evaporated samples are grouped differently by the
chemometrics techniques however in a predictable manner while dissolution gave
only slight change to the gasoline profiles. In the case of spent Molotov cocktail,
accelerant would be lost due to evaporation as a result of intense burning and heat.
Page 19
1
CHAPTER 1
INTRODUCTION
1.1 Introduction
This thesis studies the variability of gasoline fuels commonly used as the accelerant
in Molotov cocktail. The main focus on the study is on the variability of fresh
accelerant recovered from seized Molotov cocktails for tracing their common sources
in a forensic scenario where a syndicate is suspected or to confirm a witness
statement. A study on the variability of gasoline collected from two selected gasoline
stations at different time interval over a period of time was also conducted to see if
the accelerant source changes over time. In the case where a Molotov cocktail is
spent, evaporation and/ or dissolution of the accelerant would inevitably occur. This
study also investigated the profile changes of the accelerant subjected to evaporation
and dissolution.
1.2 Statement of the Problems
In recent years, there has been a significant increase in the seizure of so called home-
made improvised combustible materials using bottles by law enforcement in
Malaysia, especially during street demonstrations or on the occasions of political
supporters disagreement, rebellious, tensions or social conflicts, such incendiary
bottles are also known as Molotov cocktails. During a forensic investigation, the
ability to get the most information out from a recovered Molotov cocktail is the
ultimate aim of a forensic investigation. In forensic investigation of seized materials
Page 20
2
such as Molotov cocktail, an important point that could help intelligence gathering
and investigation or as a preventive measure of a more serious unwanted event is
based on the assumption that similar composition of the material may serve as a link
between different cases, or a particular source or even to a particular group of people
involved in a plot. In the case when unused Molotov cocktails are uncovered, the
investigator‟s task is to examine the chemicals used to prepare the bottles, identify
them, and indicate the source that it could have come from. To establish the links
between the seized Molotov cocktails and their suspected source, the composition of
the two sources shall be the same. Unfortunately, it is practically not easy to
chemically fingerprint the accelerant, particularly, since they could have come from
various sources.
It is therefore important to investigate the variability of the fuels used in a Molotov
cocktail from various sources. For example, in the case if a source is determined
(perhaps through witness statement or closed circuit television (CCTV) and also, in
the case of unexploded Molotov cocktail, would the weathering i.e. evaporation
and/or dissolution affect the profile from its original source.
1.3 Definition of Molotov Cocktail
A Molotov cocktail is defined by Tsaroom (1986) “as a bottle that contains
inflammable liquid and has an ignition source (Tsaroom, 1986)”. A typical Molotov
cocktail is made using a bottle or can be other breakable container filled with
accelerant such as gasoline (Siegel and Mirakovits, 2010). A wick is inserted through
Page 21
3
the mouth of the bottle so that it can be ignited before throwing to a target (Siegel
and Mirakovits, 2010).
1.4 Molotov Cocktail as an Improvised Explosive Device (IED)
Being a simple, cheap and easy to make incendiary device, known also as a gasoline
bomb (Helmenstine, 2006), Molotov cocktails have been used as weapons for many
years. Its history could be traced back during the Spanish Civil War in 1936 where
the “bottle-bombs: were used to attack tank (Trotter, 2012). The name “Molotov
cocktail” was attached to the bottle bombs was believed to originated during the
Winter War when Soviet Union invaded Finland (Trotter, 2012). The Finnist
manufactured the bottle bombs to fight against Soviet Union‟s tanks and used the
name Vyacheslov Molotov, the Minister of Foreign Affairs of Soviet Unions at the
time. A simple Molotov cocktail consists of a breakable bottle filled with accelerant
such as gasoline. A fuel-soaked rag is then stuffed on the top of the bottle. The fuel
soaked rag is ignited before throwing. When container breaks due to the impact, the
flammable liquid in the bottle spread to form flammable vapor which is then quickly
ignited by the flame producing a fireball (Helmenstine, 2006). Figure 1.1 shows a
typical Molotov cocktail.
Page 22
4
Figure 1.1: A typical Molotov cocktail as an IED
Tsaroom (1986) also reported different versions of Molotov cocktail design, in which
a rag is saturated with flammable liquid as shown in Figure 1.2 (left) and wrapped
around the bottle‟s neck as shown in Figure 1.2 (middle). Matches were also used as
the ignition source (Tsaroom, 1986) as shown in Figure 1.2 (right).
Left Middle Right
Figure 1.2: Different mechanisms used as the ignition source: (Left) A wick inserted
through the bottle neck; (middle) a rag saturated with fuel liquid and wrapped around
the bottle neck, and (right) matches tied together and inserted inside the bottle neck
(Tsaroom, 1986)
tape Rag
Bottle
Gasoline
Page 23
5
The effects of causing burning is maximised by throwing it against hard surfaces
such as wood or wall (DeHaan, 2007). The flammable liquids used in a Molotov
cocktail can be gasoline, kerosene or a mixture of other materials including diesel
and motor oil (Tsaroom, 1986), calcium hydroxide and calcium carbonate (Tsaroom,
1986), sugar and potassium chlorate (Martin-Alberca et al., 2012) and sulphuric acid
(DeHaan, 2007; Martin-Alberca et al., 2012). However, the most common Molotov
cocktail contains gasoline (Tsaroom, 1986; DeHaan, 2007), probably due to the ease
of handling since gasoline is safe to transport in bottle, easily available at service
station and relatively inexpensive.
Incidents involving Molotov cocktail were frequently reported in Malaysia especially
during the road demonstrations, riots or racial disputes over the past several years
(Personal Communication). In Kelantan alone, data from the Criminal Investigation
Department (CID) of Royal Malaysia Police in Kelantan showed that there were at
least 42 reported cases from 2004 to 2012 involving the use of Molotov cocktail with
most of them involving gasoline as fuels (Table 1.1).
Note that in the case of Molotov cocktail, several sections of the law are used for
information including Section 302 of the Panel Code, Section 435 of the Panel Code
or Section 6 of Explosive Act (1957). Section 302 of Panel Code states that
“whoever commits murder shall be punished with death”.
Page 24
6
Table 1.1: Number of cases and sections charged for cases involving Molotov
cocktail in Kelantan.
No. Year Total of
cases No. of Cases
Section Used for
Investigation
1. 2012 5 1 302 Panel Code
4 435 Panel code
2. 2011 8 1 6 Explosive Act (1957)
7 435 Panel code
3. 2010 4 4 435 Panel code
4. 2009 8 2 6 Explosive Act (1957)
6 435 Panel code
5. 2008 7 1 6 Explosive Act (1957)
6 435 Panel code
6. 2007 4 4 435 Panel code
7. 2006 2 2 435 Panel code
8. 2005 2 2 435 Panel code
9. 2004 2 2 435 Panel code
Total of Cases 42
Section 435 of Panel Code stakes that “whoever commits mischief by fire or any
explosive substance, intending to cause, or knowing it to be likely that he will
thereby cause, damage to any property to the amount of fifty ringgit or upwards,
shall be punished with imprisonment for a term which may extend to seven years,
and shall also be liable to fine”. Section 6 of Explosive Act (1957) states that “any
person who unlawfully and maliciously causes by any explosive an explosion of a
nature likely to endanger life or to cause serious injury to property shall, whether any
injury to person or property has been actually caused or not, be liable, on conviction,
to imprisonment for seven years, or to a fine of ten thousand ringgit, or to both”
(Explosive Act, 1957; Penal Code, 2008). Note that the right column of Table 1.1
indicate that these cases were investigated under different section of Panel Code or
section 6 of Explosive Act 1957.
Page 25
7
1.5 Gasoline as Fuels in Molotov Cocktail
Theoretically, any flammable liquid can be used as the fuel for Molotov cocktails.
Although there were other possible mixture such as the thickened “napalm” i.e a
mixture of gasoline paraffin wax, poor burning effects making it less famous (Siegel
and Mirakovits, 2010) when extra time and effort are required. Gasoline, kerosene,
diesel and toluene are some commonly available flammable liquids but gasoline is
perhaps the most preferred one as it is easily available and produce instant flame
upon ignition. Kerosene and diesel do not burn as fast as gasoline especially when
the surface is not hot. Kerosene is also not available in many places while the
purchase of diesel may attract the seller‟s attention due to its limited use except for
heavy trucks. In addition, the purchase of diesel is controlled by the subsidy scheme
in Malaysia. Toluene is suitable but it is costly and not widely available as gasoline
which could be purchased from any service station without restriction.
In the case when a plot is planned, the persons involved would not want her/ him to
be attracted by others and the most convenient place will be the publicly assessable
service stations. All these explain why gasoline is the most common fuel encountered
in Molotov cocktail (Tsaroom, 1986) and incendiary fires (Trotter, 2012).
1.6 Chemistry of Gasoline
Gasoline is a flammable liquid most voluminously produced and distributed
(DeHaan, 2007). It is a transparent liquid at room temperature that boils below 180˚C
(Trotter, 2012) and derived from crude oils vial various processes. Figure 1.3 shows
Page 26
8
a schematic flowchart of various process to produce a particular gasoline petroleum
product such as gasoline (DeHaan, 2007).
The word “fingerprinting” is used to explain the complex feature of compounds in a
particular source that can be different from another different source (Sandercock and
Pasquier, 2003a). As reported by Shell Malaysia, they are many types of crude oil
which come from many different sources around the world, and the selection of the
source depends on many factors including quality, availability, volume and price
(Shell Malaysia, 2014).
Due to various distillation processes that blended multiple intermediates in the
manufacturing process, different brands or sources can exhibit different chemical
profiles (DeHaan, 2007) and this a useful feature in distinguishing different sources
known as hydrocarbon fingerprinting commonly used by environmental forensic
scientist.
1.6.1 Molecular Component of Gasoline
In general, gasoline contains molecules of 4 to 12 carbon atoms as its main
composition (Newman, 2004; DeHaan, 2007; Trotter, 2012) that can broadly be
classified into saturated and aromatic hydrocarbons (Bertsch et al., 1993; Newman,
2004) and some alkanes and other compounds at trace quantities (Bertsch et al.,
1993). In contrast to diesel fuel where alkanes are in large abundance, aromatic
hydrocarbons form a large fraction of gasoline.
Page 27
9
Figure 1.3: Schematic flowchart of a modern complex refinery used in the
production of gasoline petroleum products (DeHaan, 2007)
1.6.2 Alkanes
Alkanes are commonly found in crude oil with carbon numbers ranging from C5 to
C40 although a few alkanes beyond C40 have also been identified (Tissot and Welte,
1984). Alkanes contain only nonpolar (C: carbon H: hydrocarbon) C - C and C - H
bonds and as a result, they exhibit only weak Van Der Waals forces between
molecules and therefore present as gas or liquid at room temperature except for high
Page 28
10
molecular weight alkanes. In general, alkanes can be classified into normal alkanes,
isoalkanes and cycloalkanes.
1.6.2.1 Normal Alkanes
Normal alkanes (n-alkanes) consist of a series of carbon atoms connected by single
bonds in a straight-chain configuration. They have the formula CnH2n+2, where „n‟ is
the number of carbon atoms in the molecule. In hydrocarbon analysis, alkanes as
appear “tree – like structure” in a chromatogram at regular intervals, especially in a
chromatogram of a diesel (Abdullah, 2004). In gasoline, the carbon numbers for n-
alkanes generally span from C5 to C13 but they could be masked by aromatic
compounds which are present in significantly larger abundance in a chromatogram.
An example of n-alkanes is shown in Figure 1.4.
Figure 1.4: n-decane with ten carbons in a long chain
1.6.2.2 Branched-alkanes
Iso-alkanes are branched alkanes. In generally, they are similar to n-alkanes except
they have one or more carbon branches along the straight chain backbone (Abdullah,
2004). The branching structure leads to lower boiling points as compared to their n-
alkanes counterpart although both have the same molecular formula. Branched
alkanes are found in gasoline. Figure 1.5 shows an example of iso-alkanes.
Page 29
11
Figure 1.5: Structure of 2-methylbutane
1.6.2.3 Cycloalkanes
Cycloalkanes are alkanes containing rings of carbon atoms with chemical formula of
CnH2n+2 (Newman, 2004; Katherine et al., 2011). They have higher boiling points
than their corresponding normal alkanes. The cycloalkanes compound found in
gasoline include cyclopentane, methyl-cyclopenthane, cyclohexane and 1,2-
dimethylcyclohexane as shown in Figure 1.6.
Figure 1.6: Cycloalkanes found in gasoline (a: cyclopentane, b: methycyclopentane,
c: cyclohexane and d: 1,2-dimethylcyclohexane)
c
a
d
b
Page 30
12
1.6.3 Aromatic Compounds
Aromatic compounds are compounds that contain the characteristic benzene ring or
its structural relatives in their chemical structures (Seager and Slabaugh, 2000). The
most common aromatic compounds are based on the six-membered aromatic ring-
i.e, the benzene ring (Katherine et al., 2011). In hydrocarbon analysis, aromatic
compounds are generally classified into simple aromatic, polynuclear aromatic
hydrocarbon (PAHs) and indanes (Abdullah, 2004; Stout and Wang, 2007). Simple
aromatic compounds consist of a benzene ring in their chemical structures. Benzene,
carrying the molecular formula C6H6 is the simplest aromatic compounds. In crude
oil, benzene, naphthalene and phenanthrene types are the most abundant (Abdullah,
2004). Figure 1.7 shows the representative structures of aromatic compounds with
single, double and triple benzene rings.
Figure 1.7: Chemical structure of aromatic compounds (a: benzene, b: naphthalene
and c: phenanthrene)
Naphthalene and phenanthrene are known as polynuclear aromatic hydrocarbons
(PAHs) because they are composed of two or more aromatic rings joined together.
Naphthalene has a distinctive aroma and is frequently used as mothballs in the house.
a b c
Page 31
13
Phenanthrene can be found as product of incomplete combustion of fossil fuels and
wood in the environment. In crude oil, aromatic compounds with an alkyl side chain
attached in a cyclic configuration to a benzene ring are called indanes. The side chain
attaches to the benzene ring in two consecutive locations forming a cyclic
configuration. Figure 1.8 shows the structure of an indane.
Figure 1.8: The structure of indane
In gasoline, the big molecule of PAHs were removed during the distillation process,
leaving the lighter aromatic molecules such benzene, toluene, ethylbenzene and
xylene (BTEX) and other alkylbenzenes and some naphthalenes.
1.7 Analytical Methods for Gasoline as Fuels in Molotov Cocktail
The analytical methods available for gasoline analysis in forensic setting have
evolved in line with those used by the geo-chemist in the production of hydrocarbon
products (Stout and Wang, 2007). Gas chromatography (GC) coupled with flame
ionisation detector (FID) and mass spectrometry (MS) have been widely used in oil
spill fingerprinting (Abdullah, 2004; Donald et al., 2004; Christensen and Tomasi,
2007), arson analysis (Bertsch, 1994) and gasoline analysis (Mann, 1987; Coulombe,
1995; Sandercock and Pasquier, 2003a; Sandercock and Pasquier, 2003b; Aleme et
al., 2008). By comparing the chromatographic features of two samples, forensic
Page 32
14
investigators can establish the similarities and differences between the two samples
through the technique known as pattern comparison (Section 1.8). Similarities
indicate that both the samples could have come from the same origin while
differences could indicate that they were from different sources (Abdullah, 2004).
1.7.1 Gas Chromatography–Flame Ionisation Detector
GC-FID analysis provides useful hydrocarbon fingerprints of the sample and can
provide an initial picture of the profile (Donald et al., 2004). Flame ionisation is a
robust detection method (Christensen and Tomasi, 2007). In environmental forensics,
GC-FID is used as a screening technique to characterise hydrocarbons (Wang et al.,
1994; Irwin, 1998; Wait, 2000; Daling and Faksness, 2002). The flame ionisation
detector is a universal detector and responds to large number of hydrocarbons and is
widely used due to its large linear range of sensitivity (Donald et al., 2004).
1.7.2 Gas Chromatography–Mass Spectrometry
GC-MS is currently the most important instrument for forensic analysis of organic
compounds including hydrocarbon compounds (Dolan, 2004; Donald et al., 2004;
Douglas et al., 2007). It consists of a gas chromatograph to separate the compounds
and a mass spectrometer as a detector. Mass spectrometer detects selected ions at
particular (mass-to-charge ratio) m/z values. Identification is based on the fact that a
particular type of structure leads to a particular m/z values of detected ions.
Page 33
15
As pointed out by Newman (2004), in terms of accelerant analysis, GC-MS provided
the additional levels of pattern recognition because each class of hydrocarbons
(alkanes, cycloalkanes, aromatic) produce ion fragments that can be used to indicate
the compound class (Newman, 2004). For instance, the normal alkanes produce ion
fragments at m/z of 3, 57, 71 and 86. Therefore, extracting these ions can produce an
extracted ion chromatograms (EIC) for the examination of a sample especially when
the sample is mixed with background material (Dolan, 2004), that could have made
the total ion chromatogram different due to contaminations.
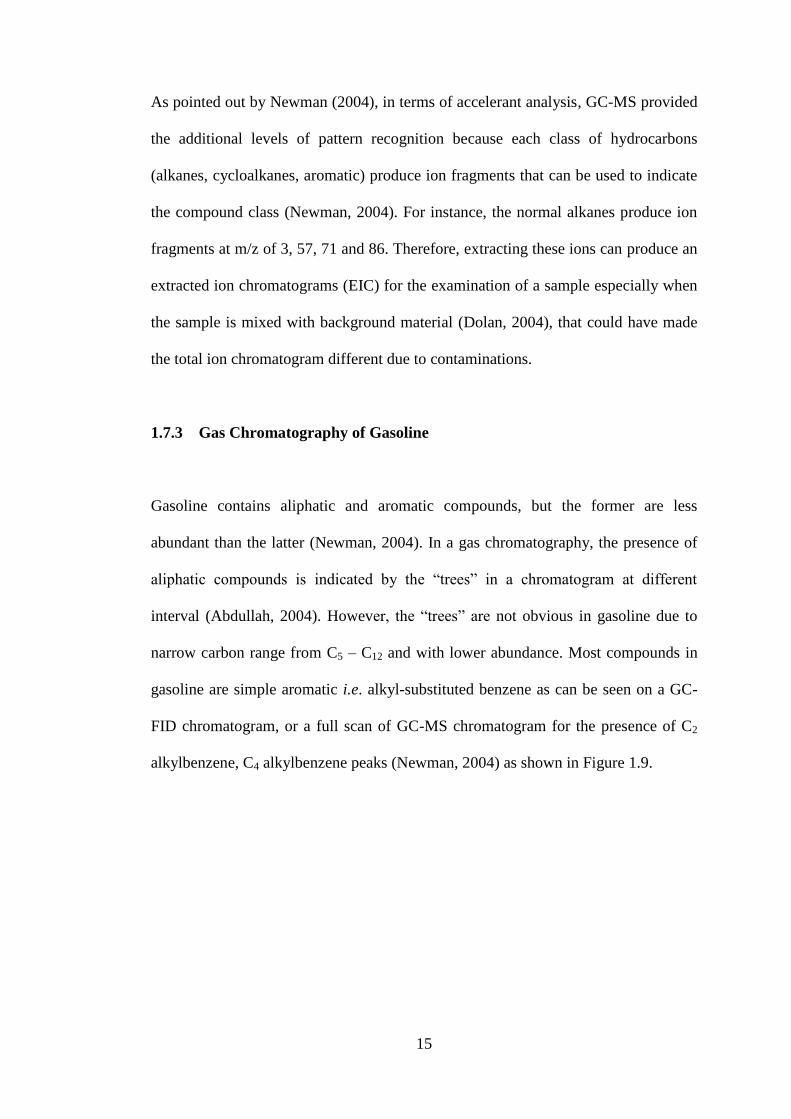
1.7.3 Gas Chromatography of Gasoline
Gasoline contains aliphatic and aromatic compounds, but the former are less
abundant than the latter (Newman, 2004). In a gas chromatography, the presence of
aliphatic compounds is indicated by the “trees” in a chromatogram at different
interval (Abdullah, 2004). However, the “trees” are not obvious in gasoline due to
narrow carbon range from C5 – C12 and with lower abundance. Most compounds in
gasoline are simple aromatic i.e. alkyl-substituted benzene as can be seen on a GC-
FID chromatogram, or a full scan of GC-MS chromatogram for the presence of C2
alkylbenzene, C4 alkylbenzene peaks (Newman, 2004) as shown in Figure 1.9.
Page 34
16
Figure 1.9: Peak patterns for alkylbenzenes found in gasoline (Newman, 2004)
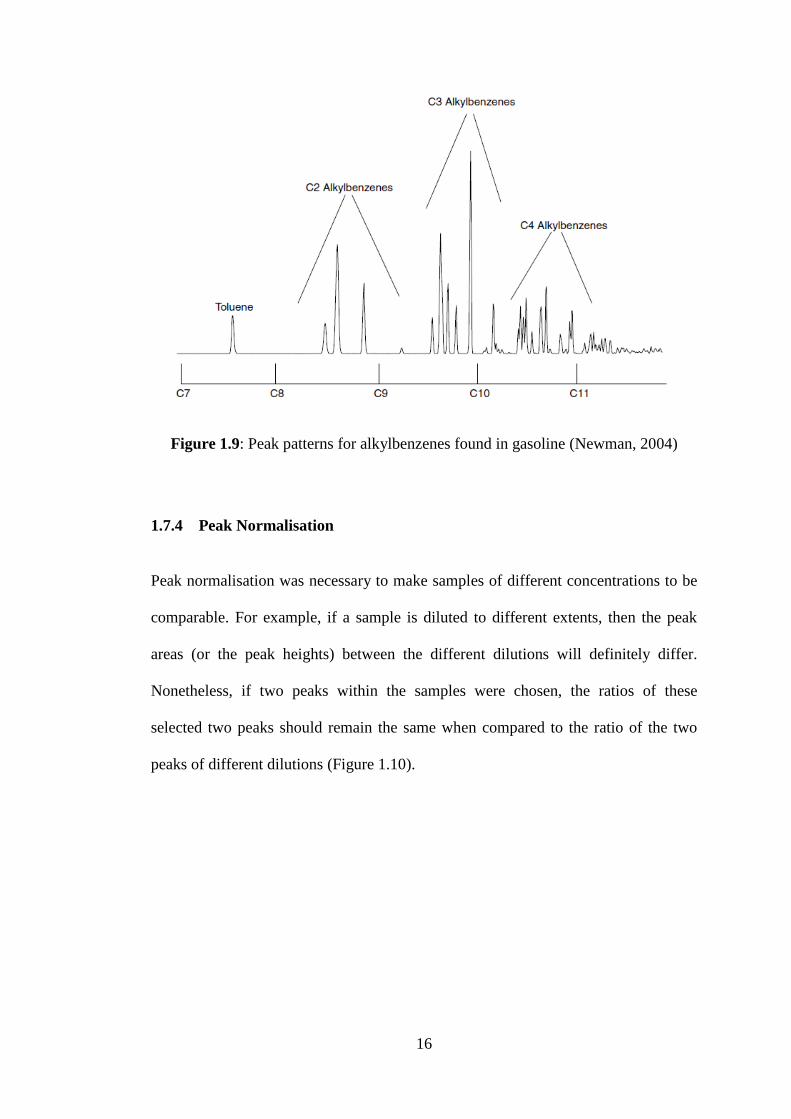
1.7.4 Peak Normalisation
Peak normalisation was necessary to make samples of different concentrations to be
comparable. For example, if a sample is diluted to different extents, then the peak
areas (or the peak heights) between the different dilutions will definitely differ.
Nonetheless, if two peaks within the samples were chosen, the ratios of these
selected two peaks should remain the same when compared to the ratio of the two
peaks of different dilutions (Figure 1.10).
Page 35
17
Figure 1.10: Ratio of the two peaks of different dilutions
Even the samples were prepared with the same concentration; more of one sample
may have been introduced into the GC thus producing chromatograms of different
response between the two injections (of the same sample). Under such
circumstances, peak normalisation is necessary to make the data from different
chromatogram comparable.
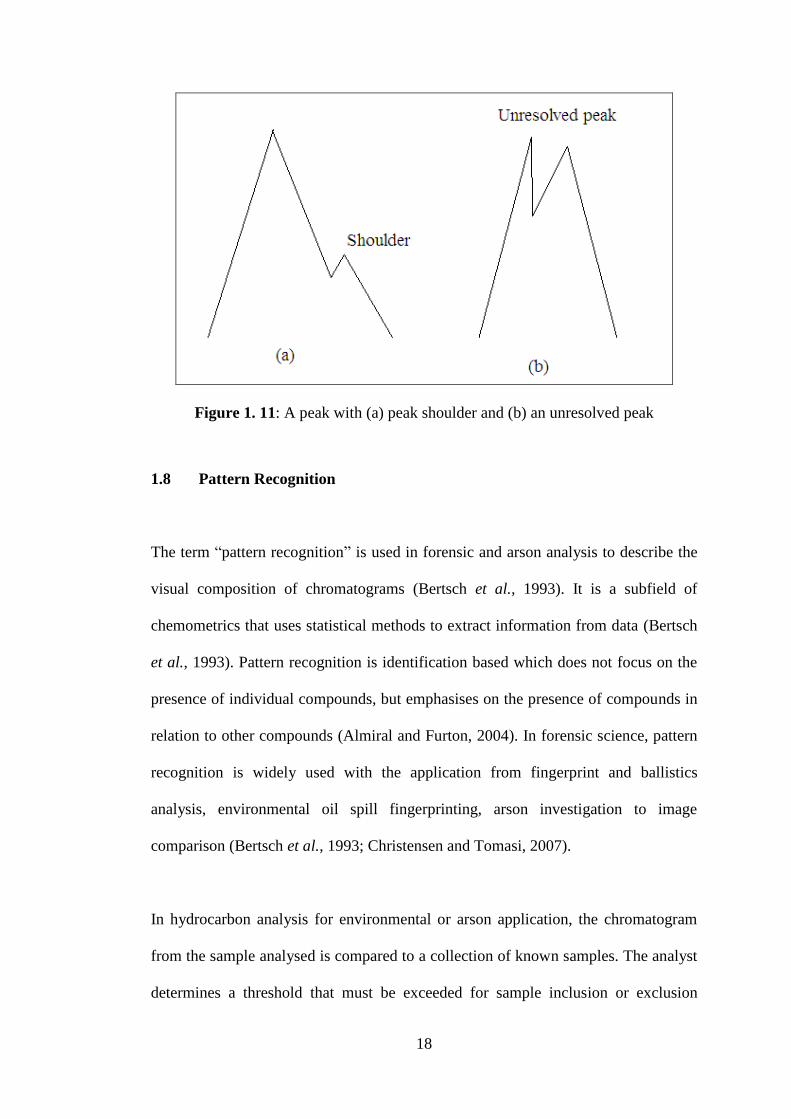
The peaks selected for integration should fulfil some criteria‟s. Peaks might either
contain shoulders, Figure 1.11 (a) or unresolved (b), making integration inaccurate if
the same peaks were to be used for comparison. If a peak appears too small, it could
be associated with a larger error of integration especially when peak area is used
(Abdullah, 2004), see also Figure 1.11 (b).
Page 36
18
Figure 1. 11: A peak with (a) peak shoulder and (b) an unresolved peak
1.8 Pattern Recognition
The term “pattern recognition” is used in forensic and arson analysis to describe the
visual composition of chromatograms (Bertsch et al., 1993). It is a subfield of
chemometrics that uses statistical methods to extract information from data (Bertsch
et al., 1993). Pattern recognition is identification based which does not focus on the
presence of individual compounds, but emphasises on the presence of compounds in
relation to other compounds (Almiral and Furton, 2004). In forensic science, pattern
recognition is widely used with the application from fingerprint and ballistics
analysis, environmental oil spill fingerprinting, arson investigation to image
comparison (Bertsch et al., 1993; Christensen and Tomasi, 2007).
In hydrocarbon analysis for environmental or arson application, the chromatogram
from the sample analysed is compared to a collection of known samples. The analyst
determines a threshold that must be exceeded for sample inclusion or exclusion
Page 37
19
(Bertsch et al., 1993). It is important to note that the physical arrangement and
graphic presentation may effect human perception and therefore a number of steps
should be followed (Bertsch et al., 1993; ASTM D3328-00, 2000). In visual
comparison, patterns (such as chromatograms and peaks) of similar size are preferred
than those displayed at different size (Bertsch et al., 1993) and the overlay
techniques for accelerant are normally used if the chromatograms could be produced
at the same magnitude (Bertsch et al., 1993; ASTM D3328-00, 2000).
With the advancement of computer software, data displaying software in modern gas
chromatographer has facilitated chromatogram comparison. An early literature by
Tontarski and Strobel (1982) described the computer aided pattern recognition to
adjustment of the scale of the chromatogram (Tontarski and Strobel, 1982). The
chromatogram was divided into different windows for comparison (Figure 1.12) and
this step by step analytical procedure is still being practised until today.
Figure 1. 12: The chromatogram was divided into different windows for step by step
comparison (Tontarski and Strobel, 1982)
Page 38
20
Statistical analysis has been used to classify hydrocarbon products for forensic
purpose (Stout, 2001; Sandercock and Pasquier, 2003a; Sandercock and Pasquier,
2003b; Wang and Fingas, 2003; Wang et al., 2004; Wang et al., 2005; Wang et al.,
2006; Barbeira et al., 2007; Bartolome et al., 2007; Ebrahimi et al., 2007; Ebrahimi
and Hibbert, 2008; Hupp et al., 2008). Multivariate statistical technique such as
Principal Components Analysis (PCA) has been used to visualise the relations
between samples using chromatographic data (Sandercock and Pasquier, 2003a;
Barbeira et al., 2007). For instance, Abdullah (2004) have used PCA and
dendrograms to differentiate diesel samples collected from service stations in
Auckland and fishing boats (Abdullah, 2004). A study of the variability of fresh
diesel from service stations in Kota Bharu using GC-MS and PCA was also
conducted by the same research group (Azah and Abdullah, 2011). For gasoline,
Sandercook and Pasquier (2003) have also applied the PCA for the fingerprinting of
unevaporated automotive samples in Australia and New Zealand (Sandercock and
Pasquier, 2003a) while Barbeira reported the use of PCA for the identification of
gasoline origin (Barbeira et al., 2007).
1.8.1 Principal Component Analysis
PCA is a multivariate analysis used to analyse and visualise the differences between
samples (Abdullah, 2004; Christensen and Tomasi, 2007; Azah and Abdullah, 2011).
PCA creates new independent variables which contain much of the information from
the original data thus reduces the multiple dimensions of the raw data into a few
principal components (PC1, PC2, PC3…). The first principal component (PC1)
explains the most possible amount of variability in the data followed by the second
Page 39
21
principal component (PC2) that explains the second largest amount of variability in
the data, and so on for the third principal component (PC3), the fourth principal
components, etc.
1.9 Analytical Methods
Tontarski and Stobel (1982) reported a method for rapid screening of arson samples
using a sorption elution sampling setup followed by GC analysis in early 1982.
(Tontarski and Strobel, 1982). This method is very similar to ASTM E1388-00
method developed later. In many instances, accelerant or oil samples with or without
cleaning with a suitable solvent such as dichloromethane (DCM) are subjected to GC
analysis (Stout, 2001; Sandercock and Pasquier, 2003a; Abdullah, 2004; Wang et al.,
2004; Hupp et al., 2008). Sandercock and Pasquier (2003) also applied a solid phase
extraction to separate aliphatic and aromatic compounds prior to GC-MS analysis
(Sandercock and Pasquier, 2003a; Sandercock and Pasquier, 2003b). A comparison
of unevaporated gasoline from Australia and New Zealand was also conducted by the
same research group using GC-MS which reported the ability to differentiate the
country of origin (Sandercock and Pasquier, 2004).
The ASTM E 1385-00 is the standard practice for separation and concentration of
ignitable liquid residues from fire debris samples by steam distillation published by
American Society for Testing and Materials (ASTM). Steam distillation is not a
popular method and it is the least sensitive and most complex technique for ignitable
liquid separation (ASTM E1385-00, 2000). Its use is extremely limited in forensic
laboratories and is not intended as a primary extraction technique.
Page 40
22
The ASTM E 1386-00 is the Standard Practice for Separation and Concentration of
Ignitable Liquid Residues from Fire Debris Samples by Solvent Extraction that
explains the procedure to extract residue of combustible liquid from fire debris using
suitable solvent for subsequent gas chromatography analysis (ASTM E1386-00,
2000). The procedure may not be a primary technique to extract combustible liquid
as it is often related to its low sensitivity, messy with significant background
substrate contamination, and is destructive in nature (Newman, 2004). The
procedure is particularly useful when the analyst need to extract over a wide range of
concentration and allows for distinguishing among the types of fuel oil (ASTM
E1386-00, 2000).
The ASTM E 1387-01 is a Standard Test Method for Ignitable Liquid Residues in
Extracts from Fire Debris Samples by Gas Chromatography which is used together
with ASTM E1385, ASTM E1386 and ASTM 1388 (ASTM E1385-00, 2000; ASTM
E1386-00, 2000; ASTM E1388-00, 2000). It covers the steps for extracting a small
quantity of accelerant vapour at the headspace of the sample container. The method
notes that repeat and inter laboratory analyses are possible (ASTM E1388-00, 2000).
The ASTM E 1618-06 is a Standard Test Method for Ignitable Liquid Residue in
Extracts from Fire Debris Samples by Gas Chromatography-Mass Spectrometry. The
standard describes the procedures for the identification of ignitable liquids residues
from fire debris samples (ASTM E1618-06, 2006). It is applicable for most samples,
also co-extract back-ground materials from the substrate. Sample handling
procedures, accelerant classification and target compound identification are
described (ASTM E1618-06, 2006). The standard notes that pattern matching of
Page 41
23
chromatograms “rarely gives perfect correction with reference liquids”, and therefore
analysts should evaluate visual pattern with care. In this thesis, this method is slightly
modified for GC-MS analysis.
1.10 Weathering of Gasoline as Fuel in Molotov Cocktail
Depending on the environmental conditions and length of time elapsed, the chemical
composition of gasoline from an exploded Molotov cocktail will subject to
evaporation or even dissolution if the fuel survived from combustion. In such cases,
information on the impact of the evaporation and dissolution on the composition
profile of the fuel is important if profile composition to a suspected source need to be
carried out.
The rate of evaporation depends on the composition of an oil (Charles et al., 2000).
Evaporation removes low-boiling point components which can be observed from GC
chromatograms (Nortest, 1991). Gasoline fuel contains low to medium boiling
hydrocarbon components. The lighter compounds such as n-pentene, n-heptane and
toluene are easily evaporated even at room temperature due to their high volatility
and this explains why gasoline can cause inhalation hazards as opposed to diesel. As
evaporation occurs to a large extent, the chromatographic features changes
(Abdullah, 2004) and this might make comparison difficult if not impossible. An
example of distortion is the loss of the lower boiling alkylbenzenes (Bertsch et al.,
1993) such as toluene, followed by C2-alkylbenzenez and C3-alkylbenzenes.
Page 42
24
When gasoline is mixed with water, dissolution of compounds may occur.
Dissolution removes components according to their solubility in the following
sequence: hetero compounds > aromatic hydrocarbon > saturated compounds
(Nortest, 1991). According to Nortest (1991), water solubility will reduce with
higher substitutions. Therefore C1-phenanthrene is less soluble than phenanthrene,
and C3-phenanthrene is even less soluble than C1-phenanthrene. In an event of oil
spill, gasoline is more likely to cause aquatic toxicity as aromatic compounds are
toxic to aquatic life (Charles et al., 2000). However, due to its volatility, gasoline
will also evaporate off relatively fast.
1.11 Significance of Study
The use of gasoline in producing Molotov cocktail has been reported. In this study,
the gasoline samples from two different companies were investigated, namely Shell
and Petronas. All the samples were obtained from the service station in Kota Bharu
and Bachok district. This study is important to investigate the cases involving
Molotov cocktail and to link them between different cases, or to a particular source
or the people involving.
1.11 Aim and Objectives
There has been an increased in the numbers of the Molotov cocktails being used
illegally or seized by the law enforcement personnel in Malaysia in various
occasions. For intelligence gathering and investigation purposes at the forensic
laboratory of Royal Malaysia Police, information on the analysis of fuels in Molotov