52
| Date post: | 14-Apr-2017 |
| Category: |
Technology |
| Upload: | brightcove |
| View: | 5,945 times |
| Download: | 0 times |


VIDEO MOVES REVENUE
Publishers Luncheon 18 November 2015
Brought to you by Brightcove

MONETISING VIDEO Ben Morrell, Senior Technical Consultant for Media, Brightcove

4 | ©2015 Brightcove Inc
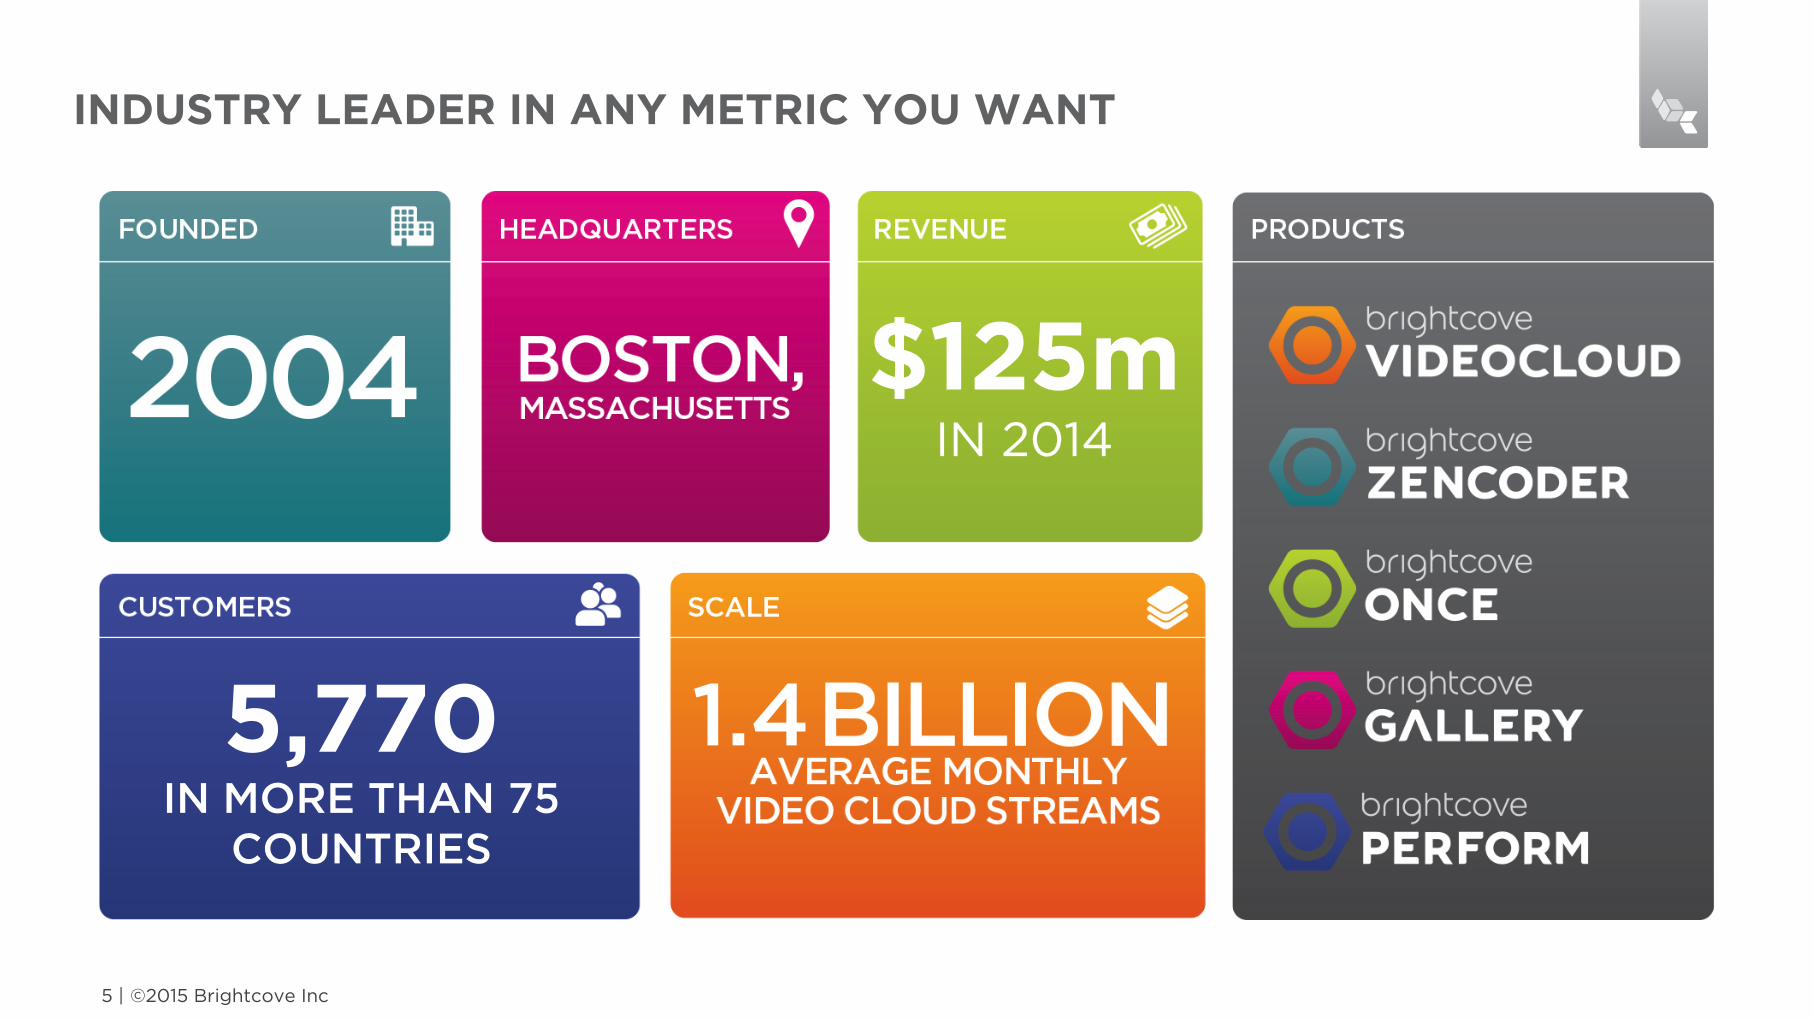
INDUSTRY LEADER IN ANY METRIC YOU WANT
©2015 Brightcove Inc 5 |
1.4 5,770 IN MORE THAN 75
COUNTRIES
$125m IN 2014
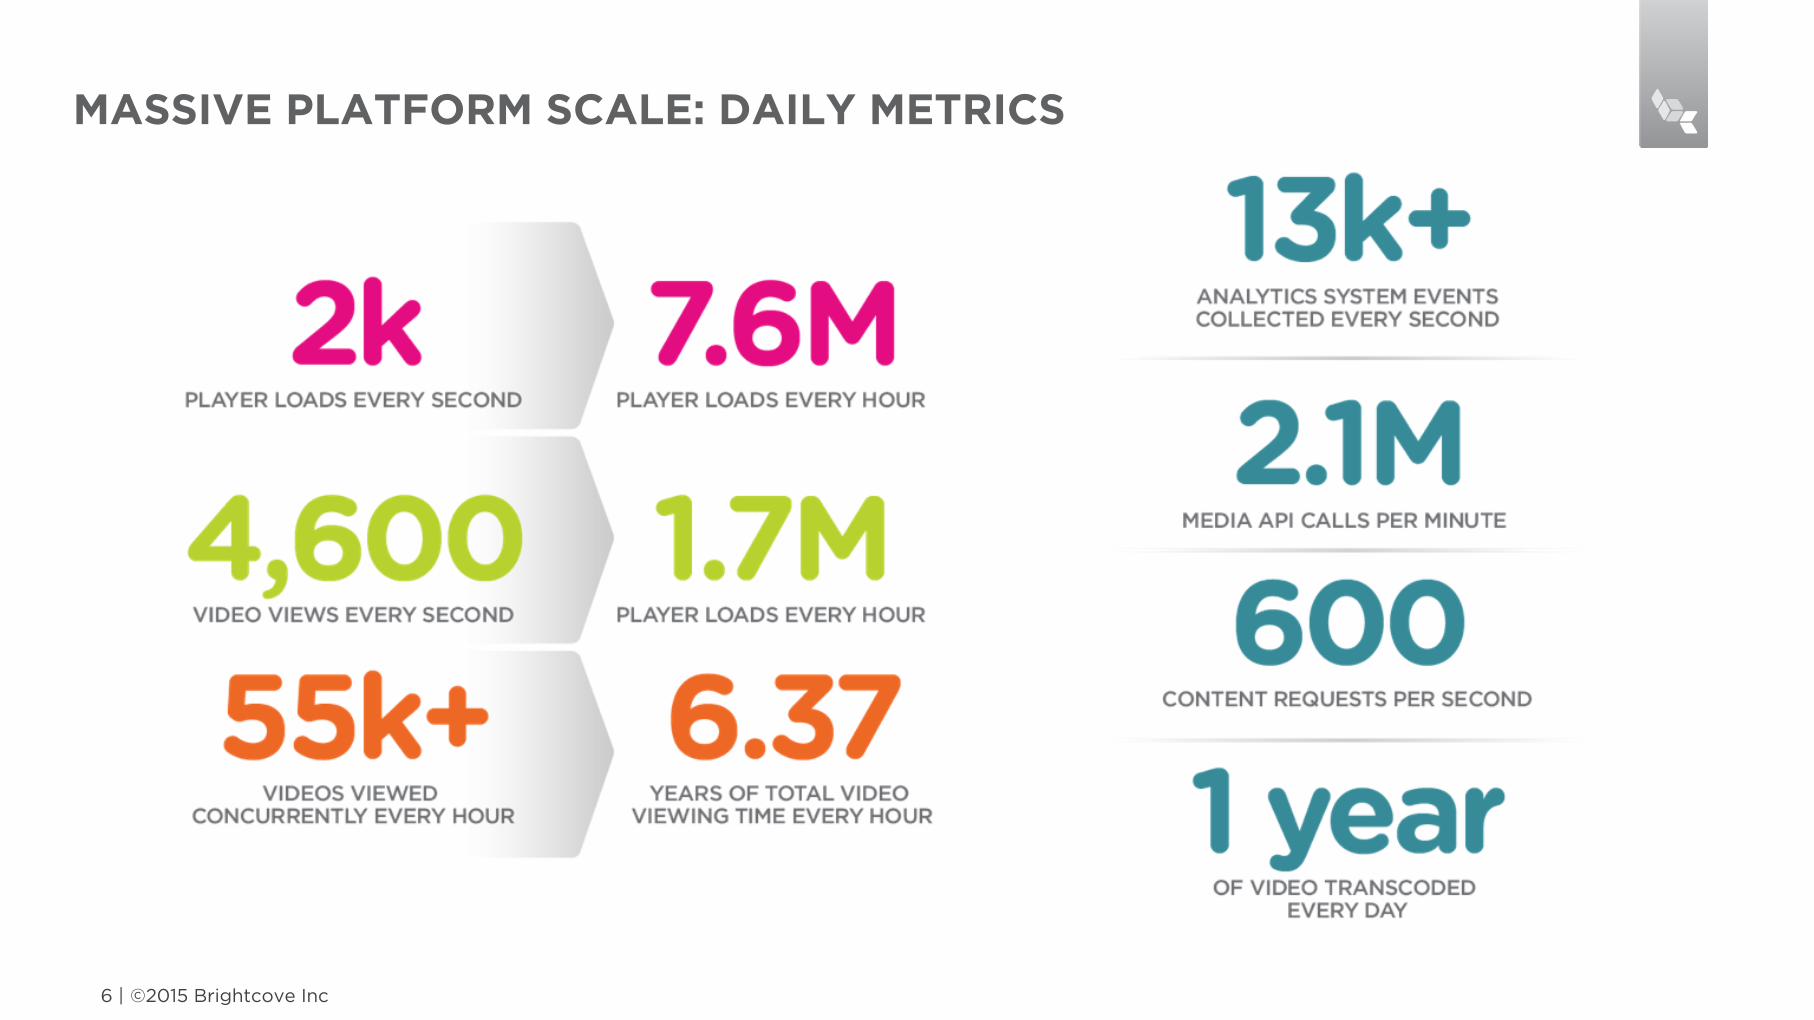
MASSIVE PLATFORM SCALE: DAILY METRICS
©2015 Brightcove Inc 6 |
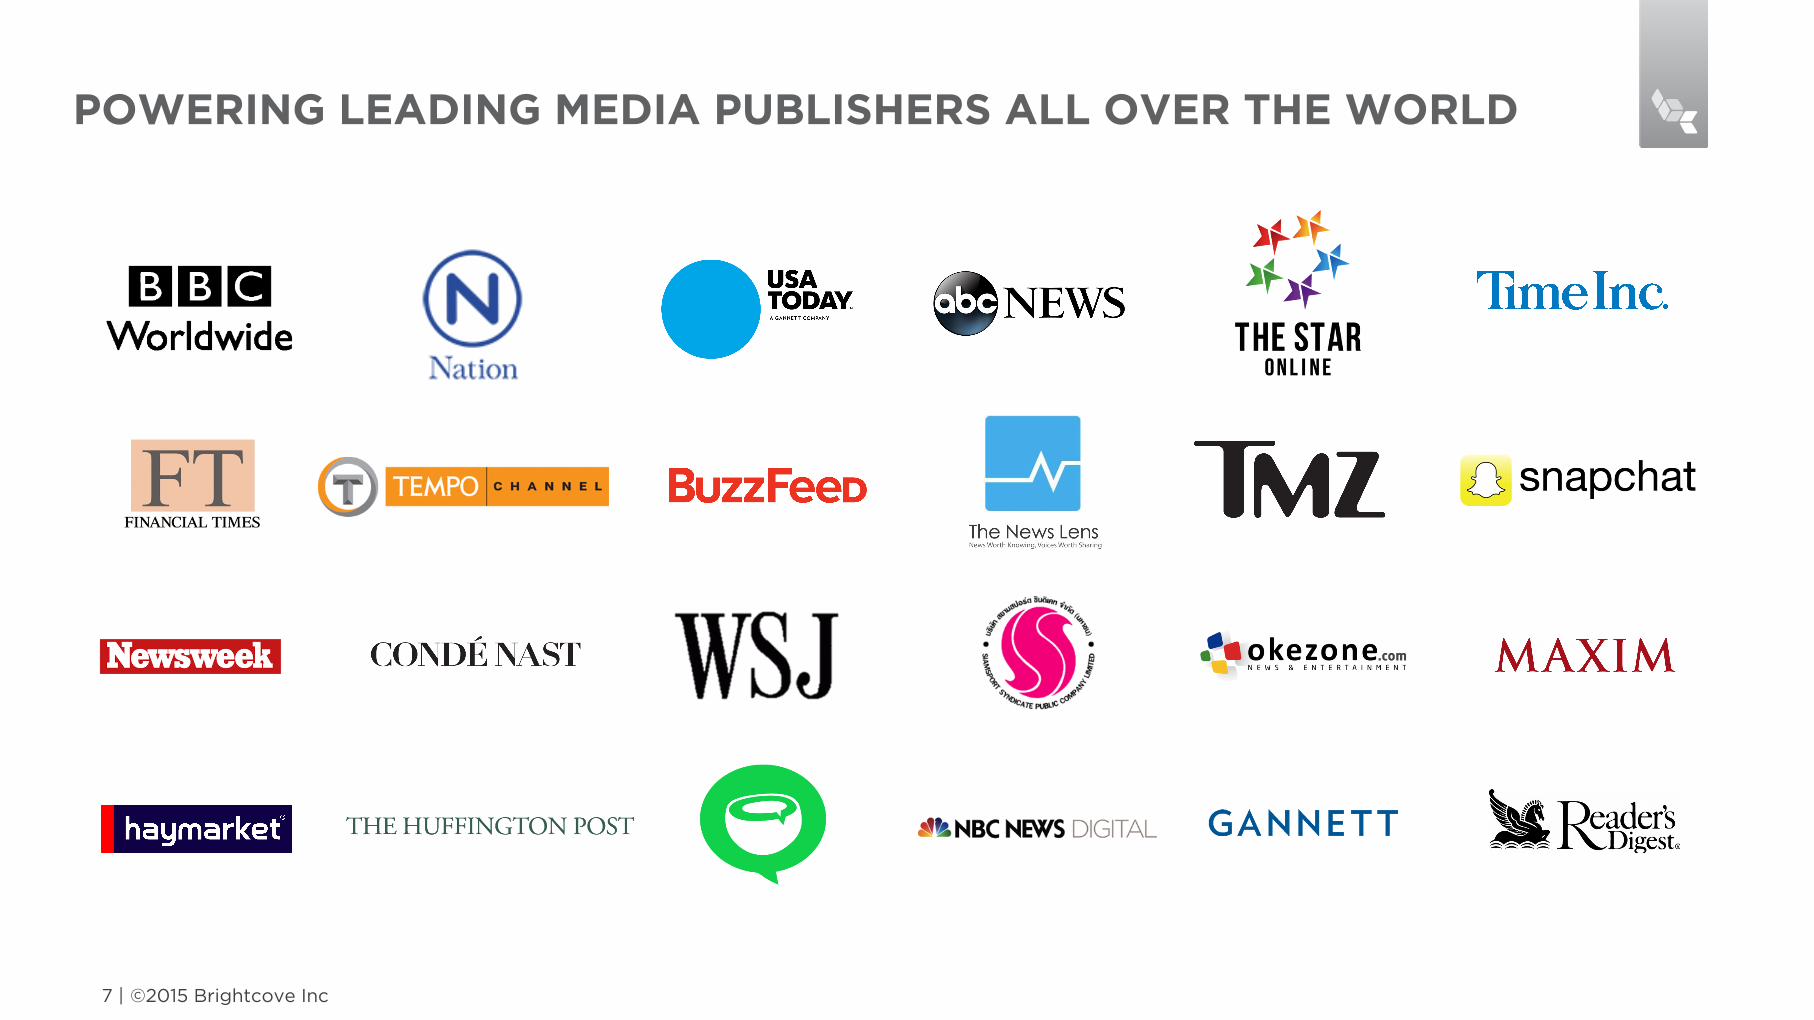
POWERING LEADING MEDIA PUBLISHERS ALL OVER THE WORLD
©2015 Brightcove Inc 7 |

AGENDA
• Market Trends
• Monetisation Live Use Cases
• Challenges
• 3-Point Monetisation Checklist
©2015 Brightcove Inc 8 |
Brought to you by Brightcove
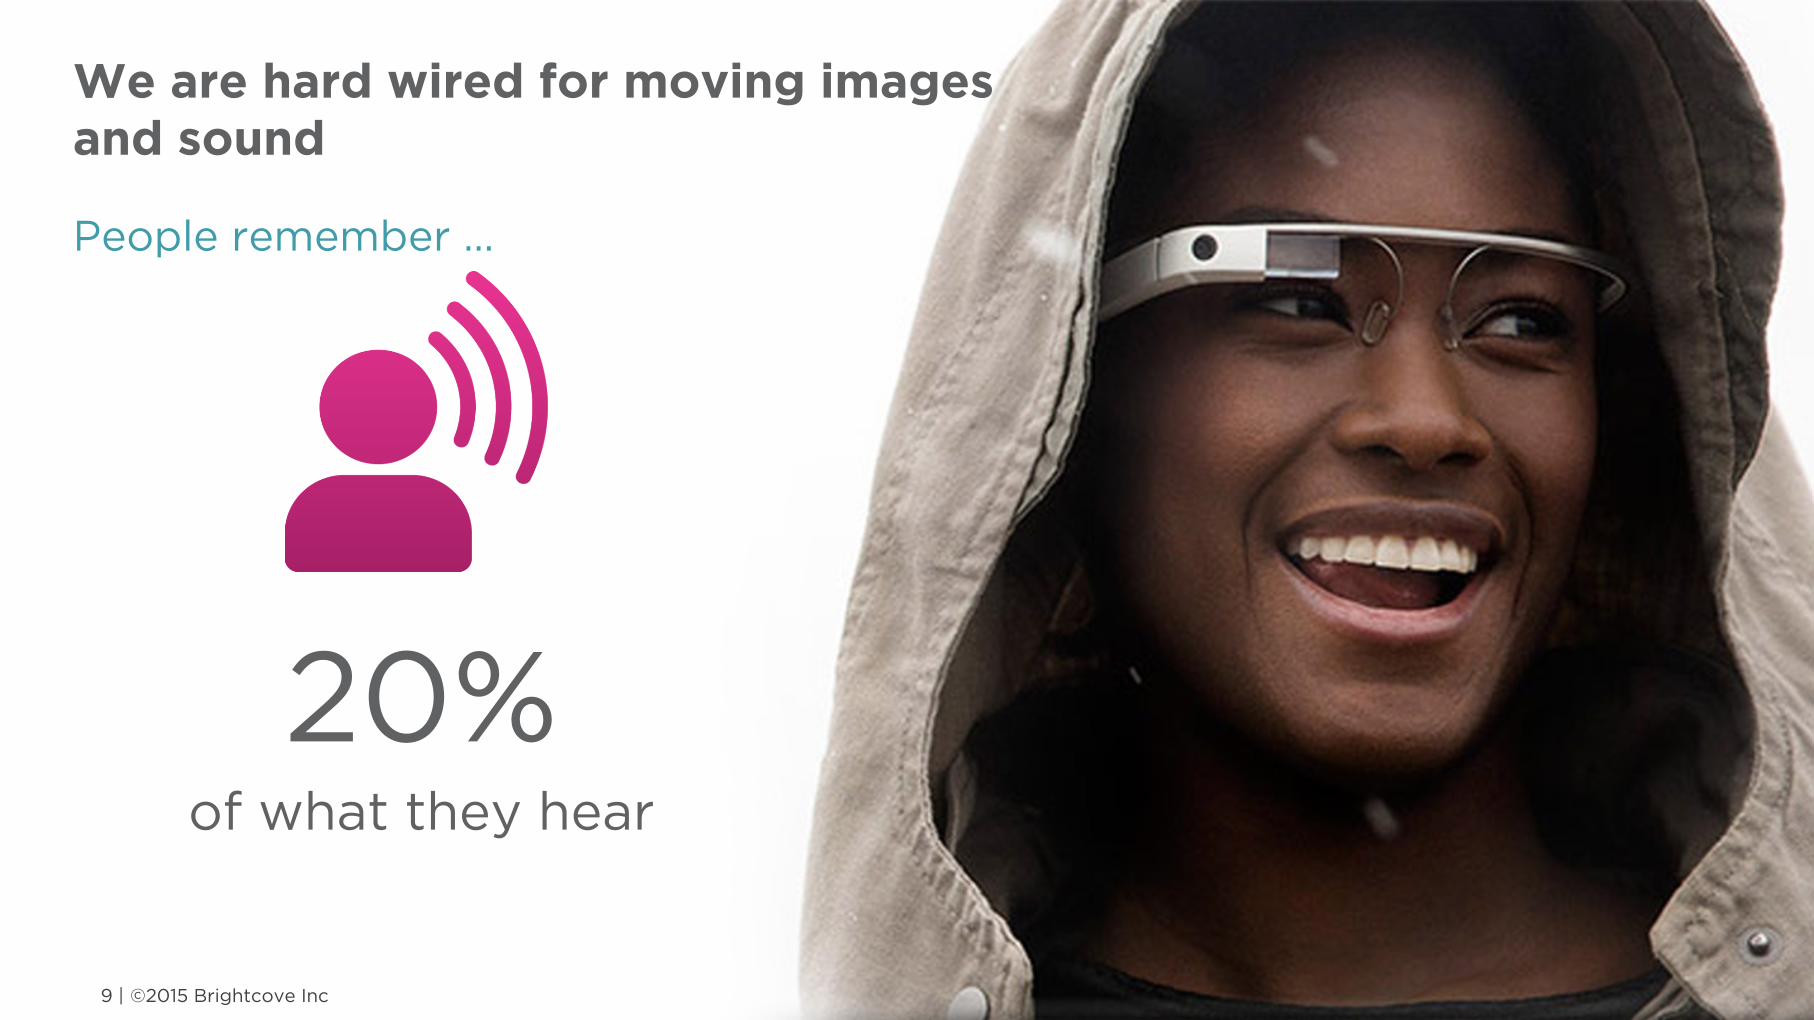
We are hard wired for moving images and sound
People remember …
©2015 Brightcove Inc 9 |
20% of what they hear

People remember …
©2015 Brightcove Inc 10 |
We are hard wired for moving images and sound
30% of what they see

People remember …
©2015 Brightcove Inc 11 |
We are hard wired for moving images and sound
70% of what they see
and hear
Growing smartphone penetration compels publishers to secure a post-print future off the desktop
©2015 Brightcove Inc 12 |
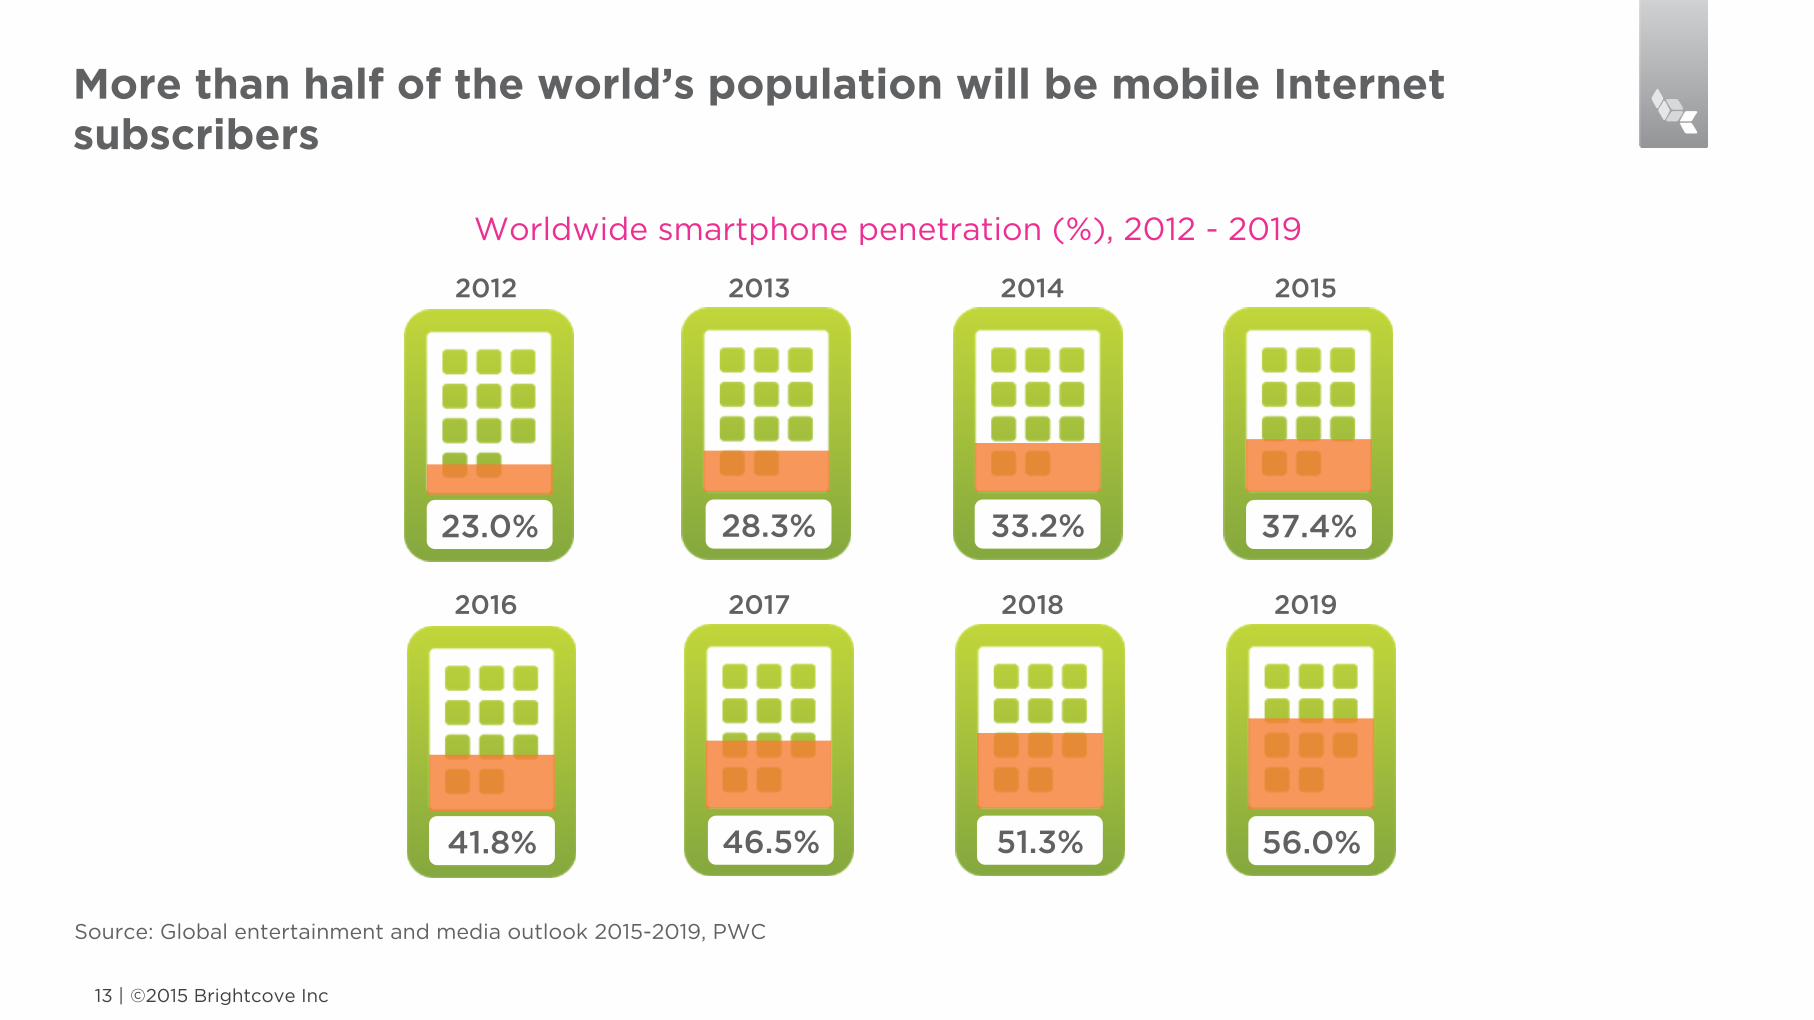
Worldwide smartphone penetration (%), 2012 - 2019
©2015 Brightcove Inc 13 |
2012 2013 2014 2015
2016 2017 2018 2019
23.0% 28.3% 33.2% 37.4%
41.8% 46.5% 51.3% 56.0%
More than half of the world’s population will be mobile Internet subscribers
Source: Global entertainment and media outlook 2015-2019, PWC
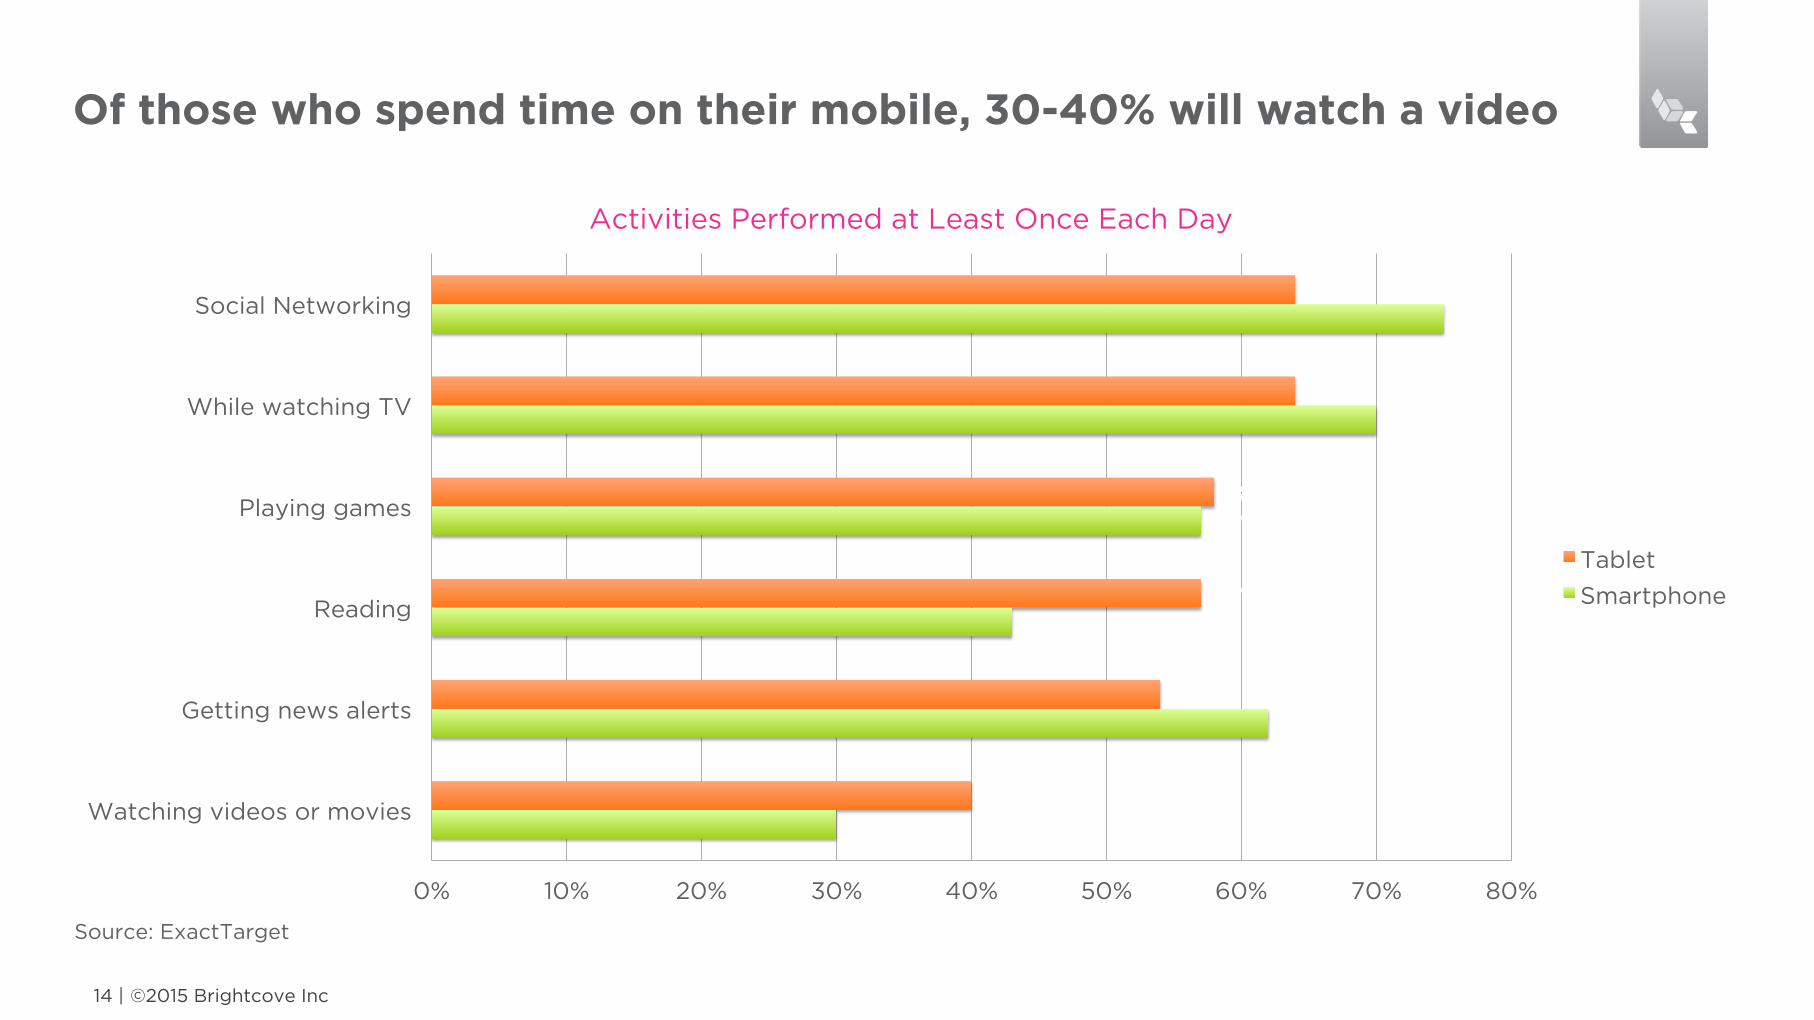
Of those who spend time on their mobile, 30-40% will watch a video
©2015 Brightcove Inc 14 |
30%
62%
43%
57%
70%
75%
40%
54%
57%
58%
64%
64%
0% 10% 20% 30% 40% 50% 60% 70% 80%
Watching videos or movies
Getting news alerts
Reading
Playing games
While watching TV
Social Networking
Activities Performed at Least Once Each Day
Tablet
Smartphone
Source: ExactTarget
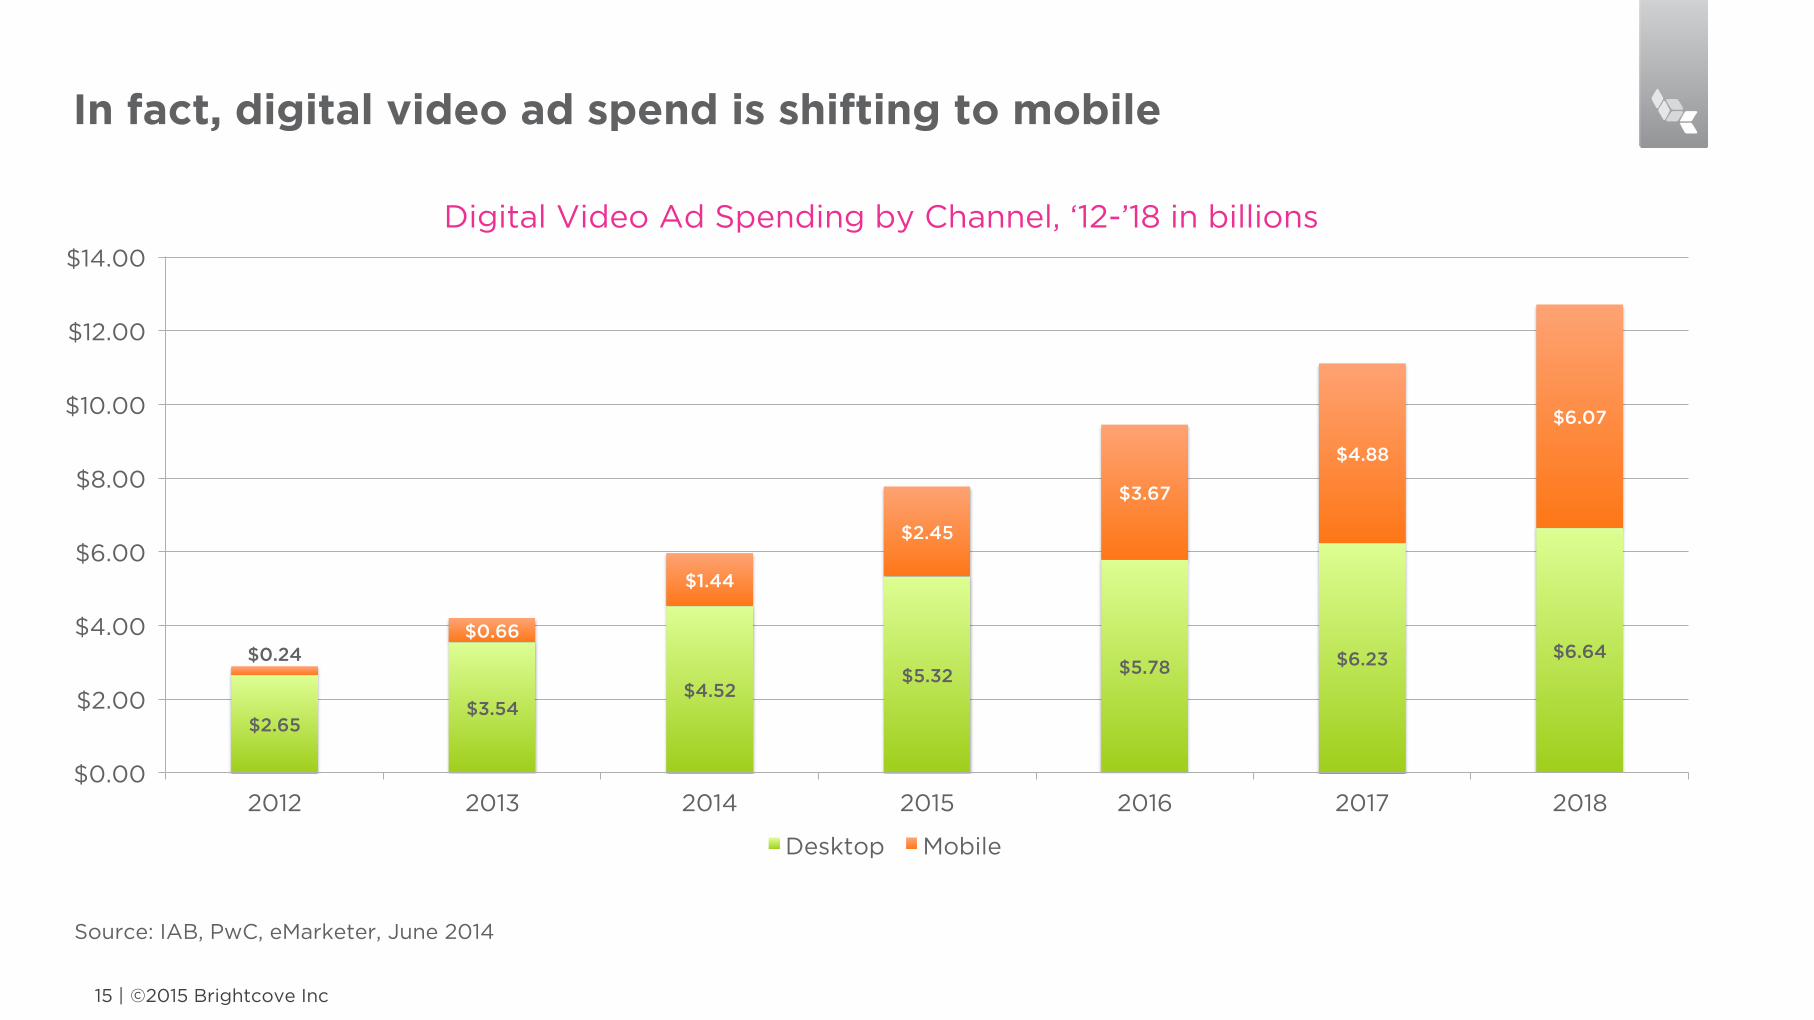
In fact, digital video ad spend is shifting to mobile
©2015 Brightcove Inc 15 |
$2.65 $3.54
$4.52 $5.32 $5.78 $6.23 $6.64 $0.24
$0.66
$1.44
$2.45
$3.67
$4.88
$6.07
$0.00
$2.00
$4.00
$6.00
$8.00
$10.00
$12.00
$14.00
2012 2013 2014 2015 2016 2017 2018
Digital Video Ad Spending by Channel, ‘12-’18 in billions
Desktop Mobile
Source: IAB, PwC, eMarketer, June 2014
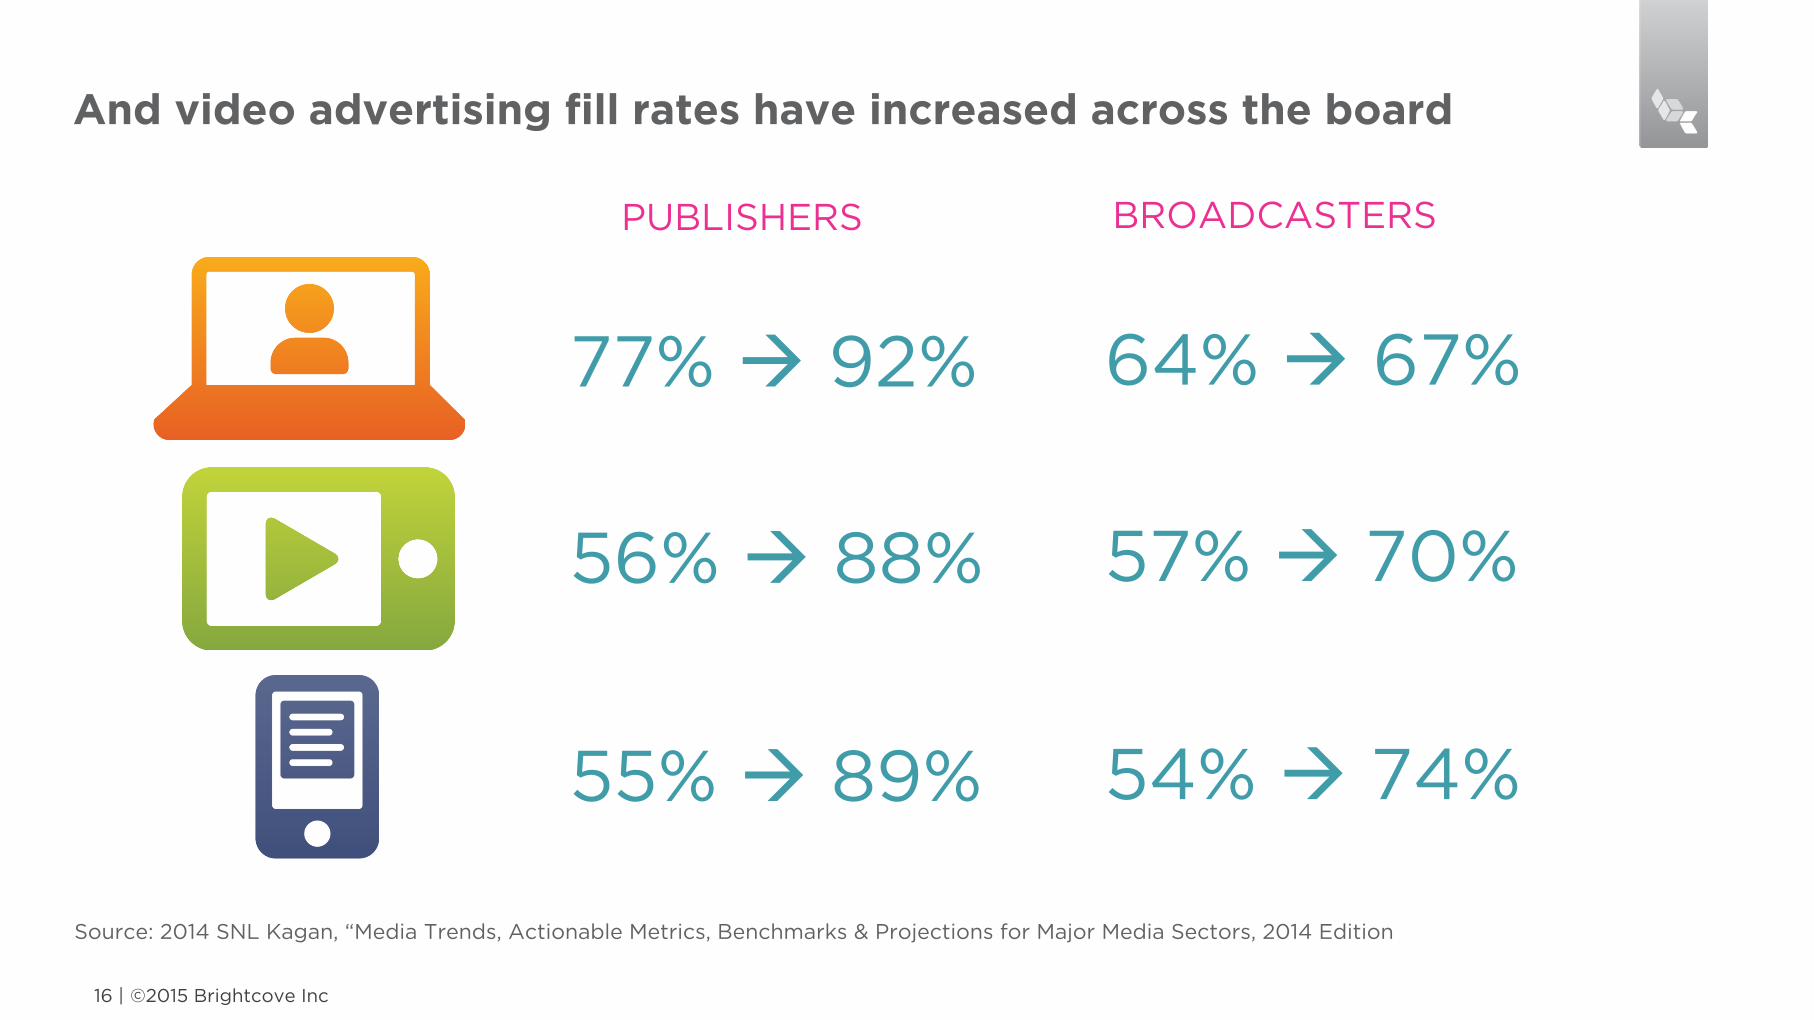
And video advertising fill rates have increased across the board
©2015 Brightcove Inc 16 |
PUBLISHERS BROADCASTERS
77% à 92% 64% à 67%
56% à 88% 57% à 70%
55% à 89% 54% à 74%
Source: 2014 SNL Kagan, “Media Trends, Actionable Metrics, Benchmarks & Projections for Major Media Sectors, 2014 Edition
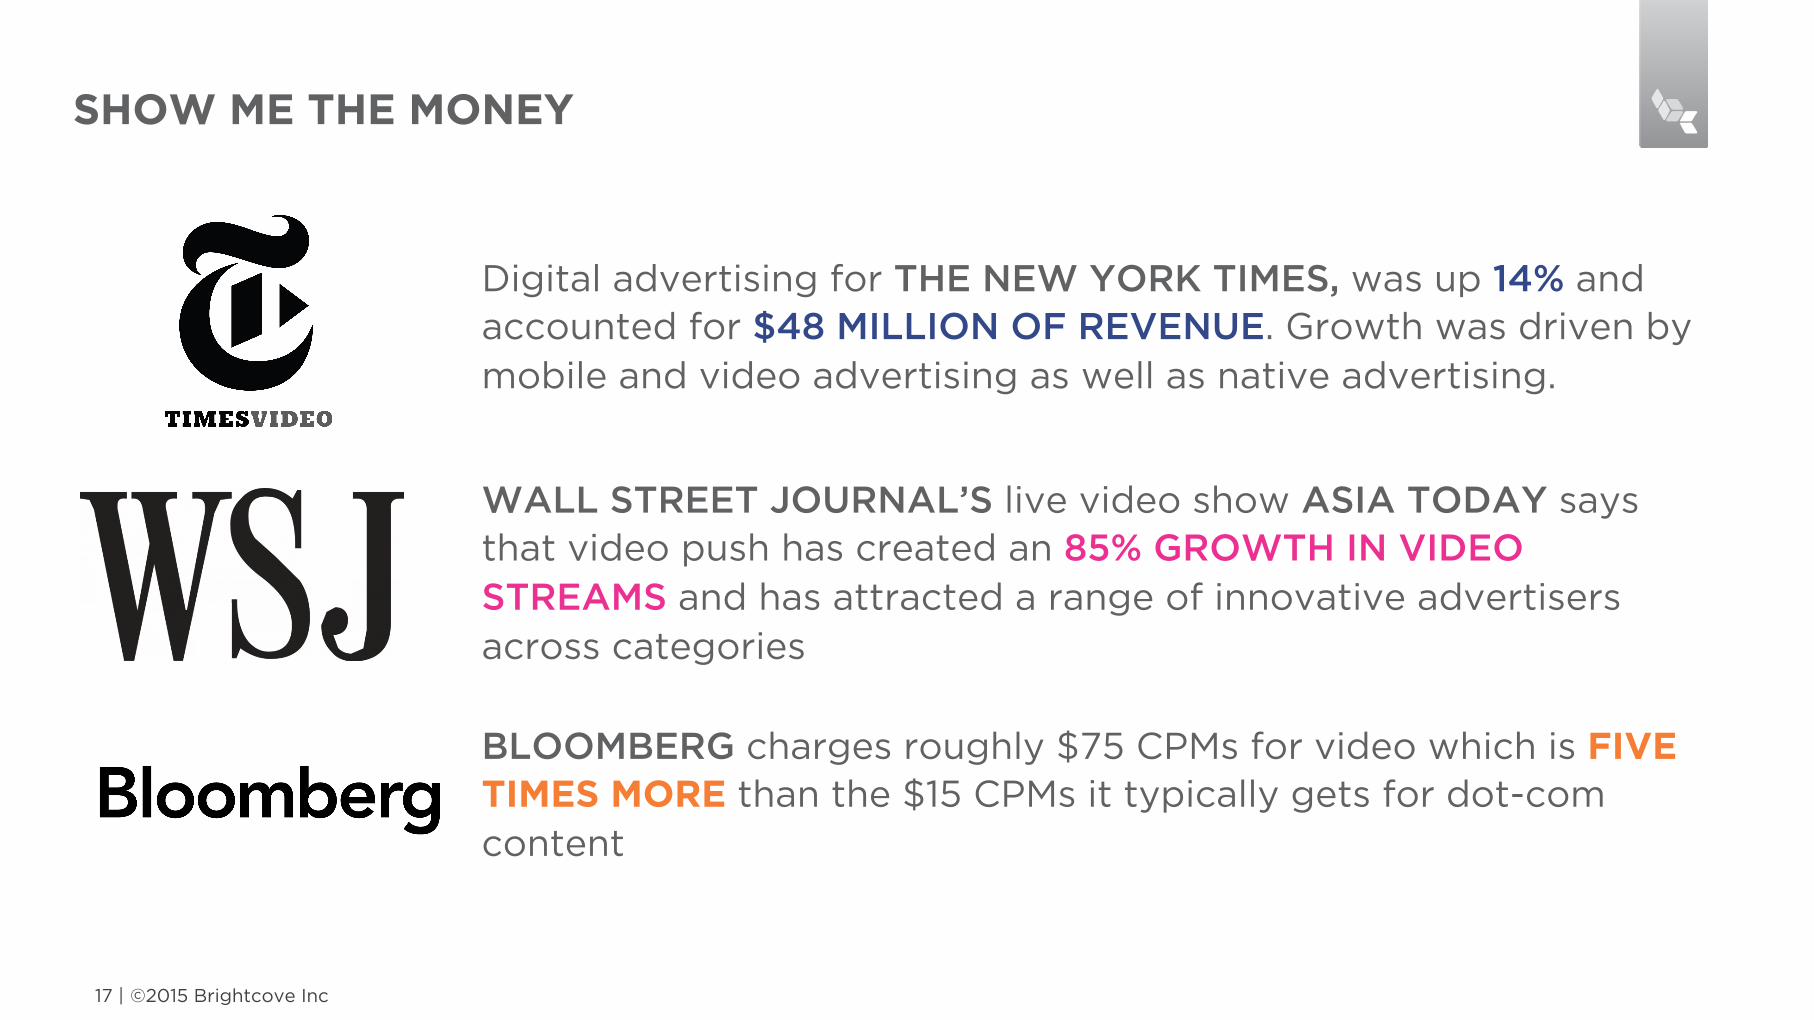
SHOW ME THE MONEY
©2015 Brightcove Inc 17 |
Digital advertising for THE NEW YORK TIMES, was up 14% and accounted for $48 MILLION OF REVENUE. Growth was driven by mobile and video advertising as well as native advertising.
WALL STREET JOURNAL’S live video show ASIA TODAY says that video push has created an 85% GROWTH IN VIDEO STREAMS and has attracted a range of innovative advertisers across categories
BLOOMBERG charges roughly $75 CPMs for video which is FIVE TIMES MORE than the $15 CPMs it typically gets for dot-com content
Social media is creating a big impact on how news is distributed, consumed and ultimately monetised
©2015 Brightcove Inc 18 |
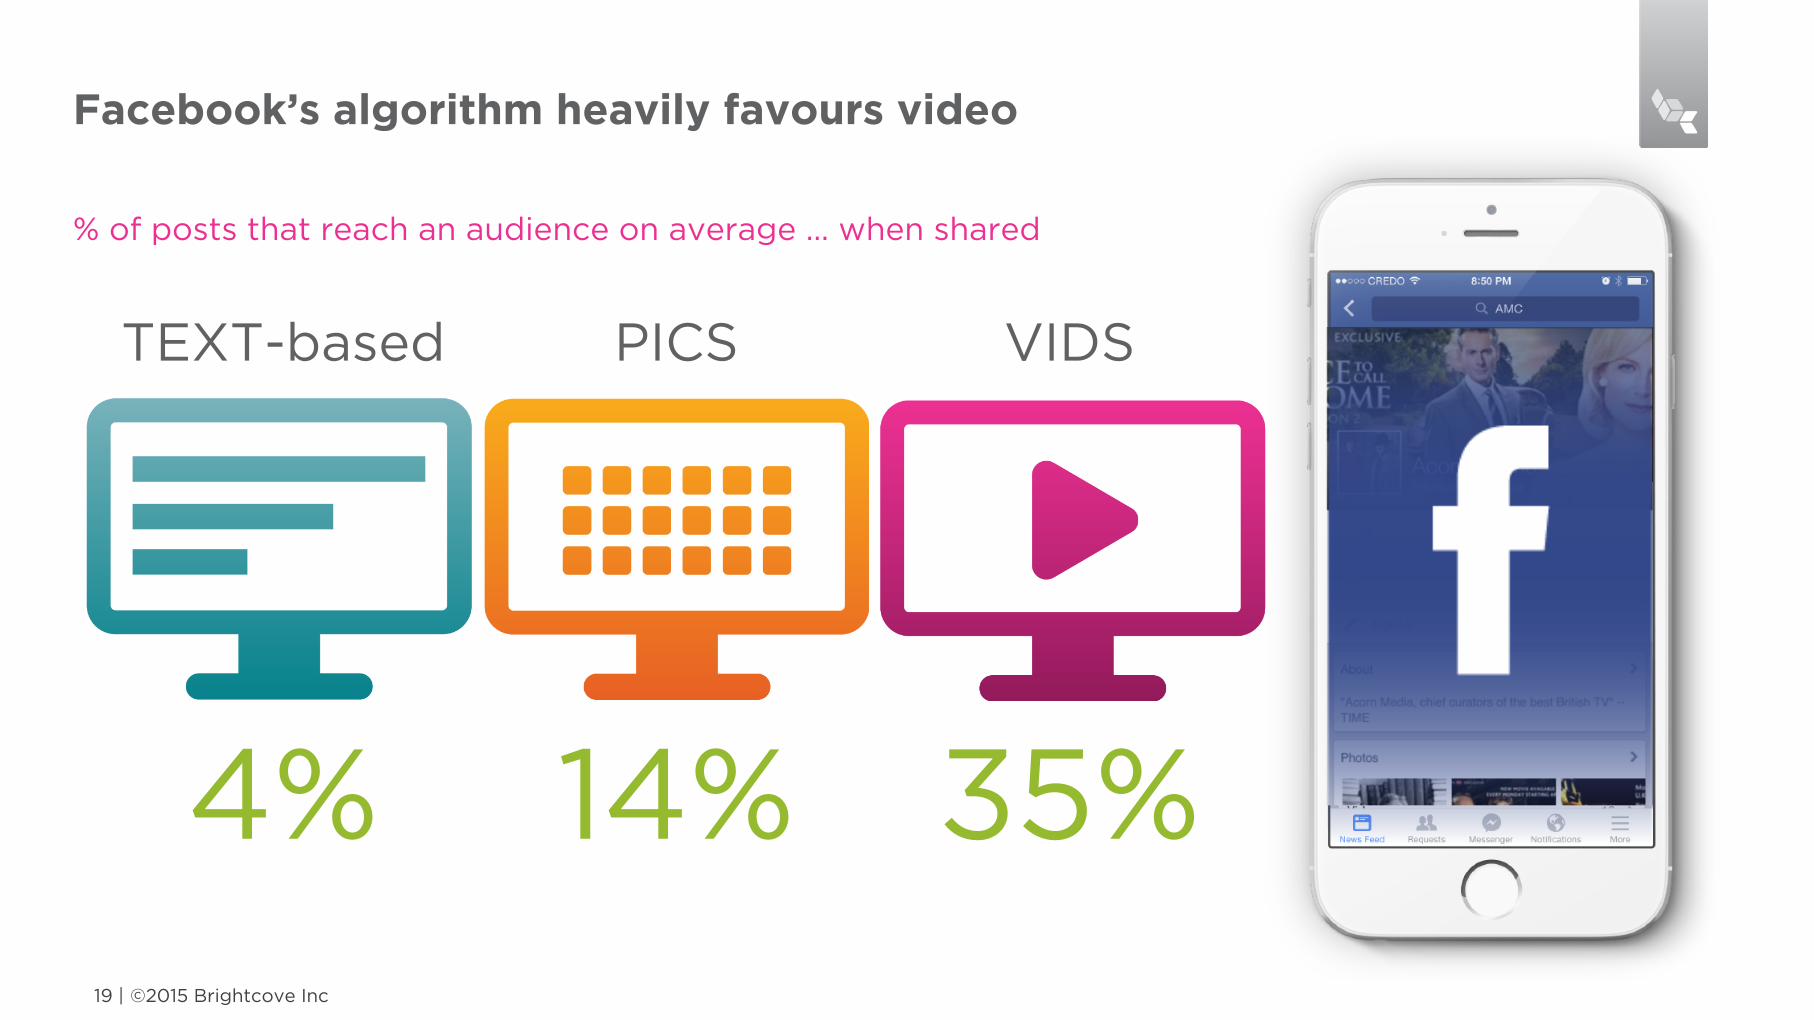
Facebook’s algorithm heavily favours video
% of posts that reach an audience on average … when shared
©2015 Brightcove Inc 19 |
4% 14% 35%
TEXT-based PICS VIDS
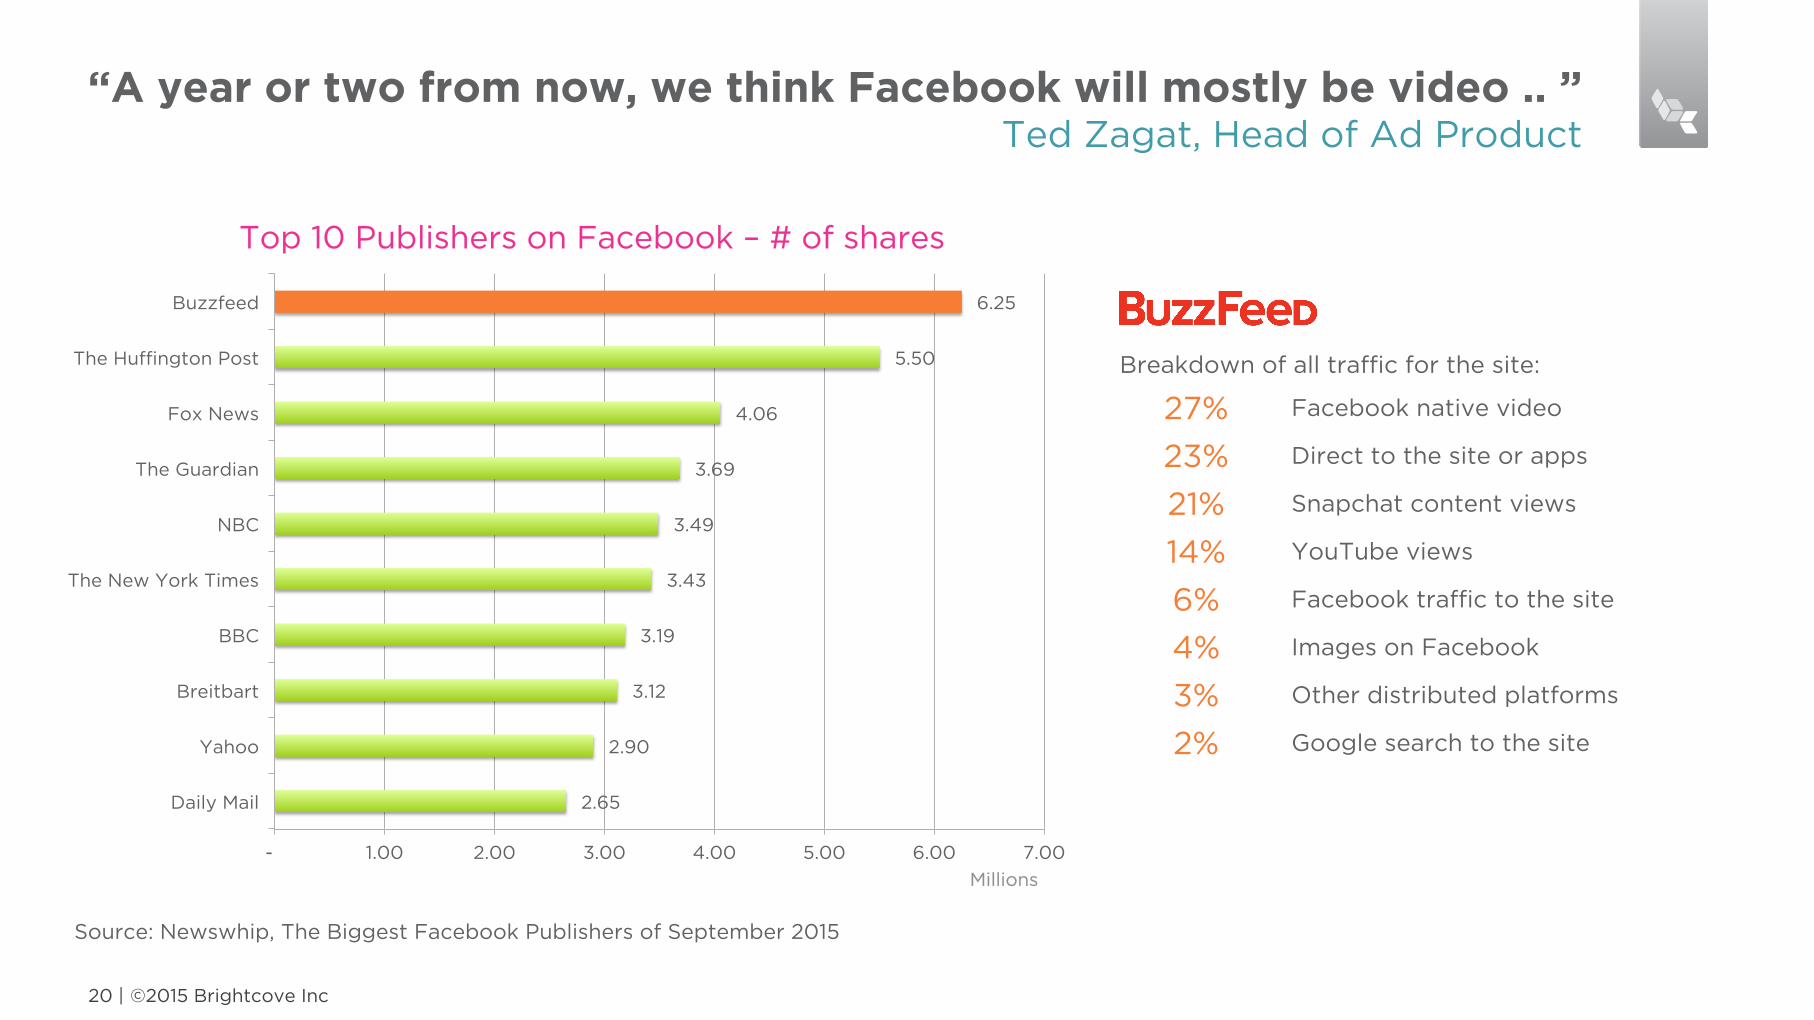
2.65
2.90
3.12
3.19
3.43
3.49
3.69
4.06
5.50
6.25
- 1.00 2.00 3.00 4.00 5.00 6.00 7.00
Daily Mail
Yahoo
Breitbart
BBC
The New York Times
NBC
The Guardian
Fox News
The Huffington Post
Buzzfeed
Millions
Top 10 Publishers on Facebook – # of shares
“A year or two from now, we think Facebook will mostly be video .. ” Ted Zagat, Head of Ad Product
©2015 Brightcove Inc 20 |
Source: Newswhip, The Biggest Facebook Publishers of September 2015
Breakdown of all traffic for the site:
27% Facebook native video
23% Direct to the site or apps
21% Snapchat content views
14% YouTube views
6% Facebook traffic to the site
4% Images on Facebook
3% Other distributed platforms
2% Google search to the site
©2015 Brightcove Inc 21 |

©2015 Brightcove Inc 22 |

©2015 Brightcove Inc 23 |
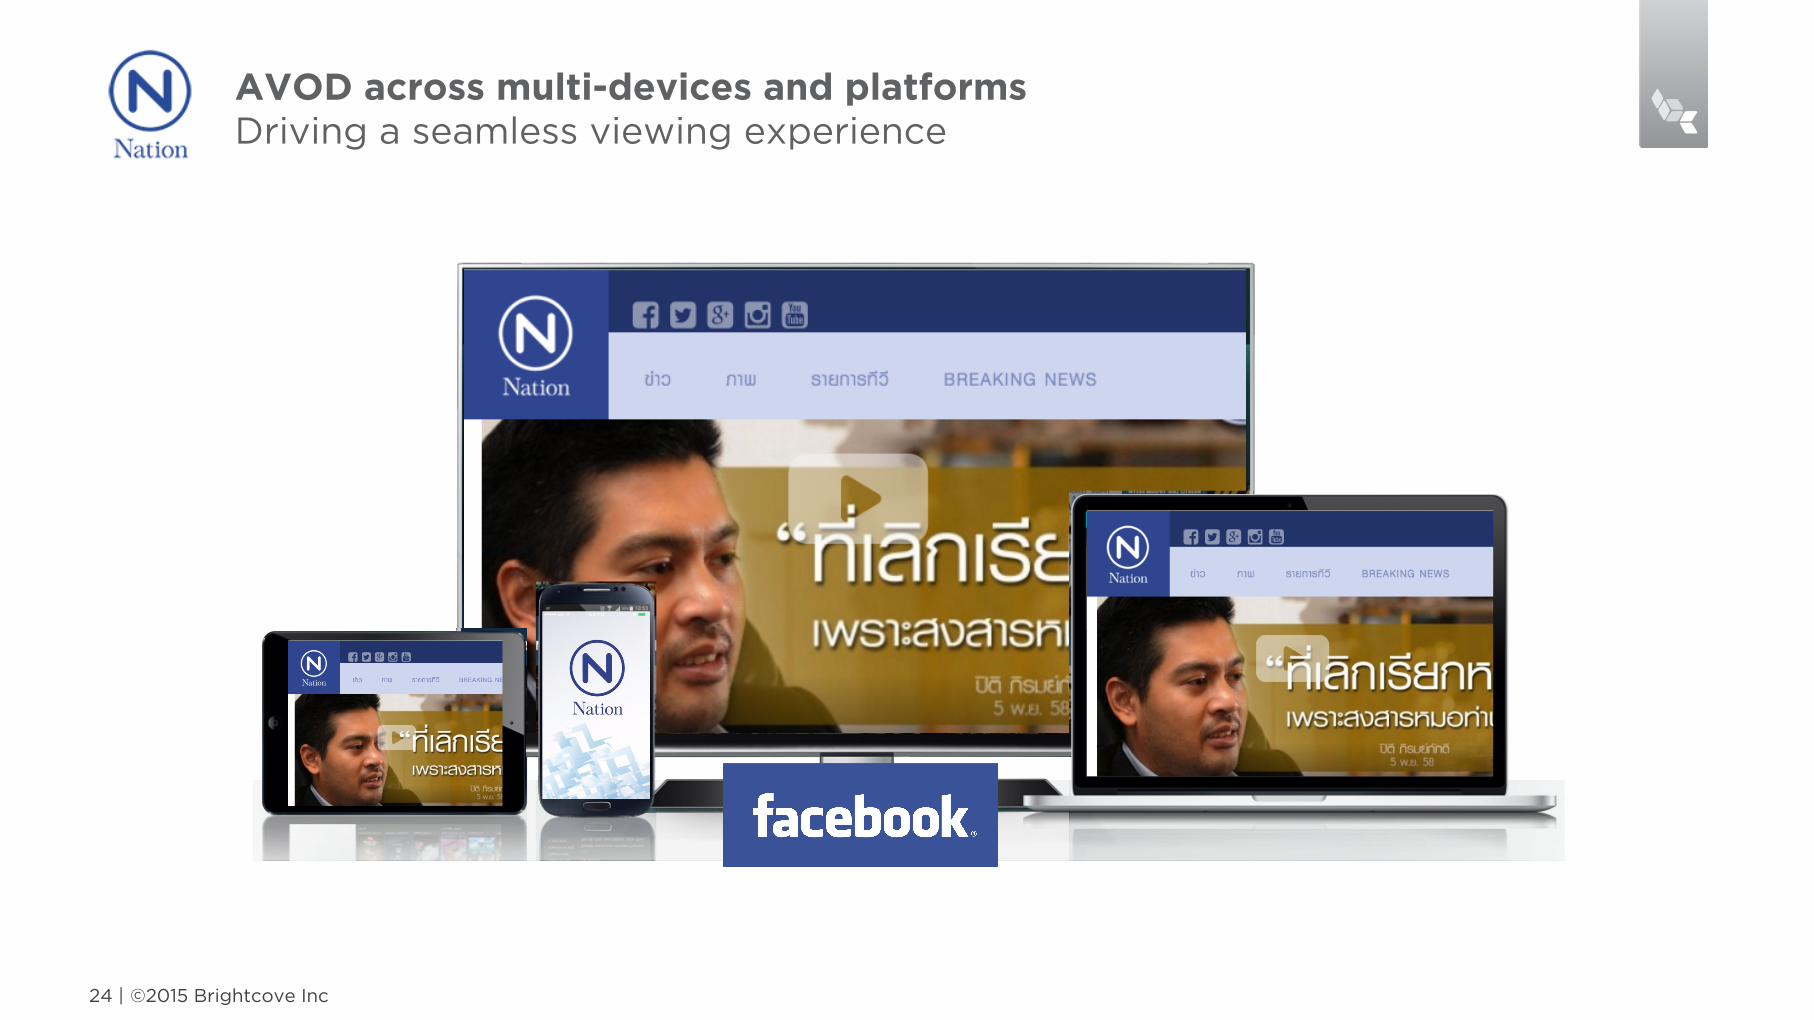
AVOD across multi-devices and platforms Driving a seamless viewing experience
©2015 Brightcove Inc 24 |
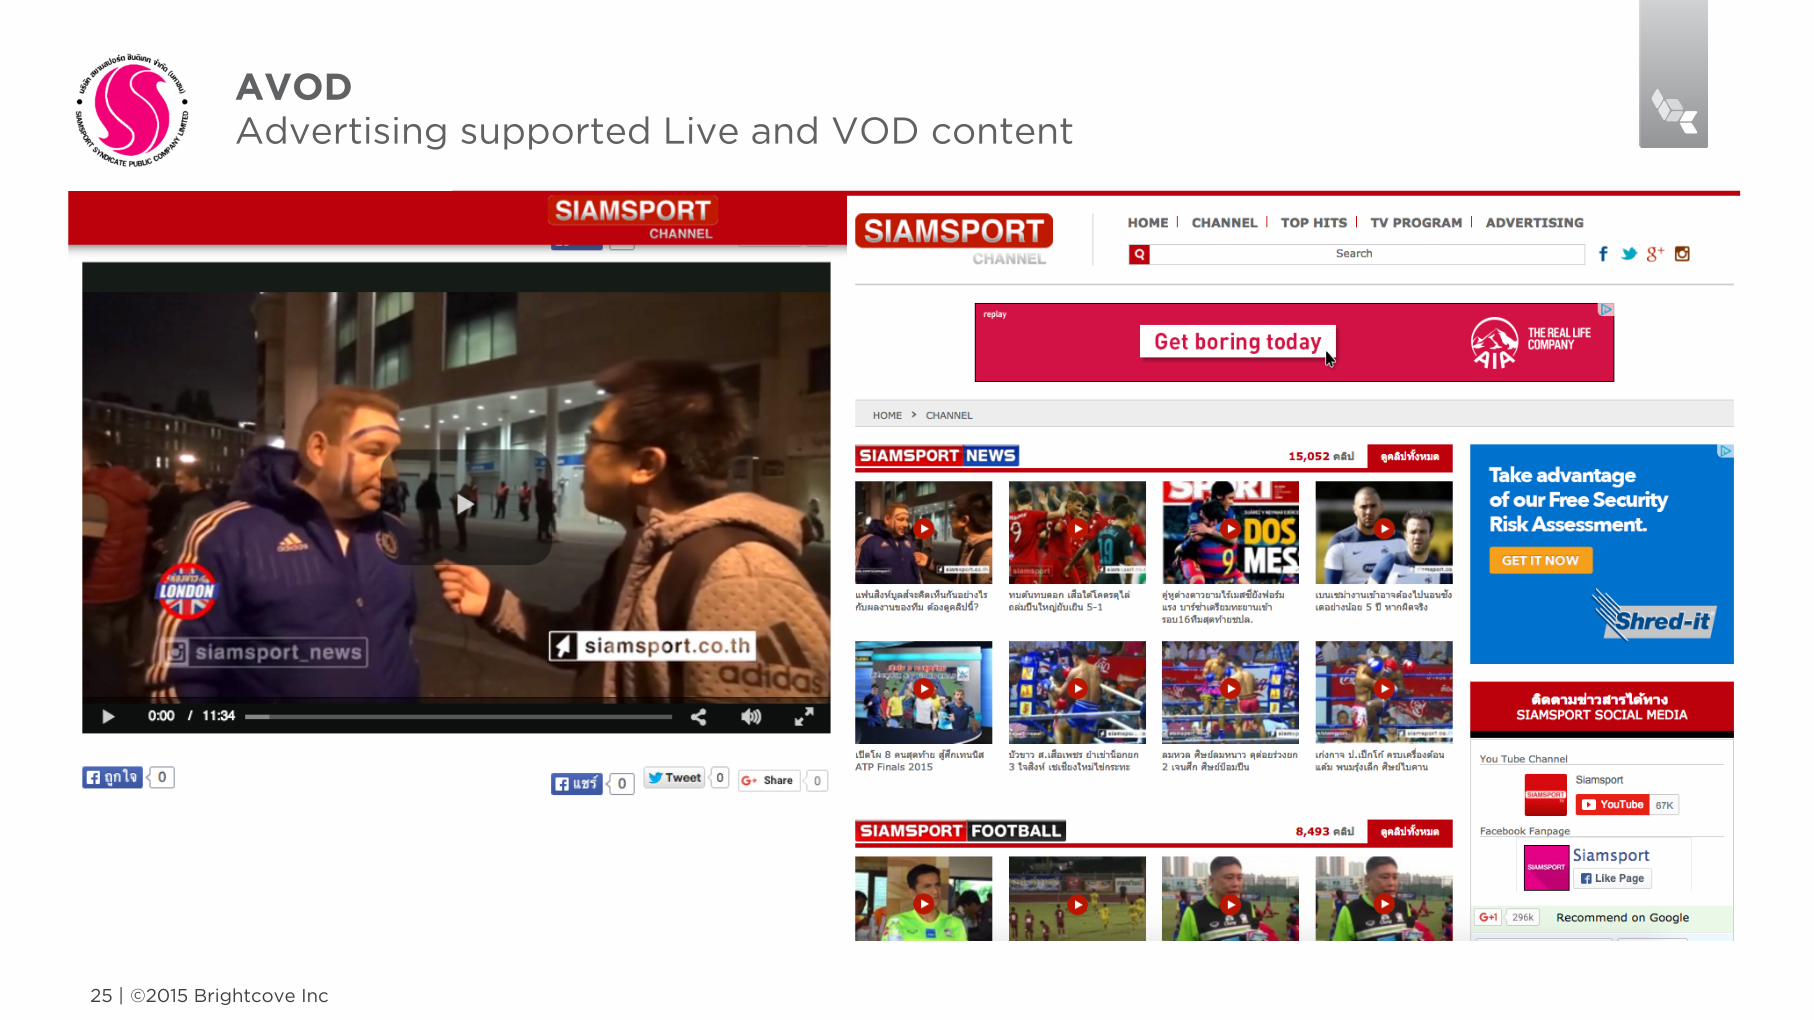
AVOD Advertising supported Live and VOD content
©2015 Brightcove Inc 25 |
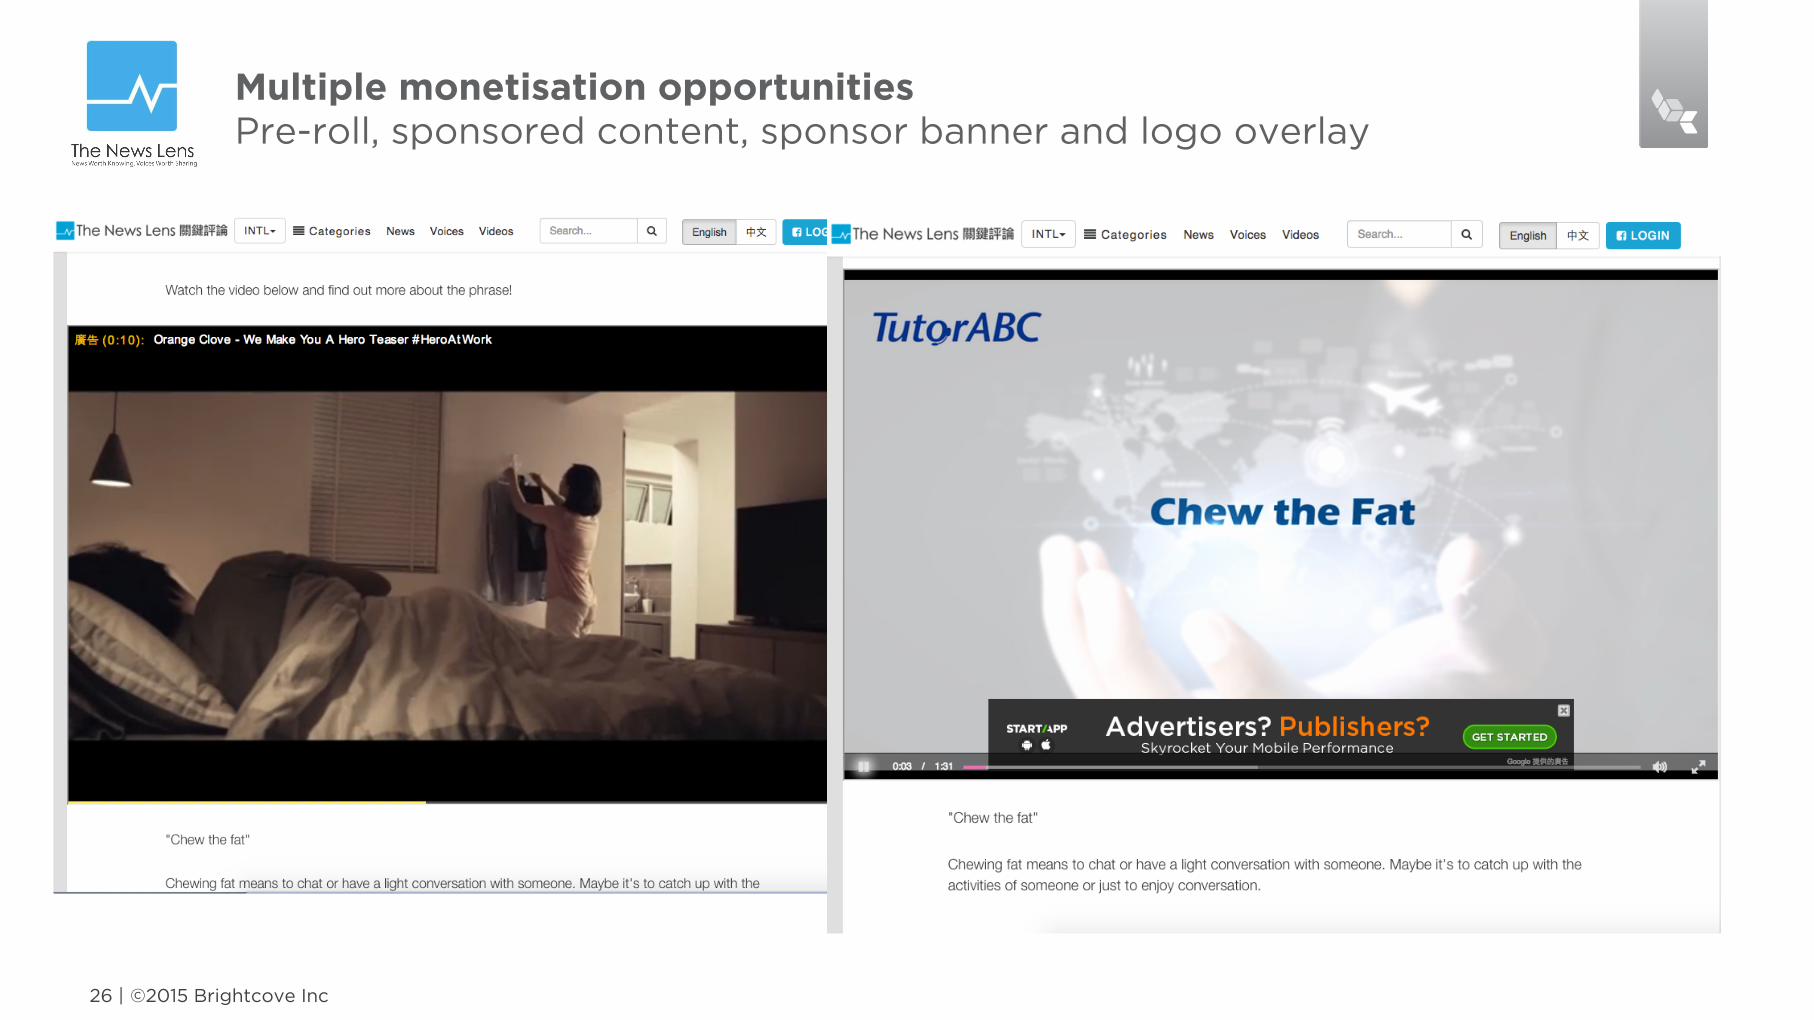
Multiple monetisation opportunities Pre-roll, sponsored content, sponsor banner and logo overlay
©2015 Brightcove Inc 26 |
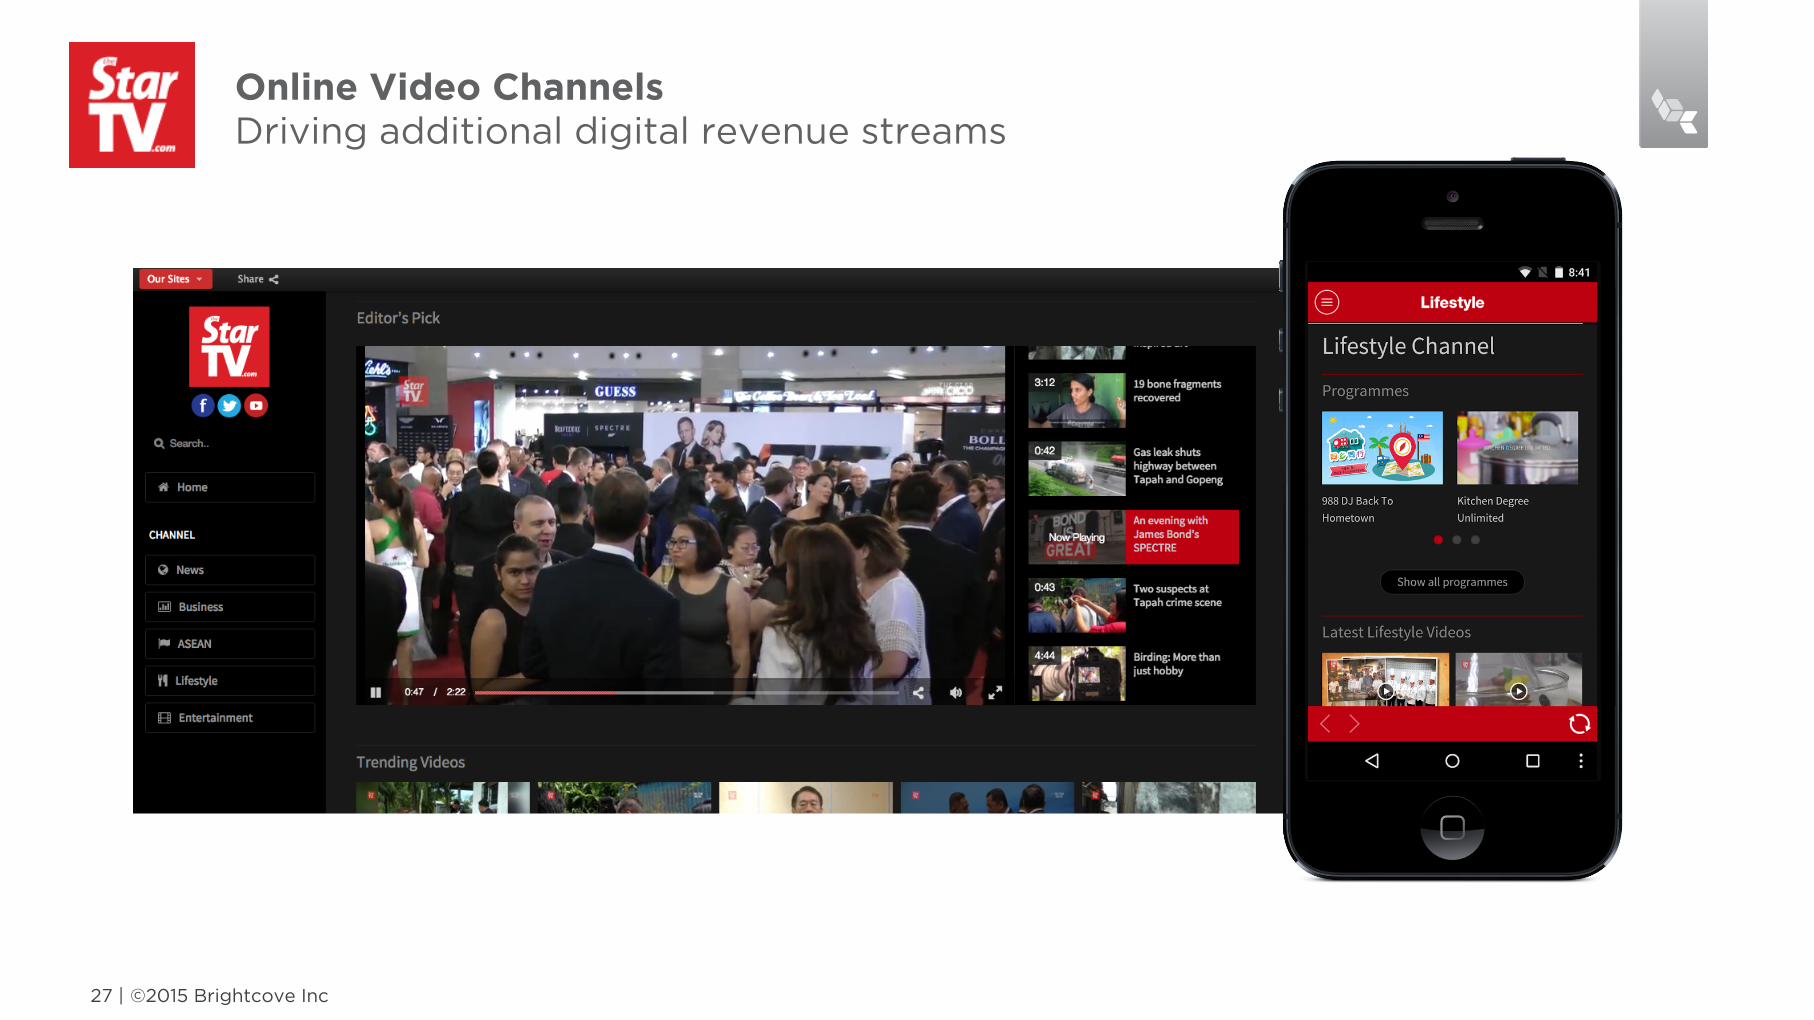
Online Video Channels Driving additional digital revenue streams
©2015 Brightcove Inc 27 |
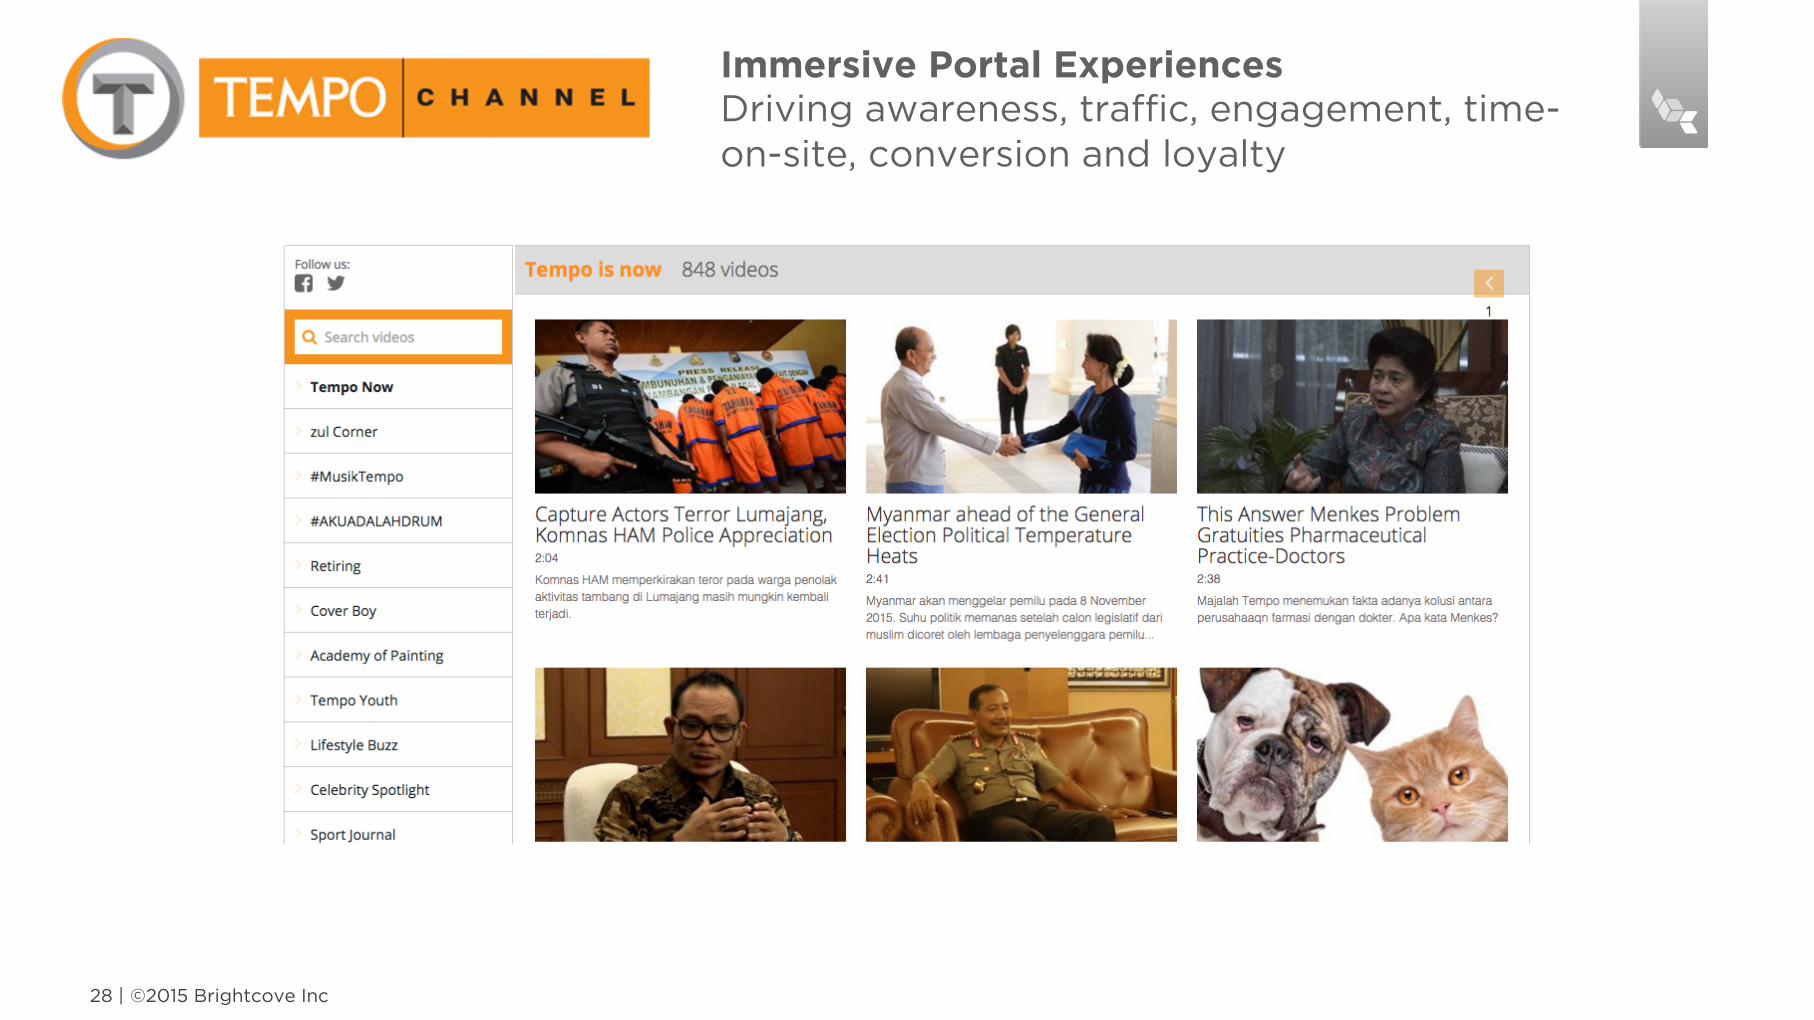
Immersive Portal Experiences Driving awareness, traffic, engagement, time- on-site, conversion and loyalty
©2015 Brightcove Inc 28 |
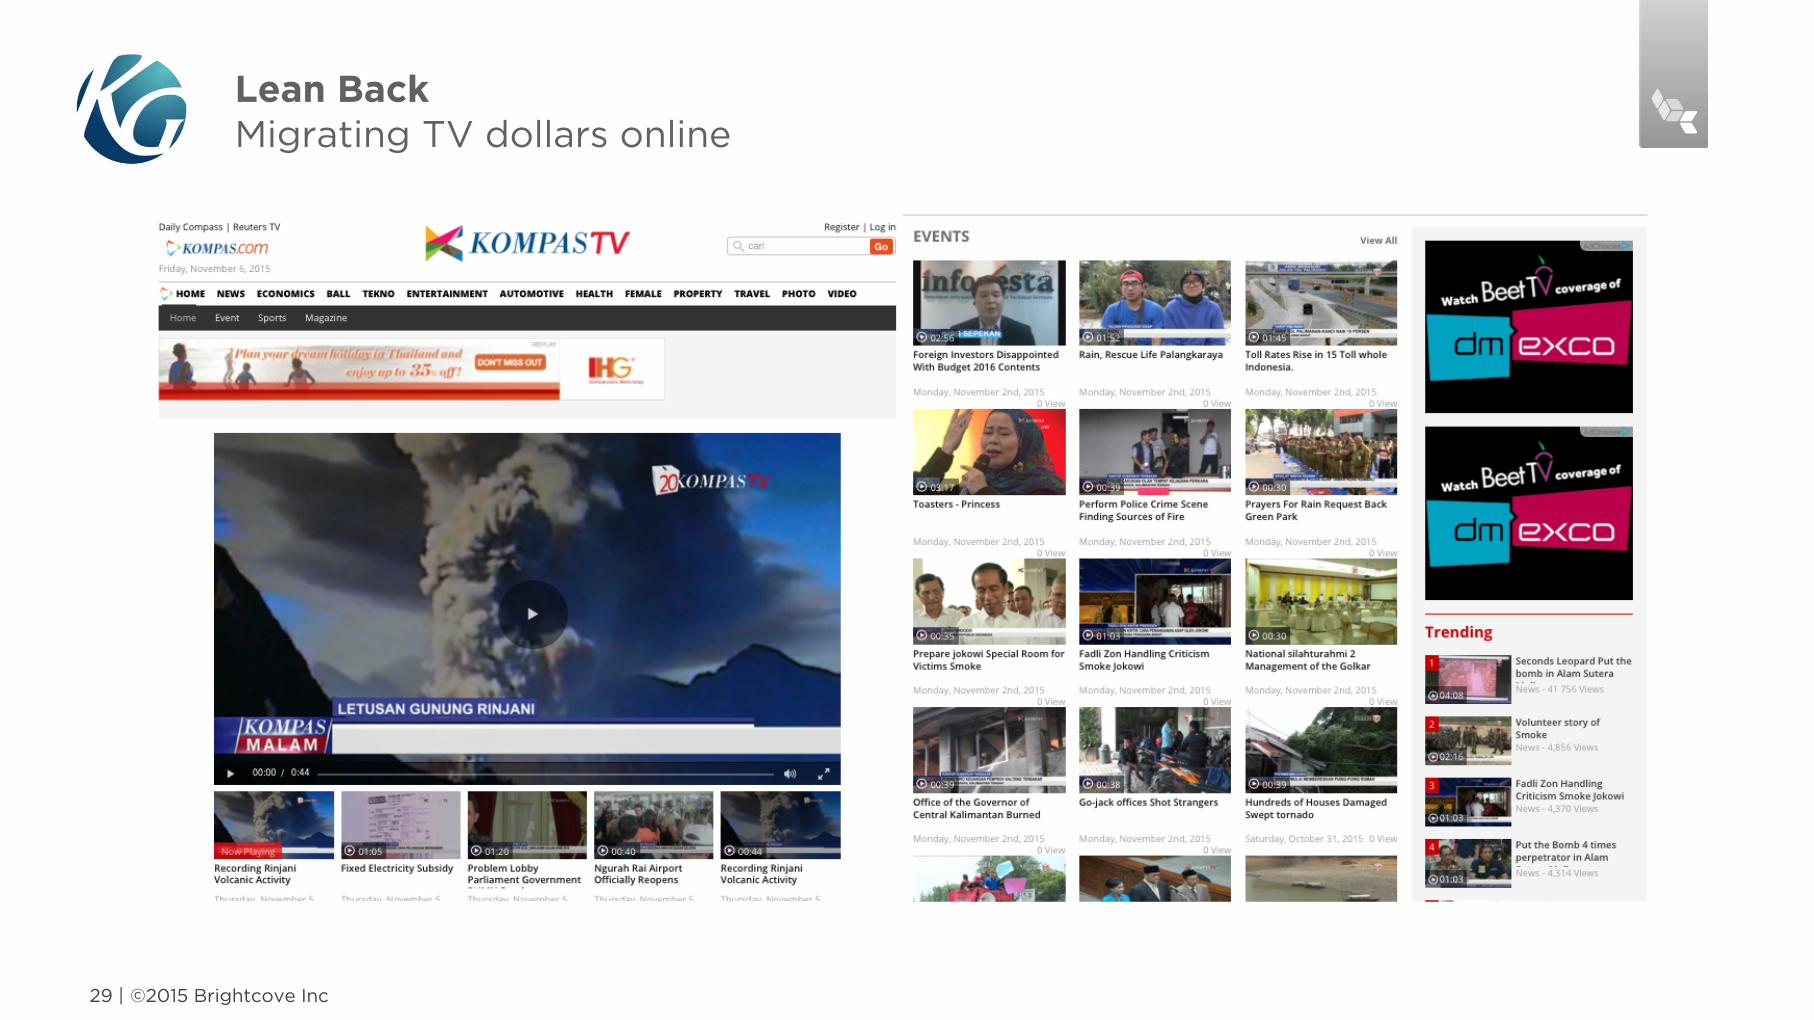
Lean Back Migrating TV dollars online
©2015 Brightcove Inc 29 |

Sponsored Content Creating content for brands
©2015 Brightcove Inc 30 |
©2015 Brightcove Inc 31 |
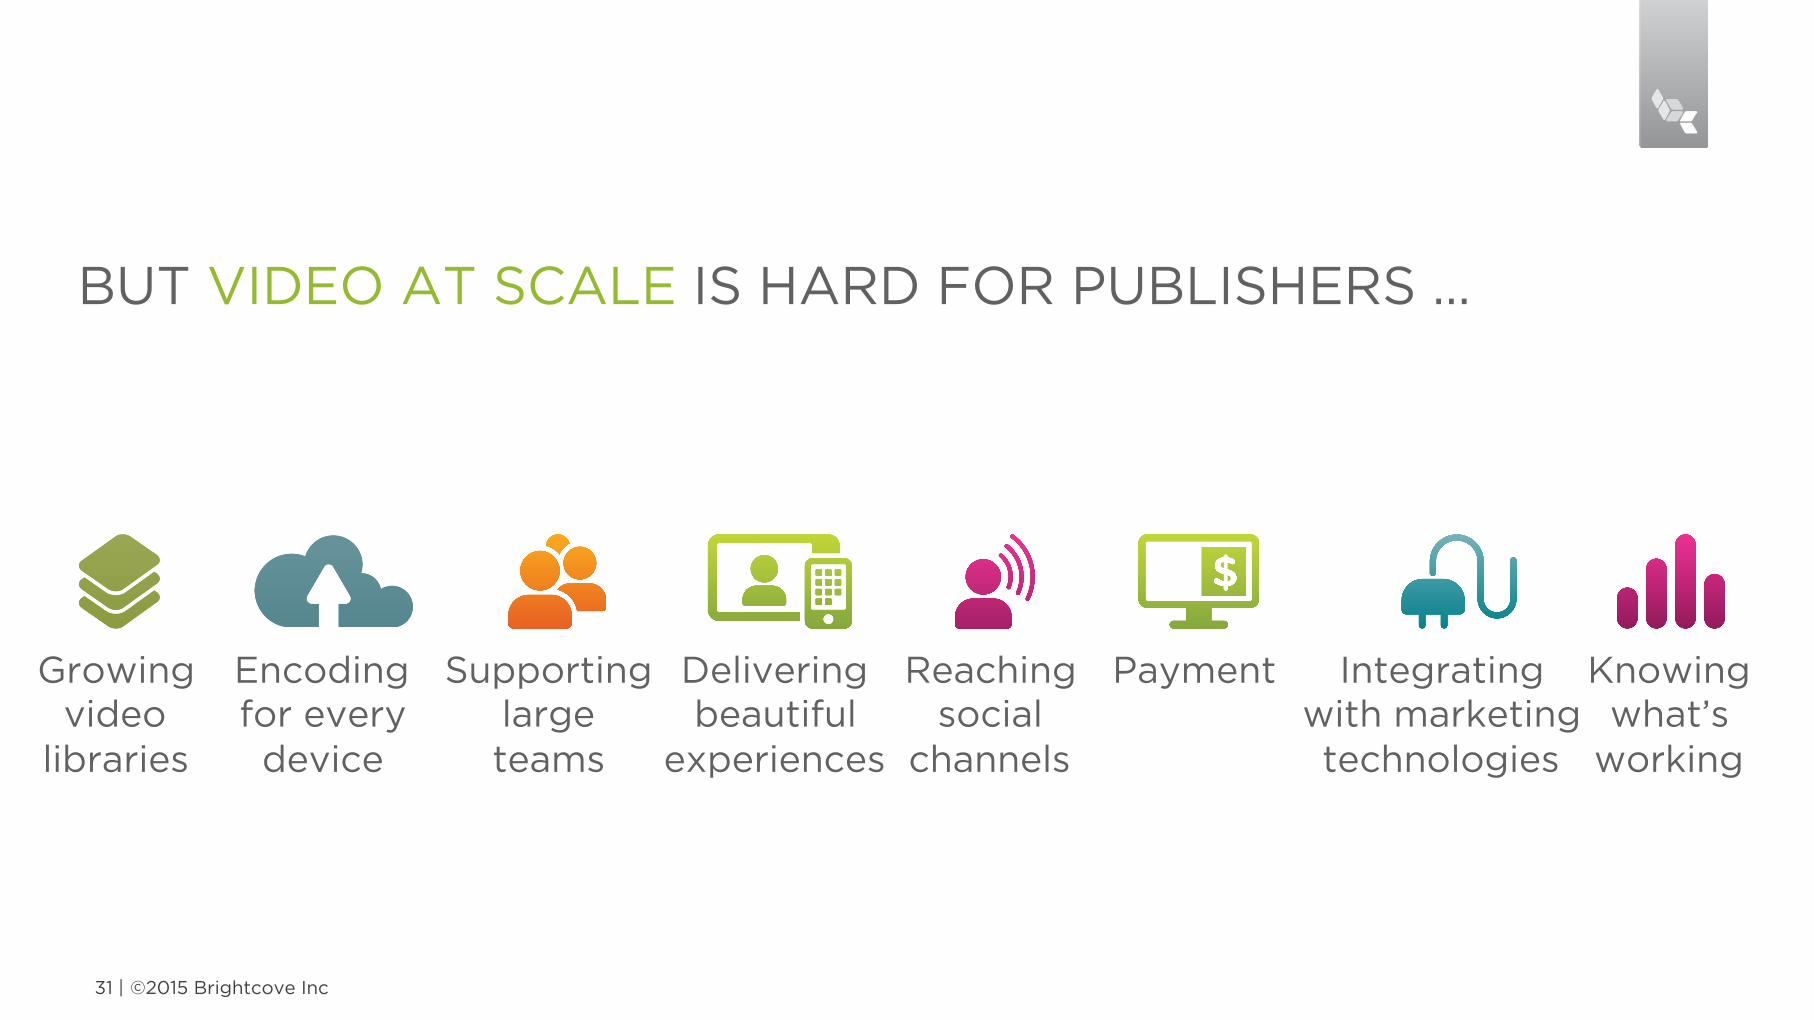
BUT VIDEO AT SCALE IS HARD FOR PUBLISHERS …
Growing video
libraries
Encoding for every
device
Supporting large teams
Delivering beautiful
experiences
Reaching social
channels
Payment
Integrating with marketing technologies
Knowing what’s
working
©2015 Brightcove Inc 32 |
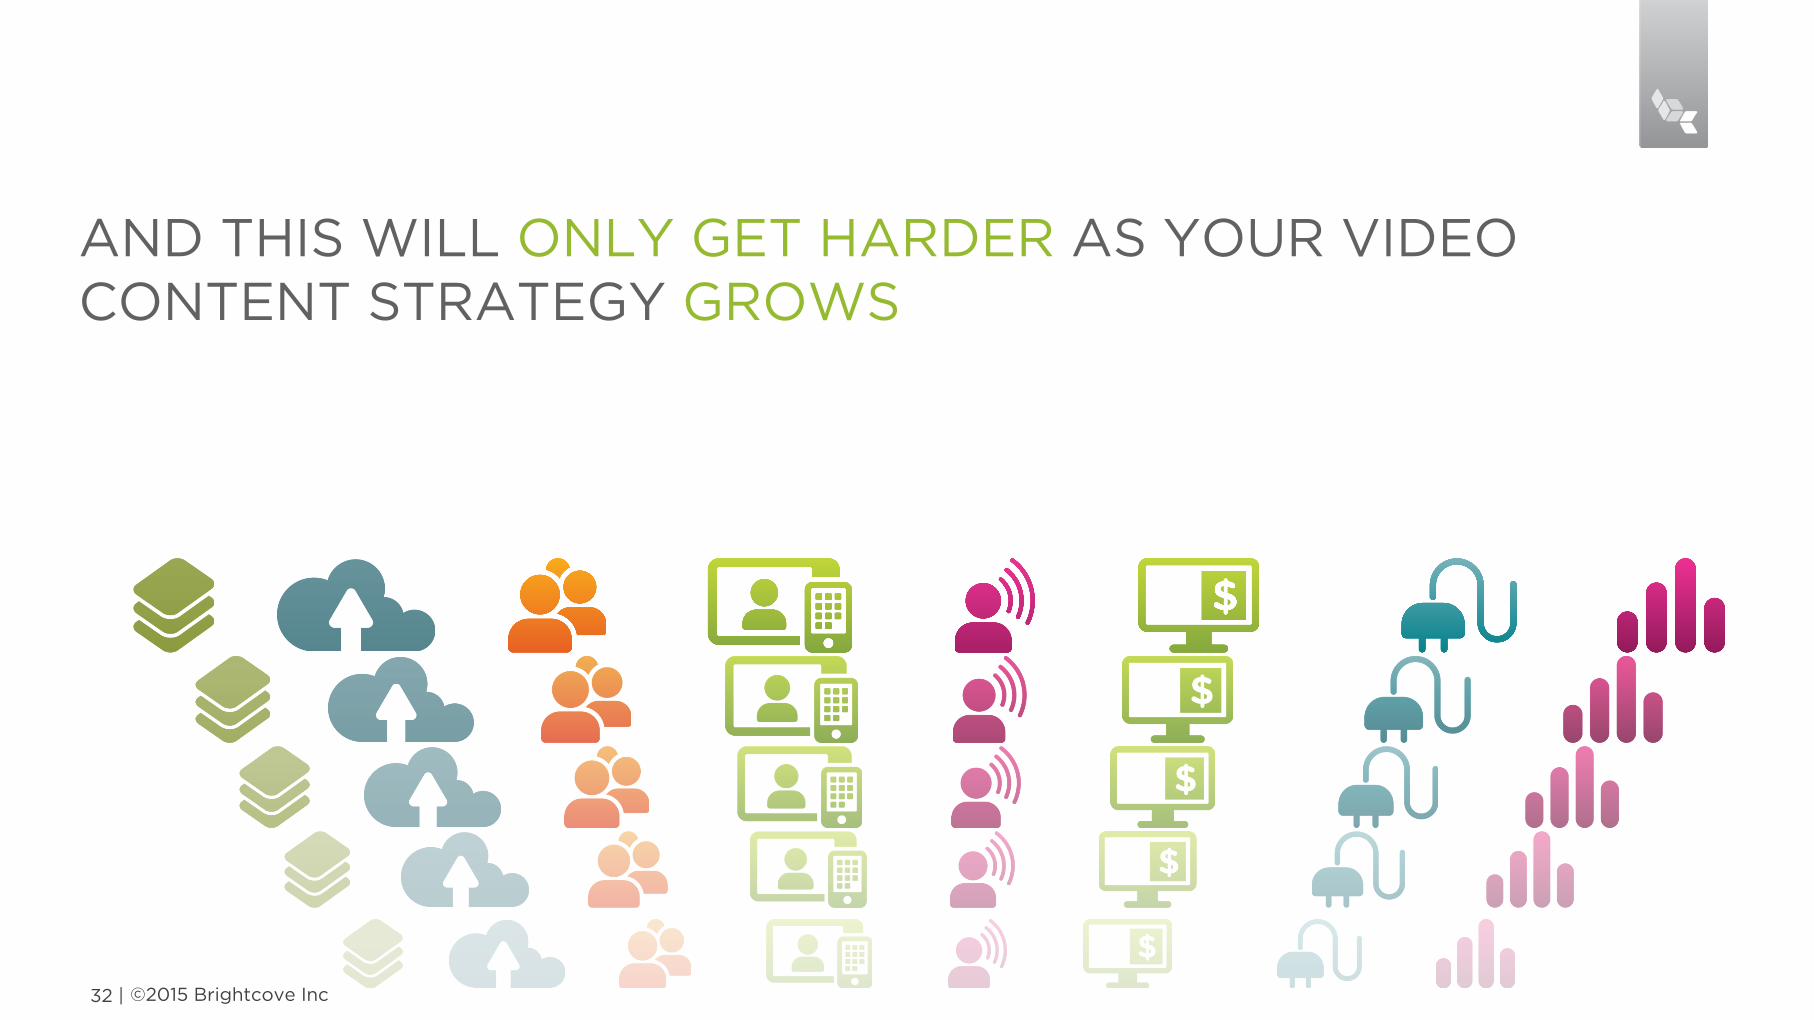
AND THIS WILL ONLY GET HARDER AS YOUR VIDEO CONTENT STRATEGY GROWS
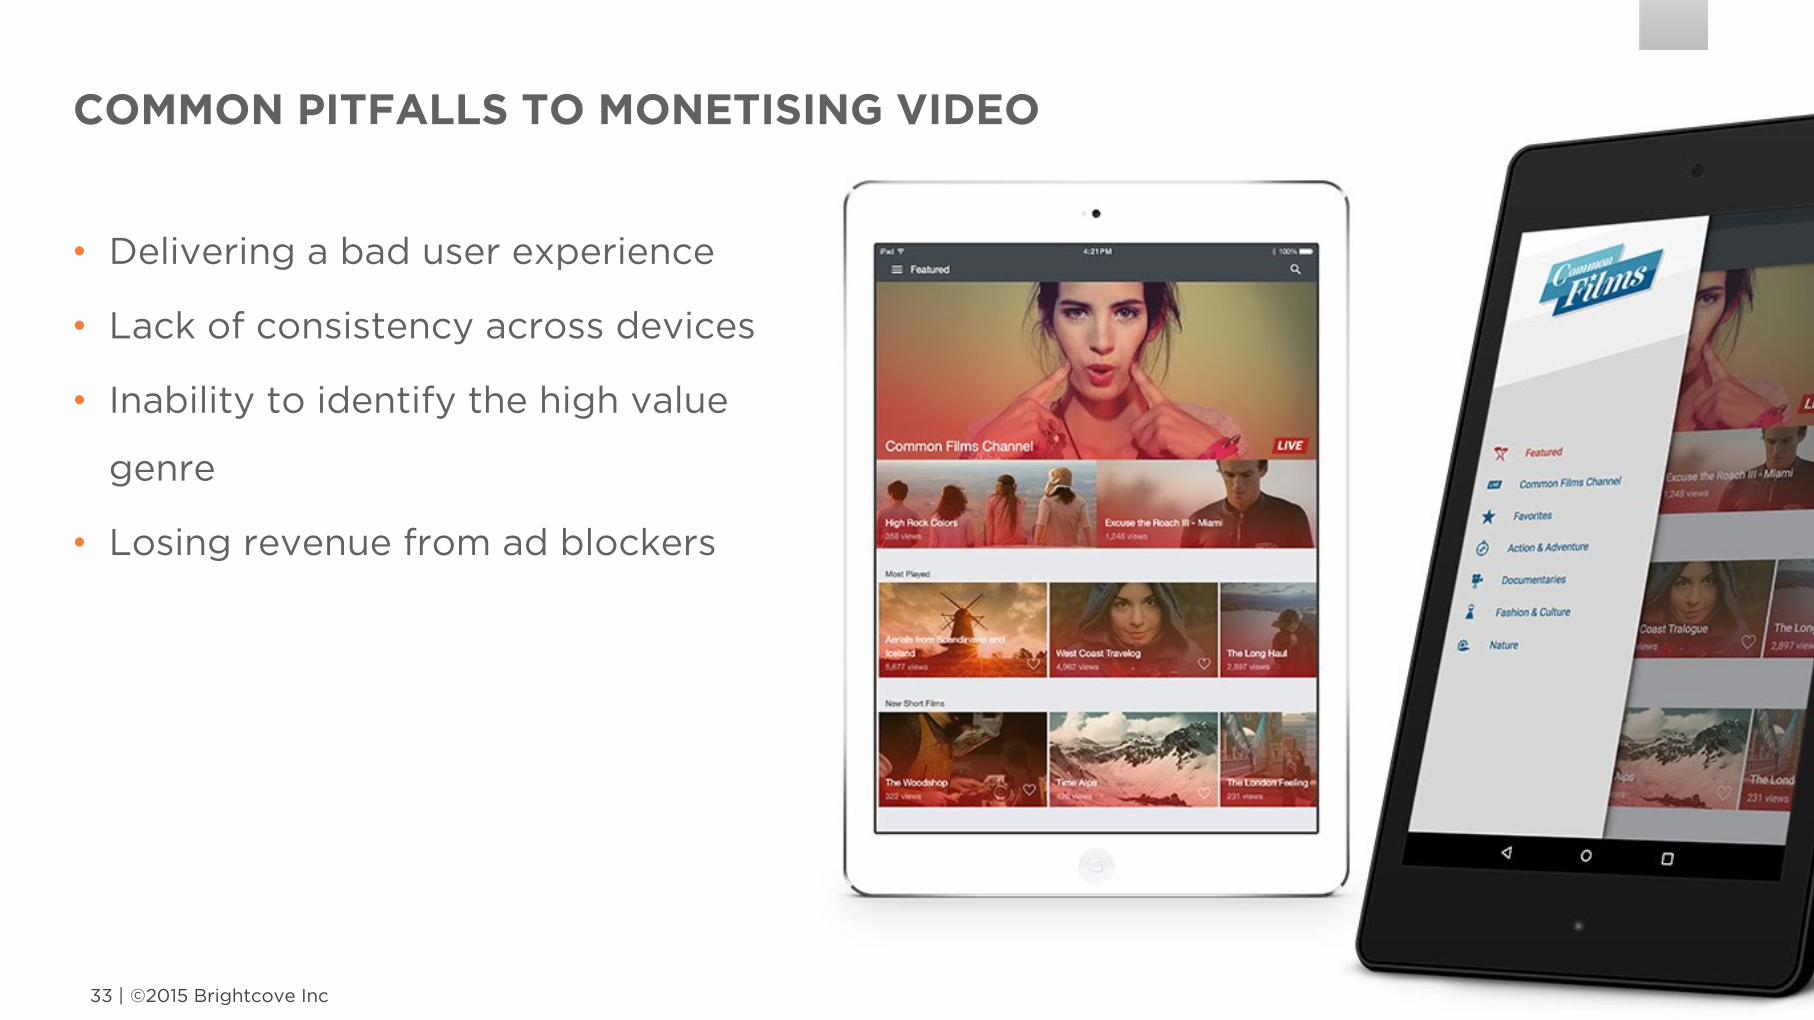
COMMON PITFALLS TO MONETISING VIDEO
• Delivering a bad user experience
• Lack of consistency across devices
• Inability to identify the high value
genre
• Losing revenue from ad blockers
©2015 Brightcove Inc 33 |
©2015 Brightcove Inc 34 |
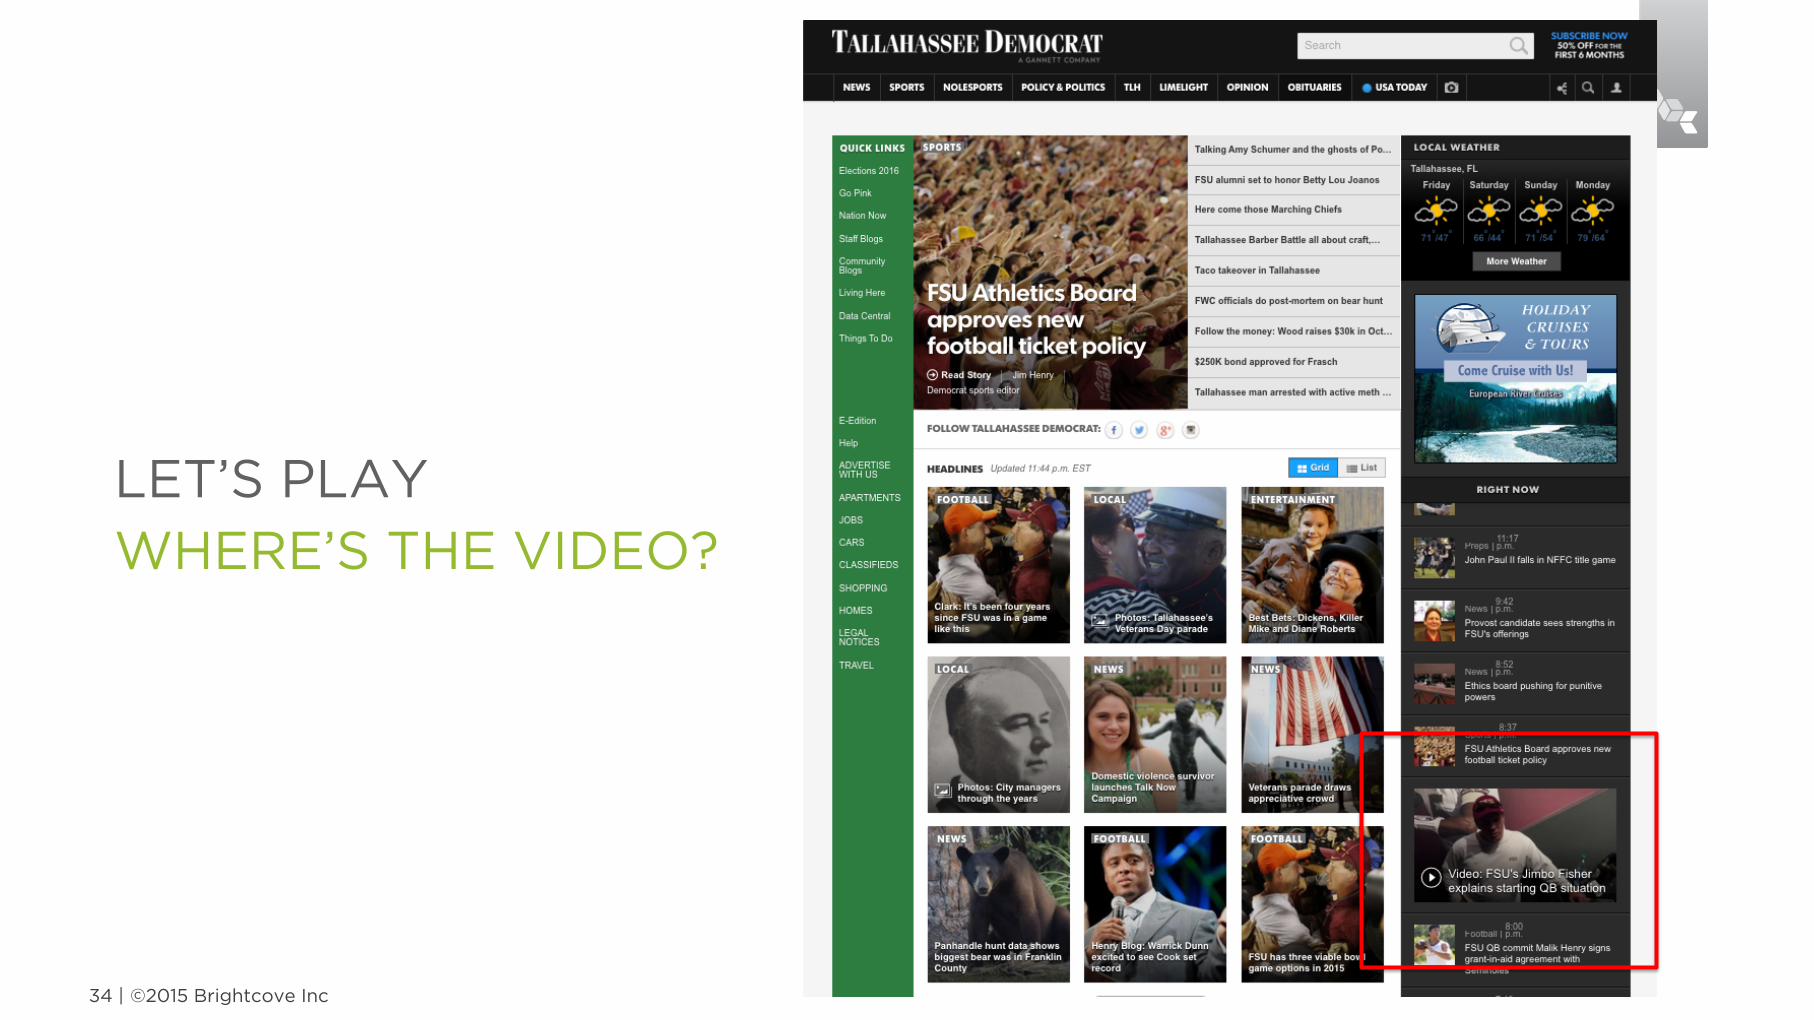
LET’S PLAY WHERE’S THE VIDEO?
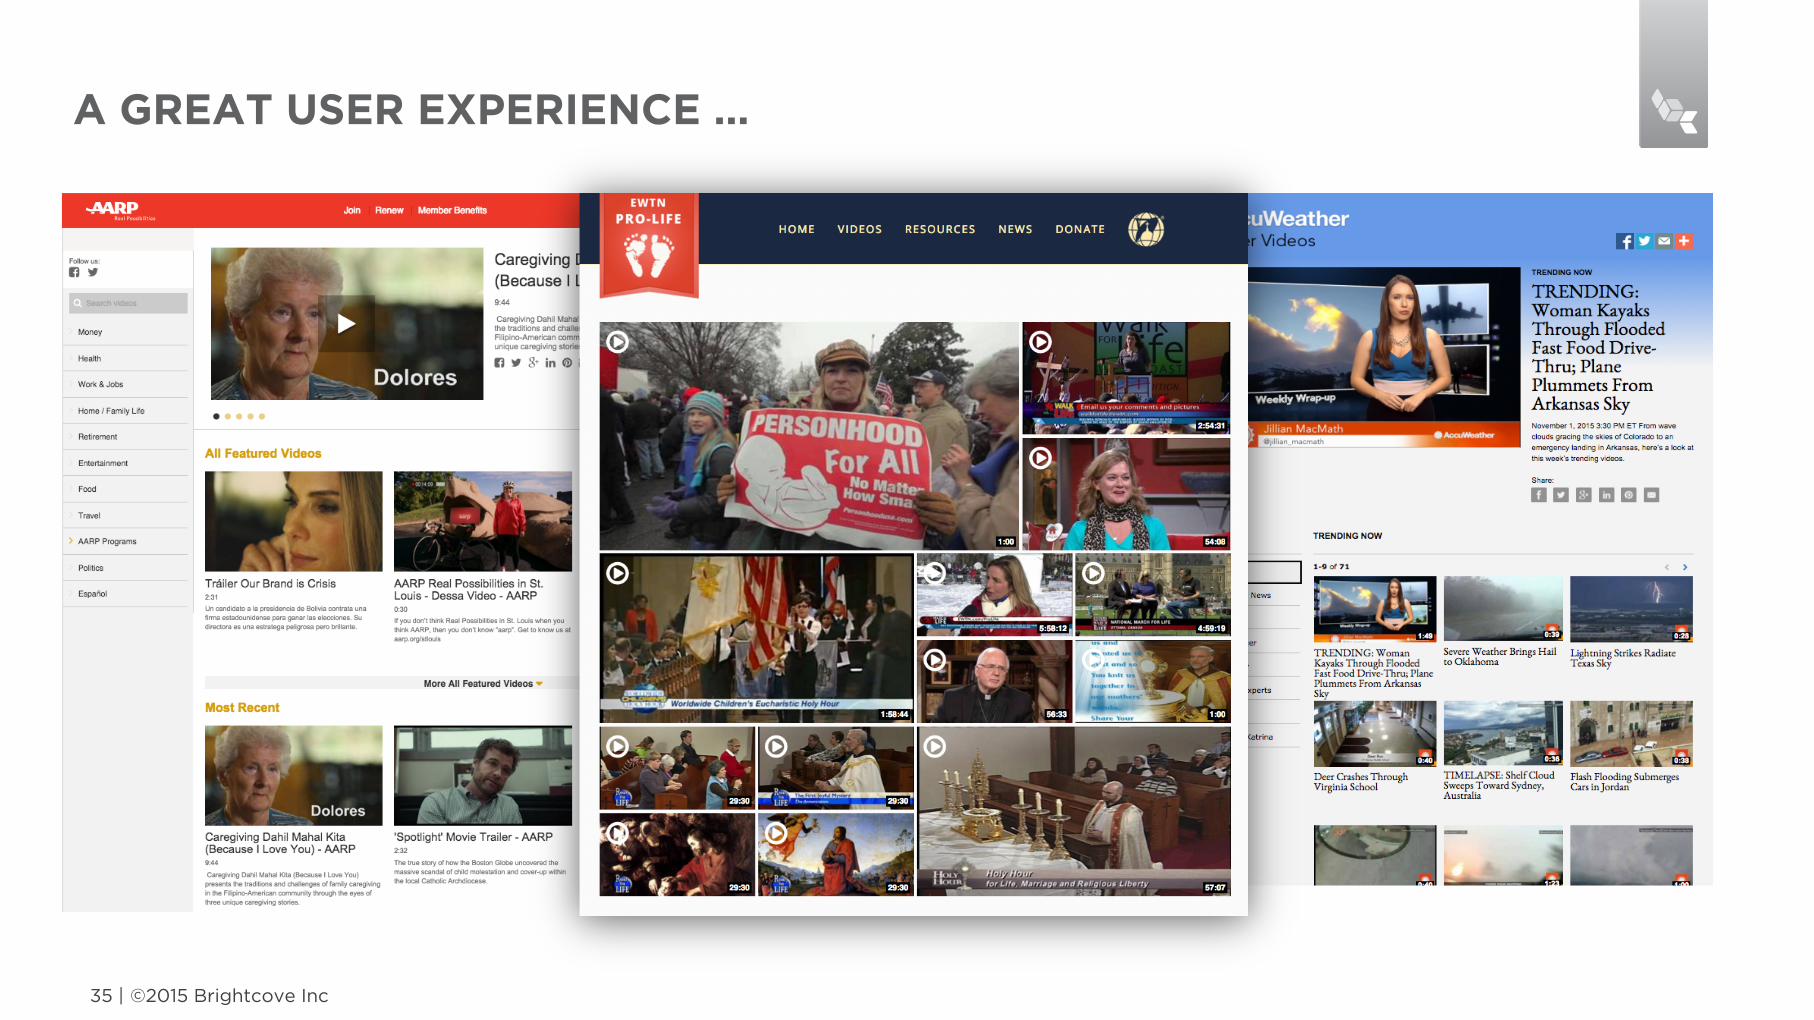
A GREAT USER EXPERIENCE …
©2015 Brightcove Inc 35 |
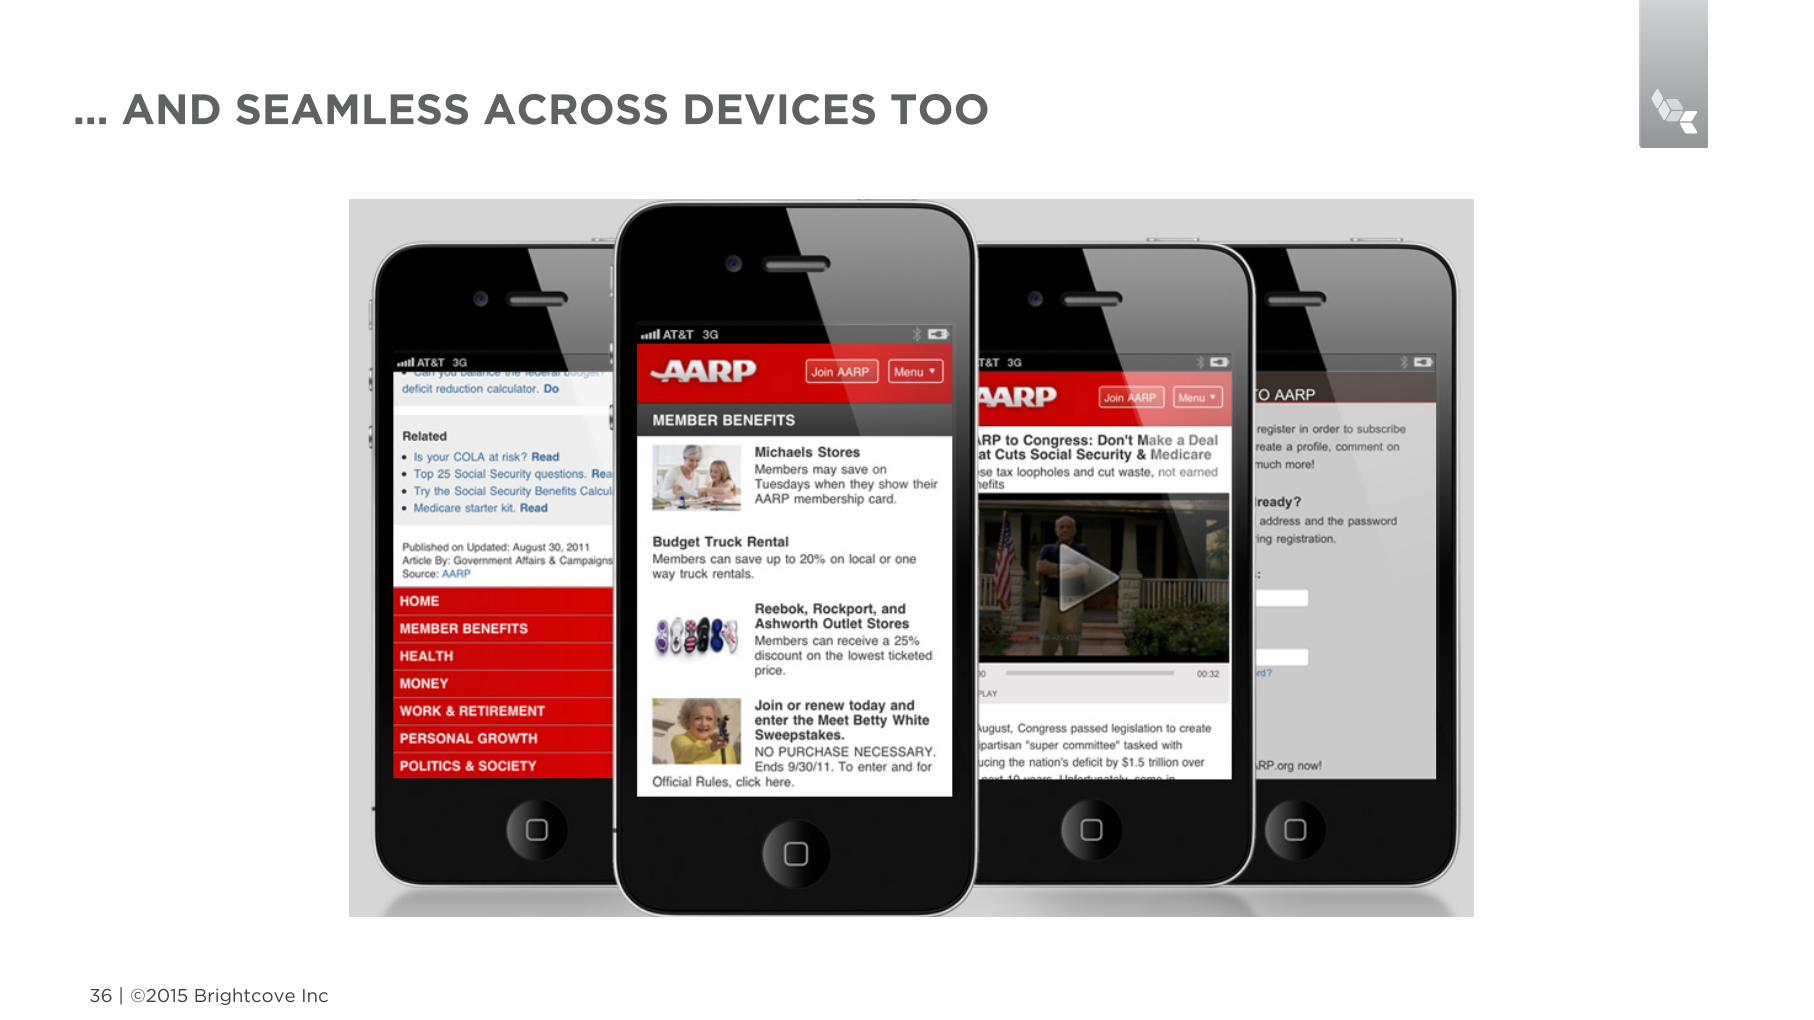
… AND SEAMLESS ACROSS DEVICES TOO
©2015 Brightcove Inc 36 |
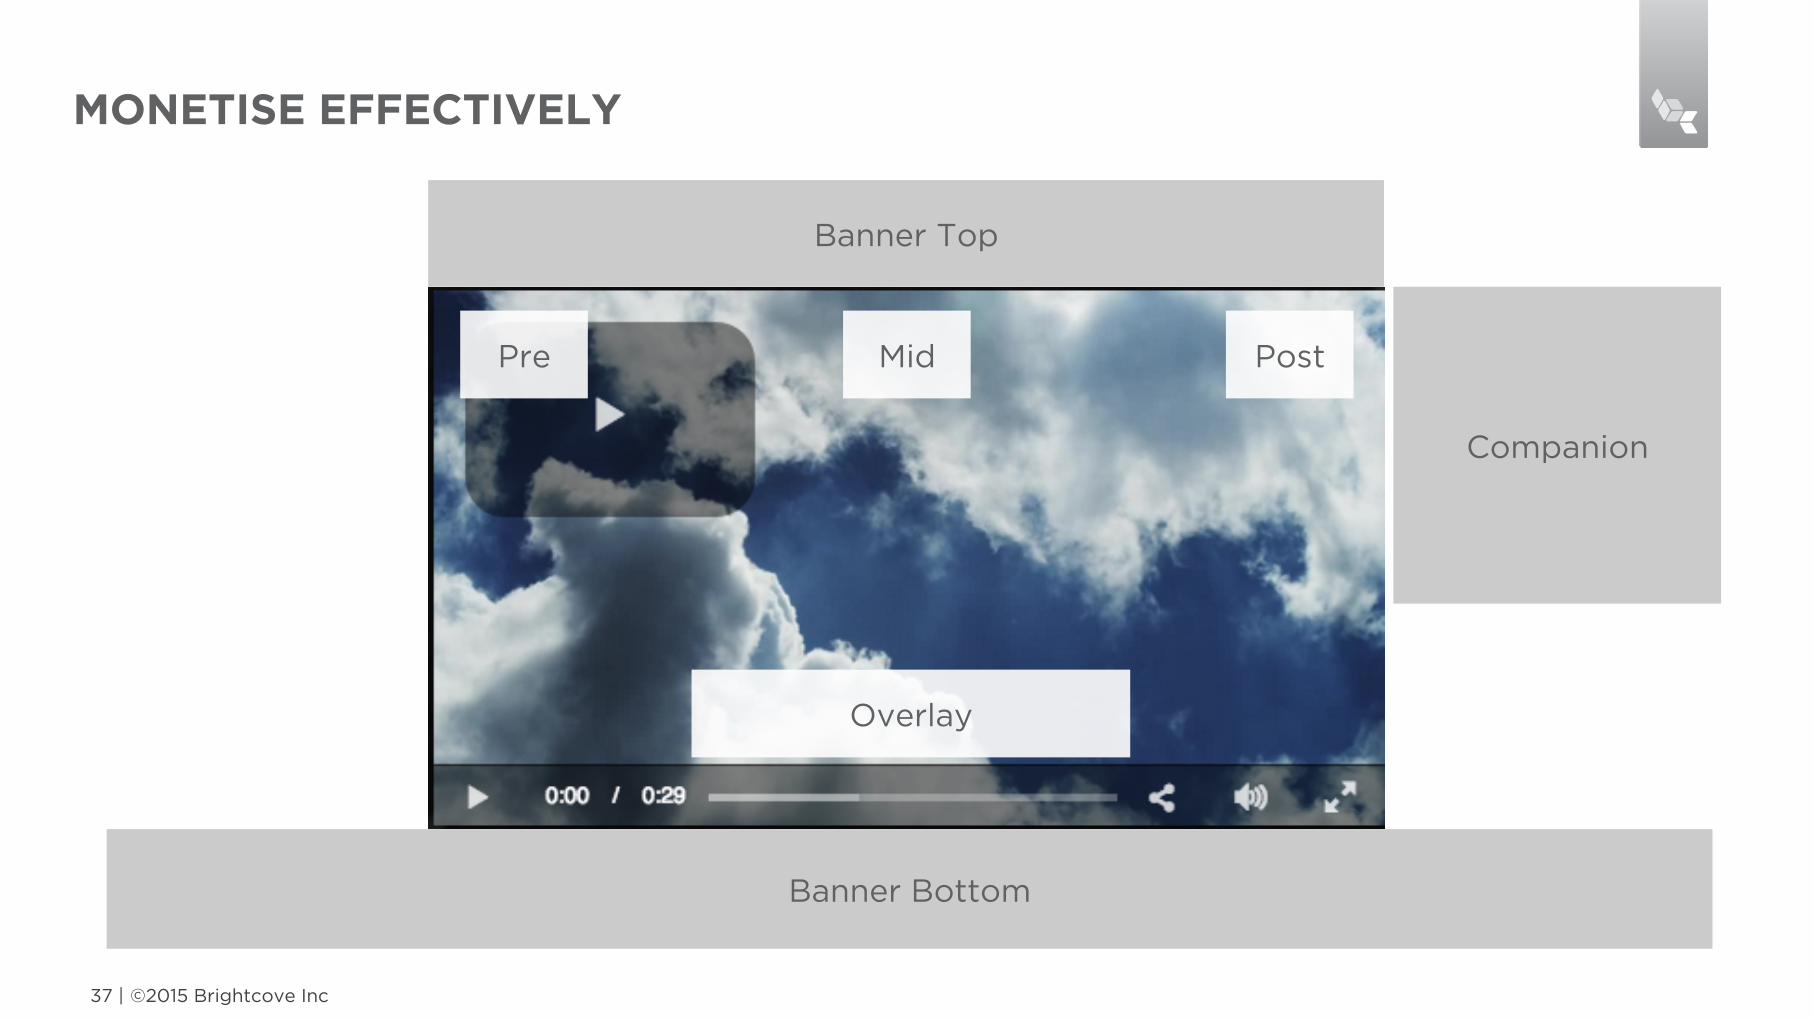
Companion
Overlay
Banner Top
Banner Bottom
Pre Mid Post
MONETISE EFFECTIVELY
©2015 Brightcove Inc 37 |

MONETISE EFFECTIVELY
©2015 Brightcove Inc 38 |
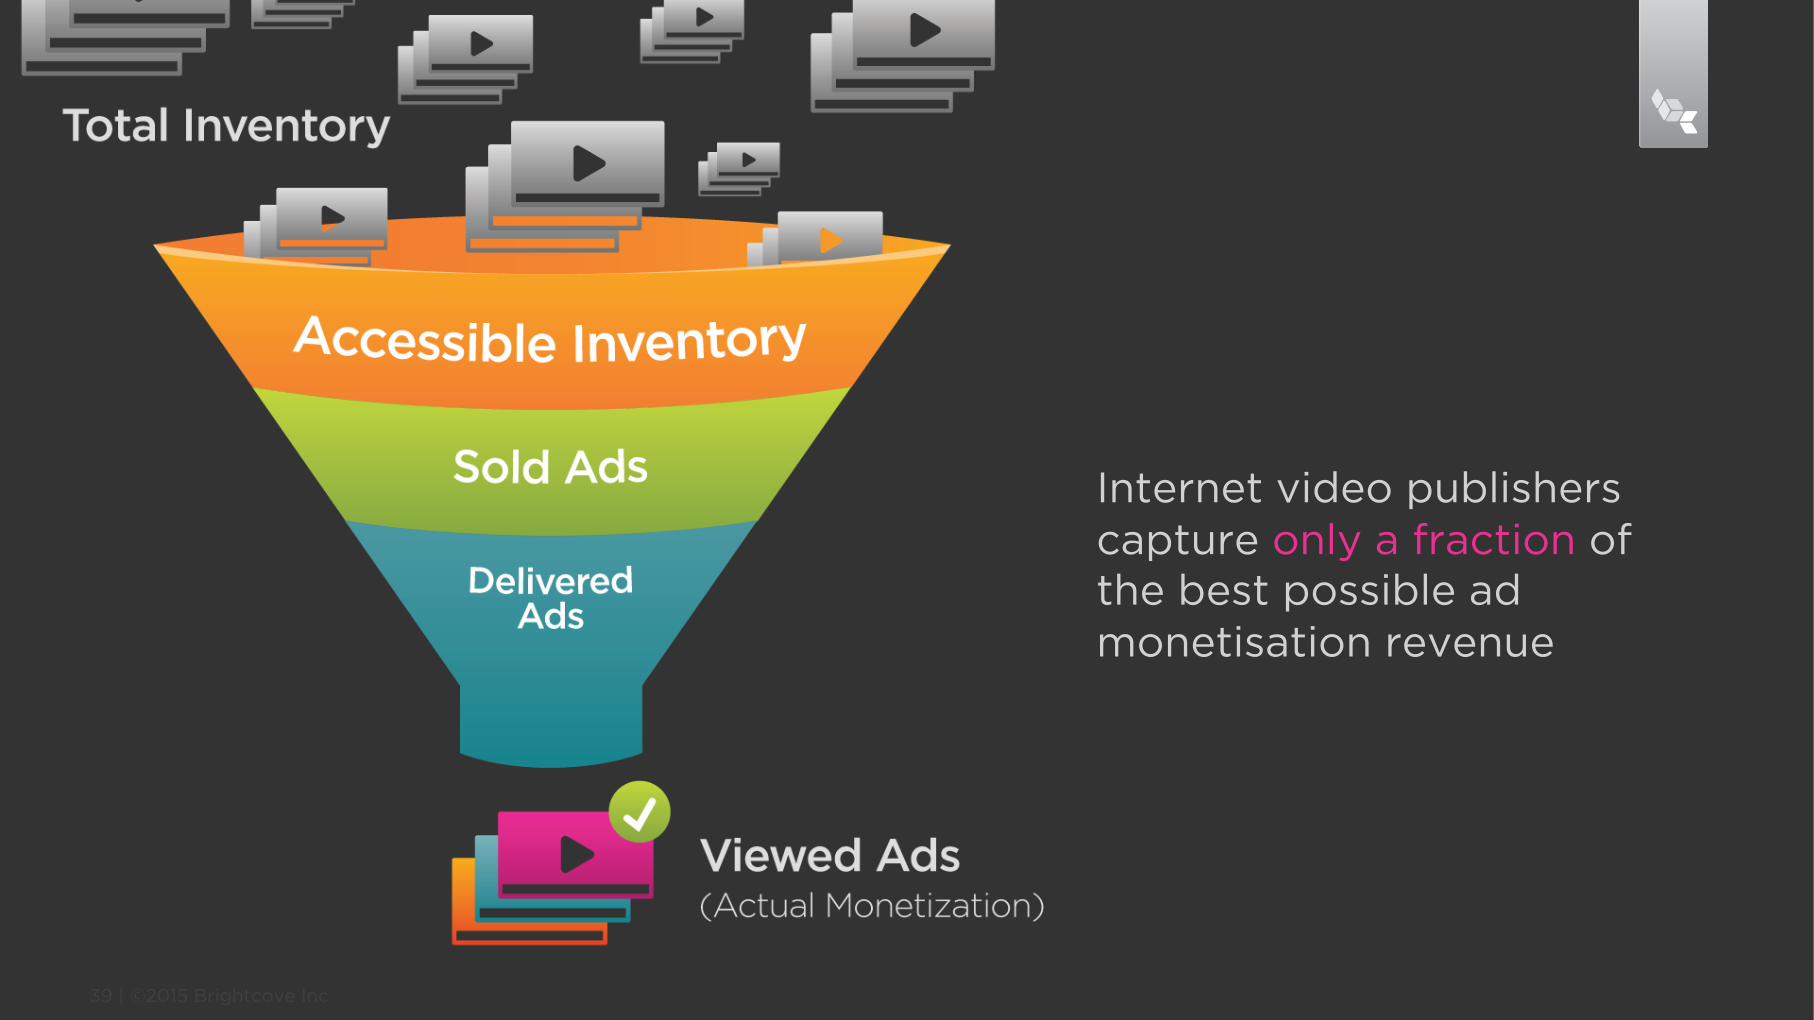
©2015 Brightcove Inc 39 |
Internet video publishers capture only a fraction of the best possible ad monetisation revenue
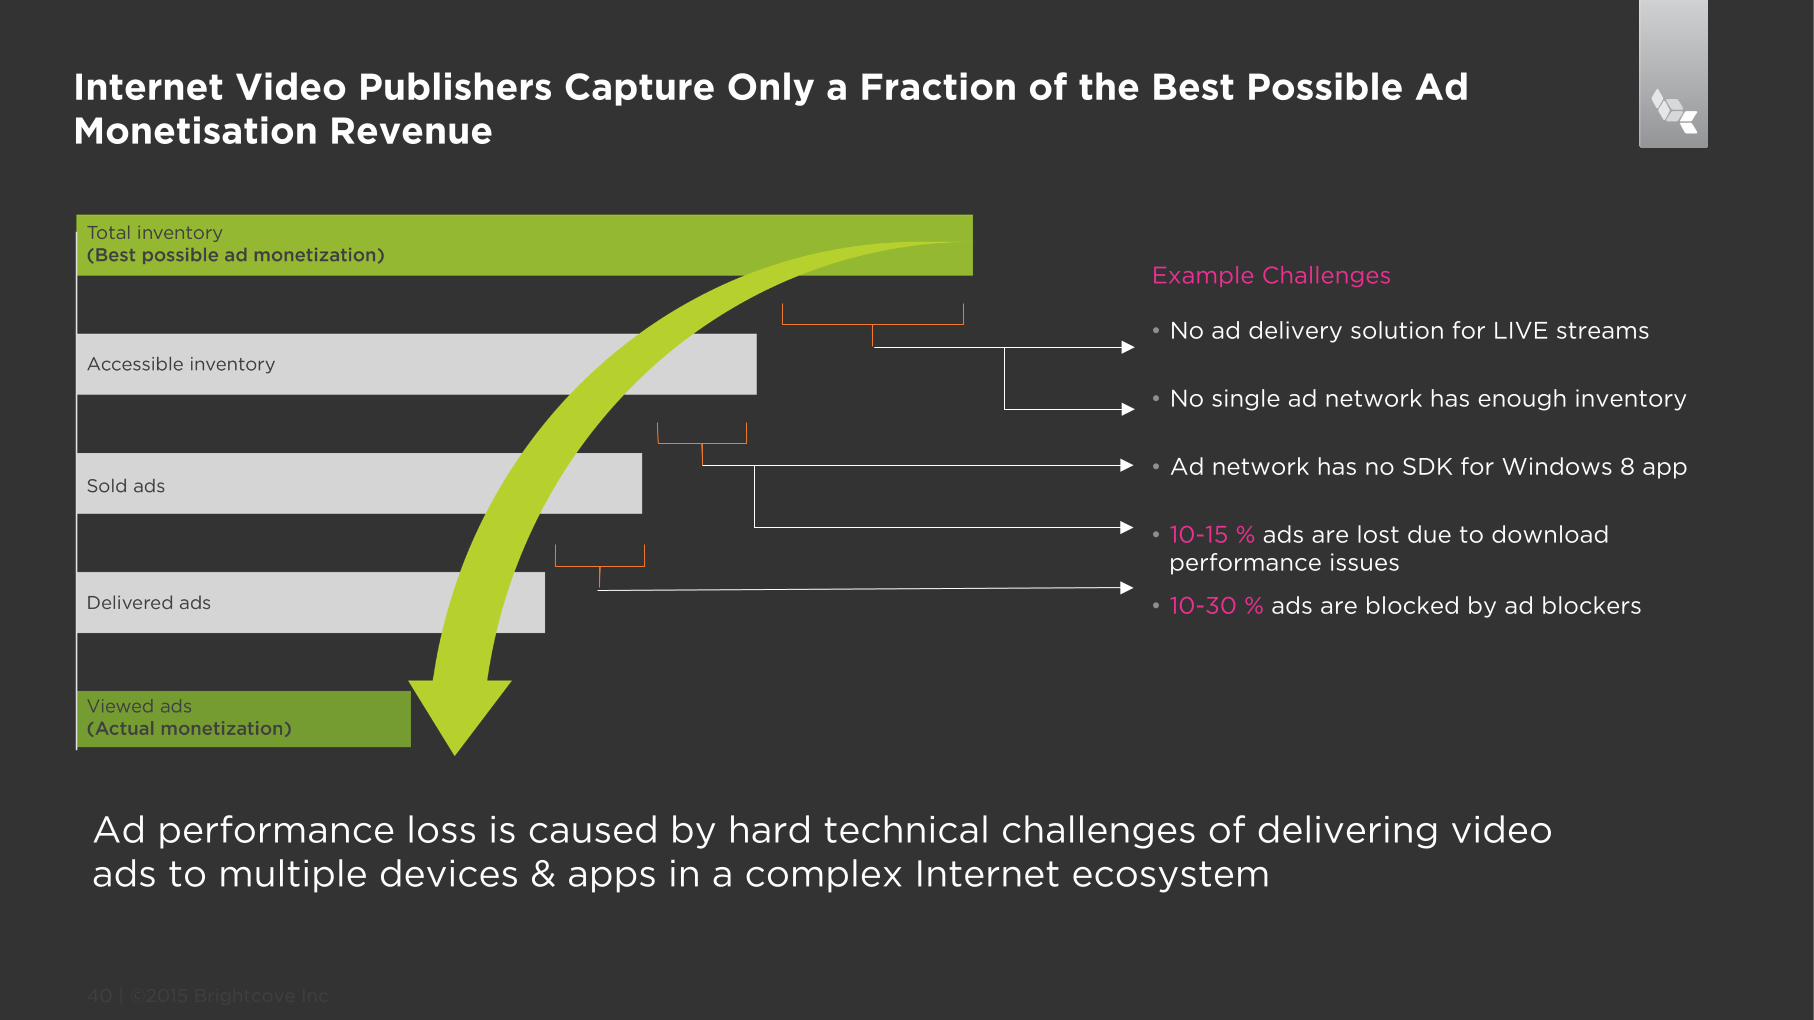
Internet Video Publishers Capture Only a Fraction of the Best Possible Ad Monetisation Revenue
©2015 Brightcove Inc 40 |
Example Challenges
• No ad delivery solution for LIVE streams
• No single ad network has enough inventory
• Ad network has no SDK for Windows 8 app
• 10-15 % ads are lost due to download performance issues
• 10-30 % ads are blocked by ad blockers
Ad performance loss is caused by hard technical challenges of delivering video ads to multiple devices & apps in a complex Internet ecosystem
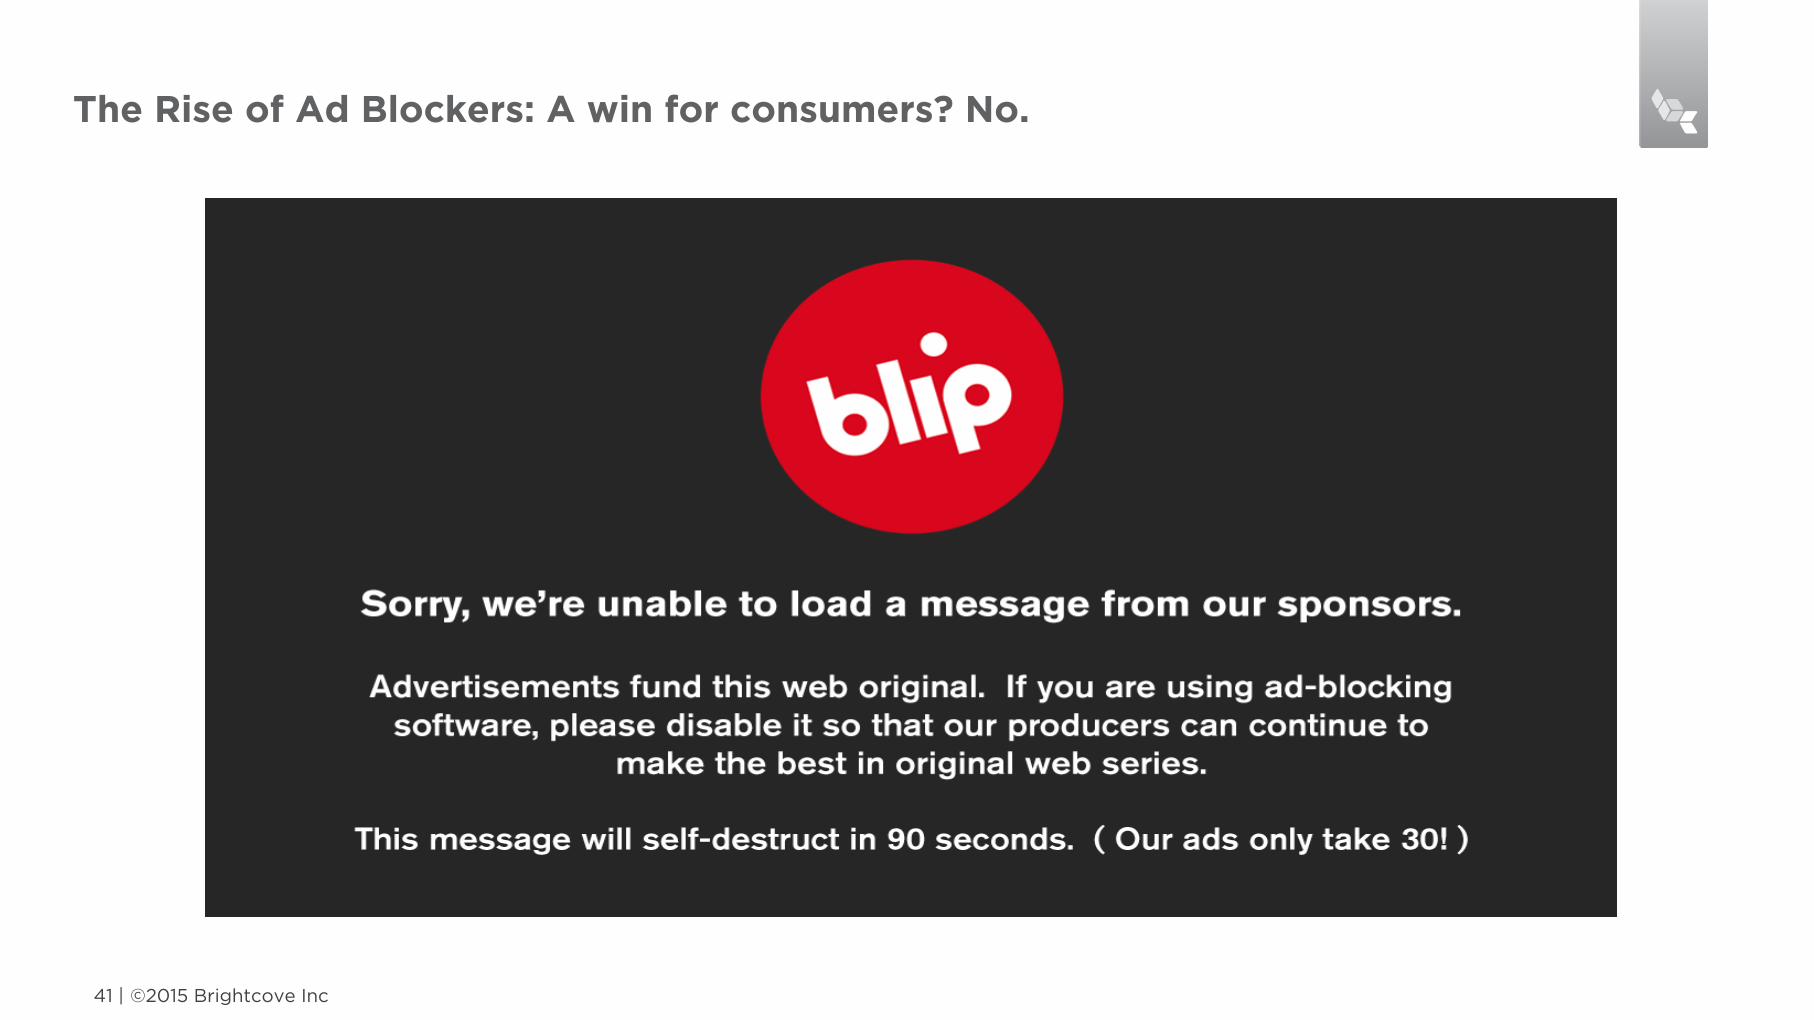
The Rise of Ad Blockers: A win for consumers? No.
©2015 Brightcove Inc 41 |
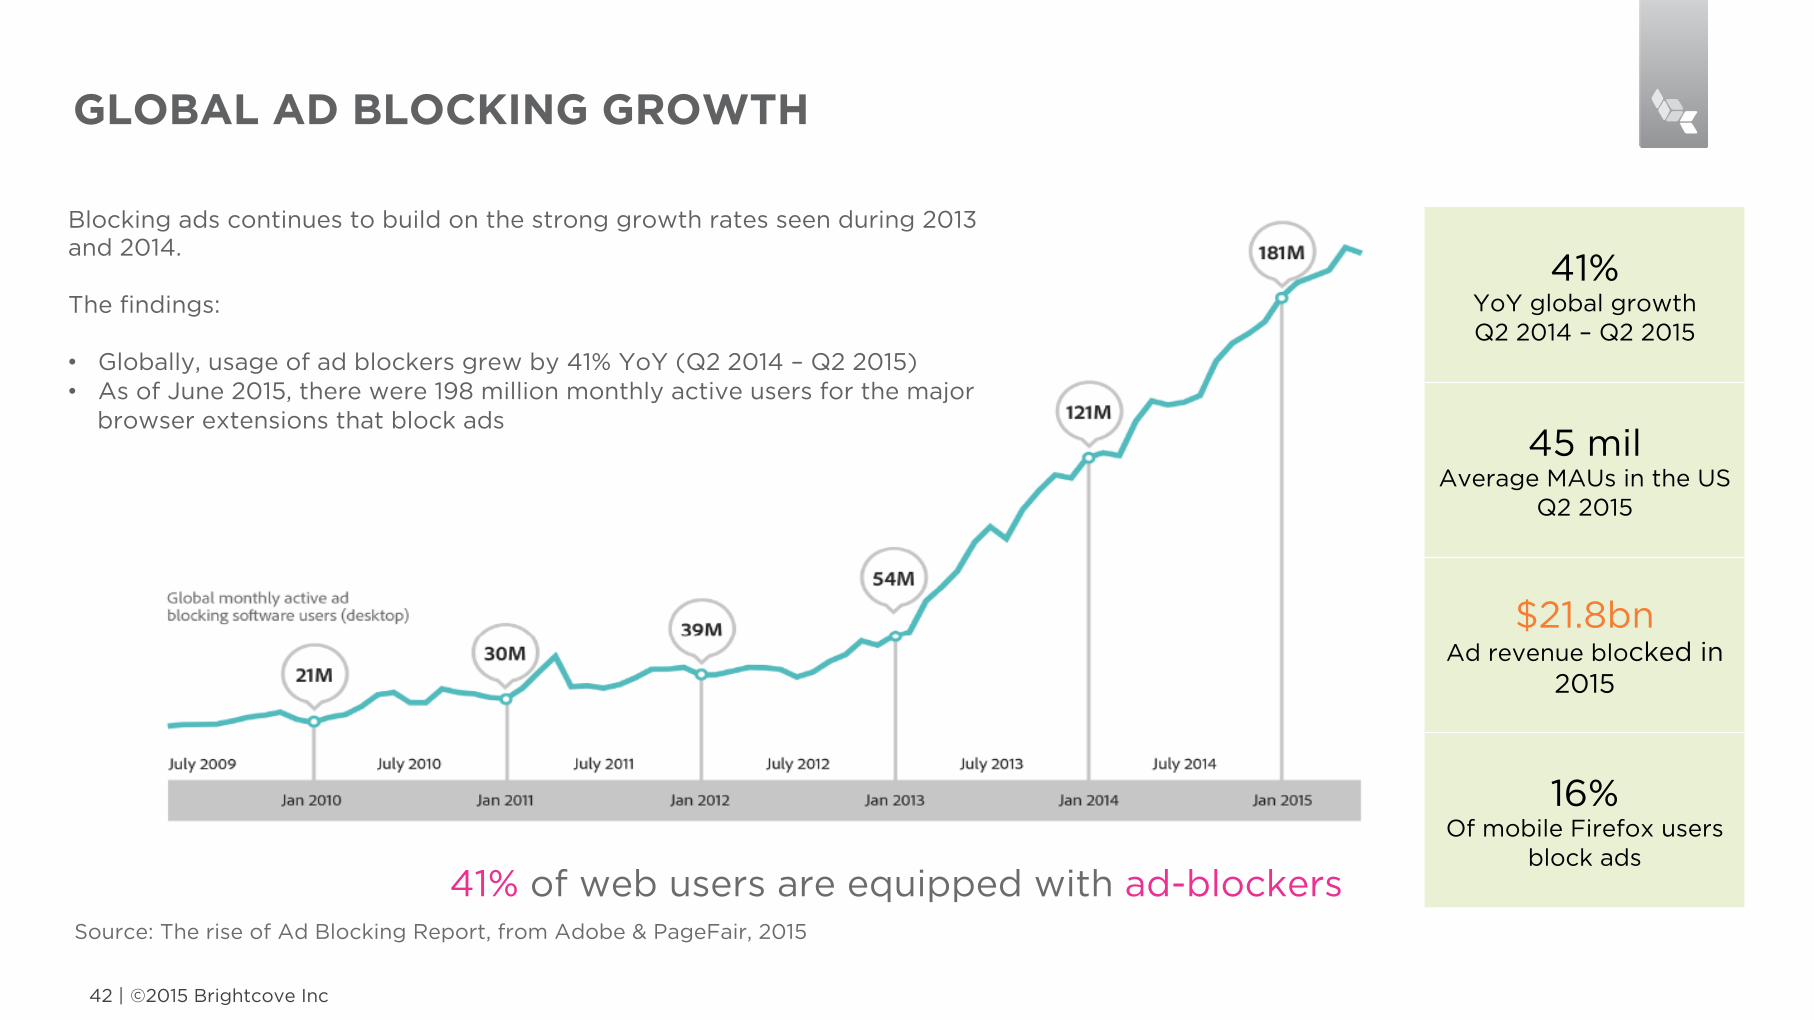
GLOBAL AD BLOCKING GROWTH
©2015 Brightcove Inc 42 |
41% of web users are equipped with ad-blockers
Blocking ads continues to build on the strong growth rates seen during 2013 and 2014. The findings: • Globally, usage of ad blockers grew by 41% YoY (Q2 2014 – Q2 2015) • As of June 2015, there were 198 million monthly active users for the major
browser extensions that block ads
Source: The rise of Ad Blocking Report, from Adobe & PageFair, 2015
41% YoY global growth Q2 2014 – Q2 2015
45 mil Average MAUs in the US
Q2 2015
$21.8bn Ad revenue blocked in
2015
16% Of mobile Firefox users
block ads
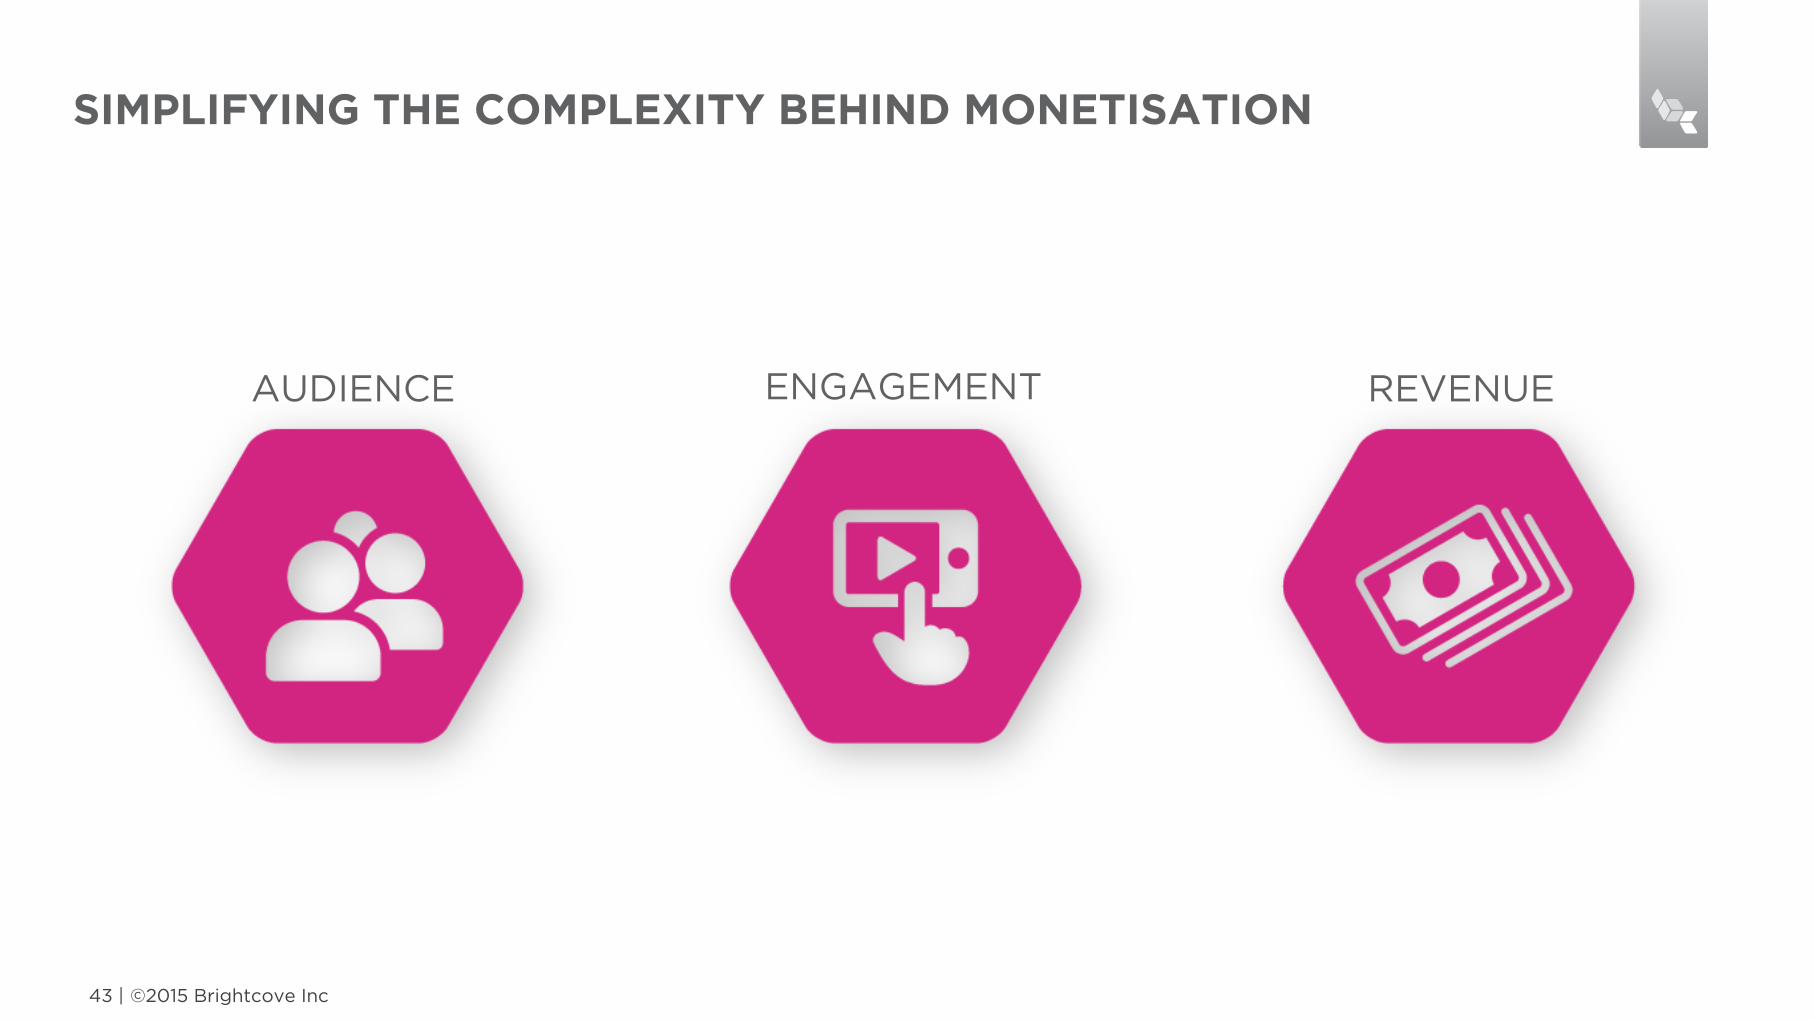
SIMPLIFYING THE COMPLEXITY BEHIND MONETISATION
©2015 Brightcove Inc 43 |
AUDIENCE ENGAGEMENT REVENUE
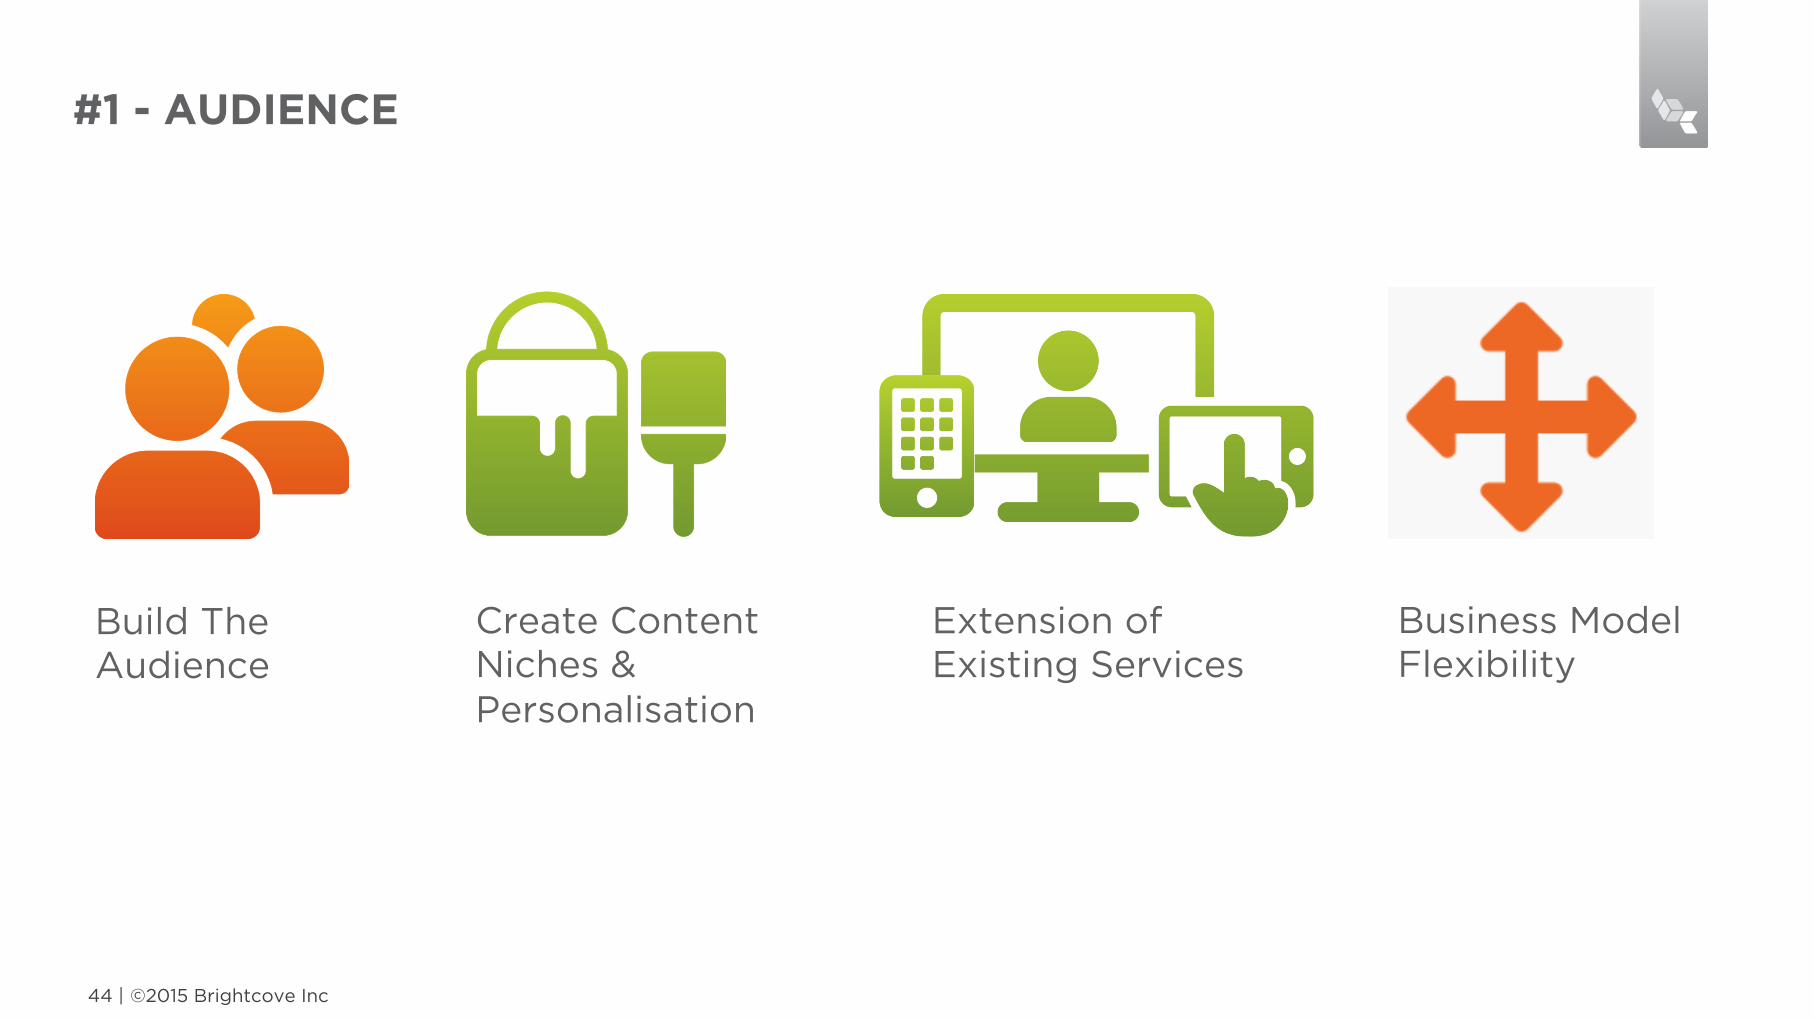
#1 - AUDIENCE
©2015 Brightcove Inc 44 |
Build The Audience
Create Content Niches & Personalisation
Extension of Existing Services
Business Model Flexibility
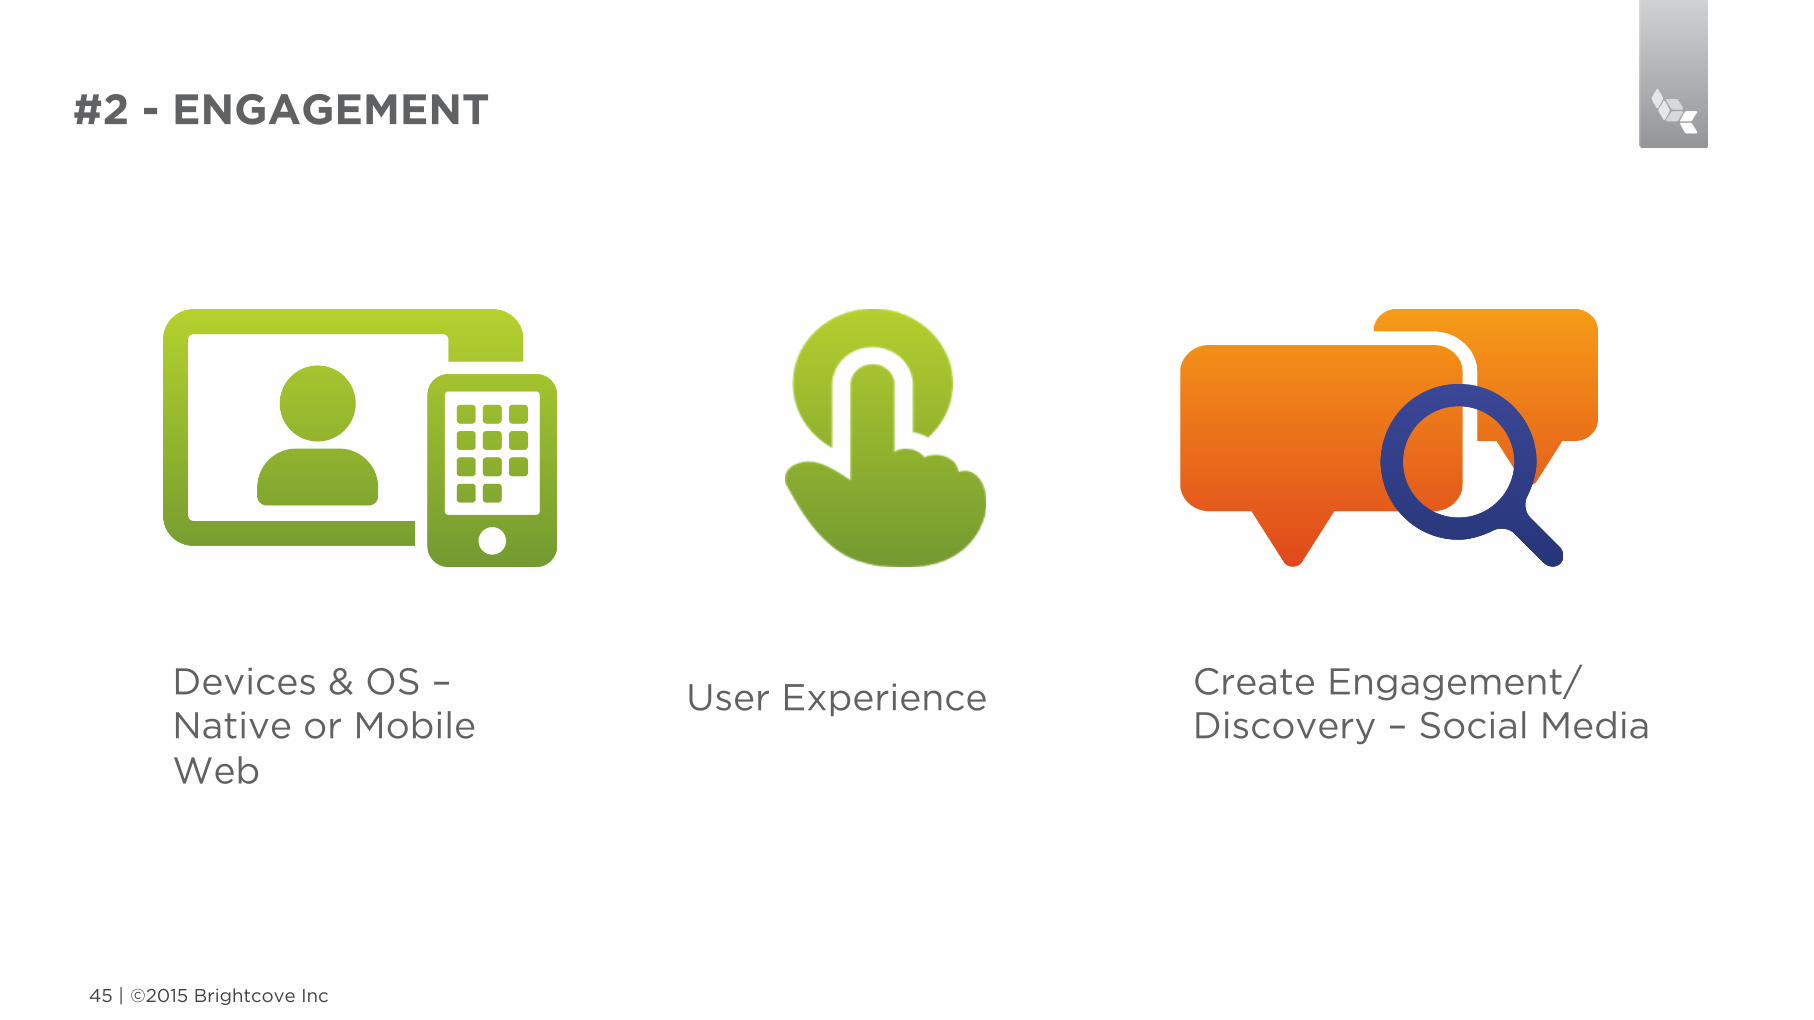
#2 - ENGAGEMENT
©2015 Brightcove Inc 45 |
Devices & OS – Native or Mobile Web
User Experience Create Engagement/Discovery – Social Media
©2015 Brightcove Inc 46 |
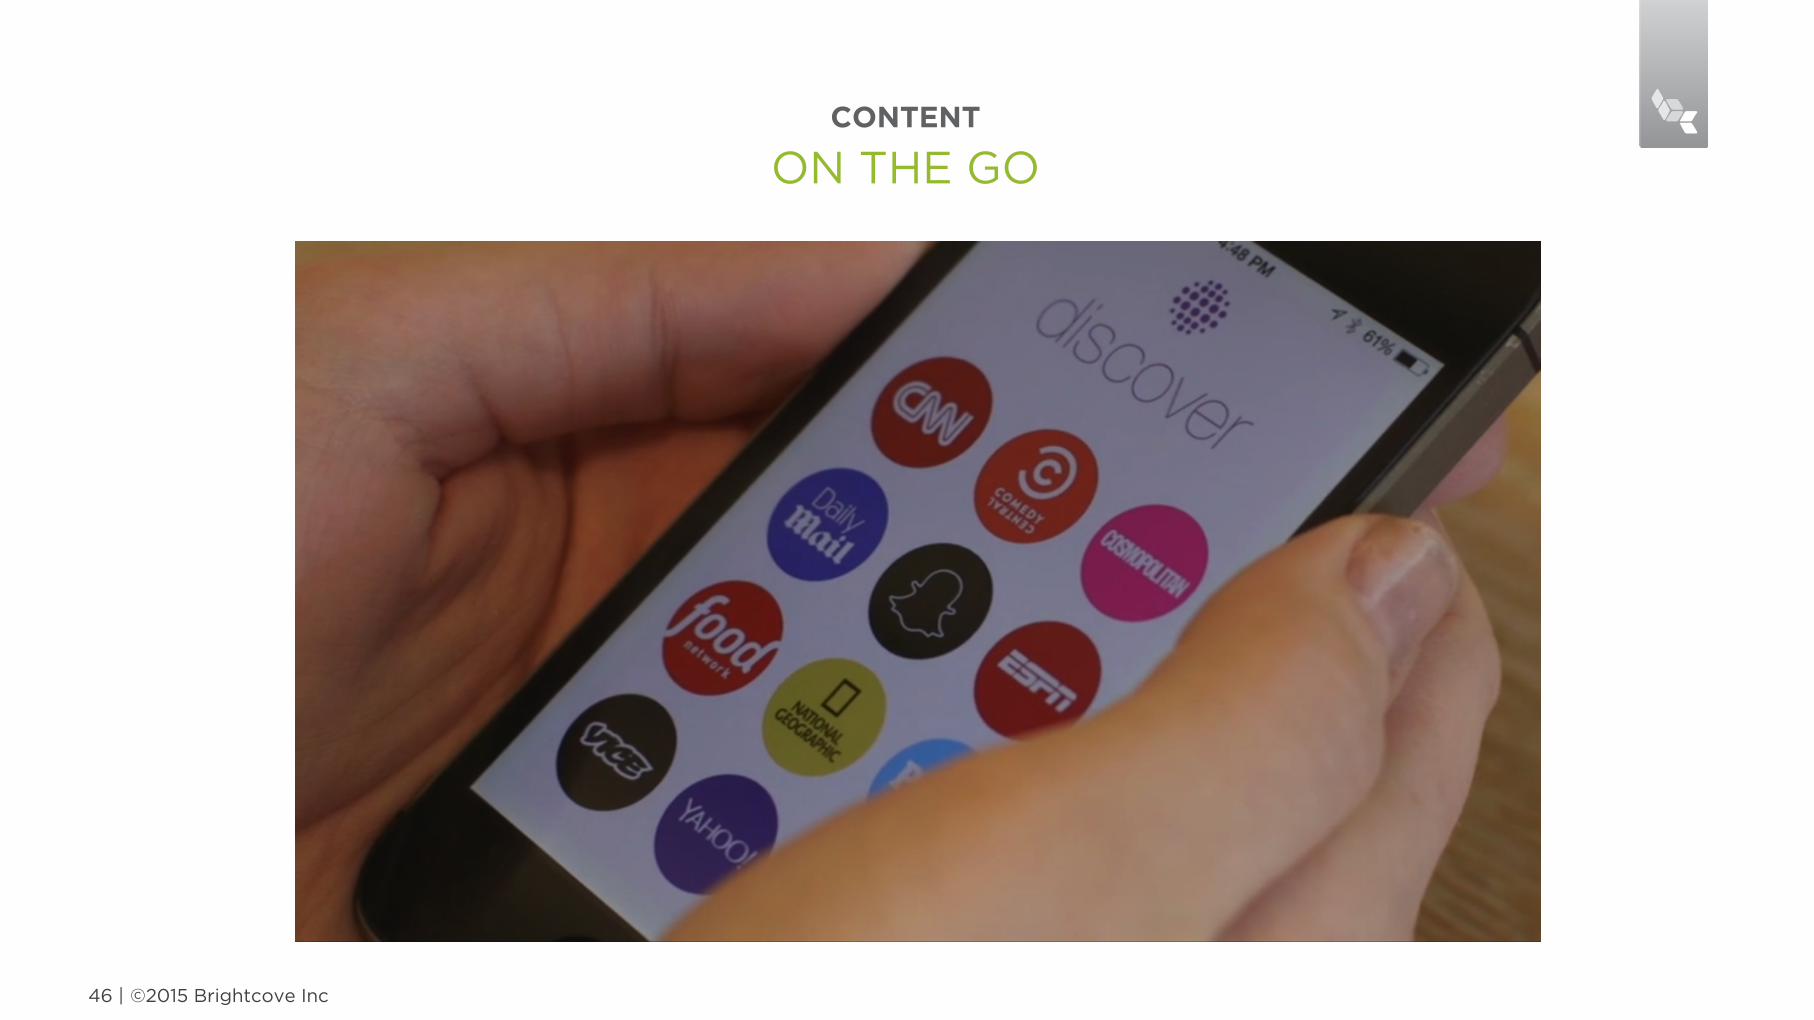
CONTENT
ON THE GO

©2015 Brightcove Inc 47 |
©2015 Brightcove Inc 48 |
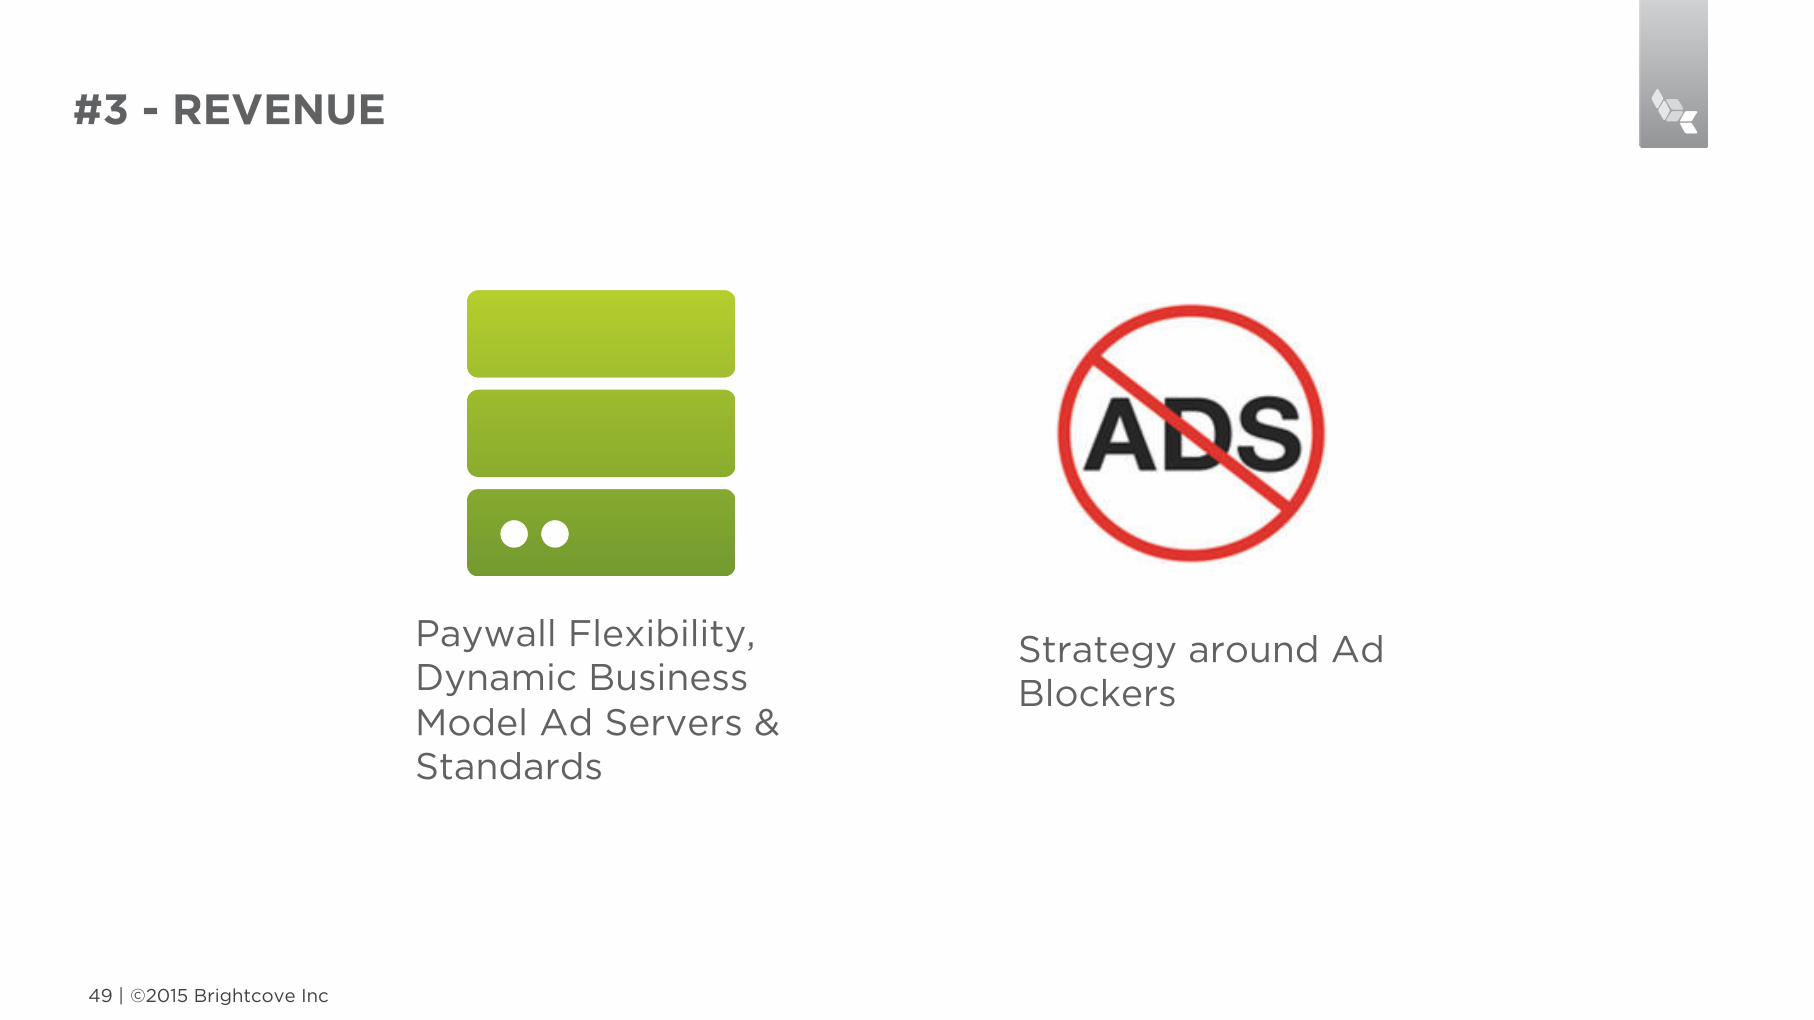
#3 - REVENUE
©2015 Brightcove Inc 49 |
Paywall Flexibility, Dynamic Business Model Ad Servers & Standards
Strategy around Ad Blockers
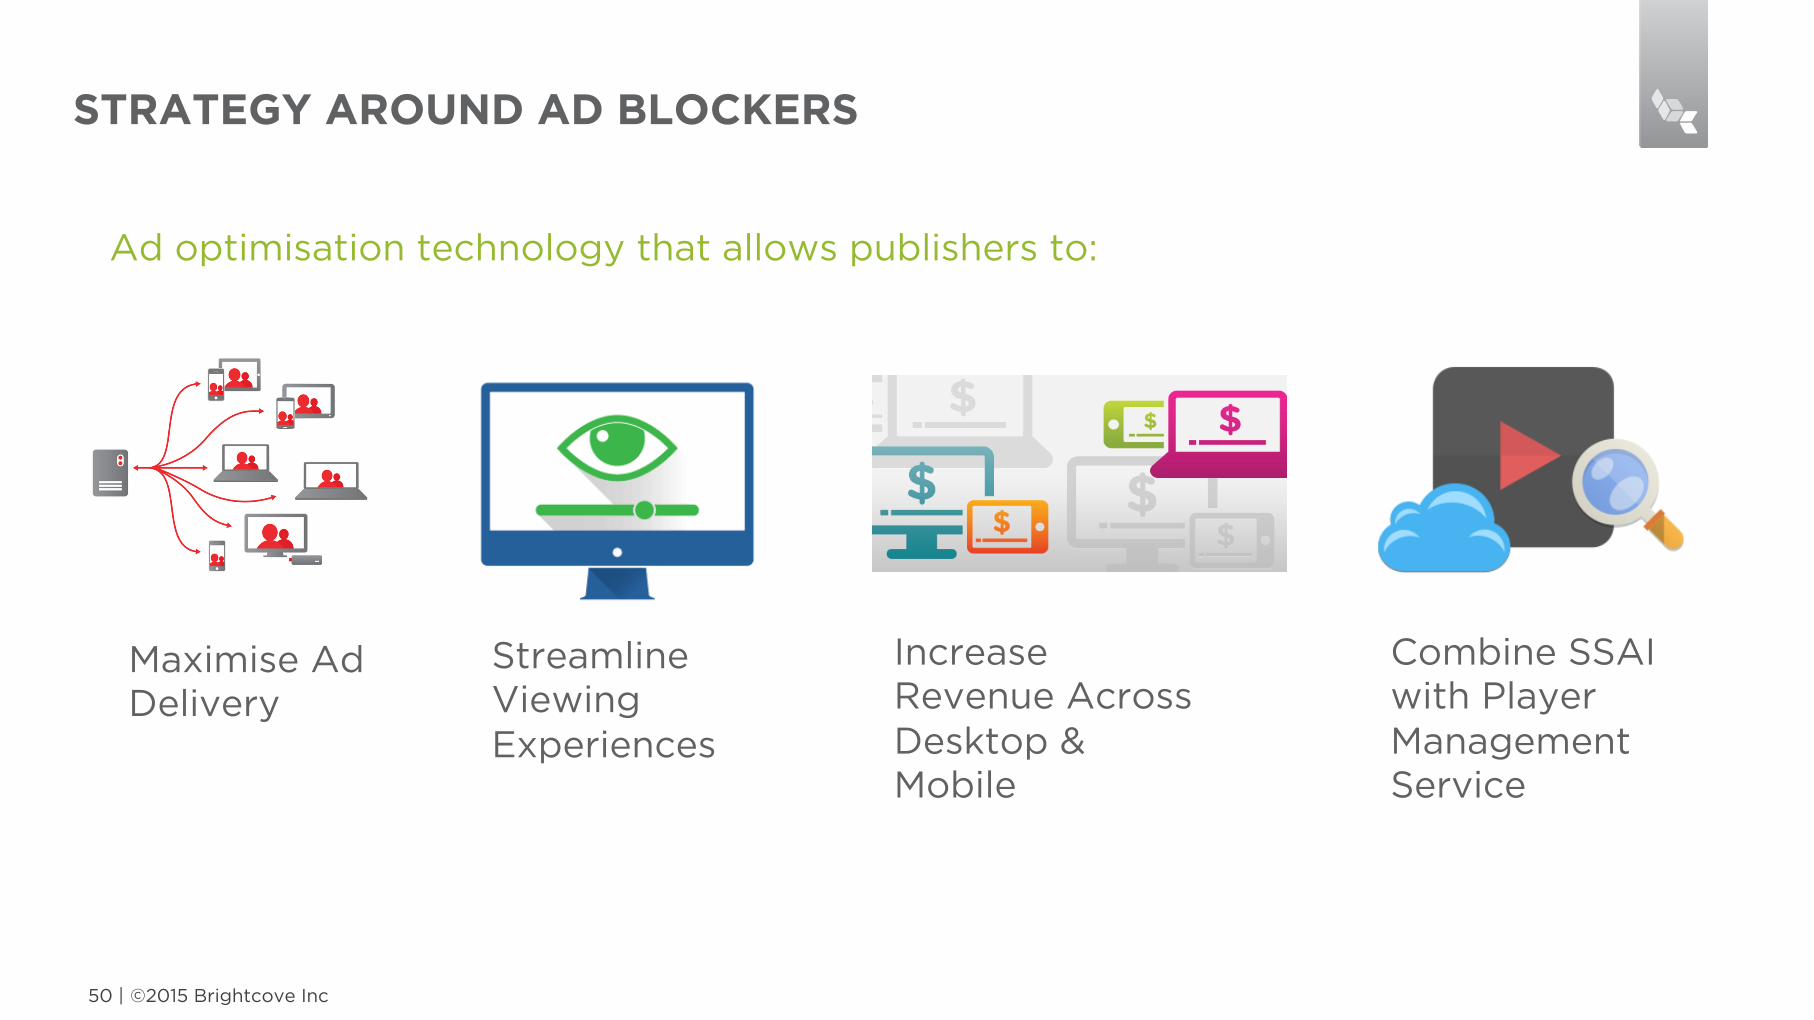
STRATEGY AROUND AD BLOCKERS
©2015 Brightcove Inc 50 |
Ad optimisation technology that allows publishers to:
Maximise Ad Delivery
Streamline Viewing Experiences
Increase Revenue Across Desktop & Mobile
Combine SSAI with Player Management Service
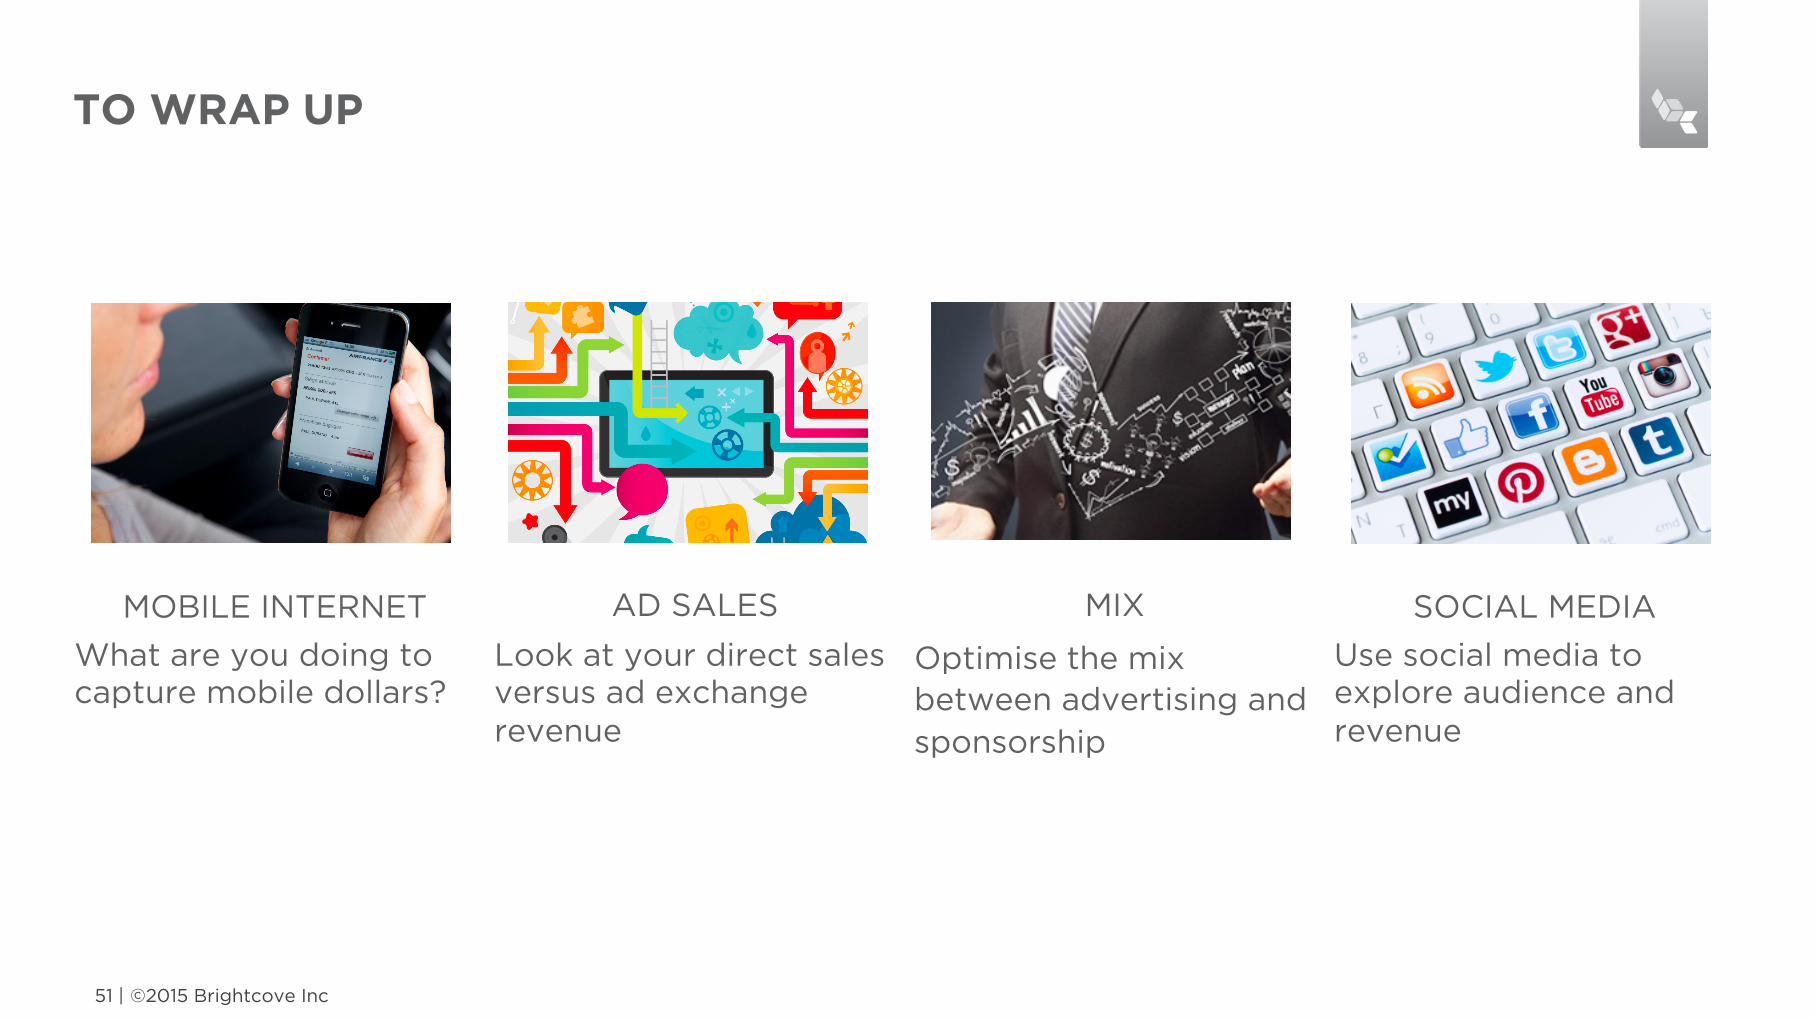
TO WRAP UP
©2015 Brightcove Inc 51 |
MOBILE INTERNET AD SALES MIX SOCIAL MEDIA
What are you doing to capture mobile dollars?
Look at your direct sales versus ad exchange revenue
Optimise the mix between advertising and sponsorship
Use social media to explore audience and revenue

THANK YOU


