91
National survey Indoor air quality in French dwellings Final report

�����������
������� ����������
National survey
Indoor air quality in French dwellings
Final report


�
NOVEMBER 2006
������������������������������������ ��������������������
��
����������������������������������������������
����������������������������������������������������������������������������
��
��������������������������
��
��
��
�������������������������������������� ����������������������
��
������������������������������
����������������������������������������������������������������������
Séverine KIRCHNER1 Jean-François ARENES1
Christian COCHET1 Mickael DERBEZ1
Cédric DUBOUDIN2 Patrick ELIAS1
Anthony GREGOIRE1 Béatrice JÉDOR1
Jean-Paul LUCAS1 Nathalie PASQUIER1 Michèle PIGNERET1 Olivier RAMALHO1
1 Centre Scientifique et Technique du Bâtiment (Building Scientific and Technical
Centre) 2 Agence Française de Sécurité Sanitaire de l’Environnement et du Travail
(French Agency for Safety and Health in the Working Environment)
CSTB Département Développement Durable
(Sustainable Development Department) Division Santé
(Health Division) Phone: 01 64 68 88 49 – Fax: 01 64 68 88 23
�


�
�������������� ��������� ����������������� ������������ ����������������� ����������������������������������� �
The OQAI (Indoor Air Quality Observatory), presided over by Mrs. Andrée Buchmann, is under the authority of the Ministries responsible for Construction, Health and Ecology with the assistance of CSTB (Building Scientific and Technical Centre), the ADEME (Agency for the Environment and Energy Control), the AFSSET (French Agency for Health and Safety in the Working Environment) and the ANAH (National Agency for Housing Improvement). OQAI’s work is validated by a Scientific Board that was presided over by Professor Bernard Festy and then by Mr. Yvon Le Moullec. The OQAI is operationally implemented and scientifically coordinated by CSTB (Building Scientific and Technical Centre).
For the survey on air quality in dwellings: Financing was provided by the Ministry for Construction, CSTB, the ADEME, the Ministry of Health, the Ministry of Research, the ANAH and the Health Monitoring Institute (InVS). About a hundred experts from almost 50 organisations, and distributed in 25 workgroups participated in carrying out the national survey and in the first interpretation of collected data. These organizations include the ADEME, AFSSET, AIR NORMAND, AIRPARIF, Association for the Prevention of Atmospheric Pollution (APPA), Atmo Auvergne, CERTU (Centre d'Etudes sur les Réseaux de Transport et l’Urbanisme – Transport Networks and Town Planning Study Centre), Lyon CETE (Centre d’Etude Technique de l’Equipement – Technical Facilities Design Centre), CETIAT (Centre Technique des Industries Aérauliques et Thermique – Technical Centre for Aeraulic and Thermal Industries), Nancy CHU – Anti-Poison Centre, CNAM (Conservatoire National des Arts et Métiers - higher education institution), CNRS, Nord Pas de Calais Regional Council, CREDOC (Centre de Recherche pour l'Etude et l'Observation des Conditions de Vie – Research Centre for Study and Observation of Living Conditions), CSTB, CTBA (Centre Technique du Bois et de l'Ameublement – Technical Centre for Wood and Furniture), DDASS 13. DDASS 67. DGS (Direction Générale de la Santé – General Directorate of Health), DGSNR (Direction Générale de la Sûreté Nucléaire et de la Radioprotection – General Directorate of Nuclear Safety and Radioshielding), Douai Ecole des Mines (higher education institution), EDF, ENSP (Ecole Nationale de la Santé Publique – National School for Public Health), Paris Faculty of Pharmacy/Hygiene and public health laboratory, Salvatore Maugeri Foundation, FRACTAL, GEOCIBLE, Research Group on the Environment and Atmospheric Chemistry (Joseph Fourrier University) (GRECA), Cochin Hospital, Strasbourg University Hospital (HUS)/Pneumology Service, INERIS (Institut National de l'Environnement Industriel et des Risques – National Institute for the Industrial Environment and Risks), INRS (National Institute of Research and Security for prevention of work accidents and professional diseases), INSEE (Institut National de la Statistique et des Études Économiques – National Institute of Statistics and Economic Studies ), INSERM (Institut National de la Santé et de la Recherche Médicale – National Institute of Health and Medical Research), Gustave Roussy Institute, InVS, LOCEAN (Laboratoire d’Océanographie et du Climat Expérimentation et Approches Numériques – Oceanography, Experimental Climate and Digital Approaches Laboratory), IRSN (Institut de Radioprotection et de Sûreté Nucléaire – French Institute for Radioprotection and Nuclear Safety), LCPP (Laboratoire Central de la Préfecture de Police – Police Prefecture Central Laboratory), LEPI (Laboratoire d’Etude des Particules Inhalées – Inhaled Particulate matter Studies Laboratory), LHVP (Laboratoire d’Hygiène de la Ville de Paris – City of Paris Health Laboratory), LNE (Laboratoire National de métrologie et d'Essais – National Metrology and Tests Laboratory), RATP (Paris Transport Authority), SNCF (French Railways), Western Brittany University, University of la Rochelle/LEPTAB, City of Lille/Health and Environment Services, City of Strasbourg/Hygiene and Health Service, Vincent Nedellec Consultant (VNC). Eighteen teams of investigating technicians have been mobilised to implement the national survey: ACOUSTB, APPA Dauphiné Savoie Committee, APPA Marseilles Provence Committee, ASPA (Association pour la Surveillance and l'Etude de la Pollution Atmosphérique en Alsace – Association for Monitoring and Study of the Atmospheric Pollution in Alsace, ATMO Auvergne, CDHR 62 (Comité Départemental d'Habitat et d’Aménagement du Pas de Calais – Pas de Calais Departmental Committee for Dwellings and Development), Grenoble CSTB, Sophia-Antipolis, Nantes and Champs-sur-Marne, LHVP, PACT (Association pour l’Amélioration, la Conservation and la Transformation des Logements – Association for Improvement, Conservation and Transformation of Dwellings) in Calvados, Cher departments and Paris, RSPMP (Réseau Santé Publique Midi Pyrénées – Midi Pyrenees Public Health Network), SOCOTEC 10 (Aube department), 75 (Paris) and 92 (Hauts de Seine department).
Five laboratories ���������� ��� ������������������������� � �����������!�������� ���Champs-sur-Marne CSTB POLLEM laboratory, University Hospitals of Strasbourg/Pneumology Department, Salvatore Maugeri foundation (FSM) in Padoue (Italy), LHVP (Laboratoire d’Hygiène de la Ville de Paris – City of Paris Health Laboratory), Lognes DOSIRAD laboratory.


�
�������������� ��������� ����������������� ������������ "���������������� ����������������������������������� �
��������
The OQAI (Observatoire de la Qualité de l'Air Intérieur –Indoor Air Quality Observatory) was set up by the public authorities and its objective is to create a permanent device for collection of data on pollutants present in indoor atmospheres in different living areas (housing, schools, offices, leisure locations, etc.) in order to provide elements that can be used directly to enable public authorities to prevent or limit risks related to air pollution in closed spaces. After a pilot phase on 90 dwellings, the national survey in dwellings carried out by the Indoor Air Quality Observatory during the 2003-2005 period now makes it possible to draw up a first report on indoor air quality representative of the situation of 24 million principal residences in mainland France. Parameters were chosen as a function of their impact on air quality or comfort, and their dangerousness and frequency of appearance: carbon monoxide, volatile organic compounds, particulate matter, radon, dog, cat and dust mite allergens, gamma radiation, carbon dioxide, temperature and relative humidity, air flow, etc. Most of these parameters are different from those usually used to characterise outdoor air quality, because they reflect the presence of a large number of potential sources of indoor pollution including materials, equipment, furniture, household cleaning products, human activity, outdoor environment, etc.
�� ������ ������� ���� ���� ����� ������ ��� ��� ��� ��������� ������ ���� ���� ��� ���������� ���� �����
���������� �����������������!������������ ��� �������� ��������� ������� �� ��� �� ������� ���#��
$������� ���������������� ��#���� ������������� �������������� ��� �� ��%&�'&(��������������������
��� ��������)�������� ����� ���������������� �������������������������������*��� �������!�
����������������!�������������������� ������ �� ������������%����� �����+�� )����� ���� ����#�
The inventory on the quality of indoor air in dwellings is expressed in the form of statistical distributions showing the comfort and the distribution of dwellings as a function of measured concentrations or levels (particularly median, principal percentiles and maximum concentrations) for each pollutant. This inventory on indoor air quality will be complemented in early 2007 by including fungal contamination levels and the presence of humidity (data currently being validated).
The following points should be emphasized: There is a specific feature about indoor air quality in dwellings that is different from outdoor air quality, and that is expressed particularly by the presence of some substances not observed outdoors or by significantly higher concentrations indoors. The pollutants involved are present in quantifiable levels in most investigated dwellings. The distribution of organic chemical pollution is not uniform in the investigated dwellings. Only a minority of dwellings (9%) have very high concentrations of several pollutants at the same time; conversely, 45% of dwellings have very low concentration levels for all measured pollutants. Depending on the pollutant, between 5 to 30% of dwellings have values significantly higher than average concentrations found in the investigated dwellings.

�
�������������� ��������� ����������������� ������������ ,���������������� ����������������������������������� �
� Chemical compounds:
Volatile organic compounds • Volatile organic compounds are detected in 2.3% (2-butoxy-ethylacetate) to
100% (acetaldehyde, formaldehyde, hexaldehyde, toluene, m/p xylene) of dwellings depending on the compounds. Concentrations inside 50% of dwellings are less than 20 µg/m3. Several maximum values exceed 100 µg/m3 or even 1 000 µg/m3 (two maximum values are greater than 4 000 µg/m3).
• The percentage of French dwellings in which contents of volatile organic compounds (apart from glycol ethers) are higher inside the dwelling than outdoors varies between 68.4% (trichloroethylene) and 100% (formaldehyde and hexaldehyde).
• Median concentration values (namely 50% of situations) of several volatile organic compounds are greater in garages communicating directly with dwellings, than the corresponding values measured in all dwellings. In particular, this is true for benzene (4.4 µg/m3 in garages compared with 2.1 µg/m3 in dwellings), toluene (110.4 µg/m3 compared with 12.2 µg/m3), ethylbenzene (18 µg/m3 compared with 2.3 µg/m3), m/p-xylenes (58.9 µg/m3 compared with 5.6 µg/m3), o-xylenes (20.8 µg/m3 compared with 2.3 µg/m3), n-decane (10.8 µg/m3 compared with 5.3 µg/m3), n-undecane (8.6 µg/m3 compared with 6.2 µg/m3), 1.2.4 trimethylbenzene (18.7 µg/m3 compared with 4.1 µg/m3) and styrene (1.2 µg/m3 compared with 1.0 µg/m3).
• Analysis of the different volatile organic compounds shows that there is a variety of situations (see summary tables at the end of the summary description): * Aldehydes are among the most frequent and most concentrated
molecules in dwellings. Thus, these compounds are observed in 99.4 to 100% of dwellings depending on the compound, acetaldehyde, formaldehyde and hexaldehyde are observed in all dwellings. Concentrations in 50% of dwellings exceed values varying from 1.1 µg/m3 (acrolein) to 19.6 µg/m3 (formaldehyde). Indoor concentrations in 5% of dwellings are greater than values varying from 3.4 µg/m3 (acrolein) to 50.1 µg/m3 (hexaldehyde). Concentrations in outdoor air at 95% of dwellings are lower than values varying from 0.5 µg/m3 (acrolein) to 3.6 µg/m3 (formaldehyde). Formaldehyde is the volatile organic compound with the highest mass found in dwellings.
* Hydrocarbons are frequent (detection in 83 to 100% of dwellings depending on the compounds), and two hydrocarbons (toluene and m/p xylene) are observed in all dwellings. Concentrations in 50% of dwellings are higher than values varying from 1 µg/m3 (styrene and trichloroethylene) to 12.2 µg/m3 (toluene). Concentrations in 5% of dwellings are greater than values varying from 2.7 µg/m3 (styrene) to 150 µg/m3 (1.4-dichlorobenzene). Concentrations in outdoor air at 95% of dwellings are less than values varying from 0.7 µg/m3 (styrene) to 12.9 µg/m3 (toluene).
* Glycol ethers are relatively infrequent (detection in 2.3 to 85% of dwellings depending on the compound). Concentrations in at least 50% of dwellings are less than detection limits for 2-butoxyethylacetate and 1-

�
�������������� ��������� ����������������� ������������ -���������������� ����������������������������������� �
methoxy-2-propylacetate. Indoor concentrations in 50% of dwellings are higher than 1.6 µg/m3 for 2-butoxyethanol and 1.9 µg/m3 for 1-methoxy-2-propanol. Values for 5% of dwellings varying from undetectable (2-butoxyethylacetate) to 17.5 µg/m3 (1-methoxy-2-propanol). Concentrations of all measured glycol ethers in outdoor air are less than either the detection limit (2-butoxyethylacetate and 1-methoxy-2-propylacetate) or the quantification limit (1-methoxy-2-propanol and 2-butoxyethanol) for 95% of dwellings.
Carbon monoxide • In the vast majority, carbon monoxide levels are close to zero in the
different rooms in dwellings. Values in some dwellings are higher depending on the exposure times considered. Depending on the rooms considered, the maximum observed values vary from 130 to 233 ppm for 15 minutes, from 91 to 175 ppm for 30 minutes, from 53 to 120 ppm for 1 hour, from 31 to 43 ppm for 8 hours, and values in service rooms (kitchens, bathrooms, WC) are the highest for 15 minutes, 30 minutes and 1 hour.
� Biological pollutants: • Contents of cat allergens (Fel d 1) and dog allergens
(Can f 1) are less than the quantification limit in 50% of dwellings. 5% of dwellings have concentrations higher than 2.7 ng/m3 for cat allergens and higher than 1.6 ng/m3 for dog allergens.
• For dust mite allergens, 50% of dwellings have contents higher than 1.6 and 2.2 µg/g for Der p 1 and Der f 1 respectively. Contents exceed 83.6 µg/g for Der f 1 and 36.2 µg/g for Der p 1 in 5% of all dwellings.
� Physical parameters: • Contents of particulate matter are higher than 19.1 µg/m3 for PM2.5 and 31.3
µg/m3 for PM10 in 50% of dwellings. 5% of dwellings have concentrations higher than 133 µg/m3 for PM2.5 and 182 µg/m3 for PM10.
• 50% of dwellings have radon contents higher than 31 Bq/m3 in bedrooms and higher than 33 Bq/m3 in other rooms (with or without correction for seasonal variations). In 5% of dwellings, radon concentrations corrected for seasonal effect are higher than 220 Bq/m3 in bedrooms and 194 Bq/m3 in other rooms (225 and 214 Bq/m3 respectively without correction).
• Gamma radiation is higher than 0.062 µSv/h in 50% of French dwellings and exceeds 0.1 µSv/h in 5% of dwellings.
� Comfort parameters: • The temperature is higher than 21°C in 50% of French dwellings while 5% of
dwellings have a temperature higher than 25.5°C in bedrooms and 24.8°C in other rooms. The temperature amplitude is higher in bedrooms (5.4°C – 29.5°C).
• The relative humidity is greater than 49% in 50% of dwellings. The relative humidity in 5% of dwellings exceeds 63.1% in bedrooms and 64.7% in other rooms.

�
�������������� ��������� ����������������� ������������ &.���������������� ����������������������������������� �
• 50% of dwellings have average values of carbon dioxide concentrations exceeding 756 ppm over a week, 1 689 ppm assuming the maximum of average sliding values over 1 hour and 1 161 ppm for values measured during the night. In 5% of dwellings, the medium concentration of CO2 over one week is greater than 1 484 ppm, the maximum during an hour exceeds 4 449 ppm and the maximum values during the night exceed 3 175 ppm.
This inventory is the first available reference on indoor air quality in French dwellings and cannot be compared with a previous situation because it is the first. Nevertheless, levels observed are similar to those found by isolated studies in France and in major international surveys.
Apart from the case of radon and asbestos, there are no guide values in France to quantify the number of dwellings exceeding concentration levels that could cause effects on health. Depending on the compound, a variable number of dwellings have contents exceeding the rare comparable recommended values available in other countries; a few% for carbon monoxide; a few% up to nearly a quarter for formaldehyde���and half for dust mite allergens. The results of this survey are currently being interpreted by health agencies and the authorities will use them to get a better idea of health risks associated with indoor air pollution and to define what measures (if any) should be taken for protection of the population. Construction and decoration, furniture, maintenance, do-it yourself products, heating and hot water production equipment, the presence of human activities and activities related to essential needs (cooking, hygiene, washing) or others (smoking, use of candles, incense, cosmetics, presence of plants and pets), outdoor air, etc., are all sources and vectors of observed pollution. Ventilation is another essential factor determining air quality. The interpretation of descriptive data collected at the same time as indoor air quality data (currently being validated) will be used to obtain more detailed knowledge about the contributions of these different factors and particularly:
� to make a detailed inventory of existing dwellings and behaviours of households,
� to make a systematic search for pollution factors (pollution sources, dwelling types, ventilation conditions, behaviours, seasons, geographic situation, etc.) in order to help choose policies to be implemented in this field,
� to produce typologies of housing and household behaviours that create a risk of pollution,
� to create indoor air quality indexes for communication purposes and actions on indoor air quality.�
Keywords: indoor air, dwellings, pollutants, measurement survey, VOC, carbon monoxide, radon, gamma radiation, allergens, carbon dioxide, particulate matter, temperature, relative humidity, ventilation.
&� ���� ������������!� �� /������� � ��� %����+!� (..0)� ����� ����������� ������� ���� ��� ��� 1��2�3��4� %��� 2��� ���3��������������������)����������#�

�
�������������� ��������� ����������������� ������������ &&���������������� ����������������������������������� �
INVENTORY OF AIR QUALITY IN PRINCIPAL RESIDENCES SUMMARY TABLES
Chemical compounds: - VOC
Location % weighted data less
than the detection limit
Median 2 (µg/m3)
95th percentile 3 (µg/m3)
% ratios C���/C ��
4
� 1
indoors 0.0 11.6 [10.8-12.3] 30.0 [26.7-35.1] Acetaldehyde
outdoors 1.1 1.3 [1.2-1.3] 3.0 [2.6-3.1] 99.6
indoors 0.6 1.1 [1.0-1.2] 3.4 [2.9-3.8] Acrolein
outdoors 18.1 < LQ (=0.3) 0.5 [0.4-0.6] 98.1
indoors 0.0 19.6 [18.4-21.0] 46.6 [40.8-55.1] Formaldehyde
outdoors 0.5 1.9 [1.8-2.0] 3.6 [3.4-4.2] 100.0
indoors 0.0 13.6 [12.6-14.7] 50.1 [37.6-55.4] Hexaldehyde
outdoors 18.6 0.5 [0.4-0.5] 1.4 [1.1-1.7] 100.0
indoors 1.4 2.1 [1.9-2.2] 7.2 [6.3-9.4]
outdoors 6.5 < LQ (=1.1) 2.9 [2.5-3.4] 90.9
Benzene
garage 0.8 4.4 [3.5-6.4] 18.6 [12.6-21.6]
indoors 1.9 4.2 [3.7-4.8] 150.0 [96.5-341.0]
outdoors 5.7 1.8 [1.6-1.9] 4.3 [3.5-5.5] 95.6 1.4-
dichlorobenzene garage 6.9 2.2 [1.8-2.5] 18.1 [8.0-40.0]
indoors 0.3 2.3 [2.1-2.5] 15.0 [9.2-18.2]
outdoors 6.2 1.0 [1.0-1.1] 2.6 [2.3-3.0] 95.5
Ethylbenzene
garage 1.2 18.0 [13.9-26.4] 137.0 [109.0-
155.0]
indoors 0.7 5.3 [4.8-6.2] 53.0 [38.6-83.9]
outdoors 4.1 1.9 [1.8-2.1] 6.4 [5.3-9.8] 94.4
n-Decane
garage 0.0 10.8 [7.3-14.0] 213.0 [88.3-257.0]
indoors 0.6 6.2 [5.6-7.1] 72.4 [45.2-93.2]
outdoors 12.5 1.8 [1.6-2.0] 7.0 [5.5-9.5] 94.1
n-Undecane
garage 1.0 8.6 [5.6-11.0] 106.0 [65.7-115.0]
indoors 1.9 1.0 [0.9-,10] 2.7 [2.2-3.1]
outdoors 8.6 0.4 [0.3-0.4] 0.7 [0.7-0.8] 95.2
Styrene
garage 2.8 1.2 [0.9-1.6] 9.3 [4.6-11.4]
indoors 15.7 1.4 [1.2-1.6] 7.3 [6.0-11.5]
outdoors 21.4 < LQ (=1.2) 3.9 [2.7-4.3] 77.1
Tetrachloroethylene
garage 41.0 < LQ (=1.2) 2.5 [1.5-4.9]
indoors 0.0 12.2 [11.4-13.7] 82.9 [57.7-115.0]
outdoors 0.5 3.5 [3.3-3.8] 12.9 [10.8-14.8] 96.2
Toluene
garage 0.0 110.4 [67.6-157.0] 677.0 [426.0-
789.0]
Location % weighted data less Median 5 95th percentile 6 % ratios
(��.5���������������������� �� �������� ���� �������������.5���������������������� �� ��������� ���� ���������
6�-�5���������������������� �� �������� ���� �������������5���������������������� �� ��������� ���� ���������
0�7�� 87�+ ��� ���9��� ������ ���������������� �� ���� �� ���� ����������� �� ���:�������� ��������������������������� ����������
��� �� ����������� ������������ �� ��������� �� ������������� �����#�

�
�������������� ��������� ����������������� ������������ &(���������������� ����������������������������������� �
than the detection limit
(µg/m3) (µg/m3) C���/C �� 7
� 1
indoors 17.1 1.0 [<LQ-1.1] 7.3 [5.1-16.1]
outdoors 23.0 < LQ (=1.0) 2.3 [1.8-2.8] 68.4
Trichloroethylene
garage 38.8 < LQ (=1.0) 12.8 [1.7-29.3]
indoors 0.5 4.1 [3.7-4.4] 21.2 [15.7-25.7]
outdoors 1.9 1.4 [1.3-1.4] 4.1 [3.6-5.3] 95.9
1.2.4-trimethylbenzene
garage 0.0 18.7 [13.2-29.2] 149.0 [110.0-
164.0]
indoors 0.0 5.6 [5.1-6.0] 39.7 [27.1-56.4]
outdoors 3.7 2.4 [2.3-2.7] 7.1 [6.1-8.3] 92.5
m/p-Xylene
garage 1.2 58.9 [38.5-81.2] 454.0 [321.0-
530.0]
indoors 0.1 2.3 [2.1-2.5] 14.6 [10.5-19.5]
outdoors 4.6 1.1 [1.0-1.2] 2.7 [2.4-3.2] 92.1
o-Xylene
garage 1.2 20.8 [14.2-27.9] 166.0 [121.0-
188.0]
indoors 17.0 1.6 [<LQ-1.8] 10.3 [7.0-12.7]
outdoors 91.3 < LD (=0.4) < LQ (=1.5) 82.6
2-butoxyethanol
garage 58.2 < LD (=0.4) 2.7 [2.0-4.5]
indoors 97.7 < LD (=0.3) < LD (=0.3)
outdoors 97.9 < LD (=0.3) < LD (=0.3) 2.5 2-butoxy-
ethylacetate garage 98.3 < LD (=0.3) < LD (=0.3)
indoors 15.1 1.9 [<LQ-2.3] 17.5 [13.1-20.4]
outdoors 94.3 < LD (=0.5) < LQ (=1.8) 84.4 1-methoxy-2-
propanol garage 51.2 < LD (=0.5) 9.1 [2.4-13.0]
indoors 77.3 < LD (=0.7) 2.3 [<LQ-2.8]
outdoors 97.0 < LD (=0.7) < LD (=0.7) 22.1 1-methoxy-2-
propylacetate garage 90.6 < LD (=0.7) < LQ (=2.2)
- Carbon monoxide Location Median 5 (ppm) 95th percent 6 (ppm)
Main rooms 2.9 [1.9-2.9] 15.3 [12.4-22.0]
Other rooms 6.0 [4.8-7.0] 37.2 [22.3-54.4] sliding average over 15 minutes
Annexes 3.8 [1.7-5.3] 53.1 [28.2-94.4]
Main rooms 2.7 [2.1-3.0] 14.3 [11.4-19.1]
Other rooms 4.9 [3.9-5.9] 27.4 [18.3-49.2] sliding average over 30 minutes
Annexes 3.3 [1.5-4.9] 36.2 [21.7-78.0]
Main rooms 2.0 [1.6-15.2] 13.1 [9.5-15.2]
Other rooms 3.9 [3.0-4.7] 21.1 [14.4-36.3] [sliding average
over 1 hour Annexes 3.0 [0.9-3.8] 30.2 [18.0-67.4]
Main rooms 0.5 [0.4-0.9] 6.3 [4.8-8.1]
Other rooms 1.3 [0.9-1.9] 9.5 [5.0-19.2] sliding average
over 8 hours Annexes 0.7 [0.1-1.3] 10.5 [5.2-13.9]
���.5���������������������� �� �������� ���� �������������.5���������������������� �� ��������� ���� ���������'�-�5���������������������� �� �������� ���� �������������5���������������������� �� ��������� ���� ���������"�7�� 87�+ ��� ���9��� ������ ���������������� �� ���� �� ���� ����������� �� ���:�������� ��������������������������� ����������
��� �� �������� ��� ������������ �� ��������� �� ������������� ������

�
�������������� ��������� ����������������� ������������ &6���������������� ����������������������������������� �
Biological compounds:
Quantification limit(LQ) Location % weighted
data < LQ Median 8 95th percentile 9
cat allergens Fel d 1 0.18 ng/m3 living room 74.6 < LQ 2.7 ng/m3
[1.3-5.8]
dog allergens Can f 1 1.02 ng/m3 living room 90.7 < LQ 1.6 ng/m3
[1.1-2.5]
dust mite allergens Der f 1 0.01 µg/g mattress 3.1 2.2 µg/g
[1.3-3.7] 83.6 µg/g
[46.4-103.0]
dust mite allergens Der p 1 0.02 µg/g mattress 7.9 1.6 µg/g
[1.2-2.1] 36.2 µg/g
[23.1-41.5]
Physical parameters: Unit Location Median 8 95th percentile 9
PM10 µg/m3 Living room 31.3 [28.2-34.4] 182.0 [119.0-214.0]
PM2.5 µg/m3 Living room 19.1 [17.2-20.7] 132.0 [88.3-174.0]
Bedrooms 31.0
(with and without correction of seasonal variations)
220 with correction of seasonal variations
(225 without correction)
Radon Bq/m3
Other rooms 33.0
(with and without correction of seasonal variations)
194 with correction of seasonal variations
(214 without correction)
Gamma µSv/h Living room 0.062 [0.058-0.064] 0.122 [0.109-0.125]
Comfort parameter: Unit Location Median 8 95th percent 9
Average over the week 756 [715-794] 1 484 [1 353-1 621]
Max of sliding average values over 1 hour 1 689 [1 556-1 815] 4 449 [4 071-5 166]
CO2 ppm Average of the 60 highest values
between 2h and 5h10 1 161 [1 069-1 238] 3 175 [2 800-3 470]
Bedrooms 21.1 25.5 Temperature °C
Other rooms 21.0 24.8
Bedrooms 48.7 63.1 Relative humidity %
Other rooms 49.5 64.7
,��.5���������������������� �� �������� ���� �������������.5���������������������� �� ��������� ���� ���������
-�-�5���������������������� �� �������� ���� �������������5���������������������� �� ��������� ���� ���������
�
�������������� ��������� ����������������� ������������ &0���������������� ����������������������������������� �
COMPARISON WITH AVAILABLE RECOMMENDED VALUES FOR THE SAME EXPOSURE TIME STEP
Apart from the case of radon and asbestos, in France there are no guide values for quantifying the number of dwellings exceeding concentration levels that can cause health effects. The rare comparable recommended values available in other countries are exceeded in a variable number of dwellings, depending on the compound.
A comparison was made between recommended values and data measured in dwellings during the same exposure time; 95% two-sided confidence intervals (IC95%) of percentages of existing dwellings in France exceeding these values were calculated.
CARBON MONOXIDE About 2%, 2.6%, 4.3% and 6.4% of existing dwellings exceed values fixed by the WHO over 15 minutes (87 ppm), 30 minutes (52 ppm), 1 hour (26 ppm) and 8 hours (9 ppm) respectively. Exceedances are distributed as follows for each room category:
Main rooms (office, open-plan kitchen, bedroom, studio, lounge, living room), n=543:
o 1 dwelling exceeds the reference value over 15 minutes (87 ppm); o 2 dwellings exceed the reference value over 30 minutes (52 ppm); o 9 dwellings exceed the reference value over 1 hour (26 ppm); o 21 dwellings exceed the reference value over 8 hours (9 ppm);
Other rooms (kitchen, bathroom, WC, indoor passageways in the dwelling), n=202:
o 1 dwelling exceeds the reference value over 15 minutes (87 ppm); o 3 dwellings exceed the reference value over 30 minutes (52 ppm); o 8 dwellings exceed the reference value over 1 hour (26 ppm); o 10 dwellings exceed the reference value over 8 hours (9 ppm);
Annexes (cellar, boiler room, utility room, veranda, laundry room, garage communicating with the dwelling), n=157:
o 5 dwellings exceed the reference value over 15 minutes (87 ppm); o 6 dwellings exceed the reference value over 30 minutes (52 ppm); o 8 dwellings exceed the reference value over 1 hour (26 ppm); o 9 dwellings exceed the reference value over 8 hours (9 ppm);

�
�������������� ��������� ����������������� ������������ &����������������� ����������������������������������� �
RADON In France10, radon values between 400 and 1 000 Bq/m3 in buildings open to the public require simple corrective actions. For values greater than 1 000 Bq/m3, compulsory corrective actions must be made. A comparison between the concentrations corrected for seasonal variations and these reference values shows that: * 2 measurements made in bedrooms out of 457 observations (namely IC95% =
[0.1% – 1.5%]) and 4 measurements made in other rooms out of 449 observations (namely IC95% = [0.4% – 2.6%]) are between 400 and 1 000 Bq/m3
* 1 measurement in each of these groups of rooms (namely IC95% = [0% – 1%]) exceeds 1 000 Bq/m3.
VOLATILE ORGANIC COMPOUNDS
A comparison between concentration levels and existing reference values during the same exposure time shows:
* for formaldehyde: a few % up to about a quarter of existing dwellings exceed guide values available in other countries for comparable exposure time steps, namely 50µg/m3 (Canada, Texas) and 30 µg/m3 (European INDEX project, Finland, Hong Kong) respectively. A comparison with the lower range proposed by the European Index project (ALARA (As Low As Reasonably Achievable) principle) shows that a larger percentage could be concerned;
* for styrene: one dwelling out of the 541 observations exceeds the German reference value fixed at 30 µg/m3 (IC95% = [0% – 1.2%]);
* for toluene: one dwelling out of the 541 observations (IC95% = [0% – 0.8%]) and 37 garages communicating with the dwelling out of 139 observations (IC95% = [21.3% – 37.6%]) have an indoor concentration greater than 260 µg/m3 (WHO reference value).
DUST MITE ALLERGENS Half of the dwellings exceed the allergization threshold value of 2 µg/g of dust (IC95% = [45.5% – 56.4%] for Der f 1 and IC95% = [40.5% – 50.9%] for Der p 1). It has been shown that above this threshold value, there is a risk that some persons might produce allergy antibodies (Platts-Mills et al, 199711). The scientific literature shows that exposure to dust mite allergens does not cause any health problem for almost 80% of the population.
&.�;��� ��<=���������>�#�--*0'������<?@7878&.�>�#--*6(��� ���("8.&8&---�
&&�������������� ���� ���� ����� � � � �������������� �������� �� ���� �����������;���������������������
7���������������������������� ��!!"�


�
�������������� ��������� ����������������� ������������ &"���������������� ����������������������������������� �
TTAABBLLEE OOFF CCOONNTTEENNTTSS
��� ���������� �� !��"������ ��#�$% �##��&��'�(�)����������������������������������������������*�
���� ��+�#��&�!� + �$%�##��&����$�, ���,�� ������������������������������������������������������������������������������-�������� #����� ������$��� �� ���������������������������������������������������������������������������������������������������������������� %������%� &���'��� ������ ��������������������������������������������������������������������������������������������������������������� %%�
1.2� COLLECTED DATA������������������������������������������������������������������������������������������������������������������������������-.�1.2.1� Pollution and comfort/confinement parameters ����������������������������������������������������������������������� %(���%�%� #����� �������)��������������������������������������������������������������������������������������������������������������������������� %*�1.2.3� Inquiry protocols ��������������������������������������������������������������������������������������������������������������������������� % �1.2.4� Determining factors for indoor air quality (not presented in this report)������������������������������� %!�1.2.5� Time spent by the occupants in the dwelling (not presented in this report) ������������������������ (����%� � +�����'� ����������)������ ��'�����, ����� ��� ���������-��������������������������������������� (����%�"� �� ����'���� ���� ���./��� ��&0���� ����'��������������������������������������������������������������������� (��
��.� ���! �+��&��"������ ��#�$%�##��&���'�(�)�������������������������������������������������������������������������.����(��� #�'��� � ����� � ������ �������� ��'� �'�� � ������������������������������������������������������������������ (��1.3.2� Analysis laboratories ������������������������������������������������������������������������������������������������������������������� ((�
1.4� QUALITY ASSURANCE OF COLLECTED DATA������������������������������������������������������������������������������������..�1.4.1� Monitoring the validity of collected measurements ����������������������������������������������������������������� (1�
1.4.1.1� Carbon monoxide ############################################################################################################################# 60�1.4.1.2� Carbon dioxide, temperature and relative humidity measured in the bedroom ####################### 60�1.4.1.3� Temperature and relative humidity measured in the living room ############################################### 60�1.4.1.4� Gamma radiation ############################################################################################################################## 60�1.4.1.5� Radon ################################################################################################################################################# 6��1.4.1.6� Dust mite allergens Der f 1 and Der p 1 ######################################################################################## 6��1.4.1.7� Cat allergens Fel d 1 and dog allergens Can f 1 ########################################################################## 6��1.4.1.8� Aldehydes ########################################################################################################################################## 6��1.4.1.9� Volatile Organic Compounds (VOC) ############################################################################################## 6'�1.4.1.10� Concentration by mass of particulate matter suspended in air (PM2.5 and PM10) ################### 6"�
1.4.2� Inter-laboratory tests�������������������������������������������������������������������������������������������������������������������� (2�1.4.2.1� Inter-laboratory test (analytic part) ################################################################################################# 6,�1.4.2.2� Inter-laboratory test (replicas of the dwelling survey) ################################################################## 6-�1.4.2.3� Analysis of aldehyde replicas in the dwelling survey ################################################################### 0.�
1.4.3� Measurement uncertainties �������������������������������������������������������������������������������������������������������� 1��1.4.3.1� Specific guide for evaluation of uncertainties (OQAI / LNE)####################################################### 0.�1.4.3.2� Determination of measurement uncertainties for BTEX and glycol ethers (Douai Ecole des Mines)� 0(�1.4.3.3� Evaluation of the uncertainty on measurement of Radon ########################################################## 06�1.4.3.4� Evaluation of the uncertainty on measurement of dust mite allergens ##################################### 06�1.4.3.5� Evaluation of the uncertainty on measurement of cat and dog allergens ################################# 00�1.4.3.6� Evaluation of the uncertainty on measurements of particulate matter suspended in air PM2.5
and PM10.� 00�1.4.4� Conclusion ������������������������������������������������������������������������������������������������������������������������������������ 11�
-�� ����/'�#��)����!���,"�$% �##��&����������������������������������������������������������������������������������
-��� ( #���#�� �&���,�, +� '�$�������������������������������������������������������������������������������������������������������%����� 3���������� �''����/ ������������������������������������������������������������������������������������������������������������� 1"�2.1.2� Aldehydes ������������������������������������������������������������������������������������������������������������������������������������� *��
2.1.2.1� Acetaldehyde##################################################################################################################################### �.�%���%�%� +'���� ############################################################################################################################################### �(�%���%�(� 4�������)�###################################################################################################################################### �(�2.1.2.4� Hexaldehyde###################################################################################################################################### �6�
2.1.3� Hydrocarbons ������������������������������������������������������������������������������������������������������������������������������� *(�2.1.3.1� Benzene ############################################################################################################################################# �6�2.1.3.2� 1.4-dichlorobenzene ######################################################################################################################### �0�2.1.3.3� Ethylbenzene##################################################################################################################################### �0�2.1.3.4� n-Decane############################################################################################################################################ �0�2.1.3.5� n-Undecane ####################################################################################################################################### ���

�
�������������� ��������� ����������������� ������������ &,���������������� ����������������������������������� �
2.1.3.6� Styrene ############################################################################################################################################### ���2.1.3.7� Tetrachloroethylene########################################################################################################################## ���2.1.3.8� Toluene ############################################################################################################################################## �'�2.1.3.9� Trichloroethylene ############################################################################################################################## �'�2.1.3.10� 1.2.4 – trimethylbenzene ################################################################################################################# �'�%���(���� �5��6)� ########################################################################################################################################### �"�2.1.3.12� o-Xylene ############################################################################################################################################# �"�
2.1.4� Glycol ethers ��������������������������������������������������������������������������������������������������������������������������������� *"�2.1.4.1� 2-butoxyethanol (EGBE, Ethylene Glycol n-Butyl Ether) ############################################################ �"�2.1.4.2� 2-butoxyethylacetate (EGBEA, Ethylene Glycol n-Butyl Ether Acetate) ################################### �"�2.1.4.3� 1-methoxy-2-propanol (2PG1ME, 2-Propylene Glycol 1-Methyl Ether) #################################### �,�2.1.4.4� 1-methoxy-2-propylacetate (2PG1MEA, 2-Propylene Glycol 1-Methyl Ether Acetate) ########## �,�
2.2� CARBON MONOXIDE����������������������������������������������������������������������������������������������������������������������������0�2.2.1� 15-minute exposure ��������������������������������������������������������������������������������������������������������������������� *!�
2.3� CAT AND DOG ALLERGENS�����������������������������������������������������������������������������������������������������������������*�
2.4� DUST MITE ALLERGENS�����������������������������������������������������������������������������������������������������������������������
2.5� PARTICULATE MATTER������������������������������������������������������������������������������������������������������������������������
2.6� RADON�������������������������������������������������������������������������������������������������������������������������������������������������
2.7� GAMMA RADIATION����������������������������������������������������������������������������������������������������������������������������.�
2.8� TEMPERATURE�����������������������������������������������������������������������������������������������������������������������������������.�
2.9� RELATIVE HUMIDITY�����������������������������������������������������������������������������������������������������������������������������
2.10� CARBON DIOXIDE���������������������������������������������������������������������������������������������������������������������������������
.�� , �,#'�� �����������������������������������������������������������������������������������������������������������������������������������
��� �,�� ���� ���,�� ��������������������������������������������������������������������������������������������������������������������
APPENDICES�������������������������������������������������������������������������������������������������������������������������������������������������������
�

�
�������������� ��������� ����������������� ������������ &-���������������� ����������������������������������� �
Introduction The purpose of this report is to present a report on air quality in French dwellings produced from data collected within the framework of the national Dwellings survey led by the OQAI between October 1 2003 and December 21 2005. The first part of the document presents the national survey; sampling and correction, collected data, implementation and quality assurance. The indoor air quality inventory is then presented, including characteristic values of the presence of each pollutant in the different spaces particularly median concentrations, the main percentiles and maximum concentrations, for comfort / confinement parameters measured in dwellings. Pollutant levels measured are also compared with data in the literature (exposure levels and reference values).
�� ���������� �� !��"������ ��#�$% �##��&��'�(�)�
The national dwelling survey was carried out from October 1 2003 to December 21 2005 on a sample of 710 occupied main residences (RP) designed to be representative of 24 672 135 main residences in mainland France (Source file FILOCOM 2002– File of dwellings by Commune). Its objectives were to: - create a report on indoor air quality in dwellings, taking account of the
variability of situations, � provide useful data for estimating the exposure of populations occupying these
living areas and quantification and hierarchisation of health risks associated with air pollution in dwellings,
� produce a first conclusion about items controlling indoor air quality, � give guidance for improvements to indoor air quality in dwellings: production
of indoor air quality indexes, variation of technical coding and regulation in dwellings, production of recommendation and training guides for owners and dwelling managers, recommendations on products and materials used in dwellings, etc.
This is an essentially descriptive study and its purpose is to identify risk situations (high concentration of contaminants or frequently measured contaminants, database available for evaluation of health risks) or lines of study (sources of contamination or risk behaviours), starting from which action priorities could be formulated. It also provides a means of describing a reference level for exposure of the general population to air pollution in dwellings, that can be used directly to compare isolated specific situations.

�
�������������� ��������� ����������������� ������������ (.���������������� ����������������������������������� �
��� ��+�#��&�!� + �$% �##��&����$�, ���,�� ���
����� ����1��2�3�����4 11��2��
The large number of measured pollutants, the poor knowledge of expected concentrations and the large variability of housing conditions and households, have made it necessary to select inquiry locations using a random method for objectively drawing inquiry units everywhere in mainland France.
A three degree survey was made, such that each main residence has the same final probability of being drawn at random:
1) random draw of communes in proportion to the number of main residences in
them, communes with more than 100 000 main residences (Paris, Marseille, Lyon, Toulouse, Nice, Nantes, Strasburg, Montpellier, Bordeaux, Rennes, Lille) being selected with certainty (the data collection base used was the FILOCOM 2002 file – File of dwellings by commune);
2) random draw of land registry sections (in communes drawn at random in the
previous step) in proportion to their number of main residences; 3) random draw of a main residence by land registry section (data collection base:
General Tax Directorate Rates File for main and secondary residences). For about ten communes, the final step was done in the town hall by investigators from the CREDOC (Research Centre for Study and Observation of Living Conditions), using land registry maps.
One advantage of the method used is that it concentrates dwellings on which inquiries are to be made to geographic sectors (communes and land registry sections), rationalising travel costs and so that a simple random sample of households can be created in a particular land registry section. As a result of the number of refusals observed, an additional sample of dwellings based on the initial protocol was used in some land registry sections. Households were thus recruited based on 6268 addresses drawn at random, 4165 households were contacted, 811 gave their agreement to participate representing an acceptance ratio of 19.5%, and 567 participated in the national survey representing a participation ratio of 13.6%. The final sample is composed of 567 dwellings investigated between October 1 2003 and December 21 2005, distributed in 74 communes, 50 departments and 19 regions (see Appendix 1). The geographic distribution of investigated main residences is presented in the following maps, making a distinction between dwellings included in the inquiry between October and April (370 main residences namely 65.3% of the sample) and dwellings included in the inquiry between May and September (197 main residences namely 34.7%). The inquiries are distributed in time as shown in the following diagram (Figure 3).

�
�������������� ��������� ����������������� ������������ (&���������������� ����������������������������������� �
�
����������7�������'������8/��� ���$��� ��� '�/��� ��� ./��)� �� ���� ���/��)
�
�
���������7�������'������8/��� ���$��� ��� '�/��� ��� ./��)9���������������
���� �

�
�������������� ��������� ����������������� ������������ ((���������������� ����������������������������������� �
�
Distribution in time of dwellings included in the inquiry�
0�4�8�
12�16�20�24�28�32�36�40�44�48�
Oct
03�
Nov
03�
Dec
03�
Jan
04�
Feb
04�
Mar
04�
Apr
04�
May
04�
June
04Ju
ly 0
4�A
ug 0
4�S
ept 0
4�O
ct 0
4�N
ov 0
4�D
ec 0
4�Ja
n 05�
Feb
05�
Mar
05�
Apr
05�
May
05�
June
05�
July
05�
Aug
05�
Sep
t 05�
Oct
05�
Nov
05�
Dec
05�
Num
ber
of d
wel
lings
inve
stig
ated
�
����������:�����8/��� ���$��� ������'��� ������� ./��)�
����- ,��� ����������5 �3���1�����1 �
A correction to the final sample was made so that it can be representative of all main residences in mainland France. This consisted of creating distributions of known variables on all main residences by weighting (as a number of main residences).
The correction variables are: � the dwelling type (detached house, dwelling in an apartment building, home
for elderly persons, farm or agricultural enterprise, dwelling in a building other than a residence);
� the construction period (before 1871. 1871-1914. 1915-1948. 1949-1961. 1962-1967. 1968-1974. 1975-1981. 1982-1989. 1990-1995. starting from 1996);
� the dwelling occupancy status (owner, tenant, leaser or sharecropper, free housing);
� the commune sampling region (Paris region, Paris basin, North-Pas de Calais, East, West, South-West, Centre-East, Mediterranean);
� the urban unit size range (rural commune; urban unit with fewer than 5 000 inhabitants, from 5 000 to 9 999 inhabitants, from 10 000 to 19 999 inhabitants, from 20 000 to 49 999 inhabitants, from 50 000 to 199 999 inhabitants, from 200 000 to 1 999 999 inhabitants, Paris urban unit);
� the winter weather zone; � the summer comfort zone.
Margins are defined from two sources (FILOCOM 2002 and the 2001-2002 Dwelling inquiry) using correction variables.
The correction was made using the CALMAR method12. This provides a means of starting from the initial weighting of main residences included in the inquiry, and &(�=� �����#�%&--6)A��$���7�2B�3���������7����� ���� ����������������+������� ���������!��>=//!���� ������� �>�#�
4!(���������������A�� �A88���#�����#��8��8���C���C�� 8� ���C� � 8������8���C���#� ���

�
�������������� ��������� ����������������� ������������ (6���������������� ����������������������������������� �
estimating the new weights to achieve target margins while minimising the difference between the final weights and the initial weights. The selected fixing option is the truncated logit method that has several advantages:
� final weights are always positive, � the ratio of the final weight to the initial weight is bounded by lower and upper
limits.
The initial weight is the inverse of the genuine probability of being included in the sample, deduced from the initial draw probability and the response rate in the sampling stratum.
The sum of the initial weights is equal to 24 672 135 main residences. The final weight to initial weight ratio is between 0.3 and 2.5.
The sum of the final weights obtained is equal to the sum of the initial weights. The final margins of the sample weighted on the correction variables are perfectly equal to the margins calculated on the total population of the main residences.
1.2 COLLECTED DATA
Data collected for the purposes of this survey (see Appendix 2) were chosen so as to acquire the most exhaustive possible information on: - selected contaminants (chemical, physical and microbiological)
- comfort / confinement parameters (temperature, relative humidity, carbon dioxide, extracted air flow),
- potential contamination determinants: information about emission sources and situations so as to search for behavioural or environmental risk factors (tobacco, occupant activities, construction and decoration products, equipment etc.) causing pollution and setting up lines of action for prevention and reduction of sanitary risks.
- time spent by the occupants: collection of time spent by occupants in the different rooms in the dwelling and their activities. These data, associated with concentrations of the monitored contaminants, can give an estimate of the exposure of occupants to pollution.
A collection of data on allergic and respiratory health indicators was also made in the context of a related study carried out by the INSERM.
Finally, a compilation of elements making a "carbon monoxide" diagnostic necessary was carried out immediately on entry into the dwelling to prevent risks of acute intoxication related to carbon monoxide.
1.2.1 Pollution and comfort/confinement parameters
Simultaneous combinations of different pollution parameters provide an opportunity to study the variation of contaminants relative to each other and give clues about their synergies that could potentially cause health problems not yet solved. Data are collected from the environment but also from households (alveolar air) for carbon

�
�������������� ��������� ����������������� ������������ (0���������������� ����������������������������������� �
monoxide. "Contaminants" were chosen from pollutant hierarchisation work13 drawn up solely on health considerations and based on the results of the pilot survey and the best toxicological information at the time. The hierarchisation index is composed of three sub-indexes, namely the acute toxicity index, the chronic toxicity index and the indoor frequency index. The score increases as the impact on health increases and with increasing frequency at which the pollutant is found in indoor air.
Comfort/confinement parameters were measured in addition to indoor air quality parameters so as to give additional information about ventilation conditions and pollution factors (e.g. humidity related to the presence of mould). These data also correct some samples sensitive to variations of these parameters (temperature and relative humidity).
The following parameters were measured in the context of the national dwellings survey:
• volatile organic compounds (VOC): Aromatic hydrocarbons: benzene, toluene, m/p-xylenes, o-xylene, 1.2.4-trimethylbenzene,
ethylbenzene, styrene, Aliphatic hydrocarbons: n-decane, n-undecane Halogenated
hydrocarbons: trichloroethylene, tetrachloroethylene, 1.4-dichlorobenzene
Glycol ethers: 2PG1ME (1-methoxy-2-propanol ) and its acetate, EGBE (2-butoxyethanol) and its acetate
Aldehydes: formaldehyde, acetaldehyde, hexaldehyde, acrolein
• carbon monoxide (CO): in the environment and in alveolar air (occupant � 6 years)
• radon and gamma radiation
• allergens: cat allergens (Fel d1) and dog allergens (Can f1) in air and dust mite allergens (Der p1. Der f1) in mattress dust
• inert particulate matter: PM10 and PM 2.5
• carbon dioxide (CO2)
• temperature and relative humidity
• extracted air flows: in dwellings equipped with specific ventilation ducts
13 Luc Mosqueron, Vincent Nedellec, Health hierarchisation of parameters measured in buildings by the indoor air quality Observatory, DDD/SB-2002-46 report, December 2002.
Luc Mosqueron, Vincent Nedellec, Update the health hierarchisation of parameters of interest at the indoor air quality observatory: Application to phthalates, chlorinated short chain paraffins, organo-tins, alkyl phenols and bromated flame retarders", report DDD/SB-2004-046, October 2004.

�
�������������� ��������� ����������������� ������������ (����������������� ����������������������������������� �
��-�- ����1��2������ 2��
A one-week long inquiry was made for each dwelling. Parameters were measured indoors in dwellings and also in communicating garages (VOC apart from aldehydes) and outdoors (CO, VOC and aldehydes) (Figure 4). Data collection locations were chosen by making a compromise between scientific objectives (data collection in the most frequently used locations or as a function of pollutant emission sources), feasibility constraints (particularly acoustic nuisance and size of instruments) and cost constraints (for example limitation of VOC data collections to a single indoor point). �
Figure 4: Summary of samples taken by room and by dwelling type,
example of a 4-room dwelling with a communicating garage
Most samples that do not introduce any acoustic nuisance problems (VOC, radon, CO2. temperature [T], relative humidity [RH] and dust mite allergens) are taken from the parents bedroom that represents the longest exposure time in dwellings and is chosen instead of the children bedroom for safety reasons. The living room is used for the noisiest samples (particulate matter, cat and dog allergens) and radon, gamma radiation, temperature and relative humidity measurements. If the garage is adjacent to the dwelling, then VOC samples will be taken from it. CO and VOC samples are taken outdoors. Carbon monoxide is systematically measured in the living room and in all rooms in which there is any combustion equipment, depending on emission sources. Extracted air flows are measured at all air extraction openings of natural ventilation systems through ducts or Central Forced Ventilation (VMC) systems.
�
�������������� ��������� ����������������� ������������ ('���������������� ����������������������������������� �
1.2.3 Inquiry protocols
All parameters are measured during the week of inquiry (except for isolated samples), using time steps specific to the data collection and analysis constraints, except for radon for which the dosimeter is left for 2 months.
Air is sampled at 1.50 m above the floor (height at which a standing person breathes) in the living room and 0.50 m above the floor (height at which a person lying in bed breathes) in the bedroom.
The different data collection and analysis protocols are presented for each measured parameter. Appendix 3 contains a summary table.
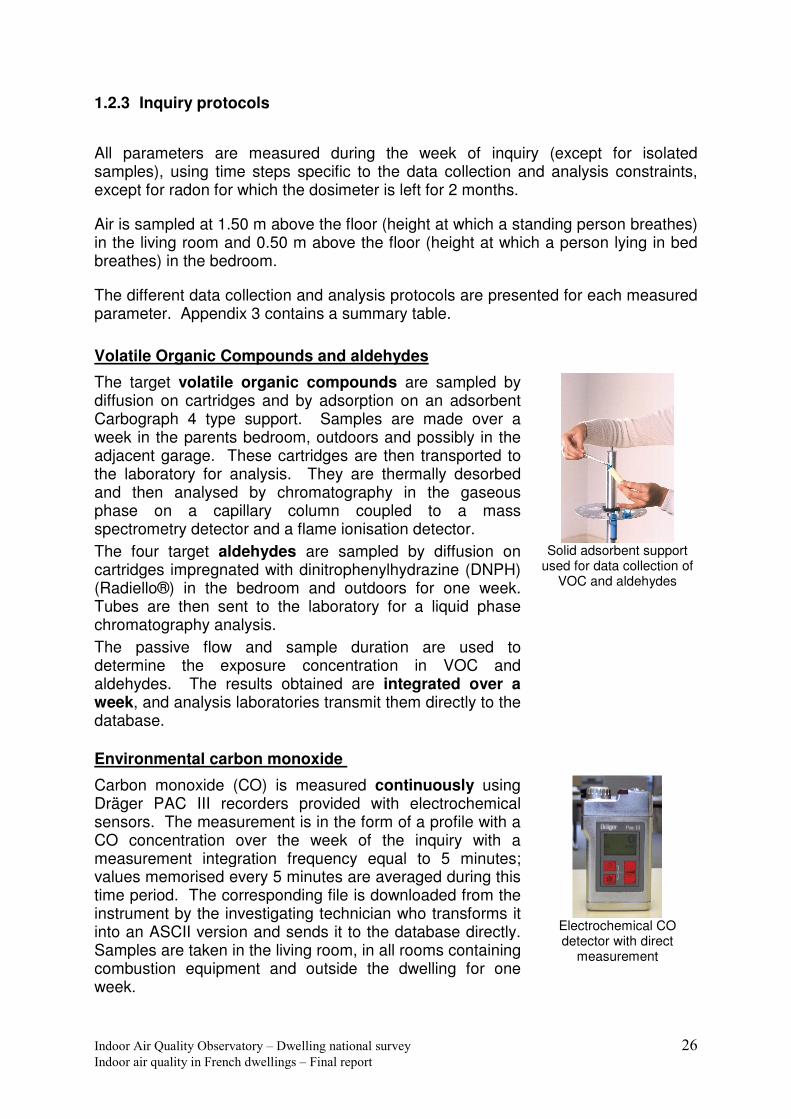
Volatile Organic Compounds and aldehydes
The target volatile organic compounds are sampled by diffusion on cartridges and by adsorption on an adsorbent Carbograph 4 type support. Samples are made over a week in the parents bedroom, outdoors and possibly in the adjacent garage. These cartridges are then transported to the laboratory for analysis. They are thermally desorbed and then analysed by chromatography in the gaseous phase on a capillary column coupled to a mass spectrometry detector and a flame ionisation detector. The four target aldehydes are sampled by diffusion on cartridges impregnated with dinitrophenylhydrazine (DNPH) (Radiello®) in the bedroom and outdoors for one week. Tubes are then sent to the laboratory for a liquid phase chromatography analysis. The passive flow and sample duration are used to determine the exposure concentration in VOC and aldehydes. The results obtained are integrated over a week, and analysis laboratories transmit them directly to the database.
Solid adsorbent support
used for data collection of VOC and aldehydes
Environmental carbon monoxide
Carbon monoxide (CO) is measured continuously using Dräger PAC III recorders provided with electrochemical sensors. The measurement is in the form of a profile with a CO concentration over the week of the inquiry with a measurement integration frequency equal to 5 minutes; values memorised every 5 minutes are averaged during this time period. The corresponding file is downloaded from the instrument by the investigating technician who transforms it into an ASCII version and sends it to the database directly. Samples are taken in the living room, in all rooms containing combustion equipment and outside the dwelling for one week.
Electrochemical CO detector with direct
measurement

�
�������������� ��������� ����������������� ������������ ("���������������� ����������������������������������� �
Expired carbon monoxide
CO in alveolar air is measured for all occupants 6 years old or more living in the dwelling included in the inquiry and present at the time that the investigator passes (first and/or last day of taking samples) provided that they have given their informed consent. The measurement is made using a CO-TESTER instrument (model NG) made by FIM Medical, and is instantaneous.
Measurement of carbon
monoxide in expired alveolar air
Radon
The activity of radon per unit volume is measured from the accumulation of alpha radiation traces originating from radon and its descendants on a film made of 12 µm thick cellulose nitrate (Kodalpha dosimeters). Two dosimeters opened by the investigating technician are exposed for 2 months in the chamber chosen for the CO2 measurement and in the living room. The occupant closes the dosimeters and sends them to the OQAI secretariat, which in turn forwards them to the laboratory responsible for the analyses. After treatment in the laboratory, each alpha particle impact leaves a microscopic hole in the film. The number of impacts and the duration of the sample can be used to deduce the concentration of radon in the air. A correction factor is applied to take account of seasonal variations in the concentration of radon14. Raw and corrected data are then transferred to the OQAI database.
Open dosimeter
Gamma radiation
The external dose rate of gamma radiation from cosmic or telluric origin is obtained by a Geiger-Müller Saphymo 6150 AD6 type radiation meter; this radiation meter is a so-called "active" detector that will not measure gamma radiation until after it has been switched on. The measurement is made over at least 45 minutes in the living room in which the radon dosimeter was placed (living room). The investigating technician enters the value obtained and another associated value representing the measurement precision, directly on the electronic agenda.
Gamma radiation meter
&0�D�������@#!�D������=#!�2�������#!�3������#�E�$���������B#!�=�������������� ������� ���������� ��� �����������+���������
�������������������!��������� ����'��� :������)!�(..6#�F��#�&.0!�>�#6#���#�(0�*(�(#�
�
�������������� ��������� ����������������� ������������ (,���������������� ����������������������������������� �
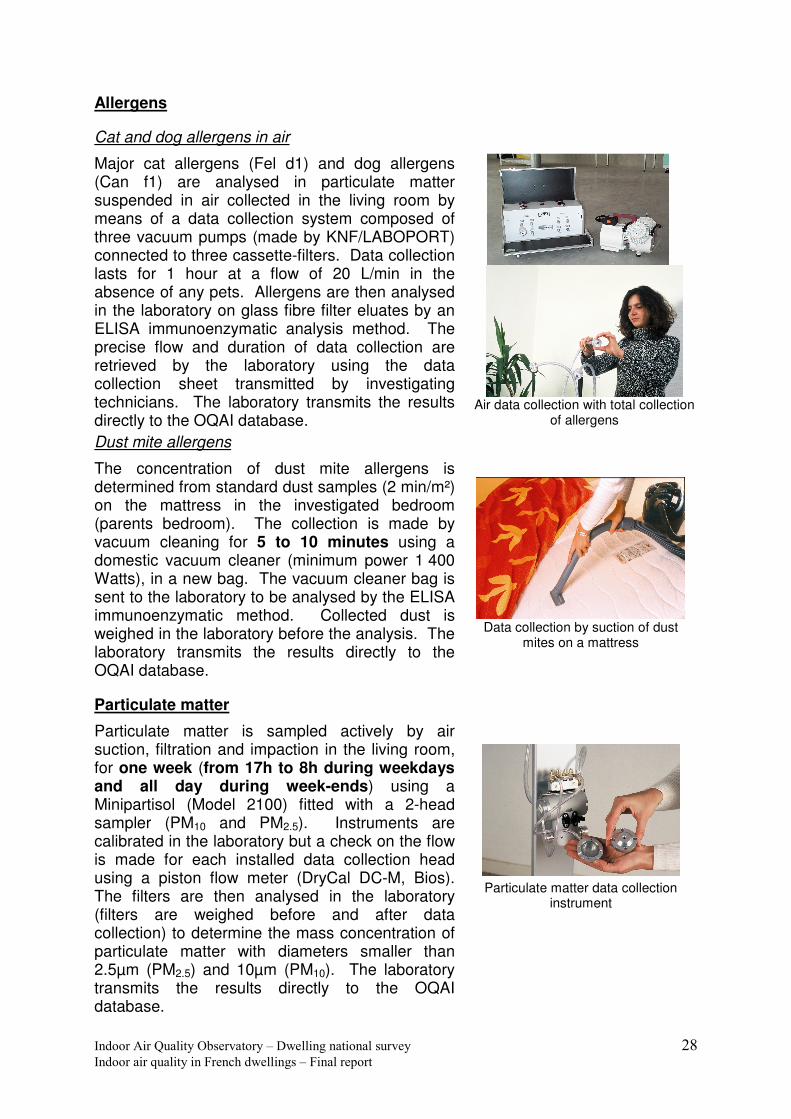
Allergens
Cat and dog allergens in air
Major cat allergens (Fel d1) and dog allergens (Can f1) are analysed in particulate matter suspended in air collected in the living room by means of a data collection system composed of three vacuum pumps (made by KNF/LABOPORT) connected to three cassette-filters. Data collection lasts for 1 hour at a flow of 20 L/min in the absence of any pets. Allergens are then analysed in the laboratory on glass fibre filter eluates by an ELISA immunoenzymatic analysis method. The precise flow and duration of data collection are retrieved by the laboratory using the data collection sheet transmitted by investigating technicians. The laboratory transmits the results directly to the OQAI database.
Air data collection with total collection
of allergens Dust mite allergens
The concentration of dust mite allergens is determined from standard dust samples (2 min/m²) on the mattress in the investigated bedroom (parents bedroom). The collection is made by vacuum cleaning for 5 to 10 minutes using a domestic vacuum cleaner (minimum power 1 400 Watts), in a new bag. The vacuum cleaner bag is sent to the laboratory to be analysed by the ELISA immunoenzymatic method. Collected dust is weighed in the laboratory before the analysis. The laboratory transmits the results directly to the OQAI database.
Data collection by suction of dust
mites on a mattress
Particulate matter
Particulate matter is sampled actively by air suction, filtration and impaction in the living room, for one week (from 17h to 8h during weekdays and all day during week-ends) using a Minipartisol (Model 2100) fitted with a 2-head sampler (PM10 and PM2.5). Instruments are calibrated in the laboratory but a check on the flow is made for each installed data collection head using a piston flow meter (DryCal DC-M, Bios). The filters are then analysed in the laboratory (filters are weighed before and after data collection) to determine the mass concentration of particulate matter with diameters smaller than 2.5µm (PM2.5) and 10µm (PM10). The laboratory transmits the results directly to the OQAI database.
Particulate matter data collection
instrument

�
�������������� ��������� ����������������� ������������ (-���������������� ����������������������������������� �
�
Temperature, relative humidity and carbon dioxide
The temperature, relative humidity and carbon dioxide in the parents bedroom are measured by a Q-Track probe (infrared detector non-dispersive for CO2; electronic thermometer; electronic hygrometer). The probe is coupled to a recorder. The measurements are made with a time step of 10 minutes during a week. The results file is downloaded by the investigating technician who transforms it into an ASCII version and sends it directly to the database.
Temperature and relative humidity measurements are made in the living room using an Hygrolog recorder (Rotronic). The measurement is in the form of a temperature and relative humidity profile during the week of the inquiry with a time step of 10 minutes for one week. The results file is downloaded from the equipment by the investigating technician who transforms it into an ASCII version and sends it directly to the database.
Temperature, relative humidity
and carbon dioxide measurement instrument
(Q-Track)
Extracted air flow
The extracted air flow is measured instantaneously at every extraction opening of natural ventilation systems through ducts or controlled forced ventilation systems of wet rooms in the dwelling (kitchen, bathroom, shower, toilets). The measurement principle is a hot-wire grid covering the entire opening of the instrument cone (instrument made by SWEMAFLOW).
Measurement of the extracted air flow at extraction openings
1.2.4 Determining factors for indoor air quality (not presented in this report)
In addition to air quality parameters, information derived from emission sources was collected using inquiry questionnaires to confirm, identify or estimate the proportion of the different risk factors: behavioural (occupant activities, smoking, etc.) or environmental (construction and decoration products, equipment, etc.).

�
�������������� ��������� ����������������� ������������ 6.���������������� ����������������������������������� �
Namely: - Information about the dwelling: location and physical characteristics of the
dwelling (proximity of external pollution sources, type and year of construction, number of floors), internal description of the dwelling (size and description of living rooms and annexes, presence of a garage communicating with the dwelling, characteristics of ventilation, heating and cooking systems, sanitary equipment, aeration/ventilation, renovation works, etc.), types of coverings (floors, walls, ceilings), types of doors and windows, equipment (household appliances, wood furniture, carpets, curtains, bedding), global quality of the environment (presence of humidity, potential sources of external pollution), etc.
- information about the household: composition of the household (number of persons, educational level, profession, etc.), times spent by the household in the dwelling and household occupancy status (tenant, owner), existing occupation (place, working hours and periods), net resources of the household, etc.
- household activities: smoking behaviour of each occupant, household activities, use of cosmetics, cleaning products, pesticides or insecticides, treatment of household waste, presence of animals, presence of indoor plants, etc.
- perception of the global quality of the dwelling by the households: feeling of the occupants.
1.2.5 Time spent by the occupants in the dwelling (not presented in this report)
The time that each person in the household spends in the different rooms of the dwelling was collected during a time step of 10 minutes every day of the week of the inquiry. Data about the occupation of the occupants as a function of the location, the number of persons present, the products used and the presence of smokers were collected for all occupants of the dwellings during the same time step, one day during the week.
��-� �11 �2�������� ����������5 �1�5������������6������ � �� ������5���� ����7�
�� ������������������������� �������� �������� ��������������� ����� ���� ����������� ������
���� ���� ������������ ���� ����>=/3B!������������������� ����������������� ����&��������
���#�
��-� �� ���3���������3� 1 � ����� 8�����2���, ����2�������
A procedure for identification of elements suggesting a CO diagnostic was produced before the inquiry was started, to notify the services concerned (CAP, DDASS, InVS) about cases of potential risks of carbon monoxide intoxication. When they first enter the dwelling, investigating technicians make measurements and fill in a first questionnaire on "major risks", and then fill in a second more detailed questionnaire on "long term risks" during the second visit.

�
�������������� ��������� ����������������� ������������ 6&���������������� ����������������������������������� �
��. ���! �+��&��"������ ��#�$% �##��&���'�(�)��
��.�� � 1 �����������������2��3��5 ���9 ���2����2�� �5���������
The team responsible for carrying out inquiries on sites and technical and logistic coordination was selected from a national call for bids based on a specification defining the missions in detail. Work done by investigating technicians on sites took place after preliminary training provided by CSTB.
Six training sessions were organised in CSTB’s premises in Champs-sur-Marne in 2003 and 2004, and 49 investigating technicians were trained during these sessions. Two types of training were organised, namely "basic" training for persons who will carry out or supervise the inquiries, and "accelerated" training for persons who will reinforce the teams trained during the "basic" sessions. "Basic" training courses carried out by experts in the OQAI scientific network (LCPP, InVS, IRSN, etc.) were organised during 4 or even 5 days during which the entire inquiry protocol was discussed theoretically and practically. Each training session was terminated by making a genuine simulated inquiry and sending data to the database. A debriefing and an evaluation summary of the participants identified any weaknesses in each team, and outstanding points to be studied in detail. An exchange with experienced investigating technicians took place during the final two sessions. "Accelerated" training courses only lasted three days and concentrated on taking samples and collecting descriptive information by questionnaire. One or two additional days were then dedicated locally to teams who wanted them. These complementary training courses provided by two members of CSTB were used firstly to review the inquiry protocol and operation of measurement instruments, and secondly to make a "dry run" inquiry before the real inquiries. Fourteen additional training courses were thus organised.
The teams of the investigating technicians were distributed as follows in 12 geographic sectors (see Figure 5) to make a number of inquiries (Table 1):
• Rhône-Alpes sector: APPA Dauphiné Savoie Committee, Grenoble CSTB, Acoustb
• PACA sector: APPA Marseille Provence Committee, Sophia-Antipolis CSTB • East sector: ASPA • Centre-South sector: Auvergne ATMO • North-Pas-de-Calais sector: CDHR • Pays de Loire– Brittany sector: Nantes CSTB • Normandy sector: Calvados PACT • South-West sector: Midi Pyrénées Public Health Network • Centre-North sector: Cher PACT • Paris sector: LHVP • Paris Region sector: Champs-sur-Marne CSTB • Greater Paris Region sector: Paris PACT, Socotec 10. Socotec 75. Socotec 92

�
�������������� ��������� ����������������� ������������ 6(���������������� ����������������������������������� �
����������7�������'$����'����
���� �������� ��'� �'�� �� �� ���� ���/��)
Work area Number of
investigated dwellings
PACA 27
South-West 78
Pays de Loire / Brittany 72
Greater Paris region 82
North 58
Rhône-Alpes 69
Normandy 29
Alsace 19
Centre South 28
Centre North 46
Paris Region 29
Paris 30 TOTAL 567
���������/�8����$��� ��� � ./��)8)�'��� ���

�
�������������� ��������� ����������������� ������������ 66���������������� ����������������������������������� �
1.3.2 Analysis laboratories
Laboratories were chosen from a restricted call for bids with members of workgroups who participated in preparation of the data collection, sampling and analysis protocols. The selection was made with the aim of satisfying technical and scientific criteria in this specification and proposed costs. Thus, five laboratories were selected (Table 2) and made responsible for all analyses of a particular pollutant, for all surveys except for VOCs. The number of VOC analyses to be made required two different laboratories (the CSTB POLLEM laboratory and the Fondazione Salvatore Maugeri). This led to carrying out inter-laboratory tests to assure quality of the results obtained.
Pollutant Analysis laboratory
Aldehydes POLLEM laboratory at the Champs sur Marne CSTB
Allergens (dogs, cats, dust mites) Pneumology Department Allergology Laboratory
Strasbourg University Hospitals
POLLEM laboratory at Champs sur Marne CSTB Volatile organic compounds
Foundation Salvatore Maugeri (FSM) in Padoue (Italy)
Particulate matter (PM10 / PM2.5) City of Paris Health Laboratory (LHVP)
Radon Lognes DOSIRAD Laboratory
Table 2: Analysis laboratories for different pollutant types
For radon, occupants sent radon badges to the OQAI after two months of exposure, and the OQAI forwarded them to the Dosirad laboratory. Raw data were transmitted to the INRS to be corrected and validated before being included in the OQAI database. Carbon monoxide (CO) and carbon dioxide (CO2) measurements, and temperature and humidity measurements were processed directly from a computer storage medium and no laboratory was involved in this processing.
1.4 QUALITY ASSURANCE OF COLLECTED DATA
Quality of collected data is crucial to determine exposure of the population correctly. It is essential to assure that subsequent use of data will supply useful results and that their interpretation is no limited to a simple observation that they are not relevant or not valid. In general, the quality check is made before, during and after each measurement; setting up sampling protocols, choice of measurement instruments, training of investigating technicians, analyses, storage and sending data by the laboratories. It also contributes to management of the database, to determine any inconsistencies and errors.
�
�������������� ��������� ����������������� ������������ 60���������������� ����������������������������������� �
1.4.1 Monitoring the validity of collected measurements
A quality code was associated with each data collection and each analysis of a pollutant measured in dwellings. This code is used to validate or invalidate data obtained before they are used statistically. The investigating technician fills it in for all aspects concerning data collection (including downloading data) and filling in questionnaires. The laboratory fills it in for all samples for which an analysis is necessary. An analysis of the distribution of quality codes can identify error sources associated with each pollutant measurement.
1.4.1.1 Carbon monoxide The carbon monoxide record is valid 92.7% of the time (1 414 out of 1 525 records). The main source of invalidation (1.3% namely 20 records) is that it is impossible to make a data collection, particularly when outdoor access from the dwellings in the inquiry is impossible. The instrument itself is in question in 1.2% of cases (19 records), which usually results in an alarm bell requiring a corrective action by the occupant or due to the presence of aberrant data.
1.4.1.2 Carbon dioxide, temperature and relative humidity measured in the bedroom Carbon dioxide, temperature and relative humidity records in bedrooms are valid 89.4% of the time (507 out of 567 records). The main source of invalidation (3.9% namely 22 records) is that exposure time is less than the set value (less than 5 days of records), either because the inquiry was cut short or because the instrument stopped before the end of the inquiry (power failure). The second error source is due to a failure of the data collection instrument.
1.4.1.3 Temperature and relative humidity measured in the living room Temperatures and relative humidity recorded in the living room are valid 96.2% of the time (531 out of 552 records). The main two invalidation sources are exposure times less than the set value and a defective instrument problem (5 and 3 cases respectively). The difference between the total number of records (552) and the final number of dwellings in the inquiry (567) corresponds to measurements that were not made or for which no quality code was indicated.
1.4.1.4 Gamma radiation Data collections are valid in 91.4% of cases. The main sources of invalidation are related to failure to respect the protocol or insufficient exposure time for which the limiting precision of 10% was not reached.

�
�������������� ��������� ����������������� ������������ 6����������������� ����������������������������������� �
1.4.1.5 Radon Results are corrected by a correction factor to take account of seasonal variations in the radon concentration15. Data are validated by the IRSN, and the quality code procedure set up by the OQAI is not followed. All measurements are still being validated by the IRSN and are not yet fully available in the OQAI database. A total of 957 measurements were made by the end of July 2006, including 19 missing values and 8 confirmation measurements.
1.4.1.6 Dust mite allergens Der f 1 and Der p 1 Data collections of dust mite allergens on the mattress were made successfully with an average of 96.7% of valid data (549 out of 567 records). The main source of data invalidity is a failure to make the data collection due to the occupant's refusal in 12 cases (2.1%). However, this remains marginal considering the number of valid collections made. An analysis of the two major dust mite allergens (Der p 1 and Der f 1) on dust samples (in vacuum cleaner bags) by the laboratory (Strasbourg University Hospital) is valid 77.1% of the time (n = 876 out of 1136 samples, 2 analyses per sample). Almost 20% of analyses are not valid because of samples that cannot be interpreted (collected dust quantity insufficient to make the measurement). Therefore the analysis, that requires a sufficient quantity of dust, is the limiting factor in the validity of dust mite allergen measurements.
1.4.1.7 Cat allergens Fel d 1 and dog allergens Can f 1 Data collections of cat and dog allergens in air were taken successfully with an average of 92.4% of data being valid (1 566 out of 1 694 collections, 3 measurements per dwelling). The main source of data invalidity (2.8% namely 48 measurements) is that the collection flow is less than the set value that reduces the dust quantity collected on filter cassettes and therefore the sensitivity of the analysis. These measurements were not taken into account because they would divert the distribution close to detection and quantification limits. However, the flow in 94% of cases is between 19 and 21 L/min which is very satisfactory compared with the nominal flow of 20 L/min (uncertainty ± 1%). The second source of data invalidity (2.4% namely 40 measurements) represents another protocol condition not being respected (for example the presence of animals in the measurement room, etc.). The analysis of cat and dog allergens in filter cassettes is valid 96.5% of the time (3 282 out of 3 402 measurements). The main source of invalidation remains failure to respect the data collection protocol in 24 cases (namely 8 dwellings), and particularly the presence of pets in the instrumented room.
1.4.1.8 Aldehydes Data collection 1 244 out of 1 301 collections made have a valid quality code (95.6%). The main source of invalidation is that it is impossible to make the collection, particularly &��D�������@#!�D������=#!�2�������#!�3������#�E�$���������B#!�=�������������� ������� ���������� ��� �����������+���������
�������������������!��������� ����'��� :������)!�(..6#�F��#�&.0!�>�#6#���#(0�*(�(#�

�
�������������� ��������� ����������������� ������������ 6'���������������� ����������������������������������� �
outside the dwelling (24 samples, namely about 1.8%). This source of invalidation may be due solely to the decision made by investigating technicians, or simply because it is physically impossible to set up a data collection. The second source of invalidation of data collection (8 cases, namely 0.6%) highlights human error in mixing up diffusing bodies (confusion between aldehydes and VOC). Analysis Concerning the analysis of aldehydes, the percentage of data validated by the POLLEM laboratory represents 79.2% (namely 3 544 data or 886 analyses out of 4 472 data or 1 118 analyses). The main two sources of invalidation are related to a failure to respect the protocol: sample analysed beyond the limiting time for 412 cases, namely 103 analyses (9.2%), or storage temperature not respected for 204 cases, namely 51 analyses (4.6%). Therefore, the quantity of aldehyde data with invalid quality codes is not negligible. The workgroup decided to maintain some quality codes, particularly codes related to non-respect of the storage temperature and samples analysed beyond the limiting time, so as to determine the extent to which these data can be used later. Tests were used to demonstrate that the impact of these two factors results in an underestimate of measured concentrations of formaldehyde and hexaldehyde. Thus, seventy-five dwellings were used in the national distribution, although this causes a slight bias in the estimates. However, the order of magnitude of these concentrations remained the same as the real concentrations. Control cartridges were placed in the field to take account of the effect related to manipulation and transport. Most values remain below the corresponding quantification limits (LQ) and consequently their interference remains negligible.
1.4.1.9 Volatile Organic Compounds (VOC) Data collection 1 533 out of 1 588 collections made were considered to be valid (96.5%). As for the aldehyde collections that were similar in nature, the main source of invalidation is that it was impossible to make the collection, particularly outside the dwelling (24 collections, namely about 1.5%). The second source of invalidation is collections not being made, mostly for outdoor collections (8 cases or 0.5%) or if the protocol is not respected. Analysis Two laboratories made the analysis for volatile organic compounds, firstly the CSTB POLLEM laboratory and secondly the Italian Fondazione Salvatore Maugeri (FSM) laboratory. The analysis was valid in 52.9% of all cases (namely 10 751 out of 20 336 analyses made). This percentage is determined for all data in each target. Normally, analysis of a valid sample will result in 16 valid data. However, different quality codes may be assigned for a particular analysis depending on which compound is coeluated, outside the range, etc. The main source of invalid data is failure to respect the protocol (analysed sample outside the limiting time). This represents 19.4% of data. This observation may be

�
�������������� ��������� ����������������� ������������ 6"���������������� ����������������������������������� �
explained by different factors; failure to send data by investigating technicians, the time to transport collected data to the laboratory (national and international transport) and storage time in the laboratory longer than the time defined in the protocol. The second source of invalidity is approximation of the concentration (measured value outside the range of the initial calibration straight line), usually observed for high concentrations. This code is used 12.2% of the time. Therefore, VOC data with invalid quality codes represent a non-negligible quantity. The workgroup decided to maintain some quality codes, particularly codes related to non-respect of the storage time and the influence of the storage temperature after data collection, so as to determine the extent to which these data can be used later. Tests showed that the storage time has a significant influence on measured concentrations but remains minimal compared with concentrations observed in dwellings. Furthermore, the storage temperature apparently does not affect the measurements. Control cartridges were placed in the field to take account of the effect related to manipulation and transport. Most values remain below the corresponding quantification limits and consequently their interference remains negligible. Only 1.2.4-trimethylbenzene, 1.4-dichlorobenzene and decane have average values greater than the quantification limit on control cartridges. Therefore, lower concentrations of these compounds are slightly overestimated.
1.4.1.10 Concentration by mass of particulate matter suspended in air (PM2.5 and PM10) Data collection 606 out of 1 139 samples (PM2.5 and PM10) (namely about 53%) have a valid quality code. The main causes of invalid data collection are a data collection flow lower (8.5% of samples) or higher (4.7%) than the set value. They demonstrate the difficulties that investigating technicians encountered in carefully adjusting collection flows between the two channels (PM2.5 and PM10) of the instrument. Furthermore, there were frequent concerns (in 5.7% of data collections) about the operation of these instruments (failure, impossibility to adjust flows, runaway pump, etc.). Several quality codes were grouped into 4 categories, so as to determine global sources of invalid data more precisely; these categories are failure to respect the protocol, problem related to the instrument, error by the investigating technician, error by the occupant. Failure to respect the protocol is the most frequent cause of data invalidity, but some of these data can still be used after the "particulate matter" working group set up selection criteria. The instrument is also a non-negligible reason for invalid collected data because it was pushed to its limits in the inquiries (used for the first time during 7 consecutive days). Furthermore, setting up this data collection required a great deal of energy and time by investigating technicians, who sometimes preferred to sacrifice this collected data for the benefit of the remainder of the inquiry. Finally, some occupants refused to allow the data collection for their own comfort, and depending on their sensitivity, due to noise created by collection pumps, although pump noise has been attenuated by the manufacturer. Analysis

�
�������������� ��������� ����������������� ������������ 6,���������������� ����������������������������������� �
From the point of view of the analysis (filters weighed by the LHVP laboratory), 912 out of 944 collected data are valid (96.6%). The main cause of non-validity is due to a nonconforming inspection during reception of filters (1.5%), which generally shows up as a deteriorated filter making the weighing impossible. Collection is the limiting factor controlling the validity of measurements of the mass concentration of particulate matter suspended in air. Quality codes are not sufficient to determine whether or not measurements are usable. Collection must be looked at in more detail and all parameters that could have an impact need to be taken into account. Thus validity criteria were set up so as to check:
* initial and final flows (transferred value, deviation between the initial and final flow less than 0.4 L/min);
* the average flow with a tolerance of ± 0.3 L/min; * the exposure time, and accessorily the collection value with respect to
collection time ranges defined in the protocol with not less than 92h operation out of the 123 planned hours;
* collection time recovered from the instrument memory. If there is any doubt about the mass of collected particulate matter (aberrant value) and due to the lack of information about a possible inversion of filters, the two associated collections (PM2.5 and PM10) will be deleted. Seventeen control filters were analysed demonstrating that the residual mass on these filters remains negligible compared with the samples taken. Consequently, there is no point in correcting the in situ collected mass for the low loss ratio observed on control filters.
1.4.2 Inter-laboratory tests
Two inter-laboratory tests were made within the framework of the national dwelling survey.
1.4.2.1 Inter-laboratory test (analytic part) The purpose of this test is to accurately and precisely determine intra-and inter-laboratory measurements from an analytic point of view. It was done with cartridges doped with each VOC target by an independent laboratory (Douai Ecole des Mines). Laboratories participating in the inter-laboratory test (POLLEM laboratory and Fondazione Salvatore Maugeri [FSM]) carried out the analyses blind. The accuracy and precision of the measurements for each VOC were determined at three concentration levels: low (about 5 µg/m3), average (about 20 µg/m3) and high (about 80 µg/m3). The Douai Ecole des Mines (EMD) prepared 45 Radiello® cartridges (code 145) and doped them with twelve VOC targets (15 cartridges per level and 9 blanks). The POLLEM laboratory analysed the cartridges six weeks after doping while La Fondazione Salvatore Maugeri analysed its cartridges ten weeks after doping. These long times were due to problems with transport services losing cartridges. This incident then introduced a bias into the analysis due to the difference in time between the two laboratories. The result is that it is difficult to interpret the results in terms of accuracy. On the other hand, the intra-laboratory repeatability can still be determined.

�
�������������� ��������� ����������������� ������������ 6-���������������� ����������������������������������� �
The inter-laboratory test showed a good match between the two POLLEM and FSM laboratories despite normal variations between tests. Repeatability (intra-laboratory variation) and reproducibility (inter-laboratory variation) of the results (Table 3) are acceptable except for undecane, decane (at the lowest concentrations) and tetrachloroethylene (the lowest concentration). Although significant, differences observed between the two laboratories remain marginal (lower than differences with the nominal doping concentration) and do not cast doubt on the choice of laboratories. The two laboratories show a large difference in measured concentrations compared with the real doping level. The contribution of the laboratory factor cannot be dissociated from the analysis time factor and consequently no observed bias correction can be proposed. The analytic reproducibility determined during this test was used as an input parameter to the procedure for estimating the uncertainty in the measurement of volatile organic compounds. For the four glycol ethers for which no analytic inter-comparison was made, the reproducibility calculated from replicas was used as an input parameter. �
���������;��/������8����)� �� ��)��'�����/'�8����)���(30&������%
��8��������,� <�5�(-�
1.4.2.2 Inter-laboratory test (replicas of the dwelling survey) The purpose of the second inter-laboratory test is to determine reproducibility of measurements taking account of two factors; in situ data collection and the analysis. These factors also take account of the data collection location (four dwellings per investigating technician team) and the persons involved in the collection (three teams of investigating technicians TE). Replica cartridges were placed by three teams of investigating technicians drawn at random (LHVP, Champs-sur-Marne CSTB, Cher Pact) and applied to ten dwellings.

�
�������������� ��������� ����������������� ������������ 0.���������������� ����������������������������������� �
Six cartridges were placed at each data collection point in each dwelling (bedroom and outdoors) for each laboratory. A control cartridge was also placed at each collection point for each laboratory so that transport and storage conditions could be taken into account. These data were analysed on raw uncorrected values of the influence of temperature or pressure, which has no influence on reproducibility calculations. The results of 16 VOCs were interpreted. The only one that was not used was 2-butoxyethyl acetate because it was detected only very rarely and it cannot be used as a comparison. Agreement of concentrations measured by the two laboratories is good for BTEX (Benzene, Toluene, Ethylbenzene, Xylenes), 1-methoxy-2-propanol, 1-methoxy-2-propyl acetate, 1.4-dichlorobenzene and decane. It remains acceptable (considering the relatively low levels) for styrene, (maximum difference 1 µg/m3), trichloroethylene (maximum difference 2 µg/m3), 1.2.4-trimethylbenzene (maximum difference 3 µg/m3), tetrachloroethylene (maximum difference 4 µg/m3) and 2-butoxyethanol (maximum difference 5 µg/m3). On the other hand, observed differences for undecane are larger (concentrations greater than 20 µg/m3). There is a difference of 24 µg/m3. for undecane, between 49 and 25 µg/m3. Undecane was already creating a problem at the FSM laboratory for the analysis that could explain the difference observed. Inter-laboratory reproducibility calculated from these data (Appendix 4) can be used as an indicator for global uncertainty, although it does not take account of some factors, and particularly the accuracy of the method. It is also dependent on the concentration range recorded in the field, which can be fairly small.
1.4.2.3 Analysis of aldehyde replicas in the dwelling survey In dwellings that were used for the inter-laboratory tests for VOC measurements, aldehyde collections were repeated six times for each collection point (bedroom + outdoors). They were used to monitor the internal repeatability of the POLLEM laboratory. Once again, the preliminary analysis of these data was made on raw data not corrected for the influence of temperature or pressure. Dispersion of measurements considering concentrations greater than 1 µg/m3, expressed by the variation coefficient, is not more than 8.2% for formaldehyde, 21% for acetaldehyde, 22.6% for acrolein and 12.1% for hexaldehyde. Repeatability of the measurement (Appendix 4) is satisfactory for formaldehyde (less than 23%) and hexaldehyde (less than 17.8%), and acceptable for acetaldehyde (less than 40%). Acrolein contents remain relatively low and consequently the corresponding repeatabilities are high (64%). Data for acrolein contents should be considered to be semi-quantitative.
1.4.3 Measurement uncertainties
1.4.3.1 Specific guide for evaluation of uncertainties (OQAI / LNE) Cooperation between OQAI and the LNE (Laboratoire National d’Essais – National Tests Laboratory) was set up to determine measurement uncertainties for the

�
�������������� ��������� ����������������� ������������ 0&���������������� ����������������������������������� �
following pollutants: CO, CO2 and VOC, aldehydes. The so-called «5 M16 » technique was applied for these three pollutant families, so as to list all possible causes of uncertainty on measurements starting from good knowledge of the measurement process.
1.4.3.1.1 Uncertainty on the CO and CO2 measurements The following table contains the results of calculation uncertainties on CO and CO2 measurements determined at levels of 50 and 1500 ppm17 respectively, and the main sources of uncertainties and factors not taken into account in this determination. Concentration levels were chosen based on WHO guide values for CO and a value frequently encountered for CO2. These values also correspond to concentrations of reference cylinders. CO CO2 Concentration (ppm) 50 1500 Uncertainty (ppm) 4.9 67 Uncertainty (%) 9.8 4.5 Main sources of uncertainties
• Tolerance on the measurement accuracy (check the adjustment with a control gas cylinder) for 35.7%
• Repeatability of measurements for 17.7%
• Tolerance on the measurement accuracy (check the adjustment with a control gas cylinder) for 61.4%
• concentration of control gas cylinders fixed at 2% by the manufacturer for 20.4%
Uncertainty factors not included in the uncertainty calculation
Effect of the matrix, presence of interferents
Hygrometry, pressure, temperature, air velocity, matrix effect and presence of interferents
Tableau 4: Uncertainties on CO and CO2 measurements
1.4.3.1.2 Uncertainty on the VOC measurements The widened uncertainty (k = 2) was calculated for different VOC targets at different concentration levels corresponding to the quantification limit, the 10, 50 and 90 percentiles, and the maximum. These values are presented for each pollutant in chapter 2 and are also listed in Appendix 5. It takes account of inter-laboratory tests carried out on the analytic part of the measurement, except for glycol ethers and acetates for which this inter-comparison was not made. For glycol ethers and acetates, reproducibilities determined from replicas were included into the calculation model. The following factors were not evaluated and consequently were not used in the calculation of the composite uncertainty; influence of cartridge manufacturing, aging of diffusing bodies, transfer of the glass tube to the diffusive body, effect of the load, &'�$���� ��������������������� ������������ ������������ ��������!������������ ����� ��������������������������� ��� ��
����������������� ����������� �!�������� ���B����!� ���B� ���!� ���B� �����!� ���/��������� �����2����#��$���� ��������
������������ ���<���������+������������ ���B�������� �?���� ��� ��%<?B!�>��/>F�&6..�!�&--6)!� ����������������������
������ #�&"�3� ������ �����+��+�������������� ��������������%�������� � ��G���8���)�
�

�
�������������� ��������� ����������������� ������������ 0(���������������� ����������������������������������� �
presence of interferents during collection, influence of the air velocity, the collection hygrometry, the collection temperature, the collection pressure. The mass sampled onto the tube usually represents the largest part of uncertainty, essentially related to the influence of the detector response coefficient drift between two calibrations, limited by the tolerance associated with surveillance points (fixed at 15% by the laboratory). The model and the laboratory effect also play an important role in the uncertainty of the collected mass depending on the compound. Another source of uncertainty in the calculation of the exposure concentration is related to the experimental determination of the collection flow, that is a variable contribution depending on the VOCs.
1.4.3.2 Determination of measurement uncertainties for BTEX and glycol ethers (Douai Ecole des Mines) The results presented in this section are derived from work initiated in the Chemistry - Environment Department at the Douai Ecole des Mines in cooperation with the ADEME and OQAI18,19.
1.4.3.2.1 Identification of sources of uncertainty for BTEX The so-called «5 M» technique is used again to list all possible causes of uncertainty, starting from good knowledge of the measurement process. The results obtained are listed in the following table:
Propagation of uncertainties
Comparison of 2 methods
Compound C (µµµµg/m3) uC (µµµµg/m3) UC (%) k = 2 UC (%) k = 2 Benzene 5.27 0.42 16 25 Toluene 19.38 1.86 19 31 Ethylbenzene 3.92 0.5 26 23 (m+p)-Xylenes 7.95 0.99 25 20
o-Xylene 4.65 0.54 23 24 Table 5: Uncertainties on BTEX concentrations measured indoors during a 7-day
period
The main source of uncertainty on the BTEX measurement by passive collection over 7 days is the sampling flow (53% of cases), and particularly the effect of low wind velocities. Determination of the mass sampled on the cartridge accounts for 41%.
1.4.3.2.2 Identification of sources of uncertainty for glycol ethers The main source of uncertainty is related to the value of the data collection flow (contribution > 80%) and particularly the impact of environmental factors (temperature, humidity, air velocity) on this value. Other sources of uncertainty are the error on the analysed mass, the effectiveness of desorption and to a lesser extent, the error on the desorption duration. Uncertainties on concentrations of glycol
&,�H�������*7����������%(..�)!����������� ������������� �������������������������� ����� ������������� ������������
����������������������#����� ��� �� �����#��2�����?������� �����=������������$��������#�
&-�H���������@!�H�������*7���������!�2���������$�E�2������>�%(..�)!�H��������������������������� ������������������#��
���� ��H3�(..&�3�����������I�� ����� ���H3�B/?�2�(��������#��B/���7F.6....-��7����� ���#�&.6������#�
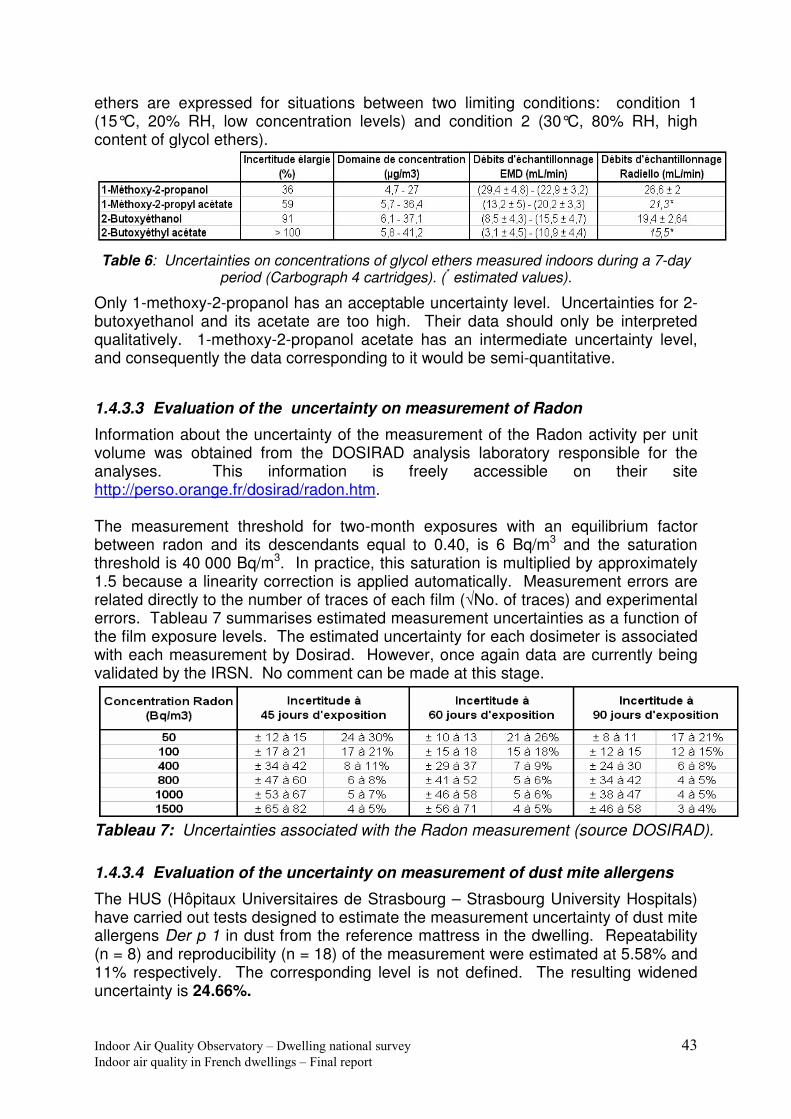
�
�������������� ��������� ����������������� ������������ 06���������������� ����������������������������������� �
ethers are expressed for situations between two limiting conditions: condition 1 (15°C, 20% RH, low concentration levels) and condition 2 (30°C, 80% RH, high content of glycol ethers).
Table 6: Uncertainties on concentrations of glycol ethers measured indoors during a 7-day period (Carbograph 4 cartridges). (* estimated values).
Only 1-methoxy-2-propanol has an acceptable uncertainty level. Uncertainties for 2-butoxyethanol and its acetate are too high. Their data should only be interpreted qualitatively. 1-methoxy-2-propanol acetate has an intermediate uncertainty level, and consequently the data corresponding to it would be semi-quantitative.
1.4.3.3 Evaluation of the uncertainty on measurement of Radon
Information about the uncertainty of the measurement of the Radon activity per unit volume was obtained from the DOSIRAD analysis laboratory responsible for the analyses. This information is freely accessible on their site http://perso.orange.fr/dosirad/radon.htm. The measurement threshold for two-month exposures with an equilibrium factor between radon and its descendants equal to 0.40, is 6 Bq/m3 and the saturation threshold is 40 000 Bq/m3. In practice, this saturation is multiplied by approximately 1.5 because a linearity correction is applied automatically. Measurement errors are related directly to the number of traces of each film (�No. of traces) and experimental errors. Tableau 7 summarises estimated measurement uncertainties as a function of the film exposure levels. The estimated uncertainty for each dosimeter is associated with each measurement by Dosirad. However, once again data are currently being validated by the IRSN. No comment can be made at this stage.
Tableau 7: Uncertainties associated with the Radon measurement (source DOSIRAD).
1.4.3.4 Evaluation of the uncertainty on measurement of dust mite allergens
The HUS (Hôpitaux Universitaires de Strasbourg – Strasbourg University Hospitals) have carried out tests designed to estimate the measurement uncertainty of dust mite allergens Der p 1 in dust from the reference mattress in the dwelling. Repeatability (n = 8) and reproducibility (n = 18) of the measurement were estimated at 5.58% and 11% respectively. The corresponding level is not defined. The resulting widened uncertainty is 24.66%.
�
�������������� ��������� ����������������� ������������ 00���������������� ����������������������������������� �
Based on the same principle, the widened uncertainty of the measurement of dust mite allergens Der f 1 results in a value of 29.46%, with repeatability and reproducibility values equal to 10.02% (n = 8) and 10.80% (n = 19) respectively. The uncertainty calculation in the two cases only takes account of the analysis and not of aspects related to collection. Analysis of dust mite allergens would be quantitative.
1.4.3.5 Evaluation of the uncertainty on measurement of cat and dog allergens
HUS carried out tests designed to estimate the measurement uncertainty of cat allergens Fel d 1 in air in the living room of dwellings included in the inquiries. The repeatability (n = 5) and reproducibility (n = 20) of the sample were estimated at 27.55% and 48.20% respectively. The widened uncertainty related to collection is 111%. Concerning the analysis, the value of the widened uncertainty is 25.94%, with repeatability and reproducibility values of 9.14% (n = 8) and 9.20% (n = 16) respectively. For dog allergen Can f 1. the collection uncertainty is 74.74% with a repeatability of 23.59% (n = 5) and a reproducibility of 28.99% (n = 5). The analysis uncertainty is equal to 21.18% with a repeatability of 5.43% (n = 8) and reproducibility of 9.10% (n = 5). These data show that: * cat allergen data Fel d 1 should be considered as qualitative only. * dog allergen data Can f 1 should be considered as semi-quantitative only.
1.4.3.6 Evaluation of the uncertainty on measurements of particulate matter suspended in air PM2.5 and PM10.
The method of calculating the uncertainty of the measurement of particulate matter suspended in air in the dwellings included in the inquiries is based on repetition of measurements. Twelve data collection instruments were tested continuously over one week (without programmer) namely during 168 hours at CSTB. The measurement uncertainty was determined using the so-called "Fidelity" method, and calculation methods are defined in standards NF ENV 13005 and ISO 5725-1 to 6. The uncertainty of the concentration measured in PM2.5 based on the repeatability standard deviation is 20.4% (at 13 µg�m-3), and for the measurement in PM10 it is equal to 26.76% (at 21.6 µg�m-3). Therefore, the data are considered to be valid.
1.4.4 Conclusion
The first inter-laboratory test on the analytic part shows good agreement between the two laboratories. This test was included in the procedure for evaluation of the VOC measurement uncertainty. The analysis of replicas of the dwellings survey shows

�
�������������� ��������� ����������������� ������������ 0����������������� ����������������������������������� �
that from a repeatability point of view, the performances of each laboratory are fairly comparable with repeatability levels that remain satisfactory. Several methods were used to determine the measurement uncertainty associated with the data. In particular, the reproducibility determined from the replicas includes all the entire collection process until analysis. The results show disparity of uncertainties as a function of measured parameters. A classification of data is proposed based on the results obtained. Thus, the following measurements could not be considered as being quantitative because of their high uncertainty:
� cat allergens: qualitative data. � dog allergens: semi-quantitative data. � tetrachloroethylene: qualitative data � trichloroethylene: semi-quantitative data � undecane: semi-quantitative data � decane: semi-quantitative data � 1.2.4-trimethylbenzene: semi-quantitative data � 2-butoxyethanol: semi-quantitative data (at best) � 2-butoxyethylacetate: qualitative data � 1-methoxy-2-propanol: semi-quantitative data � 1-methoxy-2-propylacetate: semi-quantitative data � acrolein: semi-quantitative data
This data classification suggests that data could be used differently. Qualitative data would represent a binary variable (absence or presence). Semi-quantitative data would be better represented by an ordinal variable (increasing concentration categories). However, this would lead to a loss of information about these data that would have to be interpreted otherwise.
�
�������������� ��������� ����������������� ������������ 0'���������������� ����������������������������������� �
-� ����/'�#��)����!���,"�$% �##��&���
The tables and histograms in this chapter describe distributions of pollutants in dwellings included in the inquiry in mainland France (excluding Corsica) after correction. They thus translate the inventory of indoor air quality in the existing 24 672 135 main residences in mainland France. For each parameter, the characteristic main values of concentrations are included in a table that contains the following elements: - the number of measurements made (observations); - extreme values of the sample: maximum 1 corresponds to the maximum of the
variable, maximum 2 corresponds to the second largest value (different from max1) that the variable can be set to. Minimum 1 corresponds to the minimum value (or class) of the variable, minimum 2 corresponds to the second smallest value or class (different from min1);
- the represented number of residences: in general, pollutant contents are only known for some of the 567 dwellings included in the inquiry. The "represented number" is equal to the sum of the total weighted numbers for which data are available for this pollutant;
- the percentage of dwellings in the number of existing residences in France that are below the detection limit (less than the detection limit) and are included within the detection limit and the quantification limit for VOCs and aldehydes (for allergens, Less than LQ means values less than the quantification limit);
- the median: represents the value below which 50% of main residences in the country are located;
- percentiles Px: x% of main residences in the country do not exceed this value. - 95% confidence intervals are indicated between brackets for each percentile
(calculation method presented in Appendix 6) For each pollutant, observation conditions and measurement limits (detection and quantification limits) are specified together with measurement uncertainties calculated using the «5M method 20 ». Potential pollution sources and data in the national and international literature collected for the purposes of data inventories made by the OQAI21 are also presented (Appendix 7). Reference values available for indoor Air across Europe22, in Finland23, in Germany24, in Norway25, but also in
(.�$������ ����������������� ������������ ������������ ���������!������������ ����� ��������������������������� ��� ��
����������������� ����������� �!�������� ���B����!� ���B� ���!� ���B� �����!� ���/��������� �����2����#��21 Luc Mosqueron, Vincent Nedellec, «Inventory of French data on indoor air quality in buildings; update of data during the 2001-2004 period», CSTB DDD/SB-2004-044, October 2004 and «Inventory of French data on indoor air quality in buildings; data updated during the 1990-2001 period», CSTB DDD/SB-2002-23. December 2001 ((�������� ��<�������������/����#�J@����������������� ����!�/�������������!�>�#�-&�
(6���=��#�7��������� ������������������� �!����� �� ���!����������������� ������#���������=���� ������������������� ������
7���� �#�@����� �!�;��!�&--��(0�=����� �� ���!�&---#�<���������������������������������� �� #����'�� ����� �������=!!��/�������!�����&!����0--*
�.0#�(��D������3#�&---������������������������������������������ �#����'�� ����� ����+��=!!#�/�������!�����&!����&"&*
&"'#�

�
�������������� ��������� ����������������� ������������ 0"���������������� ����������������������������������� �
Australia26, Canada27 and the United States28, and national and European outdoor air quality criteria29 are given for guidance. These values cannot be directly compared with collected data in most cases, due to differences between the exposure times considered.
-�� ( #���#�� �&���,�, +� '�$��
Volatile organic compounds are classified by family (aldehydes, hydrocarbons, glycol ethers) then by alphabetic order. If the pollutant name begins with a number, then the first letter is used to determine the order. The following tables contain characteristic values of distributions of concentrations for all volatile organic compounds indoors in dwellings, outdoors and in garages communicating with the dwelling. The same distribution data are then presented in the form of a table and a graph for each individual compound. The first concentration interval in these histograms corresponds to dwellings in France below the detection limit (LD). The second interval corresponds to dwellings between the detection limit and the quantification limit (LQ). These limits are different for each compound and are summarised at the beginning of each part.
-���� (�1���1 ���2���������������
Medians, minimum, maximum and percentiles for VOCs
('�= � ����� ���������3���� A�����$�+���������������������� ������� ��������/��������� ��� �����!�(..&�
("�/+������<�������������������� ������������������� ����/��������� ���@��� ������� ��� ��@��� ��7�����!�&-,-�
(,�?=*/H�A�>� ������������ �������� ��= ��������%>��=)!�&--"�
(-��������>�#(..(*(&6#���������&��(..(!��������>�#�(..6*&.,�!�>��������&(�(..6����������� �� �������� ������������ ����
(..(8687/��������� ���/�������H�������� �����7�����������������&(�(..(����������������������>�#�-,*6'.!�B���'�
&--,!������ ����&---86.8/7�������((�&---�����(...8'-8/7�>��������&'�(...!������ ����>��������&'�(...#�
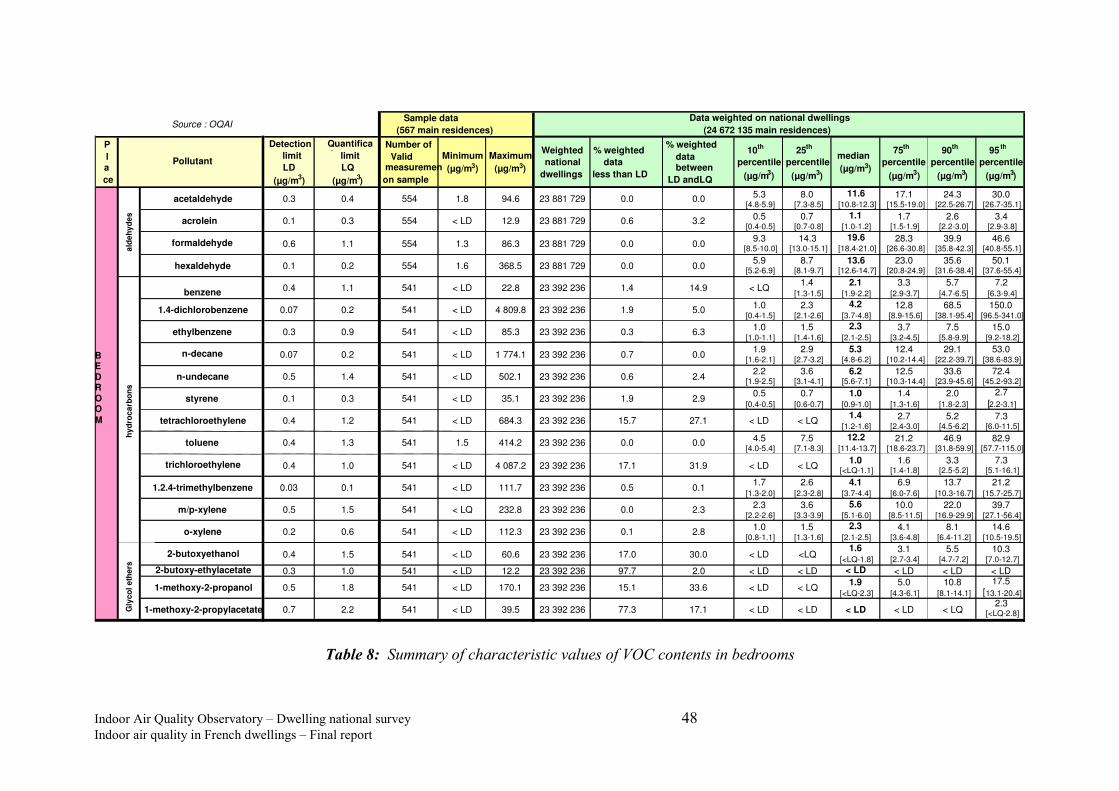
�
�������������� ��������� ����������������� ������������ 0,���������������� ����������������������������������� �
� Source : OQAI�
P�l�a�ce�
Detection �limit�LD�
(µg/m�3�)�
Quantification �limit�
LQ�(µg/m�3�)�
Number of �Valid �
measurements �on sample�
Minimum�(µg/m�3�)�
Maximum�(µg/m�3�)�
Weighted�national �
dwellings�
% weighted�data�
less than LD�
% weighted�data�between�
LD andLQ�
10�th�percentile�
(µg/m�3�)�
25�th�percentile�
(µg/m�3�)�
median�(µg/m�3�)�
75�th�percentile�
(µg/m�3�)�
90�th�percentile�
(µg/m�3�)�
95�th�percentile�
(µg/m�3�)�
acetaldehyde� 0.3� 0.4� 554� 1.8� 94.6� 23 881 729� 0.0� 0.0� 5.3�[4.8-5.9]�
8.0�[7.3-8.5]�
11.6�[10.8-12.3]�
17.1�[15.5-19.0]�
24.3�[22.5-26.7]�
30.0�[26.7-35.1]�
acrolein� 0.1� 0.3� 554� < LD� 12.9� 23 881 729� 0.6� 3.2� 0.5�[0.4-0.5]�
0.7�[0.7-0.8]�
1.1�[1.0-1.2]�
1.7�[1.5-1.9]�
2.6�[2.2-3.0]�
3.4�[2.9-3.8]�
formaldehyde� 0.6� 1.1� 554� 1.3� 86.3� 23 881 729� 0.0� 0.0� 9.3�[8.5-10.0]�
14.3�[13.0-15.1]�
19.6�[18.4-21.0]�
28.3�[26.6-30.8]�
39.9�[35.8-42.3]�
46.6�[40.8-55.1]�
hexaldehyde� 0.1� 0.2� 554� 1.6� 368.5� 23 881 729� 0.0� 0.0� 5.9�[5.2-6.9]�
8.7�[8.1-9.7]�
13.6�[12.6-14.7]�
23.0�[20.8-24.9]�
35.6�[31.6-38.4]�
50.1�[37.6-55.4]�
benzene� 0.4� 1.1� 541� < LD� 22.8� 23 392 236� 1.4� 14.9� < LQ� 1.4�[1.3-1.5]�
2.1�[1.9-2.2]�
3.3�[2.9-3.7]�
5.7�[4.7-6.5]�
7.2�[6.3-9.4]�
1.4-dichlorobenzene� 0.07� 0.2� 541� < LD� 4 809.8� 23 392 236� 1.9� 5.0� 1.0�[0.4-1.5]�
2.3�[2.1-2.6]�
4.2�[3.7-4.8]�
12.8�[8.9-15.6]�
68.5�[38.1-95.4]�
150.0�[96.5-341.0]�
ethylbenzene� 0.3� 0.9� 541� < LD� 85.3� 23 392 236� 0.3� 6.3� 1.0�[1.0-1.1]�
1.5�[1.4-1.6]�
2.3�[2.1-2.5]�
3.7�[3.2-4.5]�
7.5�[5.8-9.9]�
15.0�[9.2-18.2]�
n-decane� 0.07� 0.2� 541� < LD� 1 774.1� 23 392 236� 0.7� 0.0� 1.9�[1.6-2.1]�
2.9�[2.7-3.2]�
5.3�[4.8-6.2]�
12.4�[10.2-14.4]�
29.1�[22.2-39.7]�
53.0�[38.6-83.9]�
n-undecane� 0.5� 1.4� 541� < LD� 502.1� 23 392 236� 0.6� 2.4� 2.2�[1.9-2.5]�
3.6�[3.1-4.1]�
6.2�[5.6-7.1]�
12.5�[10.3-14.4]�
33.6�[23.9-45.6]�
72.4�[45.2-93.2]�
styrene� 0.1� 0.3� 541� < LD� 35.1� 23 392 236� 1.9� 2.9� 0.5�[0.4-0.5]�
0.7�[0.6-0.7]�
1.0�[0.9-1.0]�
1.4�[1.3-1.6]�
2.0�[1.8-2.3]�
2.7�[�2.2-3.1]�
tetrachloroethylene� 0.4� 1.2� 541� < LD� 684.3� 23 392 236� 15.7� 27.1� < LD� < LQ� 1.4�[1.2-1.6]�
2.7�[2.4-3.0]�
5.2�[4.5-6.2]�
7.3�[6.0-11.5]�
toluene� 0.4� 1.3� 541� 1.5� 414.2� 23 392 236� 0.0� 0.0� 4.5�[4.0-5.4]�
7.5�[7.1-8.3]�
12.2�[11.4-13.7]�
21.2�[18.6-23.7]�
46.9�[31.8-59.9]�
82.9�[57.7-115.0]�
trichloroethylene� 0.4� 1.0� 541� < LD� 4 087.2� 23 392 236� 17.1� 31.9� < LD� < LQ� 1.0�[<LQ-1.1]�
1.6�[1.4-1.8]�
3.3�[2.5-5.2]�
7.3�[5.1-16.1]�
1.2.4-trimethylbenzene� 0.03� 0.1� 541� < LD� 111.7� 23 392 236� 0.5� 0.1� 1.7�[1.3-2.0]�
2.6�[2.3-2.8]�
4.1�[3.7-4.4]�
6.9�[6.0-7.6]�
13.7�[10.3-16.7]�
21.2�[15.7-25.7]�
m/p-xylene� 0.5� 1.5� 541� < LQ� 232.8� 23 392 236� 0.0� 2.3� 2.3�[2.2-2.6]�
3.6�[3.3-3.9]�
5.6�[5.1-6.0]�
10.0�[8.5-11.5]�
22.0�[16.9-29.9]�
39.7�[27.1-56.4]�
o-xylene� 0.2� 0.6� 541� < LD� 112.3� 23 392 236� 0.1� 2.8� 1.0�[0.8-1.1]�
1.5�[1.3-1.6]�
2.3�[2.1-2.5]�
4.1�[3.6-4.8]�
8.1�[6.4-11.2]�
14.6�[10.5-19.5]�
2-butoxyethanol� 0.4� 1.5� 541� < LD� 60.6� 23 392 236� 17.0� 30.0� < LD� <LQ� 1.6�[<LQ-1.8]�
3.1�[2.7-3.4]�
5.5�[4.7-7.2]�
10.3�[7.0-12.7]�
2-butoxy-ethylacetate� 0.3� 1.0� 541� < LD� 12.2� 23 392 236� 97.7� 2.0� < LD� < LD� < LD� < LD� < LD� < LD�1-methoxy-2-propanol� 0.5� 1.8� 541� < LD� 170.1� 23 392 236� 15.1� 33.6� < LD� < LQ� 1.9�
[<LQ-2.3]�5.0�
[4.3-6.1]�10.8�
[8.1-14.1]�17.5�
[�13.1-20.4]�1-methoxy-2-propylacetate� 0.7� 2.2� 541� < LD� 39.5� 23 392 236� 77.3� 17.1� < LD� < LD� < LD� < LD� < LQ� 2.3�
[<LQ-2.8]�
Pollutant�
B E D R O O M�
alde
hyde
s�hy
droc
arbo
ns�
Gly
col e
ther
s�Sample data�
(567 main residences)�Data weighted on national dwellings national�(24 672 135 main residences)�
��������#/����)��'����'������'���/���30&'� � ��� 8������

�
�������������� ��������� ����������������� ������������ 0-���������������� ����������������������������������� �
Cint/Cext ratio for Volatile Organic Compounds �
Source : OQAI�sample�data�
(567 MR)�
Pollutant� ] 0 ; 1 [� [ 1 ; 5 [� [ 5 ; 50 [� More than�50�
acetaldehyde� 523� 22 311 876� 0.0� 0.0� 0.3� 20.0� 77.1� 1.4� 1.1�acrolein� 523� 22 311 876� 0.4� 0.3� 1.2� 44.3� 35.9� 0.0� 17.9�
formaldehyde� 523� 22 311 876� 0.0� 0.0� 0.0� 16.1� 83.3� 0.1� 0.5�hexaldehyde� 523� 22 311 876� 0.0� 0.0� 0.0� 3.1� 58.4� 19.7� 18.8�
benzene� 504� 21 418 890� 1.2� 0.3� 7.6� 78.4� 7.2� 0.0� 5.3�1.4-dichlorobenzene� 504� 21 418 890� 1.4� 0.4� 2.6� 63.3� 18.1� 9.8� 4.4�
ethylbenzene� 504� 21 418 890� 0.3� 0.0� 4.3� 73.8� 15.6� 0.1� 6.0�n-decane� 504� 21 418 890� 0.0� 0.8� 4.8� 61.8� 25.2� 3.2� 4.2�
n-undecane� 504� 21 418 890� 0.7� 0.0� 5.2� 54.4� 25.1� 2.4� 12.2�styrene� 504� 21 418 890� 1.7� 0.4� 2.6� 75.1� 12.7� 0.3� 7.1�
tetrachloroethylene� 504� 21 418 890� 14.6� 1.7� 6.6� 63.9� 6.0� 0.2� 7.0�toluene� 504� 21 418 890� 0.0� 0.0� 3.9� 63.7� 29.6� 2.4� 0.5�
trichloroethylene� 504� 21 418 890� 15.3� 2.8� 13.6� 54.5� 5.0� 0.9� 8.0�124-trimethylbenzene� 504� 21 418 890� 0.0� 0.3� 3.7� 70.5� 20.7� 2.8� 1.9�
m+p-xylene� 504� 21 418 890� 0.0� 0.0� 7.5� 68.3� 19.1� 1.3� 3.8�o-xylene� 504� 21 418 890� 0.1� 0.0� 7.7� 69.6� 16.7� 1.2� 4.6�
2-butoxy ethanol� 504� 21 418 890� 17.1� 0.0� 0.3� 6.8� 1.9� 0.0� 73.9�2-butoxy ethyl acetate� 504� 21 418 890� 97.1� 0.5� 0.0� 1.7� 0.0� 0.0� 0.8�1-methoxy-2-propanol� 504� 21 418 890� 15.2� 0.0� 0.4� 3.8� 1.4� 0.3� 78.9�
1-methoxy-2-propyl acetate� 504� 21 418 890� 76.8� 0.4� 0.7� 2.0� 0.0� 0.0� 20.1�
Number of�dwellings used�to calculate the�ratio�
Data weighted on the national dwellings�(24 672 135 main residences)�
Weighted distribution of dwellings (%) as�a function of the value of the C�int� / C�ext �
% dwellings�for which�
C�int� �=� LD�C�ext� < LD�
% dwellings �for which�
C�int� < LD�C�ext� < LD�
National �
dwellings�represented�
% dwellings�for which�
C�int� < LD�C�ext� �=� LD�
Table 9: Summary of characteristic values of VOC ratios
For measurements equal to the detection limit (LD) or the quantification limit (LQ) or between LD and LQ, the value (LD+LQ)/2 was used.

�
�������������� ��������� ����������������� ������������ �.���������������� ����������������������������������� �
2.1.2 Aldehydes
2.1.2.1 Acetaldehyde
Observation conditions – collection on passive tube and analysis in laboratory; – place: bedroom (or equivalent), outdoors; – collection duration: integration over the inquiry week.
Measurement limits and uncertainties – detection limit LD: 0.3 �g/m3 – quantification limit LQ: 0.4 �g/m3
– uncertainties: (0.1 ± 0.7 µg/m3); (6.4 ± 1.5 µg/m3); (11.1 ± 3.9 µg/m3); (21.1 ± 5.3 µg/m3); (94.5 ± 23.4 µg/m3)
Elements of the literature Potential emission sources: photochemicals, tobacco smoke, photocopiers, raw wood panels, particle boards Average concentration levels (µg/m3) measured in indoor air in buildings in France and in other countries: see table in Appendix 7 Reference values available (for information): / Characteristics of distributions of acetaldehyde concentrations (µg/m3) indoors dwellings and outdoors:
� �������� ��������
������� ��� ��0� �(-B������
&�
&#,�2���� ��2��B������ (#&�2���� ��2��B�+���� -0#'� &(#0B�+����
(�
""#-� -#0>�##��������� ��� (6�,,&�
"(-�
((��-&�
0"'���5������ ��2�� .#. &#&��5��� 2������2� .#. .#"H&.� �#6��K0#,*�#-L� .#'��K.#'*.#"L�
H(�� ,#.��K"#6*,#�L� .#-��K.#,*&#.L�
+ ���� �����K&.#,*&(#6L� ��.���K&#(*L�
H"�� &"#&��K&�#�*&-#.L� &#"��K&#'*&#,L�
H-.� (0#6��K((#�*('#"L� (#0��K(#(*(#'L�
H-�� 6.#.��K('#"*6�#&L� 6#.��K(#'*6#&L�
--#'
5�#�/�'�0>+��
5����������������������� ������� ��� ����&��������1��4 11��2��
����1 �
�
Min 1� minimum value of variable�Min 2� 2�th� smallest value or class�Max 1�Max 2�
LD�LQ�P10� 10%�P25� 25%�median� 50%�P75� 75%�P90� 90%�P95� 95%�Ratio�
maximum value of variable�2�th� largest value or class�
Dwellings� represented�
No. of housings included in inquirywith valid measurements�Observations�
Number of dwellings�In the country�
Detection limit�Quantification limit�
dwellings are below�this value�
= C �int� / C �ext �

�
�������������� ��������� ����������������� ������������ �&���������������� ����������������������������������� �
Distribution of dwellings as a function of acetaldehyde concentrations (in µg/m3) indoors in dwellings (top figure) and outdoors (bottom figure) �
Concentration in acetaldehyde – main bedroom or comparable room�Weighted distribution of dwellings�
0%�5%�
10%�
15%�
20%�25%�30%�35%�40%�
[ 0; 0.3 [�
[0.3; 0.4[�
[ 0.4; 5 [�
[ 5; 10 [�
[ 10; 15 [�
[ 15; 20 [�
[ 20; 25 [�
[ 25; 30 [�
[ 30; 35 [�
[ 35; 40 [�
[ 40; 45 [�
[ 45; 50 [�
[ 50; 55 [�
[ 55 et +�
Concentration (µg/m�3�)�
Freq
uenc
y�
Source : OQAI�
observed minimum = 1.8 µg/m�3�
25�th� percentile = 8.0 µg/m�3 �
median = 11.6 µg/m� 3 �
75�th� percentile = 17.1 µg/m�3�
observed maximum = 94.6 µg/m�3 �
�
Concentration in acetaldehyde – Outdoor measurement�Weighted distribution of dwellings�
0%�
20%�
40%�
60%�
80%�
100%�
[ 0; 0.3 [�
[0.3; 0.4[�
[ 0.4; 5 [�
[ 5; 10 [�
[ 10; 15 [�
[ 15; 20 [�
[ 20; 25 [�
[ 25; 30 [�
[ 30; 35 [�
[ 35; 40 [�
[ 40; 45 [�
[ 45; 50 [�
[ 50; 55 [�
[ 55 et +�
Concentration (µg/m�3�)�
Freq
uenc
y�
Source : OQAI�
observed minimum < LD�25�th� percentile = 0.9 µg/m�3 �
median= 1.3 µg/m� 3 �
75�èh� percentile = 1.7 µg/m�3�
observed maximum = 12.4 µg/m3 �
The median value of acetaldehyde in dwellings is 11.6 µg/m3 and the maximum is 95 µg/m3. These levels are relatively similar to values measured in international studies.

�
�������������� ��������� ����������������� ������������ �(���������������� ����������������������������������� �
���� ���������
Potential emission sources: combustion, cigarette smoke, automobile exhaust gases, heating of animal and vegetable fats The median value of acrolein in dwellings is equal to 1.1 µg/m3 and the maximum is 13 µg/m3. ����� �������������
Potential emission sources: photochemicals, particle boards, fibre boards, unfinished wood boards, emissions from new books or magazines, upholstery fabrics, paint with solvent phase, tobacco smoke, photocopiers. Available reference values (for information):
WHO: 100 µg/m3 (30 min) INDEX: 30 µg/m3 with target concentration as low as reasonably achievable (ALARA principle) Norway: 100 µg/m3 (30 min) 4� �� �
(�,��������/���� �������./����)� �'�����-�(�<�5�
(,#�-�*�<�5�
(,#%-����<�5�
(,#(-
Australia: 120 µg/m3 Canada: 123 µg/m3 (1h), 50 µg/m3 (8h) Note: A French guide value is currently being produced at the AFSSET
Formaldehyde is found in all dwellings, and is one of the organic compounds with the highest levels. These levels (median 19.6 µg/m3 indoors, maximum 86.3 µg/m3) are consistent with values measured recently in other studies in France. The median of concentration values is less than levels observed in national studies and in multicentric studies in other countries (particularly in Germany (36 µg/m3) and Helsinki in Finland (42 µg/m3) ) but it is consistent with the English median (24 µg/m3). Available reference values are mentioned above. These data are subject to change due to the recent classification of formaldehyde in group 1 (proven carcinogen for man) by the CIRC in June 2004. A working group was created for this purpose at the AFSSET, mainly with the objective of evaluating the health risk related to this substance. Guide values for formaldehyde are also being produced within the framework of a second work group coordinated jointly by the AFSSET and CSTB, the purpose of which is to produce French guide values for the main Indoor Air pollutants.
30 Classification in three categories: Category S1: the best quality (high satisfaction level of occupants and low health risk levels); Category S2: good indoor air quality but with a high temperature on some summer days; Category S3: quality level that should not cause any health effect if the building is ventilated according to design rules and if there is no particular emission source. S3 corresponds to Land Use and Building Act (1999) and Health Protection Act (1994).

�
�������������� ��������� ����������������� ������������ �6���������������� ����������������������������������� �
A comparison of distributions with recommended values proposed by the European INDEX project shows that about 22% of French dwellings exceed the maximum proposed value (30µg/m3). This recommended value of 30µg/m3 is used with a target value that is as low as reasonably achievable (ALARA principle). This logic would lead to a higher percentage of dwellings concerned.
2.1.2.4 Hexaldehyde
Potential emission sources: particle boards, emissions from new books and new magazines, paint with solvent phase, wood treatment product (aqueous phase), untreated wood boards Hexaldehyde is the compound with the second highest median values (13.6 µg/m3) after formaldehyde. Maximum measured values are up to 368 µg/m3. Measured data agree with values collected in French and foreign literature.
2.1.3 Hydrocarbons
2.1.3.1 Benzene
Observation conditions – location: bedroom (or equivalent), outdoors, adjacent garage if any;
Potential emission sources: combustion, gasoline vapours, tobacco smoke, do-it-yourself products, furniture, construction and decoration products, combustion of incense
Reference values available (for information):
WHO: 17 µg/m3 (Unit risk 10 -4) 1.7 µg/m3 (Unit risk 10 -5) 0.17 µg/m3 (Unit risk 10 -6)
Outdoor air quality criteria: 2 µg/m3 (annual average), quality objective 9 µg/m3 (annual average), limiting value in 2006 5 µg/m3 (annual average), limiting value in 2010 Characteristics of benzene concentrations distributions (µg/m3) indoors in dwellings, outdoors and in garages with a direction communication with dwellings:

�
�������������� ��������� ����������������� ������������ �0���������������� ����������������������������������� �
The median value of benzene in dwellings is equal to 2.1 µg/m3 with maximum values close to 22 µg/m3. These levels are within the low range of levels measured in other French and international studies. Concentrations recorded in garages communicating with dwellings are much higher (median 4.4 µg/m3. maximum 30 µg/m3).
2.1.3.2 1.4-dichlorobenzene
Potential emission sources: moth-repellent, deodorant, mole poison The median value of 1.4-dichlorobenzene in dwellings is equal to 4.2 µg/m3 with a very high maximum exceeding 4800 µg/m3. Data in the literature are too sparse to be compared. Concentrations observed in garages communicating with dwellings are low (median 2.2 µg/m3. maximum approximately 77 µg/m3).
2.1.3.3 Ethylbenzene
Potential emission sources: fuel, waxes The median value of ethylbenzene in dwellings is equal to 2.3 µg/m3 and the maximum value is 85.3 µg/m3. These levels are generally consistent with levels observed in France and in international studies. Concentrations observed in garages communicating with dwellings are higher (median 18.0 µg/m3) with a maximum reaching 300 µg/m3.
2.1.3.4 n-Decane
Potential emission sources: white spirit, floor glues, waxes, wood varnish, floor, carpet, and mat cleaners
The median value of N-decane in dwellings is equal to 5.3 µg/m3 with a very high maximum of 1 774 µg/m3. These levels are generally consistent with levels observed in France and in international studies but few data are available. The median value of n-decane concentrations observed in garages is 10.8 µg/m3 and the maximum reached is 313 µg/m3.
�
�������������� ��������� ����������������� ������������ ������������������ ����������������������������������� �
2.1.3.5 n-Undecane
The median value of N-undecane in dwellings is equal to 6.2 µg/m3 with a very high maximum of 502 µg/m3. These levels are generally consistent with levels observed in France and in international studies but few data are available.
The median value of concentrations of n-undecane observed in garages with a direct communication with dwellings is 8.6 µg/m3 with a maximum reaching 348 µg/m3.
2.1.3.6 Styrene
Potential emission sources: plastic material, insulating materials, fuel, cigarette smoke Available reference values (for information): WHO: 260 µg/m3 (7d) Germany 31: 30 µg/m3 (7d), guide value I 300 µg/m3 (7d), guide value II
The median value of concentrations of styrene in dwellings is very low (1 µg/m3) but the maximum is equal to 35 µg/m3. The median value of concentrations observed in garages is slightly higher (1.2 µg/m3) while maximums are lower than those observed in dwellings (15.8 µg/m3). Values collected in this survey agree with foreign measurements made in dwellings. The reference value for styrene equal to 30 µg/m3 (Germany) was exceeded in a single dwelling among the 541 observations made in the survey, representing between 0 and 1.2% of all dwellings in France (95% confidence interval).
2.1.3.7 Tetrachloroethylene
Potential emission sources: carpets, mats, dry cleaning, The median value of tetrachloroethylene in dwellings is equal to 1.4 µg/m3 with a maximum equal to 684 µg/m3. Data in the literature are too sparse to be compared. Concentrations of tetrachloroethylene in garages with a direct communication with dwellings are much lower with a maximum equal to 8.2 µg/m3 (median value less than the quantification limit of tetrachloroethylene).
6&�&��� 1�� �9�1� �3����������������11������A�� ��������� ������������� ������������������������ ����� �����% �+�����������
���������������������� �)A��1�2��� �9�1� ���4�%������ �� ������������������� ���������� ��� ���� ������������� ������� ������
��� �������� ���#��/+�������� ��������������� �� � ����� � ������������������������������):��1�2��� �9�1� ����4�%������� ��
�� ������� ���� � ������ �������������+������)#�
�
�������������� ��������� ����������������� ������������ �'���������������� ����������������������������������� �
2.1.3.8 Toluene
Potential emission sources: paints, varnishes, glues, inks, carpets, mats, silicone caulking, gasoline vapour Available reference values (for information): WHO: 260 µg/m3 (7d)
Germany: 300 µg/m3 (7d), guide value I
3000 µg/m3 (7d), guide value II
The median toluene concentration is 12.2 µg/m3 in dwellings; maximum values are high, of the order of 400 µg/m3. These levels are usually higher than levels observed in other French studies, but lower than values measured in international studies. Concentrations observed in garages are very high (median value equal to 110.4 µg/m3) with maximum values reaching 1 790 µg/m3. The reference value fixed by WHO at 260 µg/m3 was exceeded in one dwelling during the national survey (out of 541 observations; IC95% = [0-0.8%]) and in 37 adjacent garages (out of 139 observations; IC95% = [21.3-37.6%]).
2.1.3.9 Trichloroethylene
Potential emission sources: paints, glues, varnishes, degreasing agents for metals The median value of trichloroethylene in dwellings is equal to 1.0 µg/m3 with a maximum equal to 4 087 µg/m3. Data in the literature are too sparse to be compared. The median concentration of trichloroethylene in garages with a direct communication with dwellings is less than the quantification limit and the maximum reaches 240 µg/m3.
2.1.3.10 1.2.4 – trimethylbenzene
Potential emission sources: oil solvents, fuel, tar, varnishes
1.2.4 – The median value of trimethylbenzene in dwellings is equal to 4.1 µg/m3 with a high maximum equal to 111 µg/m3. These levels are consistent with data measured in international studies, although there are not many of these data available. Concentrations observed in garages with a direct communication with dwellings are higher (median value equal to 18.7 µg/m3) with a maximum reaching 270.6 µg/m3.

�
�������������� ��������� ����������������� ������������ �"���������������� ����������������������������������� �
������� �����������
Potential emission sources: paints, varnishes, glues, insecticides
The median value of M/p-xylenes is 5.6 µg/m3 and the maximum is close to 233 µg/m3. This median value is within the low range of data in international studies. Concentrations observed in garages with a direct communication with dwellings are very high with a median value equal to 58.9 µg/m3 and a maximum exceeding 670 µg/m3 for m/p-xylenes.
2.1.3.12 o-Xylene
The median value of O-xylene in dwellings is equal to 2.3 µg/m3 with a maximum of 112.3 µg/m3. This median value is within the low range of data in international studies. Concentrations of o-xylene observed in garages with a direct communication with dwellings are high with a median value equal to 20.8 µg/m3 and a maximum equal to 327 µg/m3.
2.1.4 Glycol ethers
2.1.4.1 2-butoxyethanol (EGBE, Ethylene Glycol n-Butyl Ether)
Potential emission sources: paints, varnishes, lacquers, soaps, cosmetics, fungicides, herbicides, wood treatment products, silicone caulking 2-butoxyethanol is present in dwellings at low concentrations with a median equal to 1.6 µg/m3. Maximum values reach 60.6 µg/m3.
The median concentration observed in garages is less than the detection limit; the maximum is 22.1 µg/m3.
Data in the literature are very sparse but appear to be consistent with the results of the national survey.
2.1.4.2 2-butoxyethylacetate (EGBEA, Ethylene Glycol n-Butyl Ether Acetate)
2-butoxyethylacetate concentrations in dwellings are very low with a median less than the detection limit and a maximum reaching 12.2 µg/m3. 2-butoxyethylacetate is not present in garages with a direct communication with dwellings (maximum less than the quantification limit).

�
�������������� ��������� ����������������� ������������ �,���������������� ����������������������������������� �
2.1.4.3 1-methoxy-2-propanol (2PG1ME, 2-Propylene Glycol 1-Methyl Ether)
The median value of 1-methoxy-2-propanol in dwellings is equal to 1.9 µg/m3 with a very high maximum (170.1 µg/m3). The median in garages with a direct communication with dwellings is less than the detection limit, but maximum values are very high (123.9 µg/m3).
2.1.4.4 1-methoxy-2-propylacetate (2PG1MEA, 2-Propylene Glycol 1-Methyl Ether Acetate)
Median concentrations of 1-methoxy-2-propylacetate are less than the detection limit (0.7 µg/m3) in dwellings and adjacent garages. Maximum values are 39.5 µg/m3 in dwellings and 11.9 µg/m3 in garages with a direct communication with dwellings, respectively.
2.2 CARBON MONOXIDE
Observation conditions – recording instrument; – location: living room, outdoors, any room containing a combustion equipment – duration: recording made every 5 minutes during the week of the inquiry.
Measurement uncertainties see part 1.4 and appendix 4
Elements of the literature Potential emission sources: substance derived from incomplete combustion (heating and hot water production equipment, smoking, automobile, etc.). Outdoor air quality criteria: 10 mg/m3 (namely 9 ppm) (8h) limiting value
Carbon monoxide was measured continuously every 5 minutes. The results were then combined over 15 minutes, 30 minutes, 1 hour and 8 hours (maximum sliding averages) so as to compare them with recommendations made by the World Health Organisation. Rooms in which CO was measured are broken down into three groups: - Main rooms: bedroom, lounge, living room, office, studio, open plan kitchen; - Other rooms: kitchen, bathroom, WC, indoor corridors in the dwelling; - Annexes: cellar, boiler room, utility room, veranda, laundry room, garage with
direct communication with the dwelling. Most carbon monoxide levels in different groups of rooms are equal to zero. The maximum recorded levels are as follows:
Exposure time 15 minutes 30 minutes 1 hour 8 hours
WHO 87 ppm 52 ppm 26 ppm 9 ppm
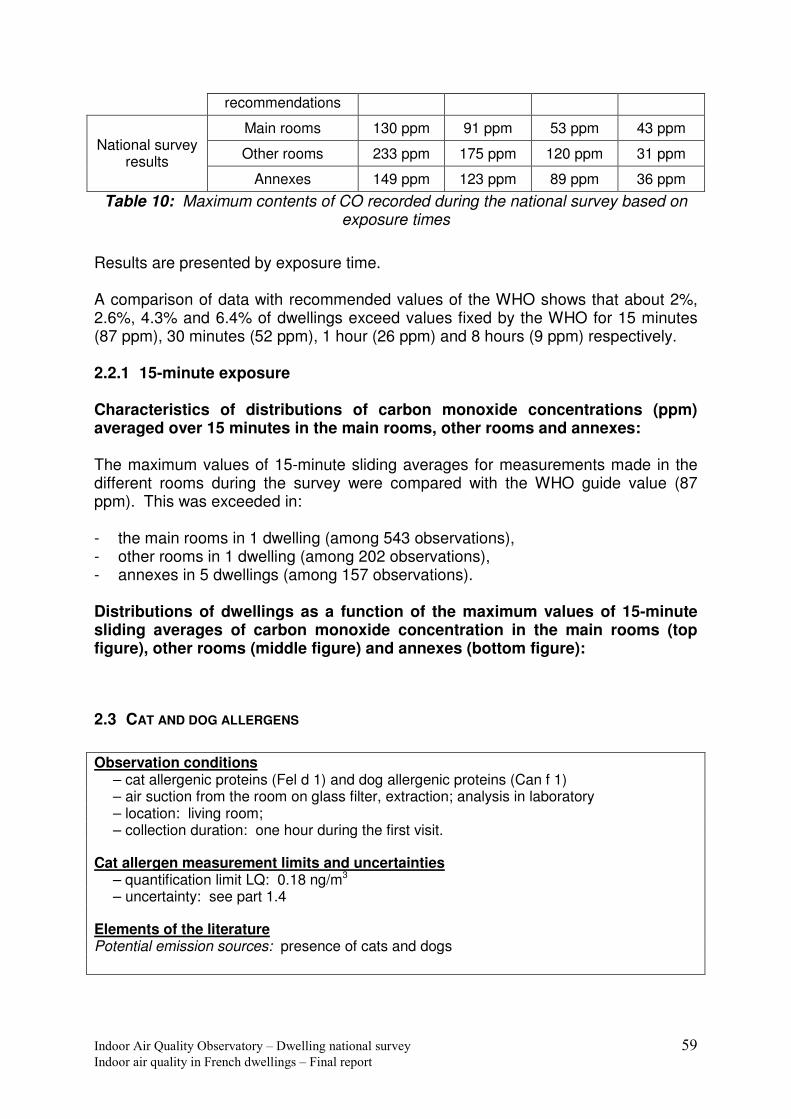
�
�������������� ��������� ����������������� ������������ �-���������������� ����������������������������������� �
recommendations
Main rooms 130 ppm 91 ppm 53 ppm 43 ppm
Other rooms 233 ppm 175 ppm 120 ppm 31 ppm National survey results
Annexes 149 ppm 123 ppm 89 ppm 36 ppm Table 10: Maximum contents of CO recorded during the national survey based on
exposure times
Results are presented by exposure time. A comparison of data with recommended values of the WHO shows that about 2%, 2.6%, 4.3% and 6.4% of dwellings exceed values fixed by the WHO for 15 minutes (87 ppm), 30 minutes (52 ppm), 1 hour (26 ppm) and 8 hours (9 ppm) respectively. 2.2.1 15-minute exposure Characteristics of distributions of carbon monoxide concentrations (ppm) averaged over 15 minutes in the main rooms, other rooms and annexes: The maximum values of 15-minute sliding averages for measurements made in the different rooms during the survey were compared with the WHO guide value (87 ppm). This was exceeded in: - the main rooms in 1 dwelling (among 543 observations), - other rooms in 1 dwelling (among 202 observations), - annexes in 5 dwellings (among 157 observations). Distributions of dwellings as a function of the maximum values of 15-minute sliding averages of carbon monoxide concentration in the main rooms (top figure), other rooms (middle figure) and annexes (bottom figure):
2.3 CAT AND DOG ALLERGENS
Observation conditions – cat allergenic proteins (Fel d 1) and dog allergenic proteins (Can f 1) – air suction from the room on glass filter, extraction; analysis in laboratory – location: living room; – collection duration: one hour during the first visit.
Cat allergen measurement limits and uncertainties – quantification limit LQ: 0.18 ng/m3 – uncertainty: see part 1.4
Elements of the literature Potential emission sources: presence of cats and dogs

�
�������������� ��������� ����������������� ������������ '.���������������� ����������������������������������� �
Median values of cat allergens (Fel d 1) and dog allergens (Can f 1) are less than quantification limits for these values. Maximum values observed are 27.4 ng/m3 for cat allergens and 12.1 ng/m3 for dog allergens. Data in the literature about airborne allergens are too sparse to be compared with data collected within the framework of the national Dwellings survey.

�
�������������� ��������� ����������������� ������������ '&���������������� ����������������������������������� �
2.4 DUST MITE ALLERGENS
Observation conditions – allergenic proteins Der f 1 (Dermatophagoids farinae) and Der p 1 (Dermatophagoids
pteronyssinus) – suction of mattress dust from the bed in the bedroom being investigated (parents bedroom); – sieving, extraction, analysis in laboratory; – location: bedroom (or equivalent); – data collection duration: 5 to 10 minutes during the visit.
Elements of the literature Potential emission sources: house dust with the presence of dust mites Allergization level: The allergization level to dust mite allergens was fixed at 2 µg per gram of dust (1). The scientific literature shows that some persons become sensitised to dust mites at a lower concentration but exposure to dust mite allergens does not cause a problem for almost 80% of the population. (1) Platts-Mills et al, Indoor allergens and asthma: Report of the Third International Workshop, Journal of Allergy and Clinical Immunology, vol 100. No. 6. 1997 Available reference values (for information): Norway: 1 µg of Der p 1 per gram of dust 50 dust mites per gram of dust Median values for dust mite allergens are equal to 2.2 and 1.6 µg/g respectively for Der f 1 and Der p 1. Maximum values are as high as 608 µg/g (Der f 1) and 130 µg/g (Der p 1). These median values remain low compared with the values listed in the literature. Half of all dwellings exceed the allergization value of 2µg/g of dust (IC95% = [45.5-56.4%] for Der f 1 and IC95% = [40.5-50.9%] for Der p 1). 2.5 PARTICULATE MATTER Observation conditions
– air suction, filtering and impaction, analysis in laboratory; – location: living room; – collection duration: from 17h to 8h during weekdays and 24h per day during the week-end
during the week of the inquiry.
Elements of the literature Potential emission sources: outdoor air, cooking activities associated with use of a baking oven and a cooking hob, cleaning activities and surface cleaning activities, tobacco smoke, etc.
Outdoor air quality criteria: 30 µg/m3 (annual average), quality objective 40 µg/m3 (annual average), limiting value 50 µg/m3 (90.4 percentile of daily averages to be exceeded not more than 35 d/year), limiting value. The median of PM10 values is greater than the PM2.5 values (31.3 and 19.1 µg/m3 respectively) in dwellings. The maximum values exceed 500 µg/m3 in the two cases (522 µg/m3 for PM10 and 568 µg/m3 for PM2.5). 2.6 RADON Observation conditions

�
�������������� ��������� ����������������� ������������ '(���������������� ����������������������������������� �
–collection on integrated badge over 2 months and analysis in laboratory; – location: living room and bedroom
Measurement uncertainties Measurement uncertainties depend on the concentration and dosimeter exposure time (see part 1.4)
Elements of the literature Potential emission sources: natural radioactive gas originating from the ground (former rock masses) and to a lesser extent from outdoor air and very specific construction materials Available reference values (for information): France (joint DGS circular No.99-46 and DGUHC/QC/10 No. 99-32 dated 27/01/1999 for buildings open to the public) between 400 and 1000 Bq/m3: simple corrective actions > 1000 Bq/m3: fast and essential corrective actions
Norway: between 200 and 400 Bq/m3: simple actions > 400 Bq/m3: corrective actions < 200 Bq/m3 in new buildings
Finland: 100 Bq/m3 (S1), 100 Bq/m3 (S2), 200 Bq/m3 (S3)
Canada: 800 Bq/m3 (annual average) Australia: 200 Bq/m3 (annual average)
Indoor radon concentrations depend on seasonal variations. The Nuclear Radiation Shielding and Safety Institute corrects seasonal variations of measurement results32 derived from short term collections, to make an unbiased estimate of the average annual concentration and exposure of the population to radon.
• Raw measurements without correction for the seasonal effect Characteristics of radon concentration distributions (Bq/m3):
Distributions of dwellings as a function of radon concentrations (Bq/m3) without correction for the seasonal effect in bedrooms (top figure) and other rooms (bottom figure) in dwellings Median values are equal to 31 Bq/m3 in bedrooms and 33 Bq/m3 in other rooms. Maximum values are 1115 Bq/m3 in bedrooms and 1983 Bq/m3 in other rooms.
• Measurements after correction for the seasonal effect
The IRSN applies a correction factor to raw data to take account of seasonal variations in the radon concentration.
Characteristics of distributions of radon concentrations (Bq/m3) after correction for the seasonal effect in bedrooms (bedroom, studio) and other rooms (kitchen, open plan kitchen, lounge, living room) in dwellings:
Distributions of dwellings as a function of radon concentrations (Bq/m3) corrected for seasonal variations in bedrooms (figure below) and other rooms (adjacent figure) in dwellings Median values are 31 Bq/m3 in bedrooms and 33 Bq/m3 in other rooms. They are slightly lower than values measured by the IRSN in France between 1982 and 2000. Maximum values (1215 Bq/m3 in the bedroom and 2161 Bq/m3 in other room) were measured in the same dwelling.
6(�D�������@#!�D������=#!�2�������#!�3������#�E�$���������B#!�=�������������� ������� ���������� ��� �����������+���������
�������������������!��������� ����'��� :������)!�(..6#�F��#�&.0!�>�#�6#���#�(0�*(�(�

�
�������������� ��������� ����������������� ������������ '6���������������� ����������������������������������� �
During the survey, two measurements (out of 457 observations) made in bedrooms and four measurements (out of 449 observations) made in other rooms were between 400 and 1 000 Bq/m3. One measurement in each group of rooms exceeded 1 000 Bq/m3.
2.7 GAMMA RADIATION
Observation conditions – location: living room – collection duration: at least 45 minutes during the visit.
Elements of the literature Potential emission sources: ground and atmospheric (cosmic and terrestrial radiation), construction materials Average concentration levels (µSv/h) in indoor air in buildings in France: National weighted average on dwellings = 0.054 µSv/h (IRSN, 2002)
Characteristics of the distribution of gamma radiation (µSv/h) indoor dwellings:
Distributions of dwellings as a function of gamma radiation levels (µSv/h) indoor dwellings The median value of gamma radiation in dwellings is equal to 0.062 µSv/h and the maximum value is equal to 0.264 µSv/h.
2.8 TEMPERATURE
Observation conditions – recording instrument; – location: bedroom and living room; – collection duration: recorded every 10 minutes during the week of the inquiry.
Elements of the literature Comfort parameter that can be the cause of pollutants occurring (dust mites, mould, etc.)
Temperature characteristics (°C) in bedrooms (bedroom or studio) and other rooms (Open plan kitchen, kitchen, lounge, living room) of dwellings: The median temperature in bedrooms and other rooms is about 21°C. The temperature range is greater in bedrooms (5.4 – 29.5°C) than in other rooms (12.5 – 29.2°C).
�
�������������� ��������� ����������������� ������������ '0���������������� ����������������������������������� �
2.9 RELATIVE HUMIDITY
The relative humidity varies from 25.5% to 72.8% in bedrooms with a median equal to 48.7%. In other rooms, it varies between 21.1% and 80.8% and the median value is approximately equal to 49.5%. 2.10 CARBON DIOXIDE
Measurement uncertainties – 1 500 ± 67 ppm (see part 1.4)
Elements of the literature Comfort parameter, CO2 is emitted by room occupants Available reference values (for information): France: 1 000 ppm in tertiary buildings
Characteristics of distributions of carbon dioxide concentration (ppm) indoor dwellings:
Distributions of dwellings as a function of: - carbon dioxide concentration (ppm) averaged over a week - sliding 1-hour average concentrations in carbon dioxide (ppm) - the average of the 60 largest carbon dioxide CO2 contents between 2h and 5h10
(ppm) Median values of CO2 concentrations are equal to 756 ppm for averages over the week, and 1 689 ppm using the maximum of sliding 1-hour average values, and 1 161 ppm for values measured at night. Maximum values are very high, reaching 6 000 ppm particularly during occupancy periods (during the night between 2h and 5h10)

�
�������������� ��������� ����������������� ������������ '����������������� ����������������������������������� �
�
.� , �,#'�� ��
The inventory of air quality in dwellings located in mainland France was produced based on a national measurements survey carried out in 567 dwellings investigated between October 2003 and December 2005. There is a specific feature about indoor air quality in dwellings that is different from outdoor air quality, and that is expressed particularly by the presence of some substances not observed outdoors or by significantly higher concentrations indoors. The pollutants involved are present in quantifiable levels in most investigated dwellings. The distribution of organic chemical pollution is not uniform in the investigated dwellings. Only a minority of dwellings (9%) have very high concentrations of several pollutants at the same time; conversely, 45% of dwellings have very low concentration levels for all measured pollutants. Depending on the pollutant, between 5 to 30% of dwellings have values significantly higher than average concentrations found in the investigated dwellings.
� Chemical compounds:
Volatile organic compounds • Volatile organic compounds are detected in 2.3% (2-butoxy-ethylacetate) to
100% (acetaldehyde, formaldehyde, hexaldehyde, toluene, m/p xylene) of dwellings depending on the compounds. Concentrations inside 50% of dwellings are less than 20 µg/m3. Several maximum values exceed 100 µg/m3 or even 1 000 µg/m3 (two maximum values are greater than 4 000 µg/m3).
• The percentage of French dwellings in which contents of volatile organic compounds (apart from glycol ethers) are higher inside the dwelling than outdoors varies between 68.4% (trichloroethylene) and 100% (formaldehyde and hexaldehyde).
• Median concentration values (namely 50% of situations) of several volatile organic compounds are greater in garages communicating directly with dwellings than the corresponding values measured in all dwellings. In particular, this is true for benzene (4.4 µg/m3 in garages compared with 2.1 µg/m3 in dwellings), toluene (110.4 µg/m3 compared with 12.2 µg/m3), ethylbenzene (18 µg/m3 compared with 2.3 µg/m3), m/p-xylenes (58.9 µg/m3 compared with 5.6 µg/m3), o-xylenes (20.8 µg/m3 compared with 2.3 µg/m3), n-decane (10.8 µg/m3 compared with 5.3 µg/m3), n-undecane (8.6 µg/m3 compared with 6.2 µg/m3), 1.2.4 trimethylbenzene (18.7 µg/m3 compared with 4.1 µg/m3) and styrene (1.2 µg/m3 compared with 1.0 µg/m3).
• Analysis of the different volatile organic compounds shows that there is a variety of situations (see summary tables at the end of the summary description): * Aldehydes are among the most frequent and most concentrated
molecules in dwellings. Thus, these compounds are observed in 99.4 to 100% of dwellings depending on the compound, acetaldehyde, formaldehyde and hexaldehyde are observed in all dwellings. Concentrations in 50% of dwellings exceed values varying from 1.1 µg/m3 (acrolein) to 19.6 µg/m3 (formaldehyde). Indoor concentrations in 5% of dwellings are greater than values varying from 3.4 µg/m3 (acrolein) to 50.1

�
�������������� ��������� ����������������� ������������ ''���������������� ����������������������������������� �
µg/m3 (hexaldehyde). Concentrations in outdoor air at 95% of dwellings are lower than values varying from 0.5 µg/m3 (acrolein) to 3.6 µg/m3 (formaldehyde). Formaldehyde is the volatile organic compound with the highest mass found in dwellings.
* Hydrocarbons are frequent (detection in 83 to 100% of dwellings depending on the compounds), and two hydrocarbons (toluene and m/p xylene) are observed in all dwellings. Concentrations in 50% of dwellings are higher than values varying from 1 µg/m3 (styrene and trichloroethylene) to 12.2 µg/m3 (toluene). Concentrations in 5% of dwellings are greater than values varying from 2.7 µg/m3 (styrene) to 150 µg/m3 (1.4-dichlorobenzene). Concentrations in outdoor air at 95% of dwellings are less than values varying from 0.7 µg/m3 (styrene) to 12.9 µg/m3 (toluene).
* Glycol ethers are relatively infrequent (detection in 2.3 to 85% of dwellings depending on the compound). Concentrations in at least 50% of dwellings are less than detection limits for 2-butoxyethylacetate and 1-methoxy-2-propylacetate. Indoor concentrations in 50% of dwellings are higher than 1.6 µg/m3 for 2-butoxyethanol and 1.9 µg/m3 for 1-methoxy-2-propanol. Values for 5% of dwellings varying from undetectable (2-butoxyethylacetate) to 17.5 µg/m3 (1-methoxy-2-propanol). Concentrations of all measured glycol ethers in outdoor air are less than either the detection limit (2-butoxyethylacetate and 1-methoxy-2-propylacetate) or the quantification limit (1-methoxy-2-propanol and 2-butoxyethanol) for 95% of dwellings.
Carbon monoxide • In the vast majority, carbon monoxide levels are close to zero in the
different rooms in dwellings. Values in some dwellings are higher depending on the exposure times considered. Depending on the rooms considered, the maximum observed values vary from 130 to 233 ppm for 15 minutes, from 91 to 175 ppm for 30 minutes, from 53 to 120 ppm for 1 hour, from 31 to 43 ppm for 8 hours, and values in service rooms (kitchens, bathrooms, WC) are the highest for 15 minutes, 30 minutes and 1 hour.
� Biological pollutants: • Contents of cat allergens (Fel d 1) and dog allergens
(Can f 1) are higher than the quantification limit in 50% of dwellings. 5% of dwellings have concentrations higher than 2.7 ng/m3 for cat allergens and higher than 1.6 ng/m3 for dog allergens.
• For dust mite allergens, 50% of dwellings have contents higher than 1.6 and 2.2 µg/g for Der p 1 and Der f 1 respectively. Contents exceed 83.6 µg/g for Der f 1 and 36.2 µg/g for Der p 1 in 5% of all dwellings.
� Physical parameters: • Contents of particulate matter are higher than 19.1 µg/m3 for PM2.5 and 31.3
µg/m3 for PM10 in 50% of dwellings. 5% of dwellings have concentrations higher than 133 µg/m3 for PM2.5 and 182 µg/m3 for PM10.
• 50% of dwellings have radon contents higher than 31 Bq/m3 in bedrooms and higher than 33 Bq/m3 in other rooms (with or without correction for seasonal variations). In 5% of dwellings, radon concentrations corrected for seasonal

�
�������������� ��������� ����������������� ������������ '"���������������� ����������������������������������� �
effect are higher than 220 Bq/m3 in bedrooms and 194 Bq/m3 in other rooms (225 and 214 Bq/m3 respectively without correction).
• Gamma radiation is higher than 0.062 µSv/h in 50% of French dwellings and exceeds 0.1 µSv/h in 5% of dwellings.
� Comfort parameters: • The temperature is higher than 21°C in 50% of French dwellings while 5% of
dwellings have a temperature higher than 25.5°C in bedrooms and 24.8°C in other rooms. The temperature amplitude is higher in bedrooms (5.4°C – 29.5°C).
• The relative humidity is greater than 49% in 50% of dwellings. The relative humidity in 5% of dwellings exceeds 63.1% in bedrooms and 64.7% in other rooms.
• 50% of dwellings have average values of carbon dioxide concentrations exceeding 756 ppm over a week, 1 689 ppm assuming the maximum of average sliding values over 1 hour and 1 161 ppm for values measured during the night. In 5% of dwellings, the medium concentration of CO2 over one week is greater than 1 484 ppm, the maximum during an hour exceeds 4 449 ppm and the maximum values during the night exceed 3 175 ppm.
These results were compared with recommended values available for the same exposure time step. Apart from the case of radon and asbestos, there are no guide values in France to quantify the number of dwellings exceeding concentration levels that could cause effects on health. Depending on the compound, a variable number of dwellings have contents exceeding the rare comparable recommended values available in other countries.
A comparison was made between recommended values and data measured in dwellings during the same exposure time:
Carbon monoxide About 2%, 2.6%, 4.3% and 6.4% of existing dwellings exceed values fixed by the WHO over 15 minutes (87 ppm), 30 minutes (52 ppm), 1 hour (26 ppm) and 8 hours (9 ppm) respectively. Exceedances are distributed as follows for each room category:
Main rooms (office, open plan kitchen, bedroom, studio, lounge, living room), n=543: o 1 dwelling exceeds the reference value over 15 minutes (87 ppm); o 2 dwellings exceed the reference value over 30 minutes (52 ppm); o 9 dwellings exceed the reference value over 1 hour (26 ppm); o 21 dwellings exceed the reference value over 8 hours (9 ppm);
Other rooms (kitchen, bathroom, WC, indoor passageways in the dwelling), n=202:
o 1 dwelling exceeds the reference value over 15 minutes (87 ppm); o 3 dwellings exceed the reference value over 30 minutes (52 ppm); o 8 dwellings exceed the reference value over 1 hour (26 ppm);

�
�������������� ��������� ����������������� ������������ ',���������������� ����������������������������������� �
o 10 dwellings exceed the reference value over 8 hours (9 ppm);
Annexes (cellar, boiler room, utility room, veranda, laundry room, garage communicating with the dwelling), n=157:
o 5 dwellings exceed the reference value over 15 minutes (87 ppm); o 6 dwellings exceed the reference value over 30 minutes (52 ppm); o 8 dwellings exceed the reference value over 1 hour (26 ppm); o 9 dwellings exceed the reference value over 8 hours (9 ppm);
Radon In France33, radon values between 400 and 1 000 Bq/m3 in buildings open to the public require simple corrective actions. For values greater than 1 000 Bq/m3, compulsory corrective actions must be made. A comparison between the concentrations corrected for seasonal variations and these reference values shows that:
* 2 measurements made in bedrooms out of 457 observations and 4 measurements made in other rooms out of 449 observations are between 400 and 1 000 Bq/m3.
* 1 measurement in each of these groups of rooms exceeds 1 000 Bq/m3.
Volatile organic compounds A comparison between concentration levels and existing reference values during the same exposure time shows:
* for formaldehyde: a few % up to about a quarter of existing dwellings exceed guide values available in other countries for comparable exposure time steps, namely 50µg/m3 (Canada, Texas) and 30 µg/m3 (European INDEX project, Finland, Hong Kong) respectively. A comparison with the lower range proposed by the European Index project (ALARA (As Low As Reasonably Achievable) principle) shows that a larger percentage could be concerned;
* for styrene: one dwelling out of the 541 observations exceeds the German reference value fixed at 30 µg/m3 (IC95% = [0% – 1.2%]);
* for toluene: one dwelling out of the 541 observations (IC95% = [0% – 0.8%]) and 37 garages communicating with the dwelling out of 139 observations (IC95% = [21.3% – 37.6%]) have an indoor concentration greater than 260 µg/m3 (WHO reference value).
Dust mite allergens Half of the dwellings exceed the allergization threshold value of 2 µg/g of dust (IC95% = [45.5% – 56.4%] for Der f 1 and IC95% = [40.5% – 50.9%] for Der p 1). It has been shown that above this threshold value, there is a risk that some persons might produce allergy antibodies (Platts-Mills et al, 199734). The scientific literature shows that exposure to dust mite allergens does not cause any health problem for almost 80% of the population.
66�;��� ��<=���������>�#�--*0'������<?@7878&.�>�#�--*6(��� ���("8.&8&---�
60������������� � ���� ���� ����� � � � ������� ����� �� �������� �� ���� �����������;���������������������
7���������������������������� ��!!"�

�
�������������� ��������� ����������������� ������������ '-���������������� ����������������������������������� �
This inventory is the first available reference on indoor air quality in French dwellings and cannot be compared with a previous situation because it is the first. Nevertheless, levels observed are similar to those found by isolated studies in France and in major international surveys. This inventory will be complemented in early 2007 by including fungal contamination levels and the presence of humidity (data currently being validated). The results of this survey are currently being interpreted by health agencies and the authorities will use them to get a better idea of health risks associated with indoor air pollution and to define what measures (if any) should be taken for protection of the population. Detailed information collected at the same time on technical characteristics of dwellings and their environment and on households, activities and time spent in contact with pollution are expected for the beginning of year 2007.


�
�������������� ��������� ����������������� ������������ "&���������������� ����������������������������������� �
�� �,�� ���� ���,���
The search for risk factors (pollution sources, dwelling types, ventilation conditions, behaviours, seasons, geographic situation, etc.) will be initiated in early 2007 as soon as all descriptive data have been made consistent and validated. The early work will concern classification of dwellings with regard to concentrations of the different pollutants and a search for determinants of formaldehyde, humidity and mould present in dwellings. An attempt will also be made to produce indoor air quality indexes that can be used to provide information and to take action on air quality. An action program is thus initiated to make use of data in the national Dwellings survey. It applies particularly to: * Correction and validation of descriptive data (dwellings, equipment,
decoration elements, presence of mould or humidity, description of households and their activities, space time activity budget) in the national survey and processing of missing values: like pollutant measurement data, all data derived from the different questionnaires will be examined in order to test the quality and consistency of data and to retrieve a maximum of missing data (deterministic and statistical data processing) so as to achieve a complete raw data base that can be used directly for interpretation of data. This work will be continued by the construction of relevant combined variables for statistical studies to be carried out.
* An estimate of French household exposures to indoor air pollution: a
methodological work was initiated by the InVS35 in 2003 to develop means of estimating exposure to pollutants from data collected in the national Dwellings survey. The exposure of households to pollution in French dwellings will be estimated based on this work and complete data obtained from the national Dwellings survey (concentration levels and space time activity budgets).
- Production of the descriptive inventory of existing dwellings with regard
to elements collected on dwellings and households; univariable descriptive analyses of responses to questionnaires will be made to factually describe the existing dwellings and occupying households. This work will also include specific use of collected parameters in relation to ventilation in dwellings so as to have the most complete possible descriptive inventory of the ventilation. For this point, a general study will be made based on flat sorts to evaluate ventilation conditions as a function of typologies of ventilation systems and will be followed up later by a study concentrating on some records in the database to evaluate air renewal in the bedroom over the entire week and no longer during the night occupancy period only. Finally, a complementary study on risks of condensation in dwellings will also be made.
* Production of a typology of dwellings and behaviours of households
(grouping of dwellings/households with similar characteristics); a detailed classification of existing dwellings / households, also taking account of the characteristics of buildings, equipment, furniture, interior decoration
6��M��������� ���!����!��� �������� �������������(..6#��7=$D8���8=D�(..�*.&(������ !����������(..0�
�
�������������� ��������� ����������������� ������������ "(���������������� ����������������������������������� �
(upholstery type, presence of plants, etc.) and the households occupying these dwellings (number of persons, income, lifestyle related to cleaning, use of household products or body care products, etc.) will be produced in order to facilitate the interpretation of results obtained on determinants. It will include the use of multi-dimensional analyses and topological maps. This work will be done following the feasibility study on a partial sample made within the framework of a Master's course in Information Processing and Interpretation of Data, carried out jointly by the LOCEAN Laboratory36, the AFSSET and CSTB.
* The systematic search for pollution factors (construction and consumption
products, characteristics of the dwelling, humidity, ventilation condition, behaviour of occupants, seasons, geographic situation, etc.); already initiated for formaldehyde and the presence of humidity and mould in dwellings within the framework of feasibility studies to test methodological approaches37, this work will be done in priority on these three parameters. It will consist of cross-referencing each pollution data with detailed information collected at the same time on technical characteristics of dwellings and behaviour of the occupants. The result of these analyses will be used to develop a proposal for the choice of policies to be implemented in this field (limitation of product emissions, technical regulations, advice to occupants, etc.).
* Classification of dwellings with regard to concentration levels: typologies
of dwellings/households with pollution risks will be searched for based on the previous work.
* Production of indoor air quality indexes: these indexes are given to the
different participants who are not specialists on air quality in buildings (building managers), with the purpose of facilitating communication (information, awareness) and management of indoor air quality and monitoring progress made. The work is initiated and is done by a specific workgroup. A critical analysis of existing indexes was made and optional means of creating indexes (choice of scales for application of the index, search for sub-indexes, reference values, etc.) are currently being defined. This work is directly related to the availability of previous data processing (particularly relation between the presence of compounds and descriptive data) and will be done in liaison with the players concerned by the use of these indexes.
* Specific work on socio-economic factors: a specific interpretation of the
data will be made with the expertise of human sciences in order to broaden the search for technical risk factors particularly on socio-economic aspects related to households and the organisation of living areas. A special workgroup will be set up by the end of the year to define policies to be adopted based on data collected during the national survey.
6'� 2����� ����� �N��O����������� � � �� 7���� � /+�O����� � ���� � � ���������� >�O������ %�������������� ���� 7���� ��
������ ���� */+������� � ����E����� �������������)���I��� ������������ ��������� ���� ���7>3=!�H������� �B�����7����
������� ��%H�����F�)����� ����3��%��� � ����3�����������������O���������� ������ � �����3���������������������� )!�
6"��� ����� � ������� ����������������������!��������������� ������� �������������������� �������� ���������!�������� ����
������ ����� �������������������!�B�����(�(..'�

�
�������������� ��������� ����������������� ������������ "6���������������� ����������������������������������� �
Studies are also planned in cooperation with external partners:
* Evaluation of health risks associated with pollution levels in dwellings; the
inventory of indoor air quality considering all existing French dwellings is now available for evaluation of any health risks that might be associated with these pollution levels, on the national scale.
* Production of guide values for indoor air: directly useful to evaluate the
relevance of guide values currently being prepared at the AFSSET within the framework of a workgroup co-piloted by CSTB, the inventory of indoor air quality will also be helpful in quantifying the number of French dwellings in a critical situation with regard to these guide values and can be used as a basis for determining prevention actions.
* Allergic and respiratory health: the descriptive analysis of the inventory of
the population in terms of asthma and allergy is currently being prepared by the INSERM. These first interpretations will be completed by the study of associations between allergic health and respiratory health indicators and exposure to pollutants and a geographic analysis of data (descriptive spatial epidemiology).
* Specific analysis of carbon monoxide levels in alveolar air: the InVS is
currently coordinating the interpretation of data collected on CO in alveolar air with the objective of (1) studying instantaneous impregnation of the population with carbon monoxide, (2) estimating the prevalence of chronic intoxication by CO, (3) estimating the relation between firstly impregnation with CO, CO levels measured in the atmosphere and the existence of active and passive smoking, and (4) evaluating the feasibility of setting up inquiries in order to prevent acute intoxications caused by a high level of CO in expired air.
* Specific analysis of radon and gamma radiation data: The InVS is
currently coordinating the analysis of data related to radon and gamma radiation in liaison with the IRSN, to study the correlation of radon with gamma radiation and the correlation of radon with factors that can have an influence on the radon concentration (poor ventilation, smoking, characteristics of the dwelling).


�
�������������� ��������� ����������������� ������������ "����������������� ����������������������������������� �
APPENDICES
APPENDIX 1
DISTRIBUTION OF THE 567 DWELLINGS INVESTIGATED BETWEEN OCTOBER 1 2003 AND DECEMBER 21 2005
�

�
�������������� ��������� ����������������� ������������ "'���������������� ����������������������������������� �
�����$�:�-�
SUMMARY DESCRIPTION OF THE NATIONAL DWELLINGS SURVEY
SITE TYPES: 567 dwellings (main residences) SAMPLING: spot checks at three levels (communes, land register sections, dwellings) to give the same final
probability that each main residence may be drawn at random. COLLECTED DATA DESCRIPTION OF BUILDINGS AND THEIR ENVIRONMENT: Dwellings: general situation and external environment, physical characteristics of the building, dwelling size,
dependences, heating, plumbing fixture, dwelling ventilation, works, description of rooms. DESCRIPTION OF HOUSEHOLDS AND THEIR ACTIVITIES: Households: composition, installation in the dwelling, occupancy status, current occupancy, activities, net resources, etc.Time spent and associated activities: - Weekly: time step 10 min every day of the week (frequented locations). - Logbooks: time step 10 min, one day of the week (frequented locations and activities). Respiratory and allergic health indicators (occupants � 15 years old): questions based on work done by the ECRHS (European Community Respiratory Health Survey) and the SFAR (Score For Allergic Rhinitis).
MEASUREMENT LEVELS Parameters measured indoors and outdoors on investigated sites with specific sampling strategies:
� Animal allergens: cat allergens (Fel d 1) and dog allergens (Can f 1) in air and dust mite allergens (Der p 1. Der f 1) in mattress dust
� Carbon monoxide (CO): in the environment and in expired air (occupant � 6 years old)
� Volatile organic compounds (VOC) and aldehydes Aromatic hydrocarbons: benzene, toluene, m/p xylene, o-xylene, 1.2.4- trimethylbenzene, ethylbenzene,
styrene, Aliphatic hydrocarbons: n-decane, n-undecane Halogenated hydrocarbons: trichloroethylene, tetrachloroethylene, 1.4-dichlorobenzene Glycol ethers: 2PG1ME (1-metoxy 2-propanol ) and its acetate, EGBE (2 butoxyethanol) and its
acetate Aldehydes: formaldehyde, acetaldehyde, hexaldehyde, acrolein
� Inert particulate matter: PM10. and PM2.5 � Radon and Gamma radiation
MEASURED COMFORT / CONFINEMENT PARAMETERS � Carbon dioxide (CO2) � Temperature and relative humidity � Extracted air flow at ventilation openings on special duct
IDENTIFICATION OF ELEMENTS REQUIRING A CO DIAGNOSTIC Procedure applied immediately on entrance into dwellings equipped with combustion equipment to mark elements requiring a "carbon monoxide" diagnostic and to avoid acute intoxication situations: measurement of CO in all combustion equipment and descriptive questionnaires completed by the investigating technician during the two visits to the dwelling.

�
�������������� ��������� ����������������� ������������ ""���������������� ����������������������������������� �
�
Appendix 3
DATA COLLECTION PROTOCOLS
Parameters Collection and analysis Collection location Collection duration
VOC
collection on passive tube and analysis in laboratory
bedroom, outdoors, adjacent garage (except aldehydes)
integrated over the week
Environmental CO recording instrument
living room, outdoors, all rooms with combustion equipment
every 5 minutes during a week
CO in alveolar air instantaneous measurement
all volunteer occupants more than 6 years old, during visits
Occasional (a few seconds), during the first and second visit to the dwelling
Radon collection on badge and analysis in laboratory
bedroom and living room
integrated over 2 months
Gamma radiation instantaneous measurement living room occasional (minimum
45 minutes)
Allergens (dust mites, cat and dog)
air or dust suction, extraction then analysis in laboratory
living room (air – cat and dog) bedroom (mattress dust in the investigated bedroom – dust mites)
occasional (5 to 10 min for dust mites, 1h for cat allergens and dog allergens)
Inert particulate matter (PM2.5 and PM10)
suction of air, "filtration and impaction" then analysis in laboratory
living room from 17h to 8h during days of the week and 24h at the WE
CO2 recording instrument bedroom every 10 minutes for a
week
Temperature and relative humidity
recording instrument
bedroom and living room
every 10 minutes for a week
Extracted air flows instantaneous measurement
Accessible air extraction openings from natural ventilation or forced ventilation systems
occasional (instantaneous)


�
�������������� ��������� ����������������� ������������ "-���������������� ����������������������������������� �
APPENDIX 4
QUALITY ASSURANCE: ESTIMATED REPRODUCIBILITY ACCORDING TO INDOOR
AND OUTDOOR REPLICAS
Values shown in grey are below quantification limits.
APPENDIX 5
QUALITY ASSURANCE: MEASUREMENT UNCERTAINTIES
Values shown in grey represent values outside the calibration range. The uncertainty calculation does not take account of the approximation made by extrapolation beyond the measurement range. Consequently, measurement uncertainties related to these values are underestimated#�
�
�

�
�������������� ��������� ����������������� ������������ ,.���������������� ����������������������������������� �
� APPENDIX 6
METHOD OF CALCULATING 95% CONFIDENCE INTERVALS FOR PERCENTILES
Symmetric 95% bilateral confidence intervals (confidence level) for the P10. P25. P50 (median), P75. P90 and P95 percentiles are determined taking account of the specific features of the OQAI inquiry on indoor air quality in dwellings:
� dwellings were sampled by draw without the use of several degrees with a probability proportional to the size (number of main residences);
� quantile intervals that correspond to binomial proportions cannot be
determined by approximation of a normal law (ends of the distribution, number of observations).
Percentile confidence intervals were determined in three steps. Step 1: The first sampling degree is the draw of 74 communes, including 63 communes distributed between 32 groups (intersection of eight geographic zones and four sizes of urban unit) and eleven communes with more than 100 000 main residences in 2001 (source FILOCOM). These communes form the primary statistics units. The final sample means that 41 first degree strata are retained. For a percentile, the standard deviation sep of the corresponding proportion p is estimated by a Taylor linearisation (CLAN 97) on the sample. The "effective sample size" is determined to take account of the survey method using several degrees38. Step 2: Three methods were used to determine a confidence interval of the proportion p using the effective sample size:
– the Clopper-Pearson interval; – a modified Jeffreys interval; – the Agresti-Coull interval; – the Wilson interval.
The Agresti-Coull interval39 will be used, considering the effective number of observations. However, note that the four intervals are usually very similar. Step 3: The limits of percentiles are determined by looking for values that correspond to the low and high proportions of the interval determined in the previous step.
6,� =��� M���� /#� 2#!� <������� D#� �#� %&--,)A� 7���������� �� ������� ���� H����� ����� �� �� F���� =����� /+��� ���
>����� ��� H��� ���� 7�� �� /� ��� ��� ����� 7�����+� =����� �� �!� ?�/� �� �� �� +���'� #�������'��
+���'����� !�,6#�(6&*(0&#�6-=���D�����2#�D#!�7���$#�$#��������<� ���#�%(..&)A��� ������/� ��� ����������D��������H����� ���!�#�������'��
#'� '!�F��#�&'!�>�#�(!�&.&*&66#�

�
�������������� ��������� ����������������� ������������ ,&���������������� ����������������������������������� �
� APPENDIX 7
DATA FROM THE NATIONAL AND INTERNATIONAL LITERATURE
Sources and references: - Luc Mosqueron, Vincent Nedellec « Inventaire des données françaises sur la
qualité de l'Air Intérieur des bâtiments: actualisation des données sur la période 1990-2001 - (Inventory of French data on indoor air quality in buildings: update of data during the 1990-2001 period)». CSTB DDD/SB-2002-23. December 2001.
- Luc Mosqueron, Vincent Nedellec « Inventaire des données françaises sur la
qualité de l'Air Intérieur des bâtiments: actualisation des données sur la période 2001-2004 - (Inventory of French data on indoor air quality in buildings: update of data during the 2001-2004 period) ». CSTB DDD/SB-2004-44. October 2004.
- Luc Mosqueron, Vincent Nedellec « Revue des enquêtes sur la qualité de l'Air
Intérieur dans les logements en Europe et aux Etats-Unis – (Review of inquiries on indoor air quality in dwellings in Europe and in the United States ». CSTB DDD/SB-2004-45. October 2004.
�

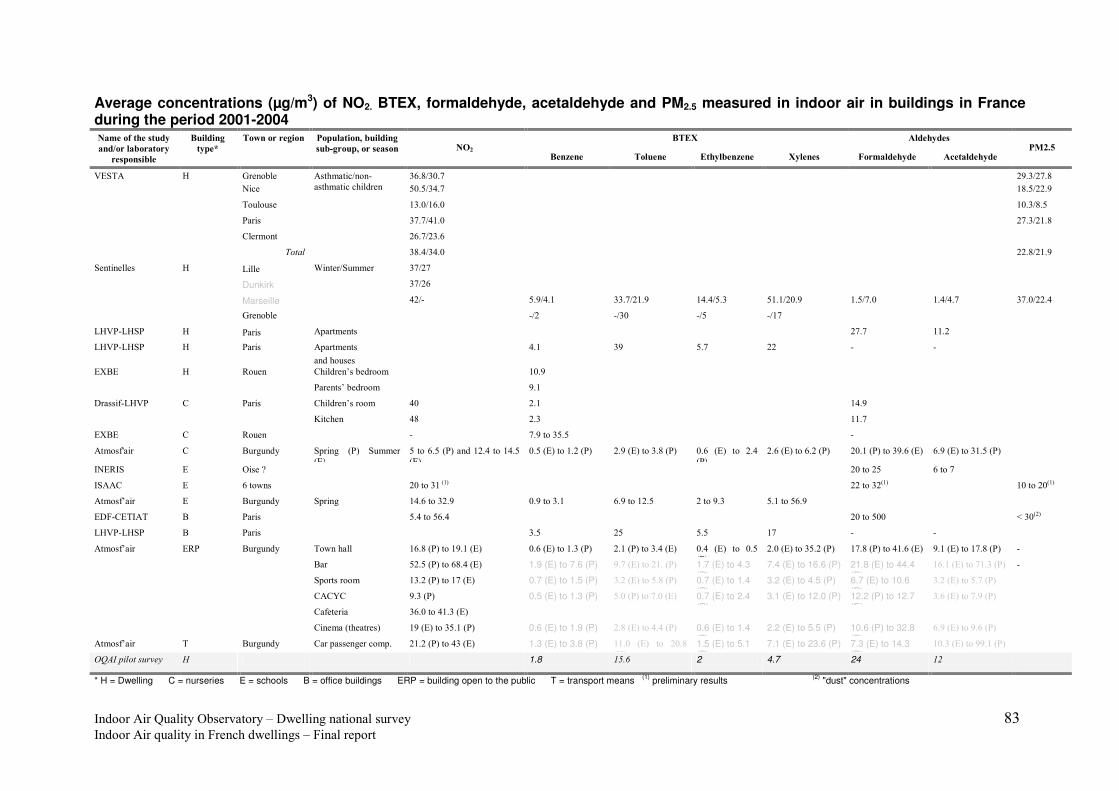
�
�������������� ��������� ����������������� ������������ � � � � � � � ,6���������������� ����������������������������������� �
Average concentrations (µg/m3) of NO2. BTEX, formaldehyde, acetaldehyde and PM2.5 measured in indoor air in buildings in France during the period 2001-2004
;��:� �1� 5�� ����� ��3��5 �������
���<���1�=��������
� ������=1 ��
;��1���2�
��� >�
��4������ 2���� ����1�����?�=��1���2�
��=@2����?����� ����� � -�; �A � � ��1� � � ��5�1= �A � � :�1 � �� !����1� 5�� � �� ��1� 5�� �
�+ -���
F/=$�� @� <�������� 6'#,86.#"� � � � � � � (-#68("#,�
� � >���� �.#�860#"� � � � � � � &,#�8((#-�
� � $������
�� ��� ��8���*
�� ��� ������������
&6#.8&'#.� � � � � � � &.#68,#��
� � H����� � 6"#"80&#.� � � � � � � ("#68(&#,�
� � 7������ � � ('#"8(6#'� � � � � � � �
� � ����� � 6,#0860#.� � � � � � � ((#,8(&#-�
=�� �������� @� 2����� J�� ��8=����� 6"8("� � � � � � � �
� � Dunkirk � 6"8('� � � � � � � �
� � Marseille � 0(8*� �#-80#&� 66#"8(&#-� &0#08�#6� �&#&8(.#-� &#�8"#.� P#"� 6"#.8((#0�
� � <�������� � � *8(� *86.� *8�� *8&"� � � �
2@FH*2@=H� @� H����� ���� ��� �� � � � � � ("#"� &&#(� �
2@FH*2@=H� @� H����� ���� ��� ���
����������
� 0#&� 6-� �#"� ((� *� *� �
/PD/� @� 3���� 7�������N���������� � &.#-� � � � � � �
� � � H���� �N��������� � -#&� � � � � � �
�������*2@FH� 7� H����� 7�������N������� 0.� (#&� � � � &0#-� � �
� � � M� ����� 0,� (#6� � � � &&#"� � �
/PD/� 7� 3���� � *� "#-� ��6�#�� � � � *� � �
� ����Q���� 7� D������ =������ %H)� =�����
%/)�
�� ��'#��%H)�����&(#0� ��&0#��
%/)�
.#��%/)� ��&#(�%H)� (#-�%/)� ��6#,�%H)� .#'� %/)� �� (#0�
%H)�
(#'�%/)� ��'#(�%H)� (.#&�%H)� ��6-#'�%/)� '#-�%/)� ��6&#��%H)� �
�>/3�=� /� �����R� � � � � � � (.� ��(�� '� ��"� �
�=��7� /� '� ����� � (.� ��6&�%&)� � � � � ((� ��6(%&)� � &.� ��(.%&)�
� ����N���� /� D������ =������ &0#'� ��6(#-� .#-� ��6#&� '#-� ��&(#�� (� ��-#6� �#&� ���'#-� � � �
/��*7/$��$� D� H����� � �#0� ���'#0� � � � � (.� ���..� � S�6.%()�
2@FH*2@=H� D� H����� � � 6#�� (�� �#�� &"� *� *� �
� ����N���� /3H� D������ $��������� &'#,�%H)� ��&-#&�%/)� .#'�%/)� ���%H)� (#&�%H)� ��6#0�%/)� .#0� %/)� �� .#��
%H)�
(#.�%/)� ��6�#(�%H)� &"#,�%H)� ��0&#'�%/)� -#&�%/)� ��&"#,�%H)� *�
� � � D��� �(#��%H)� ��',#0�%/)� 1.9 (E) to 7.6 (P) -#"�%/)� ��(&#�%H)� 1.7 (E) to 4.3 (P)
7.4 (E) to 16.6 (P) 21.8 (E) to 44.4 (P)
&'#&�%/)� ��"�%H)� *�
� � � =��� ������� &6#(�%H)� ��&"�%/)� 0.7 (E) to 1.5 (P) 6#(�%/)� ���#,�%H)� 0.7 (E) to 1.4 (P)
3.2 (E) to 4.5 (P) 6.7 (E) to 10.6 (P)
6#(�%/)� ���#"�%H)� �
� � � 7�7T7� -#6�%H)� 0.5 (E) to 1.3 (P) �#.�%H)� ��"#.�%/)� 0.7 (E) to 2.4 (P)
3.1 (E) to 12.0 (P) 12.2 (P) to 12.7 (E)
6#'�%/)� ��"#-�%H)� �
� � � 7��� ����� 6'#.� ��0�%/)� � � � �
� � � 7������% ��� ���)� &-�%/)� ��6�#&�%H)� 0.6 (E) to 1.9 (P) (#,�%/)� ��0#0�%H)� 0.6 (E) to 1.4 (P)
2.2 (E) to 5.5 (P) 10.6 (P) to 32.8 (E)
'#-�%/)� ��-#'�%H)� �
� ����N���� $� D������ 7�����������������#� (&#(�%H)� ��06�%/)� 1.3 (E) to 3.8 (P) &&#.� %/)� �� (.#,�
%@)�
1.5 (E) to 5.1 (P)
7.1 (E) to 23.6 (P) 7.3 (E) to 14.3 (P)
&.#6�%/)� ��--#&�%H)� �
0>+�������/��) @ 1.8 �*� 2 4.7 24 �%
* H = Dwelling C = nurseries E = schools B = office buildings ERP = building open to the public T = transport means (1) preliminary results (2) "dust" concentrations
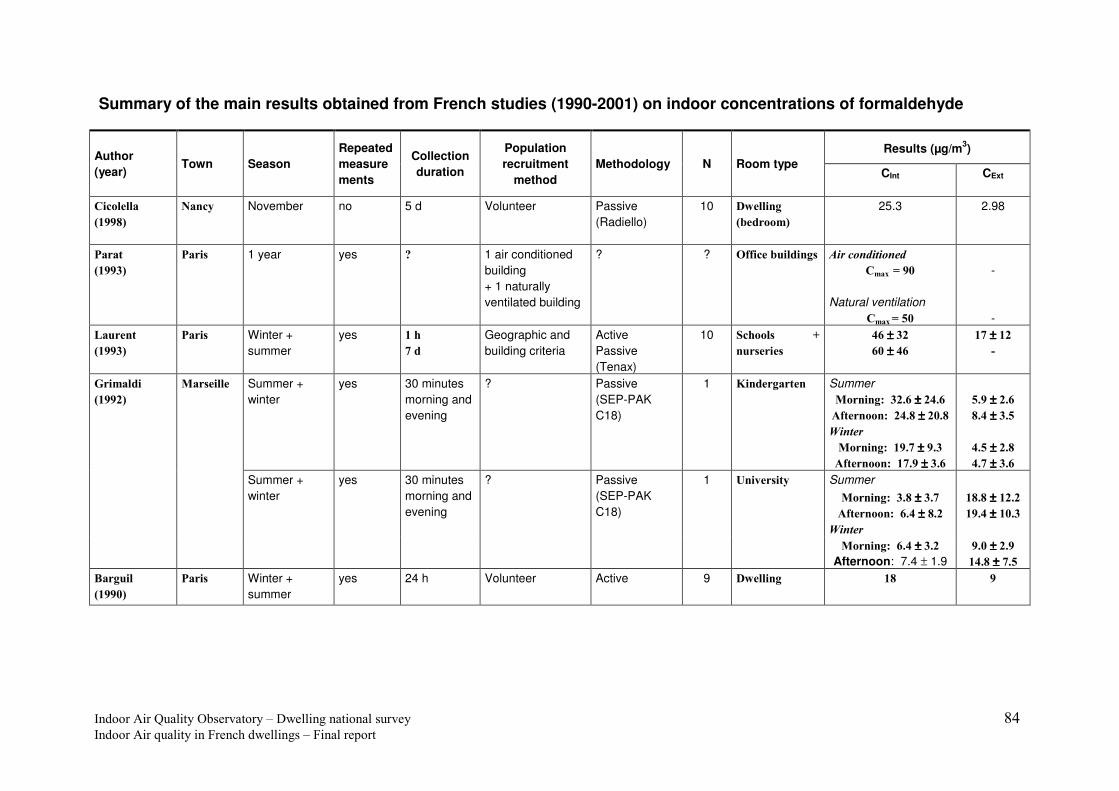
�
�������������� ��������� ����������������� ������������ � � � � � � � ,0���������������� ����������������������������������� �
Summary of the main results obtained from French studies (1990-2001) on indoor concentrations of formaldehyde
Results (µg/m3) Author (year)
Town Season Repeated measurements
Collection duration
Population recruitment
method Methodology N Room type
CInt CExt
,���1 11��
6�**07�
������ November no 5 d Volunteer Passive (Radiello)
10 $4 11��2�
6= �����7�
25.3 2.98
������
6�**.7�
������ 1 year yes B� 1 air conditioned building + 1 naturally ventilated building
? ? 33�� �=��1���2�� ����������������
,�����C�*��
�
Natural ventilation ,����C����
- -
#��� ���
6�**.7�
������ Winter + summer
yes ��5�
���
Geographic and building criteria
Active Passive (Tenax)
10 ��5��1�� D�
���� �� ��
��±±±±�.-���±±±±���
��±±±±��-�@�
Summer +�����2E��.-��±±±±�-����3� �����E��-��0�±±±±�-��0�
��*�±±±±�-��0���±±±±�.���
������ �
&����1���
6�**-7�
+��� �11 � Summer + winter
yes 30 minutes morning and evening
? Passive (SEP-PAK C18)
1 F��� �2��� ��
+�����2E���*��±±±±�*�.��3� �����E����*�±±±±�.��
����±±±±�-�0����±±±±�.��
Summer +�����2E��.�0�±±±±�.���3� �����E�����±±±±�0�-�
�0�0�±±±±��-�-��*���±±±±����.�
������ �
� � Summer + winter
yes 30 minutes morning and evening
? Passive (SEP-PAK C18)
1 '��9 ������
+�����2E�����±±±±�.�-�Afternoon: 7.4 ± 1.9
*���±±±±�-�*����0�±±±±����
;��2��1�
6�**�7�
������ Winter + summer
yes 24 h Volunteer Active 9 $4 11��2� �0� *�

�
�������������� ��������� ����������������� ������������ � � � � � � � ,����������������� ����������������������������������� �
�
Summary of the main results obtained from French studies (1990-2001) on indoor concentrations of Acetaldehyde
Results (µg/m3) Author (year)
Town Room type Season Repeated measurements
Collection duration
Population recruitment method
Methodology
N CInt CExt
,���1 11��
6�**07�
������ $4 11��2�� November No 5 d Non-smoking volunteers
Passive (Radiello)
10 24.1 1.99
������
6�**.7�
������ 33�� �=��1���2�� 1 year Yes ? 1 air conditioned building + 1 naturally ventilated building
? 2 Air conditioned Cmax = 50
Natural ventilation
Cmax = 20
- -
!�����
+�����2E������±±±±�����3� �����E����-�±±±±���.�
�
����±±±±�����0����±±±±��0��
������ �
&����1���
6�**-7�
+��� �11 � '��9 ������ Summer + winter
Yes 30 minutes morning and evening for 5 days
Passive (SEP-PAK C18)
1
+�����2E��0���±±±±�����3� �����E�����0�±±±±����
--���±±±±�.����*�0�±±±±��.���
Summer +�����2E�����.�±±±±�0����3� �����E�����*�±±±±�
���0�
�
�.�*�±±±±��������-�±±±±����
������ �
� � F��� �2��� �� Summer + winter
Yes 30 minutes morning and evening
Passive (SEP-PAK C18)
1
+�����2E�����±±±±���*��3� �����E�������±±±±�����
.���±±±±������*�±±±±���0�
;��2��1�
6�**�7�
������ $4 11��2� Winter + summer
Yes 24 h Volunteer Active 9 6 2
�

�
�������������� ��������� ����������������� ������������ � � � � � � � ,'���������������� ����������������������������������� �
Summary of the main results obtained from French studies (1990-2001) on indoor concentrations of carbon monoxide �
Author (year)
Town Room type Season Collection duration
Population recruitment method
Methodology N Results (ppm)
Parat (1999)
Paris Office buildings 1 year ? Selection of 2 buildings depending on ventilation
IR spectrophotometry
? NV: 2.25 ± 2.05 Air conditioned: 3.5 ± 2.03
Vincent (1997)
Paris Office buildings ? ? Selection of 3 buildings depending on ventilation
? 51 54 34
NV: 2.5 ± 0.6 ppm HVAC: 2.5 ± 0.6 ppm FCU: 2.5 ± 0.6 ppm
CINT CEXT A 1 ± 1 1 ± 1 B 10 ± 4 7 ± 3 C 0 ± 0.8 1 D 0.5 ± 0.7 0 E 0 0
Kirchner (1995)
Paris Office buildings February-May Instantaneous measurements for 15-20 minutes
Selection of 6 buildings
Drager tubes 6
F 0 0
CINT CEXT Laurent (1993)
Paris Schools + nurseries
1 year Continuous Geographic criteria + building characteristics
IR spectrophotometry
10
Average conc. 24 hs < 1 – 2 < 1 – 4
Presence of smokers -���±±±±����Mouillesseaux (1993)
Paris Office buildings ? ? Air conditioned buildings
IR spectrophotometry
112
No smokers 2.1 ± 1.6 Richalet (1993)
Lyon Secondary school
Every 4 minutes + hourly averages
Buildings differing by their air conditioning system
Drager + IR spectrophotometry
2 < 4
: Winter Summer 0-2 ppm 88.2% - 2-10 ppm 6.8% - 10-20 ppm 3.8% - Kindergarten
10-20 ppm 1.1% - 0-2 ppm 94.6% 85.5% 2-10 ppm 5.1% 14.1% 10-20 ppm 0.3% 0.3%
Grimaldi (1992)
Marseille Kindergarten + amphitheatre
Winter + summer
? ? IR spectrophotometry
?
Amphitheatre
10-20 ppm 0 0.4%

�
�������������� ��������� ����������������� ������������ � � � � � � � ,"���������������� ����������������������������������� �
Summary of the main results of French studies (1990-2001) on indoor particulate pollution
Parameter Author (year)
Town Season Collection duration
Population recruitment method
Methodology n (population)
Room type Results
PM2.5 Mosqueron (2001)
Paris Winter + summer
Time present in rooms during a day
TASc Paris town hall civil servants
Gil Air pump + cyclone (Gravimetry)
55 Dwelling Offices
24.7 ± 14.1 µg/m3 34.5 ± 38.6 µg/m3
PM8 Vincent (1997)
Paris ? ? Selection of 3 buildings depending on ventilation
? 51 54 34
Offices NVd: 136.5 ± 117.7 µg/m3 HVACe: 148.3 ± 153.1 µg/m3 FCUf: 93.5 ± 112.7 µg/m3
Dust Kirchner (1995)
Paris February-May 8 h Selection of 6 buildings
Gravimetry 6 Offices 54 to 740 µg/m3
TSPa FNb
Laurent (1993)
Paris 1 year 48 –72 h 1 h
Geographic criteria + building characteristics
Gravimetry Reflectrometry
? Schools and nurseries
CInt = 53 µg/m3; CExt = 60 µg/m3 CInt = CExt (24 to 50 vs 19 to 53 µg/m3)
PM8 Mouillesseaux (1993)
Paris ? ? ? Automatic analyser 112 262
Offices Presence of smokers: 178 ± 150 µg/m3
No smokers: 81 ± 62 µg/m3 FNb Faugere
(1992) Bordeaux
Winter + summer
15 minutes Rehabilitation district
RAM 1 100 Dwelling Smokers: 204.3 ± 103.4 µg/m3 Non-smokers: 137.7 ± 86.7 µg/m3
Dust Grimaldi (1992)
Marseille Winter + summer
8 h during the day (open rooms) and 16 h at night (closed rooms)
? ? ? Schools Kindergarten Winter Day: 73.4 ± 67.6 µg/m3 Night: 47.5 ± 25.2 µg/m3 Summer Day: 103.2 ± 101.2 µg/m3 Night: 52.5 ± 32.1 µg/m3 Amphitheatre Winter Day: 153.4 ± 88.7 µg/m3 Night: 84.3 ± 35.8 µg/m3 Summer Day: 120.4 ± 89.2 µg/m3 Night: 57.9 ± 45.4 µg/m3
FNb Barguil (1990)
Paris Winter + summer
24 h Volunteer Reflectometry 51 Dwelling CInt = CExt (25 to 30 µg/m3)
a: TSP = Total Suspended Particulate matter b: FN = Black smoke c: TAS = Random draw d: Natural ventilation e: Air conditioned f: Simple forced ventilation

�
�������������� ��������� ����������������� ������������ � � � � � � � ,,���������������� ����������������������������������� �
Summary of the main results of French studies (1990-2001) on indoor concentrations of dust mite allergens Author (year)
Town Room type Season Population recruitment method
Collection Methodology
N Group Results
Vervloet (1999)
Marseille Dwelling January – April
Allergic children Mattress dust ELISA 157 Group I 14.3 µg/g (range: 0.1 – 185.1) with 6.4% samples < 2 µg/g and 21.1% between 2 and 10 µg/g
de Blay (1997)
Strasbourg Dwelling ? Low cost dwelling infested by cockroaches
Kitchen and mattress dust
ELISA 4 Group I and II Kitchen: < 2 µg/g Mattress > 10 µg/g (in 2 samples / 4)
Vincent (1997)
Paris Offices Autumn Selection of 3 buildings depending on ventilation
Dust ELISA ? 139 Der p I NVa: 14.6 ng/m3 HVACb: 20.9 ng/m3 FCUc: 6.4 ng/m3
Dornelas (1995a)
Marseille Nurseries April and October
Random draw Dust ELISA 30 Group I and II Mattress: < 0.1 – 5.3 µg/g Floors: < 0.1 – 1.4 µg/g Pillows: < 0.1 – 0.4 µg/g Fluffy toys: < 0.1 – 2.3 µg/g
Dornelas (1995)
Martigues Briançon
Dwelling November Children Dust ELISA 98 Group I If RH < 40% < 10 µg/g 40 < RH < 65% 0.1-50 µg/g RH > 65% < 10 µg/g
Pauli (1993)
Strasbourg Dwelling 4 seasons Subjects allergic to dust mites + controls
Mattress dust ELISA (+ Acarex test)
197 Group I
Der p I
Der f I
Allergic subjects: 46.4 µg/g Controls 1: 38.8 µg/g Controls 2: 33.1 µg/g Allergic subjects: 28.2 µg/g Controls 1d: 22.7 µg/g Controls 2e: 21.1 µg/g Allergic subjects: 18.2 µg/g Controls 1: 22.7 µg/g Controls 2: 21.1 µg/g
Hoyet (1991)
Strasbourg Dwelling ? Asthmatics + controls Dust Acarex test +
ELISA
239 Group I and II Class 0: 6.3% Class 1: 44.3% Class 2: 36.0% Class 3: 13.4% 0.03 – 481 µg/g
Martigues Briançon Charpin (1991)
Martigues Briançon
Dwelling Winter Volunteer Dust ELISA 241 Group I Der p I Der f I
15.8 µg/g 5.5 µg/g 5.0 µg/g
0.36 µg/g 0.24 µg/g 0.18 µg/g
Vervloet (1991)
Marseille Dwelling October – April
Asthmatic subjects allergic to dust mites
Dust ELISA 49 Group I No treatment: 1.34 µg/g Spray during crises: 5.37 µg/g Daily treatment: 17.8 µg/g
a: VN = Natural ventilation b: HVAC = Air conditioned coupled to a ventilation and heating system c: FCU = forced ventilation d: controls leaving close to cases e: non-allergic controls recruited in the hospital

�
�������������� ��������� ����������������� ������������ � � � � � � � ,-���������������� ����������������������������������� �
�
Summary of the main results obtained from French studies (1990-2001) on indoor concentrations of dog and cat allergens.
Author (year) Town Room type Season Population recruitment
method Collection Methodology N Group Results
De Blay (1997) Strasbourg Dwelling ?
Low cost dwelling infested by cockroaches (presence of a cat)
Air ELISA 1 Fel d 1 2.9 ng/m3
Vincent (1997) Paris Offices Autumn Selection of 3 buildings
depending on ventilation Dust ELISA ? 3 Fel d 1 NVa: 236.1 ng/m3 HVACb: 226.1 ng/m3 FCUc: 121.8 ng/m3
Dornelas (1995a) Marseille Nurseries April
October Random draw Dust ELISA 30 Fel d 1
Dust Mattress: < 0.1 – 4.5 µg/g Floors: < 0.1 – 2.4 µg/g Pillows: < 0.1 – 4.1 µg/g Fluffy toys: < 0.1 – 3.7 µg/g
Dornelas (1995) Marseille Nurseries April
October Random draw Dust ELISA 30 Can f1
Dust Mattress: < 0.1 – 4.5 µg/g Floors: < 0.1 – 1.2 µg/g Pillows: < 0.1 – 1.5 µg/g Fluffy toys: < 0.1 – 1.8 µg/g
Van der Brempt (1991)
Marseille Dwelling ? Asthmatics + controls Dust ELISA 136 Fel d 1
Presence of a cat: 21.9 µg/g Previous presence of a cat: 5.2 µg/g No cat: 1.4 µg/g
a: VN = Natural ventilation b: HVAC = Air conditioned coupled to a ventilation and heating system c: FCU = forced ventilation

�
�������������� ��������� ����������������� ������������ � � � � � � � -.���������������� ����������������������������������� �
Summary of the main results obtained from French studies (1990-2001) on indoor concentrations of cockroach allergens
Author (year) Town Room type Season Population
recruitment method Methodology Collection N Group Results
Bla g 1 Bla g 2
Kitchen* 3 789 U/g 24.2 U/g de Blay
(1997) Strasbourg Dwelling ? Low cost dwelling
infested by cockroaches
ELISA Dust 9
Bla g 1
+
Bla g 2 Mattress* 762 U/g 4.0 U/g
Bla g 1 Bla g
Mattress < 0.6 – 2 U/g 0.6 – 6 U/g
Floors < 0.6 – 14 U/g < 0.6 – 4 U/g
Pillows < 0.6 – 2 U/g < 0.6 U/g
Dornelas (1995a) Marseille Nurseries April +
October Random draw ELISA Dust 30 Bla g 1
+ Bla g 2
Fluffy toys
< 0.6 – 2 U/g < 0.6 U/g
* median values �

�
�������������� ��������� ����������������� ������������ � � � � � � � -&���������������� ����������������������������������� �
�
Comparison of median concentrations (µg/m3) measured within the framework of national or multicentric studies in indoor air in dwellings in other countries, for some VOCs and individualised aldehydes
GerES SIAQ NHEXAS Expolis MacBeth Phase
I Phase II
Phase IV
Arizona Region V
Athens Basel Helsinki Milan Prague Antwerp
Athens Copenhagen Murcia Padoue Rouen
Acetaldehyde 4.0 9.4 10.1 4.5 12.3 7.0 9.5
Benzene 7.2 1.3 3.3 1.3 4.7 11.1 3.0 2.2 13.2 12.0
2-butoxyethanol (EGBE)
2.5
n-decane 5.3
p-dichlorobenzene 0.4
Ethylbenzene 2.9
Formaldehyde 55 70 36 24 21 41.6
Hexaldehyde 11.5
Limonene 7.1 82.5 31.6 46.6 42.2
Styrene 1.8 2.4 1.17 5.5 3.9
Tetrachloroethylene 2.2
Toluene 62 11 14.9 10 23.1 20.1 20.3 68.0 74.2
Trichloroethylene < 1.8 0.7
1.2.4-trimethylbenzene 4.1
Undecane 2.3 6.3 5.1
m/p xylenes 3.7 3.5 24.0 7.9 7.8 36.5 21.5
o xylene 8.3 2.7 2.5 11.5 7.1
�


