28
Nonparametric tests: Tests without population parameters (means and standard deviations)
| Date post: | 31-Dec-2015 |
| Category: |
Documents |
| Upload: | cullen-jenkins |
| View: | 30 times |
| Download: | 0 times |
Nonparametric tests:
Tests without population parameters
(means and standard deviations)
Use when:
• Data does not support means (ordinal)
• Data is not normally distributed.
1) Rank all data.
2) Evaluate if ranks tend to cluster within a group.
Mann Whitney U test:
nonparametric equivalent of a t test for two independent samples
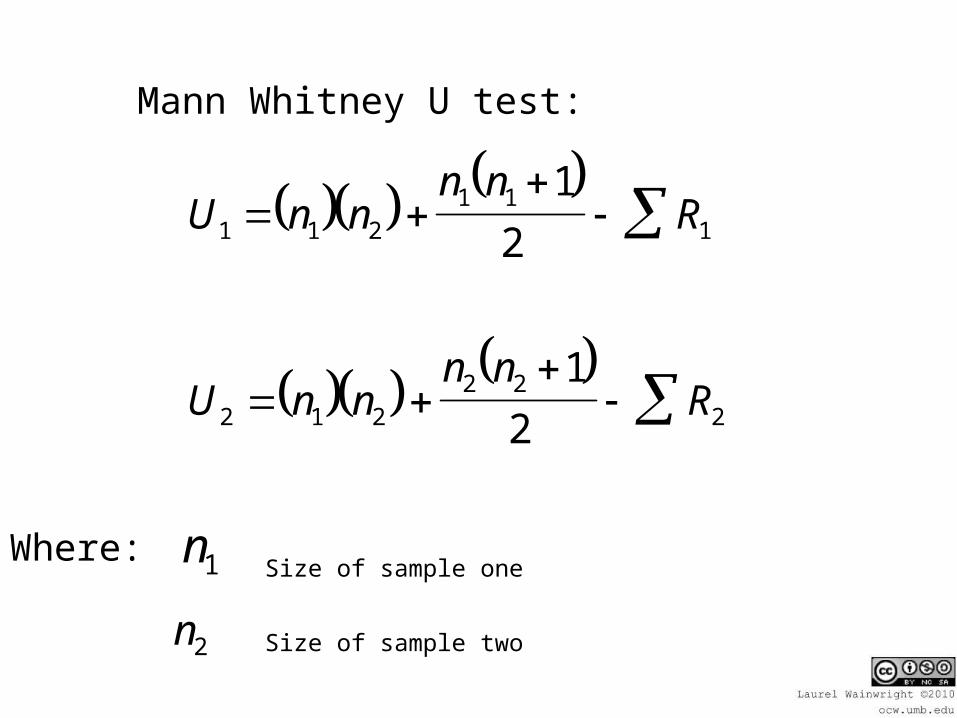
Mann Whitney U test:
Where: n1
n2
U n nn n
R
U n nn n
R
1 1 21 1
1
2 1 22 2
2
1
2
1
2
Size of sample one
Size of sample two
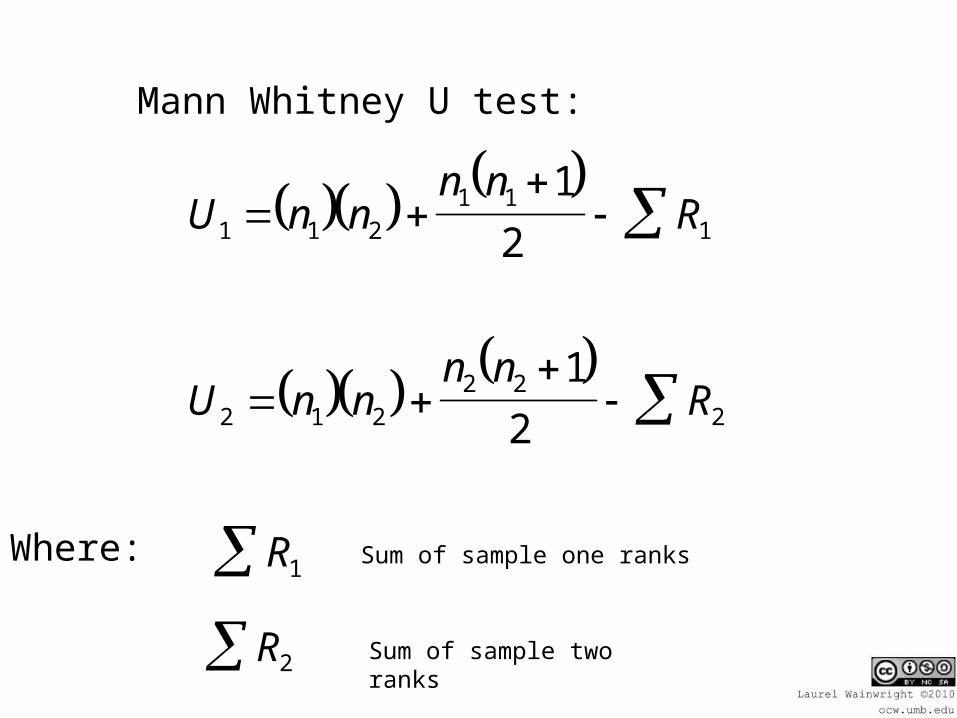
Mann Whitney U test:
Where:
U n nn n
R
U n nn n
R
1 1 21 1
1
2 1 22 2
2
1
2
1
2
R1 Sum of sample one ranks
R2 Sum of sample two ranks

Evaluation of Mann Whitney U
1) Choose the smaller of the two U values.
2) Find the critical value (Mann Whitney table)
3) When computed value is smaller than the critical value the outcome is significant!
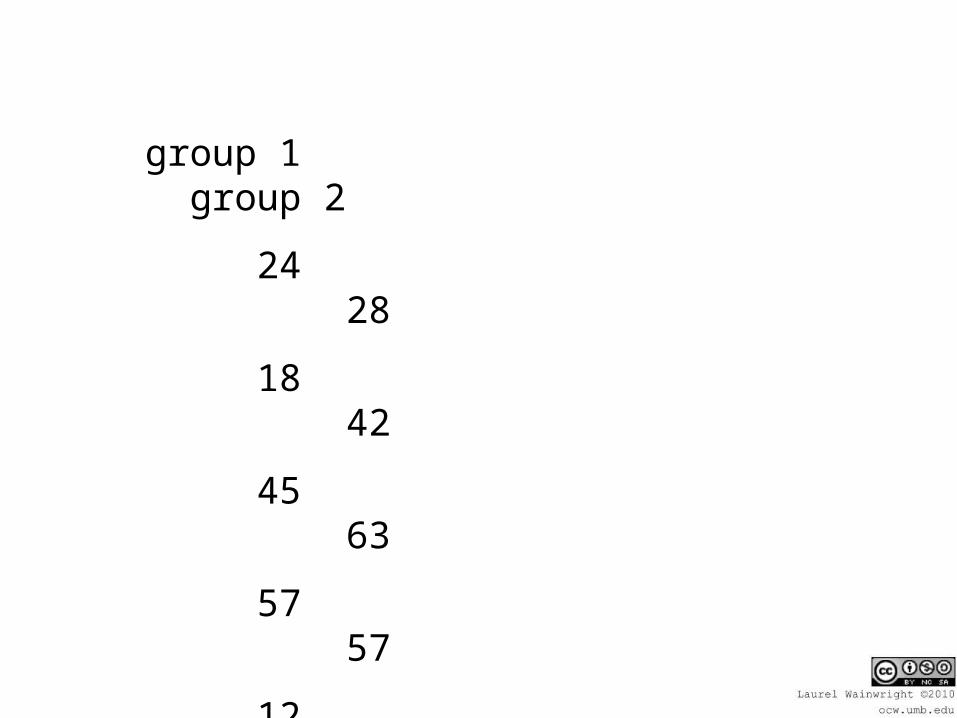
group 1 group 2
24 28
18 42
45 63
57 57
12 90
30 68
group 1 group 2
24 28
18 2 42
45 63
57 57
12 1 90
30 68
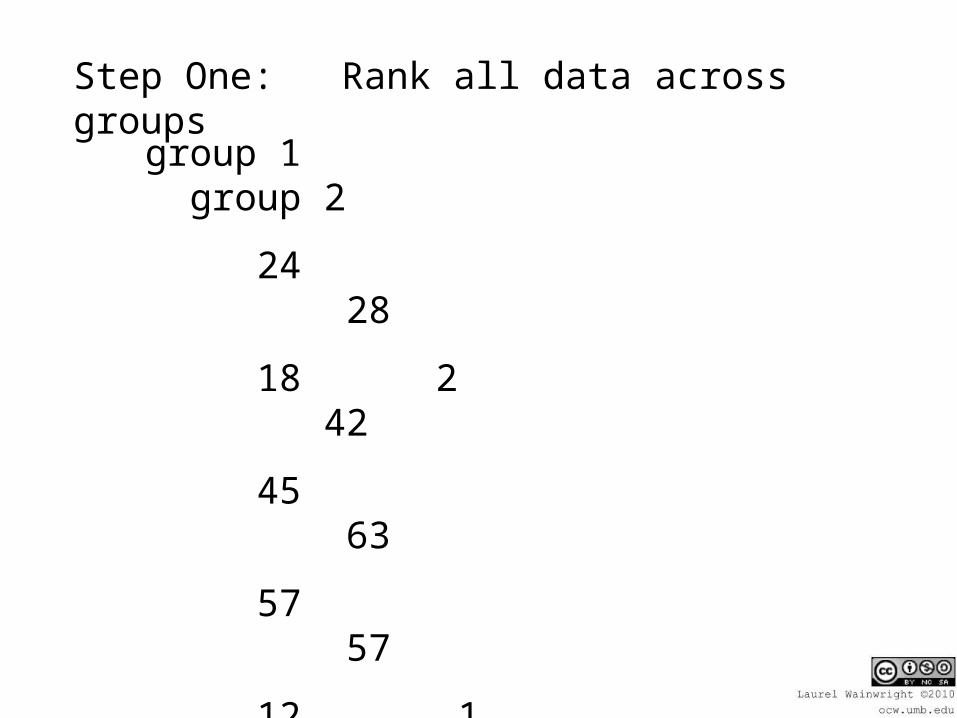
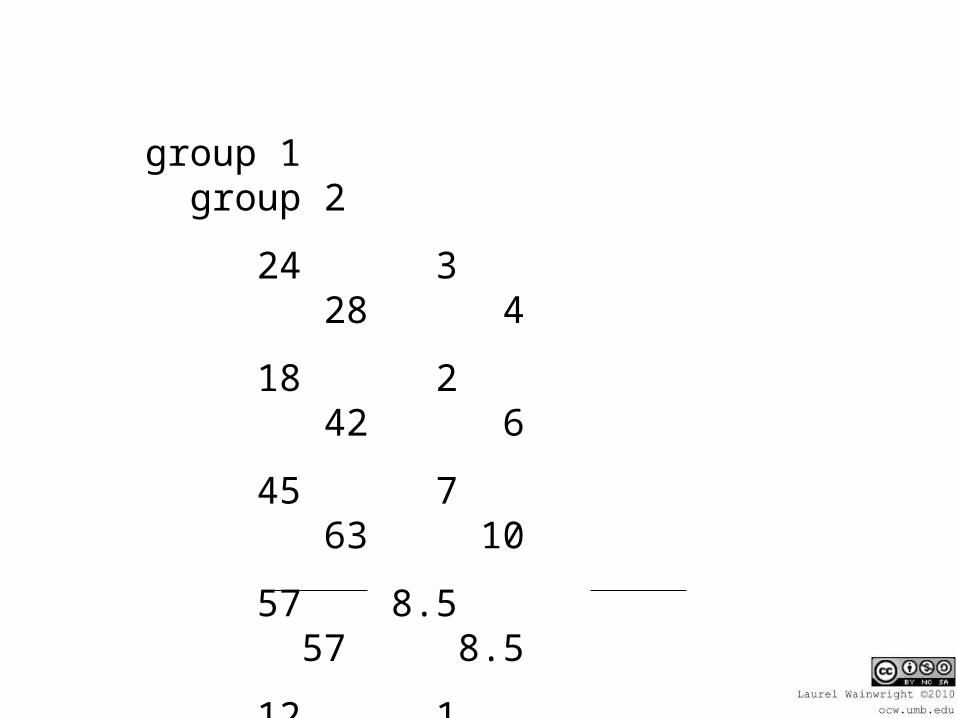
Step One: Rank all data across groups
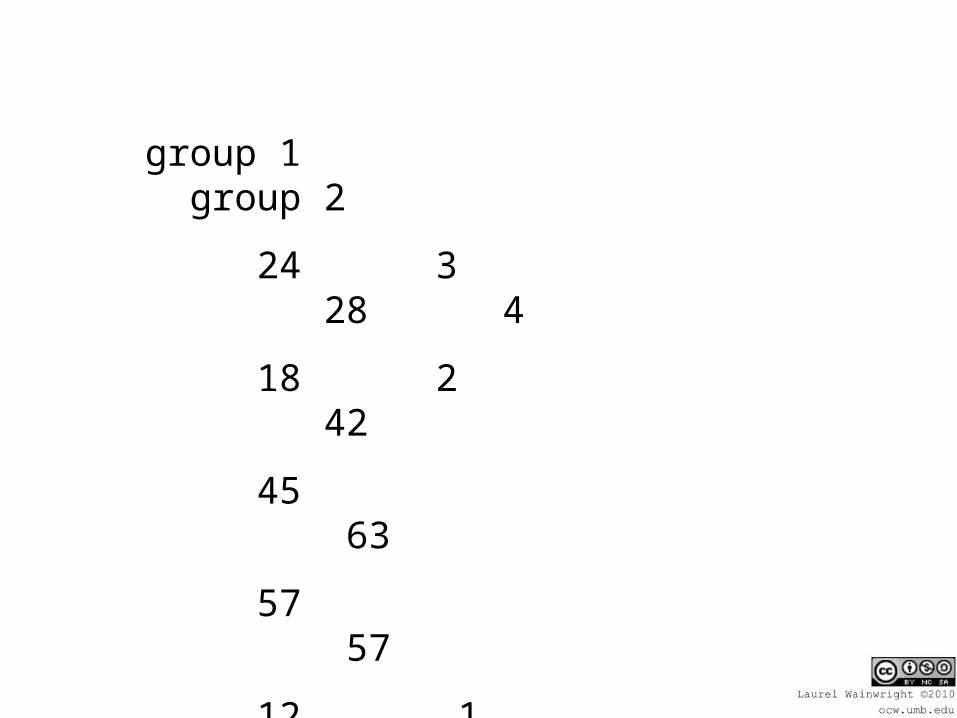
group 1 group 2
24 3 28 4
18 2 42
45 63
57 57
12 1 90
30 68
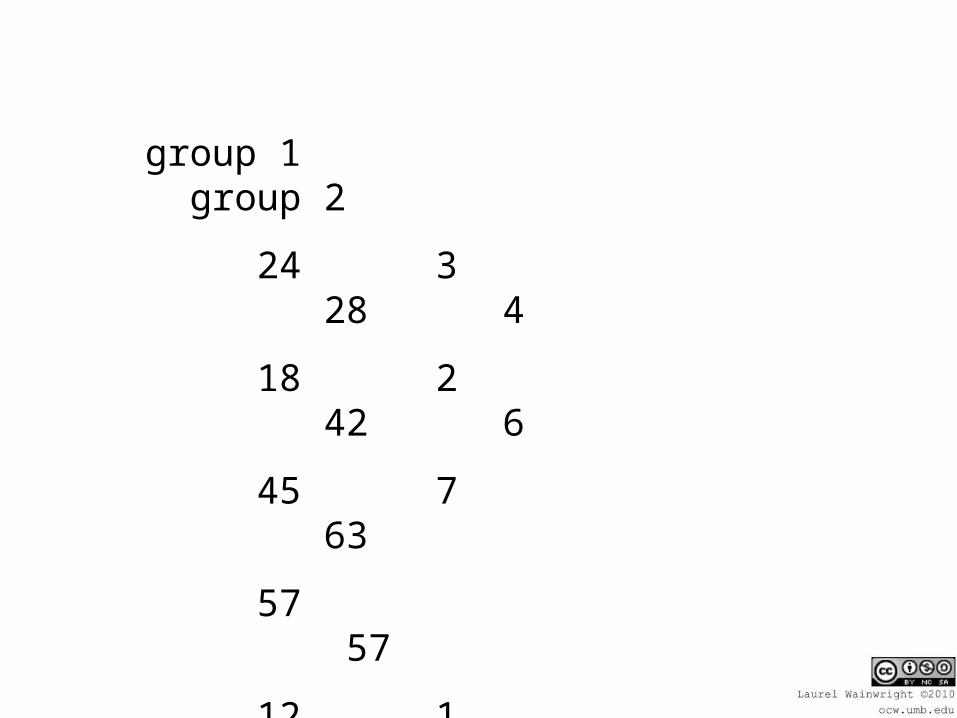
group 1 group 2
24 3 28 4
18 2 42 6
45 7 63
57 57
12 1 90
30 5 68
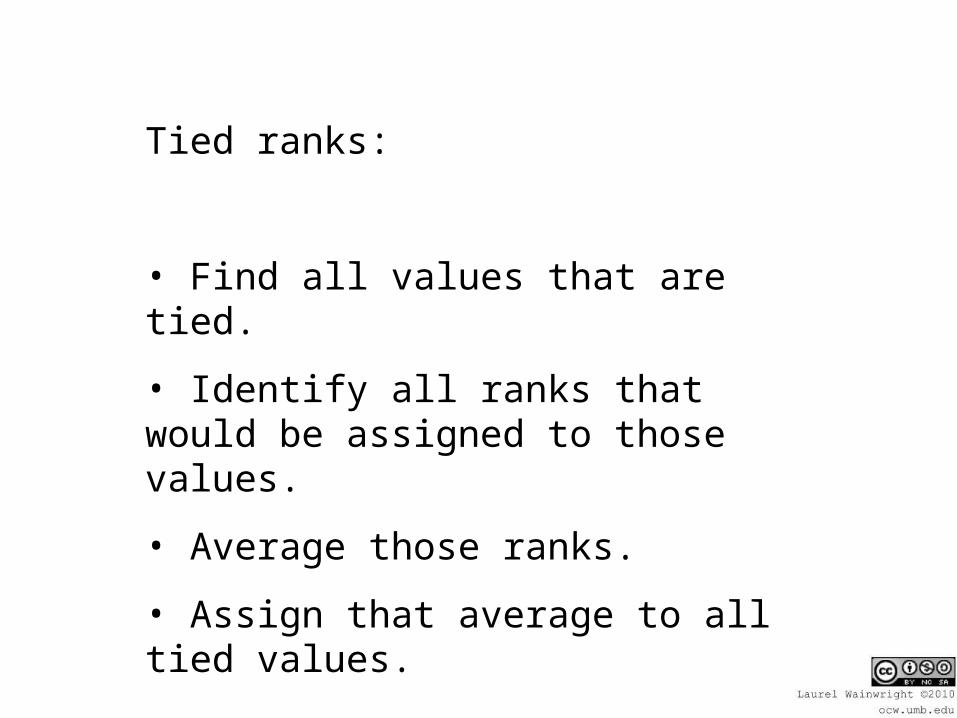
Tied ranks:
• Find all values that are tied.
• Identify all ranks that would be assigned to those values.
• Average those ranks.
• Assign that average to all tied values.

group 1 group 2
24 3 28 4
18 2 42 6
45 7 63
57 57
12 1 90
30 5 68
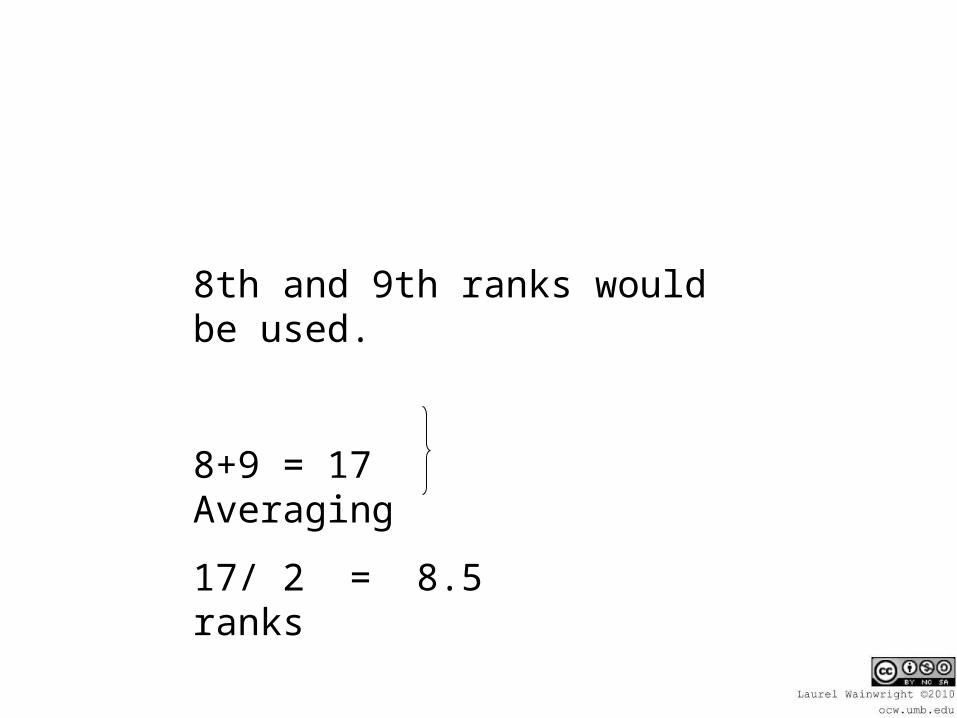
8th and 9th ranks would be used.
8+9 = 17 Averaging
17/ 2 = 8.5 ranks
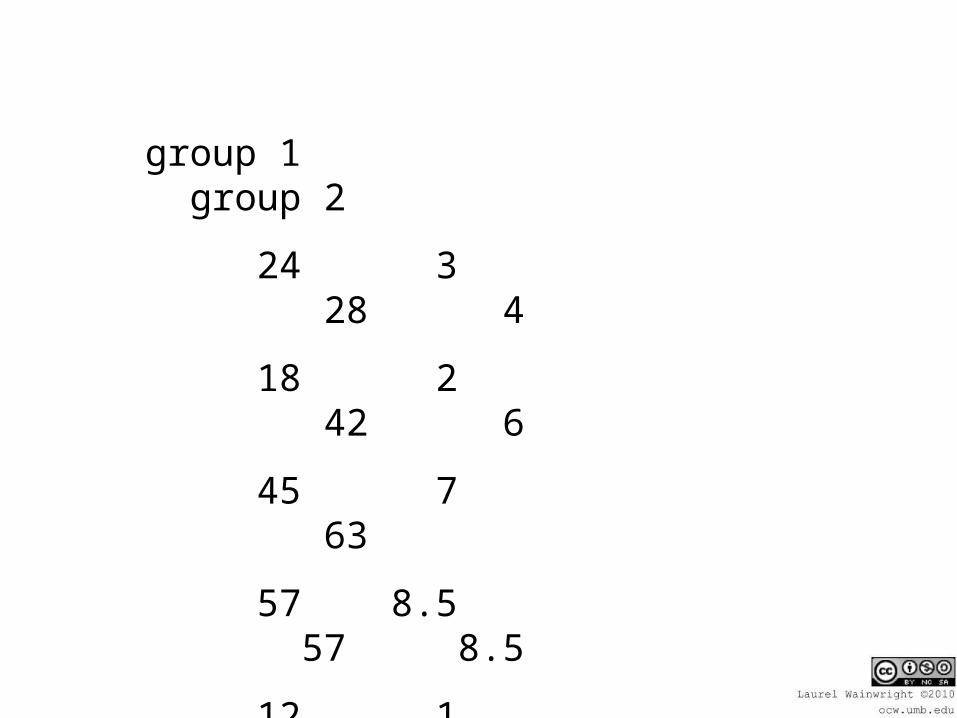
group 1 group 2
24 3 28 4
18 2 42 6
45 7 63
57 8.5 57 8.5
12 1 90
30 5 68
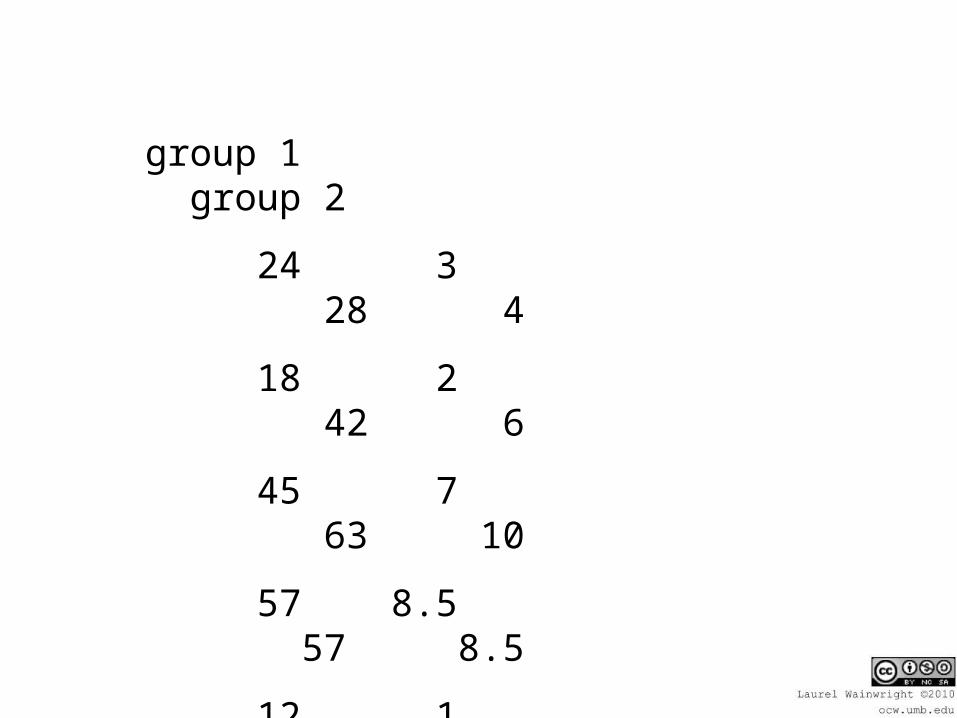
group 1 group 2
24 3 28 4
18 2 42 6
45 7 63 10
57 8.5 57 8.5
12 1 90 12
30 5 68 11
group 1 group 2
24 3 28 4
18 2 42 6
45 7 63 10
57 8.5 57 8.5
12 1 90 12
30 5 68 11
26.5 51.5
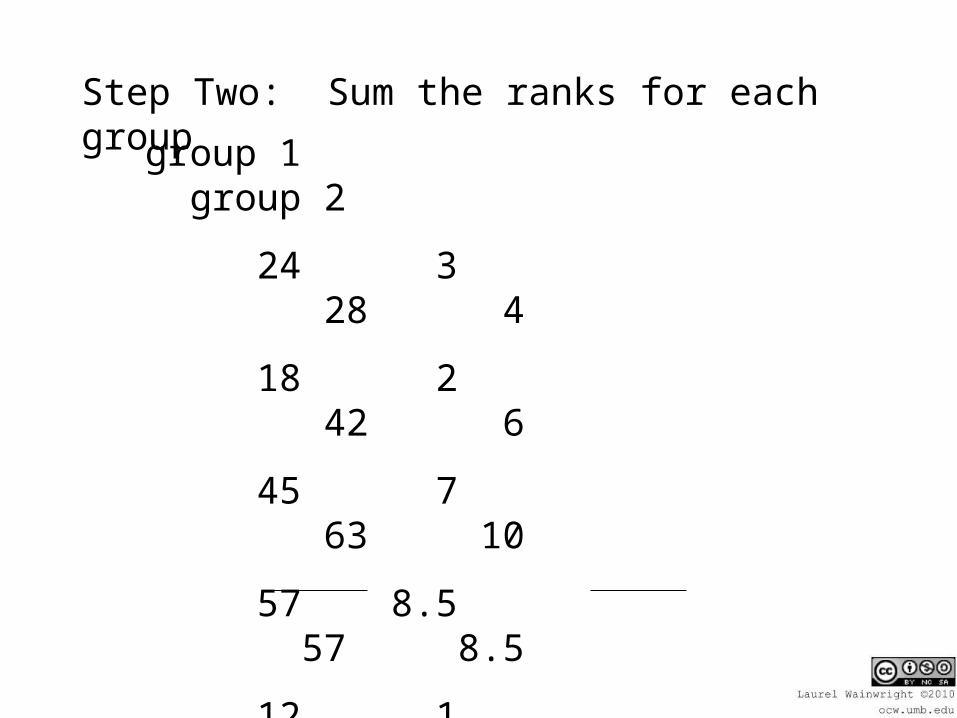
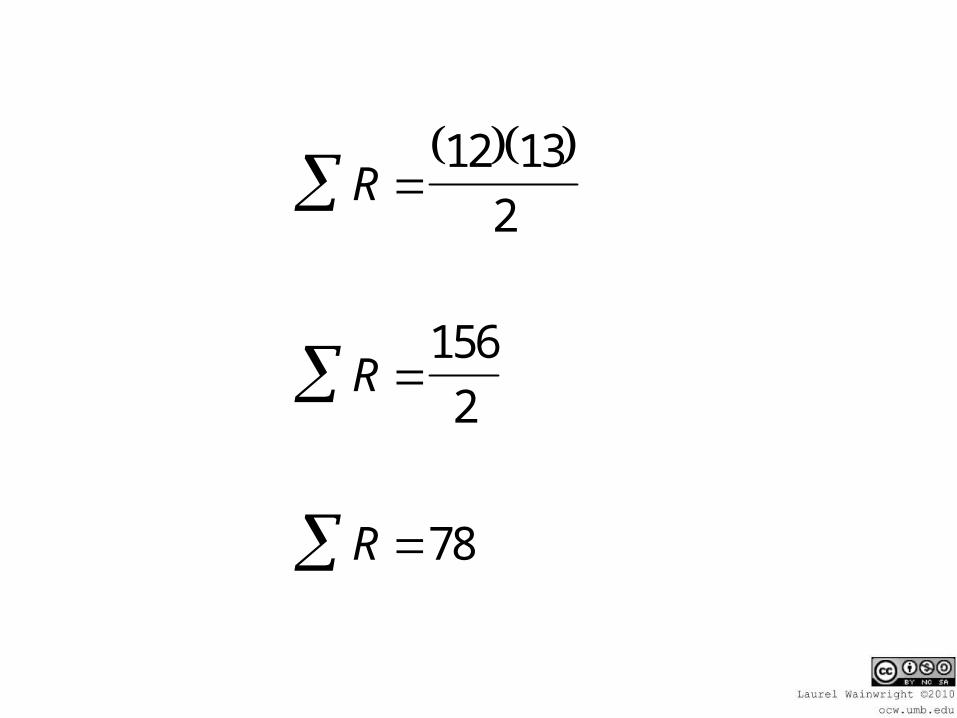
Step Two: Sum the ranks for each group
R
n n
1
2
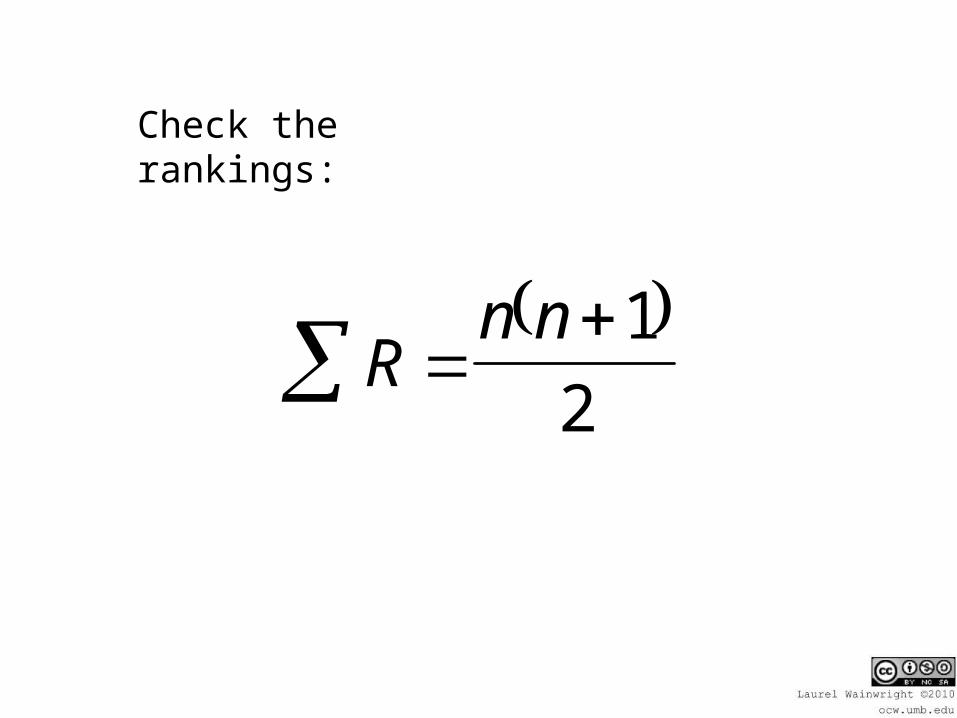
Check the rankings:
R
R
R
12 13
2
156
2
78
group 1 group 2
24 3 28 4
18 2 42 6
45 7 63 10
57 8.5 57 8.5
12 1 90 12
30 5 68 11
26.5 51.5
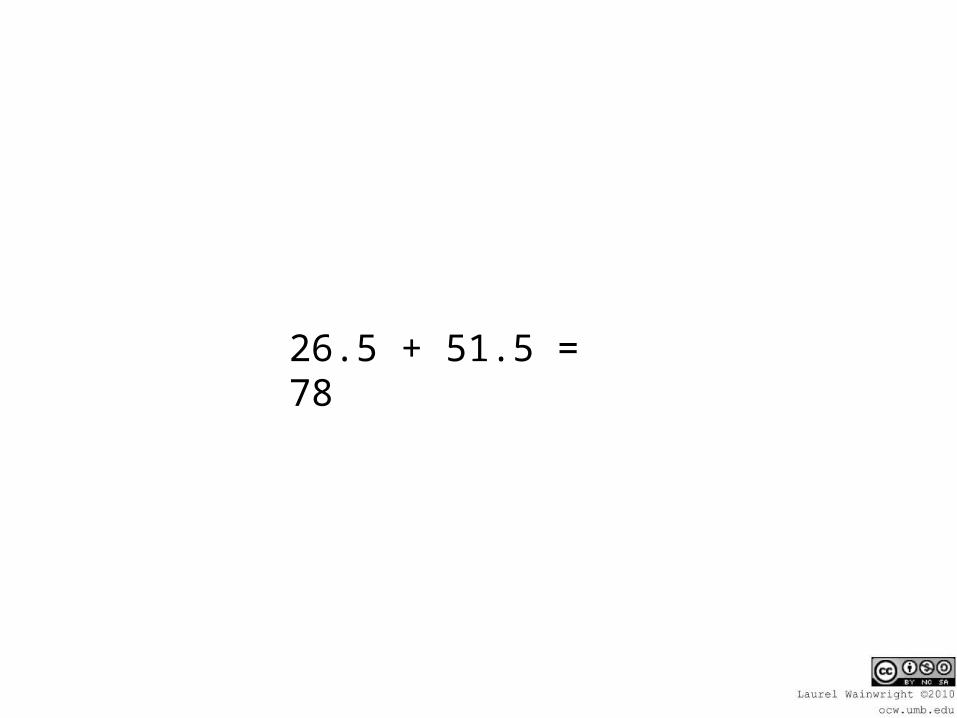
26.5 + 51.5 = 78
U n n
n nR1 1 2
1 11
1
2
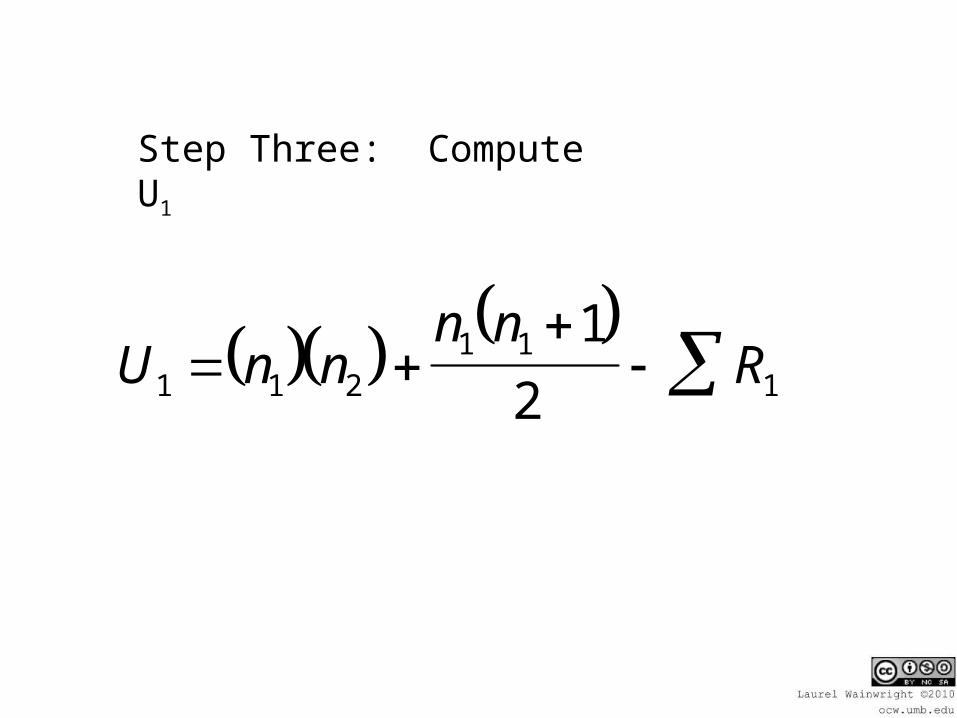
Step Three: Compute U1
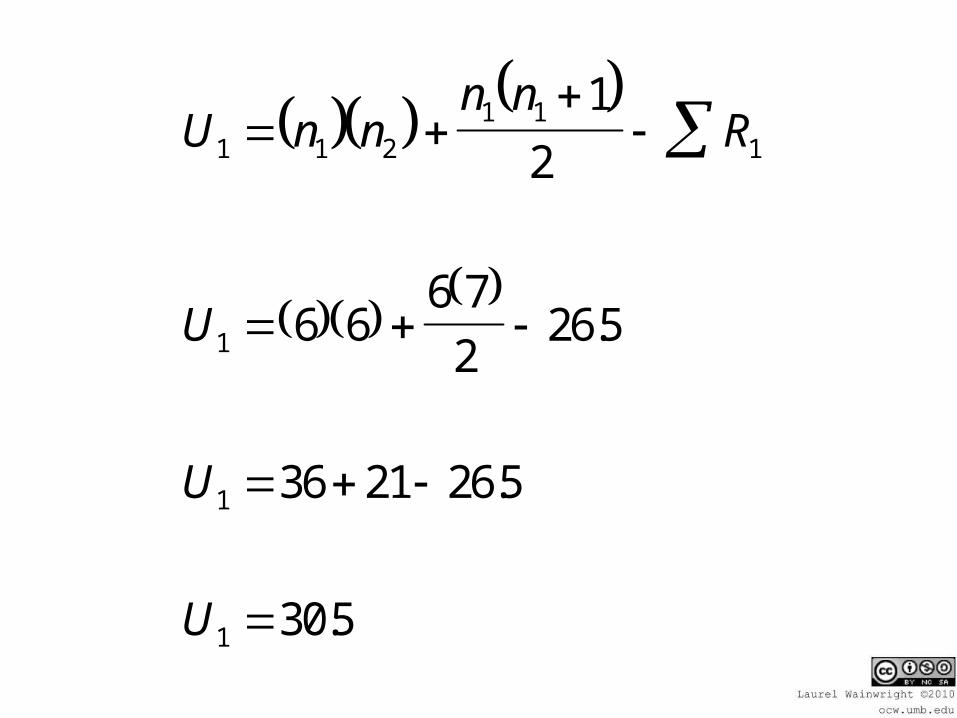
U n nn n
R
U
U
U
1 1 21 1
1
1
1
1
1
2
6 66 7
2265
36 21 265
305
.
.
.
U n n
n nR2 1 2
2 22
1
2
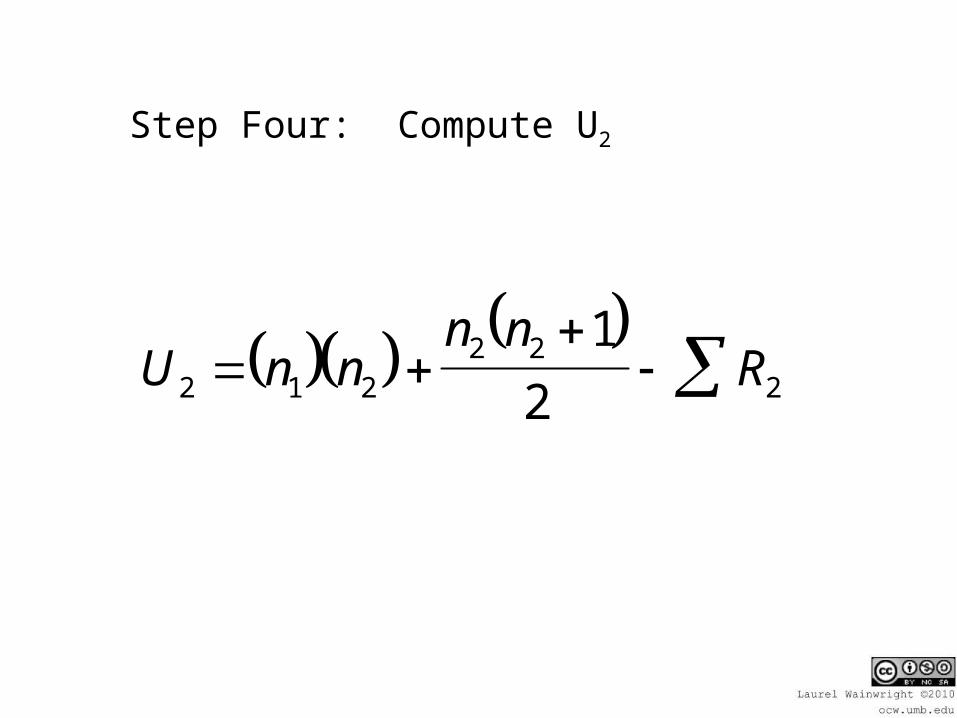
Step Four: Compute U2
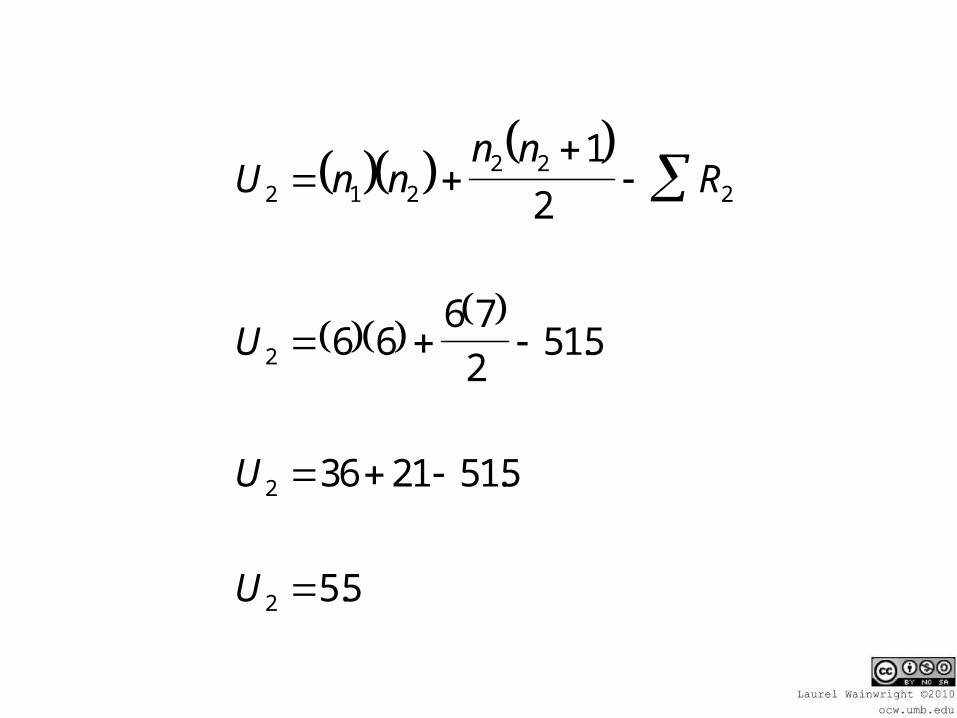
U n nn n
R
U
U
U
2 1 22 2
2
2
2
2
1
2
6 66 7
2515
36 21 515
55
.
.
.
U
U
U
1
2
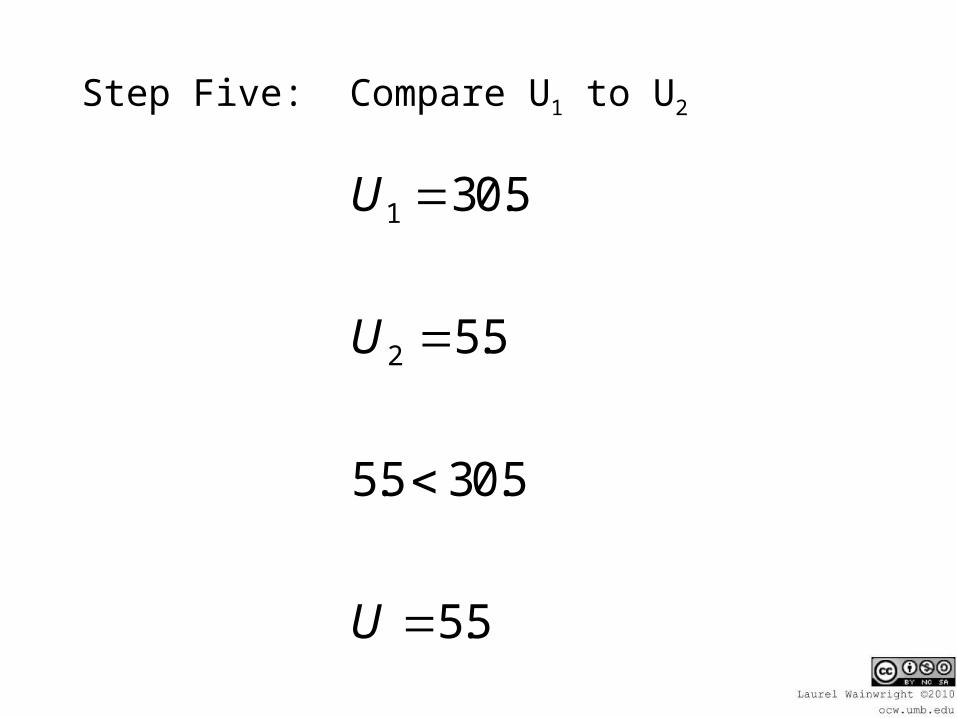
305
55
55 305
55
.
.
. .
.
Step Five: Compare U1 to U2
Critical Value = 5
This is a nonsignificant outcome

group 1 group 2
24 3 28 4
18 2 42 6
45 7 63 10
57 8.5 57 8.5
12 1 90 12
30 5 68 11


