44
NSW SCHOOL PHYSICAL ACTIVITY AND NUTRITION SURVEY (SPANS) 2015 SUMMARY REPORT

NSW SCHOOL PHYSICAL ACTIVITY AND NUTRITION SURVEY(SPANS) 2015SUMMARY REPORT

2NSW HEALTH
This work is copyright. It may be reproduced in
whole or in part for study training purposes subject
to the inclusion of an acknowledgement of the
source. It may not be reproduced for commercial
usage or sale.
© NSW Ministry of Health 2017
SHPN: (CHP) 170208
ISBN: 978–1–76000–638–9 (online)
Download copies of these reports:
www.health.nsw.gov.au or www.sydney.edu.au/
medicine/public-health/panorg/
For further copies of this document please contact:
Better Health Centre – Publications Warehouse
Locked Mail Bag 5003
Gladesville NSW 2111
Tel. (02) 9879 0443
Fax. (02) 9879 0994
Further information about this
document is available from:
Centre for Population Health
NSW Ministry of Health
LMB 961 North Sydney NSW 2059
Tel. (02) 9391 9661
2017
Recommended Citation
Hardy LL, Mihrshahi S, Drayton BA, Bauman, A.
NSW Schools Physical Activity and Nutrition Survey (SPANS)
2015: Full Report. 2016 Sydney: NSW Department of Health.
The NSW Ministry of Health commissioned the Physical
Activity Nutrition and Research Group, Prevention Research
Collaboration, University of Sydney, to undertake the Schools
Physical Activity and Nutrition Survey as an independent
study and prepare this report.
The Project Team would like to acknowledge the contribution
of the Field Team including: Sean Abernethy, Jennifer
El-Tom, David McDonald, Sally Roberts, Louisa Bailey, Jim
Krahe, Luke Pollard, Jennifer Thomas, Mitchell Baker, Claudia
Latta, Danielle Polson, Elaine Watling, Jennifer Carter, John
Masters, Jacqueline Richards, Richard Zoglmeyer, Bridget
Foley, Sarah Burke (Reserve)

NSW SCHOOL PHYSICAL ACTIVITY AND NUTRITION SURVEY (SPANS) 2015 | SUMMARY REPORT
3
SUMMARYCONTENTS
SUMMARY 4
WEIGHT STATUS 7
FOOD CONSUMPTION 10
DIETARY BEHAVIOURS 15
PHYSICAL ACTIVITY AND HEALTH-RELATED FITNESS 19
FUNDAMENTAL MOVEMENT SKILLS 23
SCHOOL TRAVEL 27
SEDENTARY BEHAVIOUR 30
SCHOOLS’ NUTRITION AND PHYSICAL ACTIVITY ENVIRONMENTS 34
APPENDIX 1 - METHODS 38
APPENDIX 2 - RESPONSE RATES AND REPRESENTATIVENESS 40
ABBREVIATIONS 42

4NSW HEALTH
What is SPANS?SPANS is a cross-sectional, school based population survey of school children age 5 to 16 years, carried out in February and March 2015. Previous SPANS surveys were held in 2004 and 2010. SPANS 2015 surveyed 7,556 students in Kindergarten, and years 2, 4, 6, 8 and 10 from a random sample of Government, Independent and Catholic schools across NSW. The 7,556 students were representative of school students in NSW.
SPANS measures a range of children’s health behaviours including dietary patterns and eating behaviours, physical activity and measures of fitness and fundamental movement skills, and identified factors related to healthy growth and development. SPANS 2015 provides information comparing boys and girls, across year groups, and according to location (rural/urban) and by cultural group and socio-economic status.
Information on key health indicators related to chronic disease prevention among NSW children is available across a 30-year period (1985, 1997, 2004, 2010 and 2015). SPANS data are used to inform policy and practice in NSW. The key findings from 2015, and data comparing changes from 2010 to 2015, represent an important contribution to development of policy and programs to improve child and adolescent health in NSW.
SUMMARY
In 2015 compared with 2010 there were:
Increases in children and adolescents meeting the recommended daily serves for fruit (2 serves) and vegetables (5 serves)
Increases in meeting recommended daily screen time limits for children
Fewer children and adolescents eating take away meals and snacks and confectionery
Increases in all fundamental movement skills in children
Fewer children eating dinner in front of the television 3-4 or 5-6 times weekly, or doing so daily
What are the key findings from SPANS 2015?In 2015, NSW children1 and adolescents2 have:
• Low levels of physical activity and muscular fitness
• Low levels of active travel to school
• High consumption of take-away food, sugar sweetened drinks and junk food
• Low intake of vegetables
• High levels of ‘screen time’ (TV, computer, smartphone and tablet devices).
Other unfavourable changes include a significant increase in children and adolescents being driven to school, with over half of children and 1 in 5 adolescents being driven to school in 2015.
SPANS is the only study in Australia which has representative, comparable and serial data on children’s and adolescents’ weight and indicators of weight related behaviours.
Because of SPANS, NSW is the only jurisdiction internationally to have population monitoring of children’s and adolescents’ cardiorespiratory endurance and fundamental movement skills.
1 Through this report, primary school children in Kindergarten and Years 2,4 and 6 are referred to as ‘children’2 Through this report, secondary school adolescents in Years 8 and 10 are referred to as ‘adolescents’
5NSW SCHOOL PHYSICAL ACTIVITY AND NUTRITION SURVEY (SPANS) 2015 | SUMMARY REPORT
Overweight and obesity rates in NSW between 2010 and 2015Approximately 1 in 5 (22.9%) primary school children were overweight or obese in 2015. Combined overweight and obesity rates in primary school children in NSW have stabilised between 2010 and 2015.
More than a quarter (27.4%) of secondary school adolescents were overweight or obese. Overweight significantly increased by 5% among adolescents between 2010 and 2015. There was also a slight increase in the proportion of adolescents with obesity.
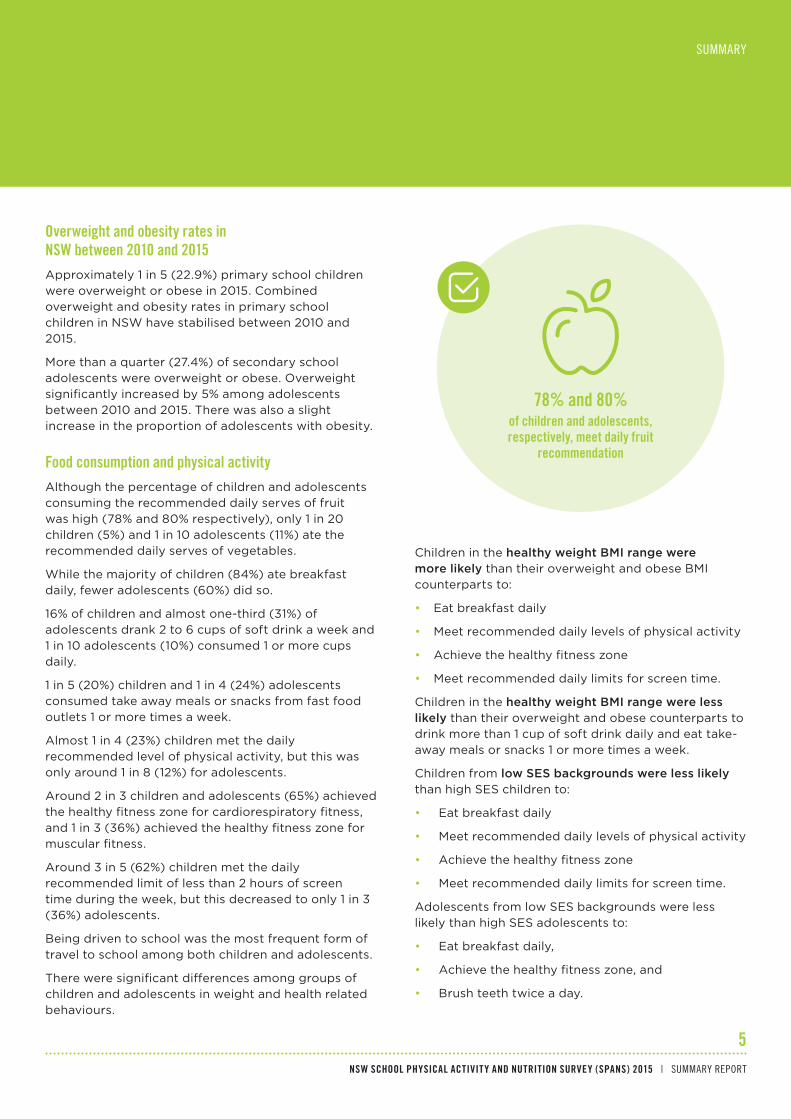
Food consumption and physical activityAlthough the percentage of children and adolescents consuming the recommended daily serves of fruit was high (78% and 80% respectively), only 1 in 20 children (5%) and 1 in 10 adolescents (11%) ate the recommended daily serves of vegetables.
While the majority of children (84%) ate breakfast daily, fewer adolescents (60%) did so.
16% of children and almost one-third (31%) of adolescents drank 2 to 6 cups of soft drink a week and 1 in 10 adolescents (10%) consumed 1 or more cups daily.
1 in 5 (20%) children and 1 in 4 (24%) adolescents consumed take away meals or snacks from fast food outlets 1 or more times a week.
Almost 1 in 4 (23%) children met the daily recommended level of physical activity, but this was only around 1 in 8 (12%) for adolescents.
Around 2 in 3 children and adolescents (65%) achieved the healthy fitness zone for cardiorespiratory fitness, and 1 in 3 (36%) achieved the healthy fitness zone for muscular fitness.
Around 3 in 5 (62%) children met the daily recommended limit of less than 2 hours of screen time during the week, but this decreased to only 1 in 3 (36%) adolescents.
Being driven to school was the most frequent form of travel to school among both children and adolescents.
There were significant differences among groups of children and adolescents in weight and health related behaviours.
SUMMARY
78% and 80% of children and adolescents, respectively, meet daily fruit
recommendation
Children in the healthy weight BMI range were more likely than their overweight and obese BMI counterparts to:
• Eat breakfast daily
• Meet recommended daily levels of physical activity
• Achieve the healthy fitness zone
• Meet recommended daily limits for screen time.
Children in the healthy weight BMI range were less likely than their overweight and obese counterparts to drink more than 1 cup of soft drink daily and eat take-away meals or snacks 1 or more times a week.
Children from low SES backgrounds were less likely than high SES children to:
• Eat breakfast daily
• Meet recommended daily levels of physical activity
• Achieve the healthy fitness zone
• Meet recommended daily limits for screen time.
Adolescents from low SES backgrounds were less likely than high SES adolescents to:
• Eat breakfast daily,
• Achieve the healthy fitness zone, and
• Brush teeth twice a day.
6NSW HEALTH
SUMMARY
Adolescents from low SES backgrounds were more likely to drink more than 1 cup of soft drink daily, compared with high SES adolescents.
Children from Middle Eastern cultural backgrounds were less likely than children from English-speaking backgrounds to:
• Eat breakfast daily
• Meet recommended daily levels of physical activity
• Achieve the healthy fitness zone
• Meet recommended daily limits for screen time.
Children from Middle Eastern cultural backgrounds were also more likely to drink more than 1 cup of soft drink daily, eat take away meals or snacks 1 or more times a week, and be driven to school.
Children from Asian cultural backgrounds were more likely to meet daily screen time limits on weekends, meet sleep time recommendations on weekdays and weekends, and brush teeth twice a day, but compared with children from English-speaking backgrounds were less likely to:
• Eat breakfast daily
• Meet recommended daily levels of physical activity
• Achieve the healthy fitness zone.
Lower prevalence of recommended daily fruit consumption and physical activity, and higher prevalence of eating take away foods and snacks, persisted among adolescents from Asian cultural backgrounds, compared to adolescents from English speaking backgrounds.
Adolescents in rural areas were more likely than urban adolescents to:
• Meet recommendations for daily serves of fruit and vegetables
• Consume take away foods less frequently
• Meet screen time limits on weekdays and weekends
• Travel to school using active transport, public transport, or mixed modes of transport.
The prevalence of waist-to-height ratio ≥0.5 was significantly higher among primary school boys from urban areas (15/9%) compared with boys from rural areas (11.2%).
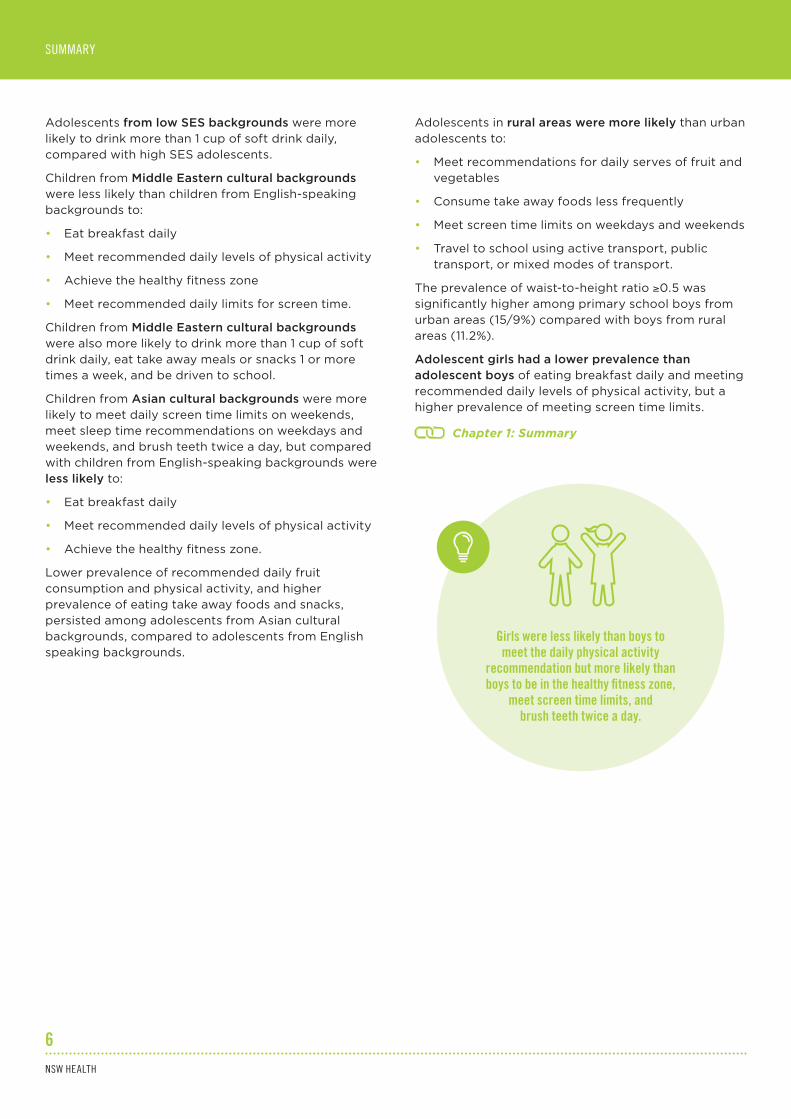
Adolescent girls had a lower prevalence than adolescent boys of eating breakfast daily and meeting recommended daily levels of physical activity, but a higher prevalence of meeting screen time limits.
Chapter 1: Summary
Girls were less likely than boys to meet the daily physical activity
recommendation but more likely than boys to be in the healthy fitness zone,
meet screen time limits, and brush teeth twice a day.

NSW SCHOOL PHYSICAL ACTIVITY AND NUTRITION SURVEY (SPANS) 2015 | SUMMARY REPORT
7
PRIMARY SCHOOL
Body Mass IndexOverall more than 1 in 5 primary school children (22.9%) were overweight or obese (measured by BMI), with no significant change between 2010 and 2015.
70.6% of children were in the healthy weight range, 6.5% were in the thin BMI range, 15.8% were in the overweight range, and 7.1% were in the obese weight range.
Combined overweight and obesity among primary school children was significantly higher among:
• Children from low SES backgrounds (35%) than children from high SES backgrounds (18.9%), a significant increase since 2010 (from 29% to 35%)
• Children from Middle Eastern cultural backgrounds (43%) compared with children from English-speaking cultural backgrounds (22%).
Chapter 4: Primary school/body mass index
WEIGHT STATUS
SNAPSHOT: CHILDREN AND ADOLESCENTS AGE 5-16 YEARSMore than two-thirds (69.0%) of children and adolescents were in the healthy weight range based on body mass index (BMI). But 1 in 4 (24.5%) children and adolescents were overweight or obese.
Children and adolescents more likely to experience overweight and obesity were from:
Low socio-economic (SES) backgrounds (33.7%), compared with children and adolescents from high SES backgrounds (19.3%)
Middle Eastern cultural backgrounds (42.3%), compared with children and adolescents from English-speaking backgrounds (23.3%).
Overall, combined overweight and obesity has stabilised between 2010 and 2015. However, there has been an increase (5%) in adolescent overweight since 2010.
The findings for primary school aged children are promising and suggest that state-wide investments over the last decade may be positively influencing children’s weight status and preventing weight gain. Continuing effort is required to embed these gains in future primary school cohorts.
In 2015, more than two-thirds
(70.6%)of children were in the healthy weight range.

NSW HEALTH
8
WEIGHT STATUS
Abdominal obesityAbdominal obesity is measured by waist-to-height ratio. A waist-to-height ratio greater than or equal to 0.5 is considered an indicator of cardiovascular risk clustering in children and adolescents.
In 2015, the prevalence of abdominal obesity among children was 14%. There was no significant difference between boys and girls, and no significant change since 2010.
In 2015, abdominal obesity among children was significantly higher among:
• Boys from urban areas (16%) compared with boys from rural areas (11%)
• Children from low SES backgrounds (23%) compared with children from high SES backgrounds (12%)
• Children from Middle Eastern cultural backgrounds (32%) compared with children from English-speaking backgrounds (14%).
Between 2010 and 2015 abdominal obesity significantly increased among:
• Children from low SES backgrounds (from 16% to 23%)
• Children from English-speaking backgrounds (from 11% to 14%).
Chapter 4: Primary school/abdominal obesity
Parental perceptions of child’s weight statusParents need assistance to understand healthy weight status in their children. If parents are not able to perceive the weight status of their child accurately, the child is less likely to receive the necessary support to make healthy lifestyle changes and achieve healthy weight status.
SPANS compared parents’ perception of their child’s weight status with the child’s measured BMI. In 2015, while approximately 85% of parents of children in the healthy weight BMI category perceived their child to be ‘about the right weight’, almost three-quarters (73%) of parents of children in the overweight category, and approximately one-third (30%) of parents of children in the obese category, perceived their child to be ‘about the right weight’.
Chapter 4: Primary school/parents perception of their child’s weight status
Almost three-quarters (73%) of parents of children in the overweight category,
and approximately one-third (30%) of parents of children in the obese category, perceived their child to
be ‘about the right weight’.
SECONDARY SCHOOL
Body Mass Index6.6% of adolescents were in the thin range, 21.7% were in the overweight range, and 5.8% were in the obese range.
The prevalence of combined overweight and obesity was significantly higher among:
• Adolescents from low SES backgrounds (32%) compared with high SES backgrounds (20%), including among both boys and girls, and between 2010 and 2015
• Adolescents from Middle Eastern cultural backgrounds (41%) compared with children from English-speaking backgrounds (26%), especially among boys (45% to 27% respectively).
The significant increase in overweight in adolescents is concerning. While there has been a focused effort to address healthy eating and physical activity in early childhood and primary school settings, there have been few large-scale programs implemented in secondary schools and other settings for adolescents. Strategies are needed to engage adolescents, particularly those from low SES backgrounds and non-English speaking cultural backgrounds.
NSW SCHOOL PHYSICAL ACTIVITY AND NUTRITION SURVEY (SPANS) 2015 | SUMMARY REPORT
WEIGHT STATUS
9
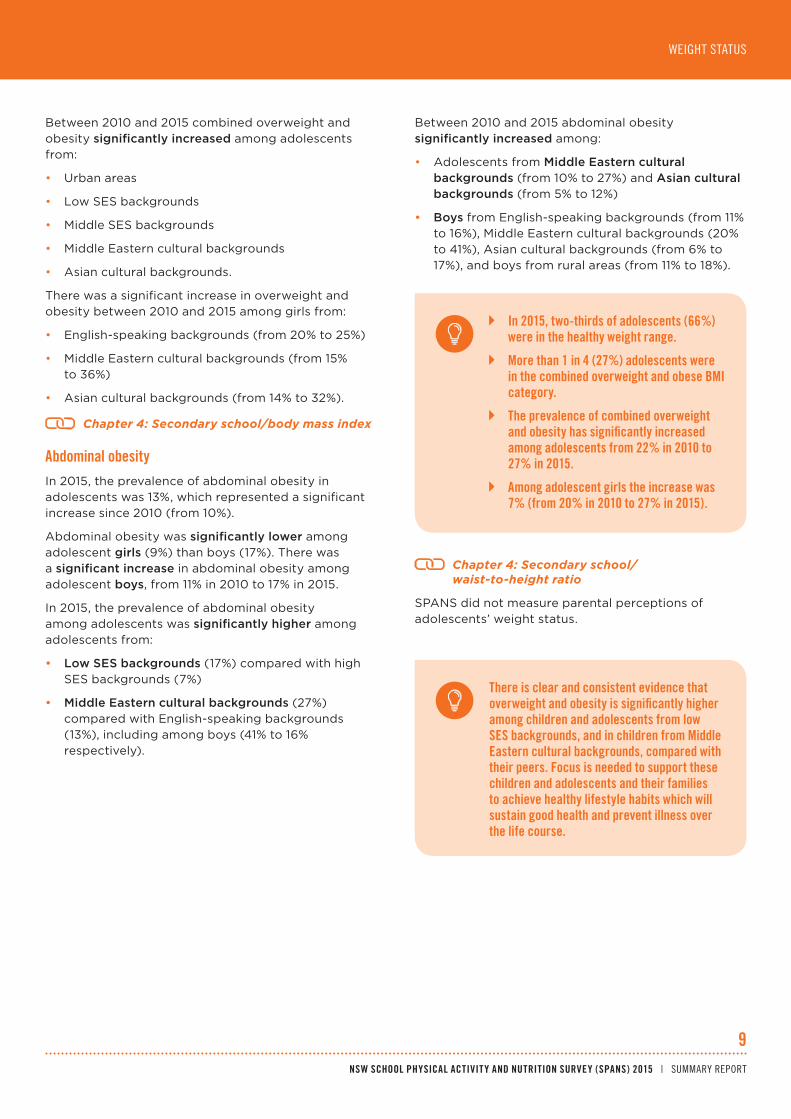
In 2015, two-thirds of adolescents (66%) were in the healthy weight range.
More than 1 in 4 (27%) adolescents were in the combined overweight and obese BMI category.
The prevalence of combined overweight and obesity has significantly increased among adolescents from 22% in 2010 to 27% in 2015.
Among adolescent girls the increase was 7% (from 20% in 2010 to 27% in 2015).
Between 2010 and 2015 combined overweight and obesity significantly increased among adolescents from:
• Urban areas
• Low SES backgrounds
• Middle SES backgrounds
• Middle Eastern cultural backgrounds
• Asian cultural backgrounds.
There was a significant increase in overweight and obesity between 2010 and 2015 among girls from:
• English-speaking backgrounds (from 20% to 25%)
• Middle Eastern cultural backgrounds (from 15% to 36%)
• Asian cultural backgrounds (from 14% to 32%).
Chapter 4: Secondary school/body mass index
Abdominal obesityIn 2015, the prevalence of abdominal obesity in adolescents was 13%, which represented a significant increase since 2010 (from 10%).
Abdominal obesity was significantly lower among adolescent girls (9%) than boys (17%). There was a significant increase in abdominal obesity among adolescent boys, from 11% in 2010 to 17% in 2015.
In 2015, the prevalence of abdominal obesity among adolescents was significantly higher among adolescents from:
• Low SES backgrounds (17%) compared with high SES backgrounds (7%)
• Middle Eastern cultural backgrounds (27%) compared with English-speaking backgrounds (13%), including among boys (41% to 16% respectively).
Between 2010 and 2015 abdominal obesity significantly increased among:
• Adolescents from Middle Eastern cultural backgrounds (from 10% to 27%) and Asian cultural backgrounds (from 5% to 12%)
• Boys from English-speaking backgrounds (from 11% to 16%), Middle Eastern cultural backgrounds (20% to 41%), Asian cultural backgrounds (from 6% to 17%), and boys from rural areas (from 11% to 18%).
Chapter 4: Secondary school/ waist-to-height ratio
SPANS did not measure parental perceptions of adolescents’ weight status.
There is clear and consistent evidence that overweight and obesity is significantly higher among children and adolescents from low SES backgrounds, and in children from Middle Eastern cultural backgrounds, compared with their peers. Focus is needed to support these children and adolescents and their families to achieve healthy lifestyle habits which will sustain good health and prevent illness over the life course.

NSW HEALTH
10
FOOD CONSUMPTION
Promoting healthy eating among children and adolescents promotes optimal growth and development and helps prevent the risk of developing diet-related diseases in later life.
The Australian Dietary Guidelines recommend enjoying a wide variety of foods from the five food groups every day and limiting discretionary (unhealthy) foods and drinks by consuming them sometimes and in small amounts.
National data indicates that discretionary foods are providing up to 41% of energy intake in children and adolescents.
PRIMARY SCHOOL
FruitOverall 4 in 5 children (78%) consumed the recommended two serves of fruit a day.
Children from Asian cultural backgrounds were significantly less likely to eat the recommended serves of fruit (67%), compared with children from English-speaking backgrounds (79%).
Chapter 5: Primary school/fruit consumption
SNAPSHOT: CHILDREN AND ADOLESCENTS AGE 5-16 YEARSIn 2015, around 4 in 5 children and adolescents (79%) met the recommended daily intake of fruit (2 serves a day) but less than 1 in 10 (7%) met the recommended daily intake of vegetables (5 serves a day).
Children and adolescents less likely to meet the vegetable recommendation included those from urban areas, low SES backgrounds, and the thin BMI category.
Children and adolescents frequently consumed a range of energy-dense and nutrient poor foods and drinks:
48% of children and adolescents ate processed snack food products (sweet and savoury biscuits, cakes, donuts or muesli bars) 3 or more times a week
32% of children and adolescents ate potato chips 3 or more times a week
27% of children and adolescents ate confectionery 3 or more times a week
10% of children and adolescents ate fried potato products 3 or more times a week
35% of children and 44% of adolescents ate processed meats 3 or more times per week
9% of children and adolescents drank one or more cups of soft drink daily.
Overall
4 in 5 children (78%)consumed the recommended
two serves of fruit a day.

NSW SCHOOL PHYSICAL ACTIVITY AND NUTRITION SURVEY (SPANS) 2015 | SUMMARY REPORT
11
FOOD CONSUMPTION
VegetablesThe 2013 Australian Dietary Guidelines recommend that children and adolescents age 5-16 eat around 5 serves of vegetables and legumes daily.
Only 1 in 20 children (5%) consumed the daily recommendation for vegetables.
There was a small but significant increase of 1% in consumption of recommended amounts of vegetables between 2010 and 2015. A 3% increase in meeting the daily vegetable recommendation was found in children from Asian cultural backgrounds, and for children in the thin and overweight BMI categories.
Chapter 5/primary school/consumption of vegetables
MeatAlmost half (48%) of children usually consumed red meat more than 3 times a week. Although the amounts consumed are not known, the number consuming red meat more than 3 times a week decreased between 2010 and 2015.
Processed meats such as salami, sausages and bacon are high in saturated fat and salt and their intake should be limited. 1 in 3 children (33%) usually consumed these foods 3 or more times a week.
Snack foodsHalf (51%) of children usually consumed fried potato products 1 to 2 times a week. 7% of children ate these products 3 to 6 times a week. Almost 1 in 4 children (23%) ate potato crisps 3 to 6 times a week and more than 1 in 3 (37%) ate them 1 to 2 times a week. Hot chips, wedges and fried potato, and potato crisps are likely to contain high amounts of fat, saturated fat and salt.
Consumption of vegetables reduces the risk of chronic disease such as cardiovascular disease and some cancers.
4 in 10 children (39%) usually consumed snack foods such as biscuits, muesli bars, doughnuts and cakes 1 to 2 times a week. 37% of children usually consumed these foods 3 to 6 times a week, and 1 in 10 (11%) usually consumed snack foods daily.
Recommended daily fruit consumption significantly increased between 2010 and 2015 among:
Both girls (from 75% to 79%) and boys (from 70% to 77%).
Children from urban (from 72% to 77%) and rural areas (from 71% to 82%).
Children from low SES backgrounds (from 67% to 76%) and high SES backgrounds (from 74% to 79%).
Almost half of children usually ate confectionery (47%) or ice cream/ice blocks (46%) 1 to 2 times a week. However daily consumption of these products appear to have declined, from 10% in 2010 to 6% in 2015.
WaterWater is the best way to quench thirst – and it doesn’t come with the added sugar found in fruit juices, soft drinks, and other sweetened drinks. Drinking water instead of sweetened drinks also prevents dental problems, while the fluoride found in tap water can help strengthen teeth and bones.
3 in 4 children (76%) usually drank at least 2 cups of water a day.
MilkGuidelines recommend that children aged 4 to 11 years consume between 1.5 and 3 serves of dairy foods a day (mostly reduced fat).
Most children (61%) consumed whole milk with 26% of children consuming reduced- or low-fat milk or skim milk.

NSW HEALTH
12
FOOD CONSUMPTION
Fruit juiceMore than 1 in 4 children never drank fruit juice (29%) or drank less than 1 cup a week (27%).
However 29% of children drank two to six cups of fruit juice a week.
Sugary drinks (soft drinks, sports and energy drinks)Soft drinks are a major contributor to sugar in children’s diets. There are clear links between soft drink consumption and increased body weight and dental decay.
Overall 5% of children consumed 1 or more cups of soft drink a day in 2015. This was significantly higher among children from low SES backgrounds (9%) compared with children from high SES backgrounds (4%).
Three times as many girls from low SES backgrounds (9%) as girls from high SES backgrounds (3%) drank more than 1 cup of soft drink daily.
Twice as many children from Middle Eastern cultural backgrounds (11%) compared with English-speaking backgrounds (5%), among both boys and girls, drank 1 or more cups of soft drink daily. More than twice as many children in the obese BMI category (12%), compared with children in the healthy weight BMI category (5%), drank 1 or more cups of soft drink daily.
There is no evidence to suggest that sports drinks are beneficial when children participate in short bouts of physical activity, or that they prevent dehydration among non-athletes. Dietary guidelines recommend limiting consumption of sports drinks, which are high in sugar and of limited nutritional value.
The prevalence of drinking sports drinks increased with age, from 3% in Kindergarten and year 2, to 8% in Year 4. By year 6, 19% of children were drinking 1 cup or less a week and a further 16% were drinking more than 2 cups a week.
Overall 6% of children consumed energy drinks, but among year 6 children, prevalence was substantially higher at 21%.
Chapter 5: Primary school/beverages
SECONDARY SCHOOL
Fruit80% of adolescents meet the recommended daily intake of 2 serves of fruit.
Rural adolescents (86%) met the recommendation more often than urban adolescents (78%).
Prevalence of meeting the fruit recommendation significantly increased between 2010 and 2015, mainly driven by an increase among girls with 81% in 2015 meeting the recommendation compared to 73% in 2010. Significant increases were observed among:
• Rural adolescents (from 65% to 86%)
• Adolescents from low SES backgrounds (from 69% to 81%)
• Adolescents from English-speaking backgrounds (from 73% to 81%)
• Adolescents in the healthy weight BMI category (from 75% to 81%).
Just over two in three adolescents from Asian cultural backgrounds (69%) achieved the daily fruit recommendation compared with four-fifths of their English-speaking peers (81%).
Chapter 5: Secondary school/fruit consumption
In 2015, 80% of adolescents met the recommended daily intake of
fruit of 2 serves a day.
This increased by 6% between 2010 and 2015.
NSW SCHOOL PHYSICAL ACTIVITY AND NUTRITION SURVEY (SPANS) 2015 | SUMMARY REPORT
13
FOOD CONSUMPTION
VegetablesThe Australian Dietary Guidelines recommend that boys age 12-16 years consume 5.5 serves of vegetables a day and girls 5 serves a day.
Just over 1 in 10 adolescents (11%) consumed more than 5 serves of vegetables daily.
Snack foodsHalf of adolescents (50%) usually ate fried potato products 1 to 2 times a week, 12% ate them 3 to 6 times a week and 1% ate them daily, in 2015.
39% of adolescents usually ate potato crisps 1 to 2 times a week, 29% ate them 2 to 6 times a week and 7% ate them daily in 2015.
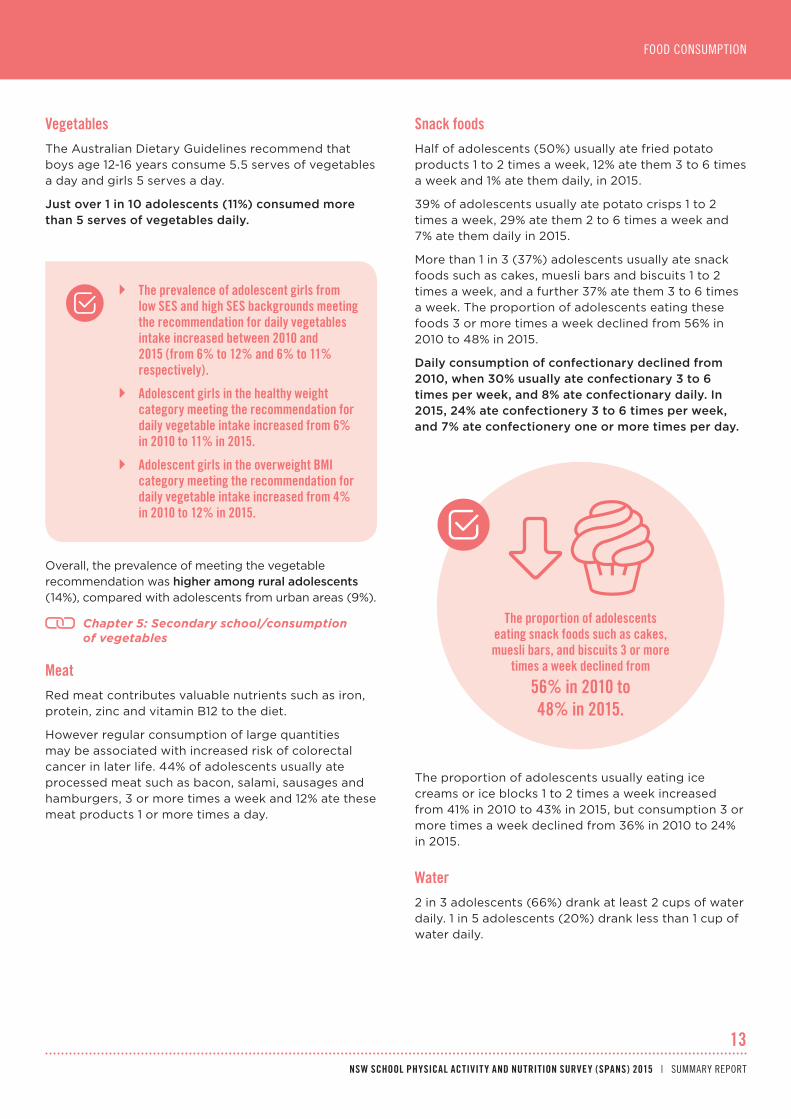
More than 1 in 3 (37%) adolescents usually ate snack foods such as cakes, muesli bars and biscuits 1 to 2 times a week, and a further 37% ate them 3 to 6 times a week. The proportion of adolescents eating these foods 3 or more times a week declined from 56% in 2010 to 48% in 2015.
Daily consumption of confectionary declined from 2010, when 30% usually ate confectionary 3 to 6 times per week, and 8% ate confectionary daily. In 2015, 24% ate confectionery 3 to 6 times per week, and 7% ate confectionery one or more times per day.
The prevalence of adolescent girls from low SES and high SES backgrounds meeting the recommendation for daily vegetables intake increased between 2010 and 2015 (from 6% to 12% and 6% to 11% respectively).
Adolescent girls in the healthy weight category meeting the recommendation for daily vegetable intake increased from 6% in 2010 to 11% in 2015.
Adolescent girls in the overweight BMI category meeting the recommendation for daily vegetable intake increased from 4% in 2010 to 12% in 2015.
Overall, the prevalence of meeting the vegetable recommendation was higher among rural adolescents (14%), compared with adolescents from urban areas (9%).
Chapter 5: Secondary school/consumption of vegetables
MeatRed meat contributes valuable nutrients such as iron, protein, zinc and vitamin B12 to the diet.
However regular consumption of large quantities may be associated with increased risk of colorectal cancer in later life. 44% of adolescents usually ate processed meat such as bacon, salami, sausages and hamburgers, 3 or more times a week and 12% ate these meat products 1 or more times a day.
The proportion of adolescents usually eating ice creams or ice blocks 1 to 2 times a week increased from 41% in 2010 to 43% in 2015, but consumption 3 or more times a week declined from 36% in 2010 to 24% in 2015.
Water2 in 3 adolescents (66%) drank at least 2 cups of water daily. 1 in 5 adolescents (20%) drank less than 1 cup of water daily.
The proportion of adolescents eating snack foods such as cakes, muesli bars, and biscuits 3 or more
times a week declined from
56% in 2010 to 48% in 2015.
NSW HEALTH
14
MilkDietary guidelines recommend that adolescents aged 12-18 consume 3.5 serves of dairy foods per day, mostly of reduced fat types of dairy food.
42% of adolescents drank 1 or more cups of milk daily. More than half of adolescents (55%) consumed whole milk and 8% did not know what type of milk they consumed.
Fruit juiceDietary guidelines recommend limiting fruit juice consumption in adolescents, however 15% of adolescents consumed more than 1 cup a day.
Sugary drinks (soft drinks, sports and energy drinks)
Soft drinkDietary guidelines discourage consumption of soft drinks (i.e., carbonated, sugar-sweetened beverages) in adolescents. Almost one-third of adolescents (31%) drank 2 to 6 cups a week and 1 in 10 adolescents (10%) consumed 1 or more cups daily. This was significantly higher among low SES (13%) and middle SES (11%) background adolescents compared with high SES background adolescents (6%).
Drinking 1 or more cups of soft drink daily was more prevalent among girls in the obese BMI category (13%) compared with girls in the healthy weight BMI category (6%).
FOOD CONSUMPTION
Sports drinkOverall, 19% of adolescents drank 2 to 6 cups of sports drink a week.
Adolescent girls were more likely to never or rarely drink sports drinks than adolescent boys (69% compared with 43%).
Energy drinkOverall 19% of adolescents consumed energy drinks and 81% did not consume energy drinks.
Questions about energy drinks were included in SPANS in 2015 for the first time, as there is emerging evidence that these products are becoming very popular among adolescent age groups in Australia.
Chapter 5: Secondary school/beverages
Strategies to discourage consumption of soft drink and other sugar sweetened drinks are important in obesity prevention and management.
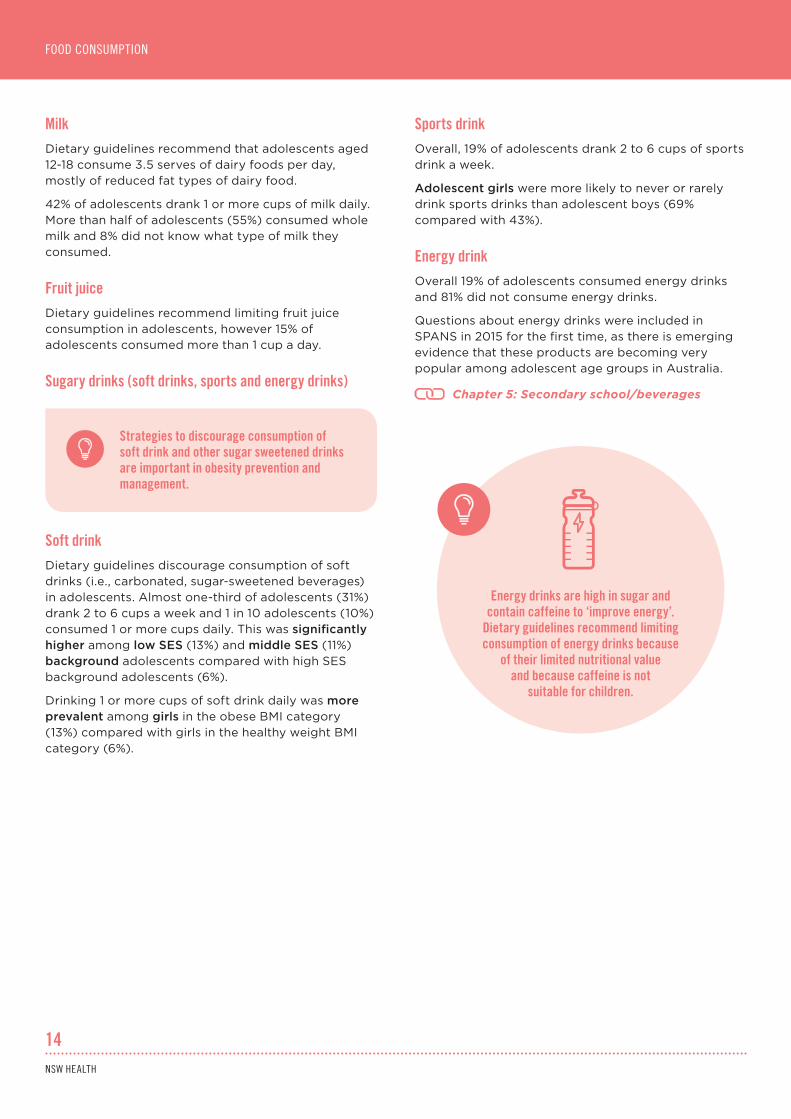
Energy drinks are high in sugar and contain caffeine to ‘improve energy’.
Dietary guidelines recommend limiting consumption of energy drinks because
of their limited nutritional value and because caffeine is not
suitable for children.
NSW SCHOOL PHYSICAL ACTIVITY AND NUTRITION SURVEY (SPANS) 2015 | SUMMARY REPORT
15
DIETARY BEHAVIOURS
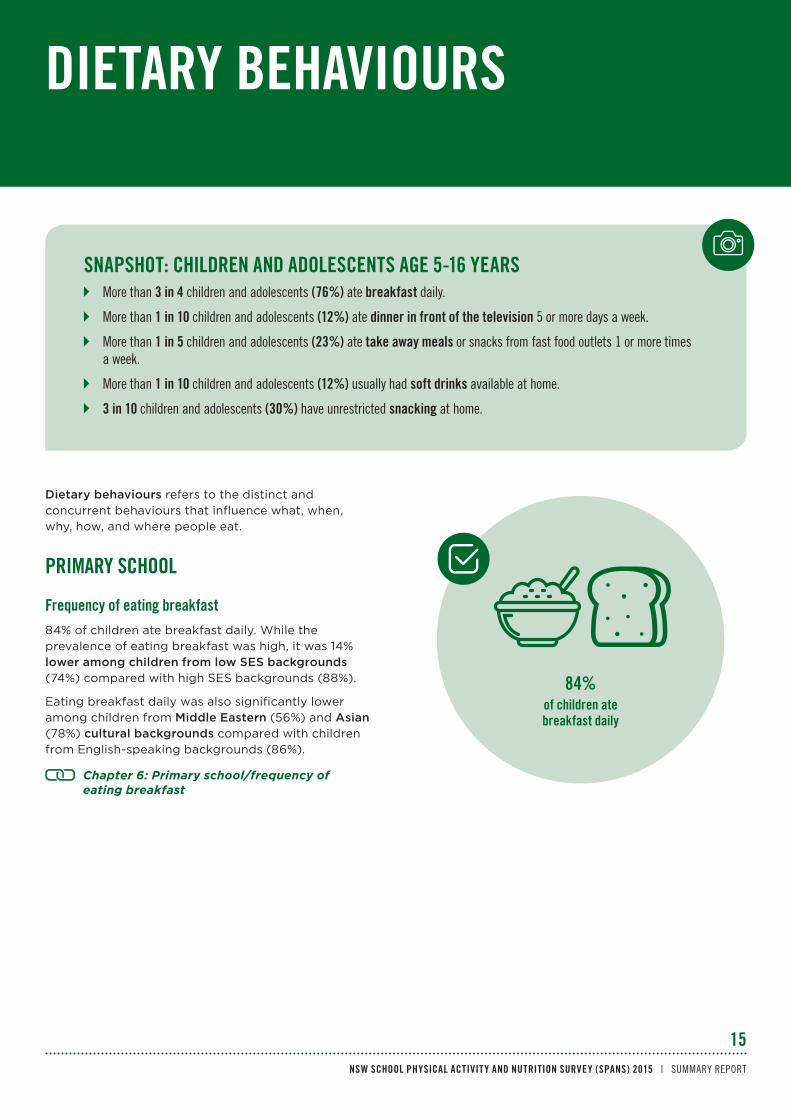
SNAPSHOT: CHILDREN AND ADOLESCENTS AGE 5-16 YEARS More than 3 in 4 children and adolescents (76%) ate breakfast daily.
More than 1 in 10 children and adolescents (12%) ate dinner in front of the television 5 or more days a week.
More than 1 in 5 children and adolescents (23%) ate take away meals or snacks from fast food outlets 1 or more times a week.
More than 1 in 10 children and adolescents (12%) usually had soft drinks available at home.
3 in 10 children and adolescents (30%) have unrestricted snacking at home.
Dietary behaviours refers to the distinct and concurrent behaviours that influence what, when, why, how, and where people eat.
PRIMARY SCHOOL
Frequency of eating breakfast84% of children ate breakfast daily. While the prevalence of eating breakfast was high, it was 14% lower among children from low SES backgrounds (74%) compared with high SES backgrounds (88%).
Eating breakfast daily was also significantly lower among children from Middle Eastern (56%) and Asian (78%) cultural backgrounds compared with children from English-speaking backgrounds (86%).
Chapter 6: Primary school/frequency of eating breakfast
84%of children ate breakfast daily

NSW HEALTH
16
DIETARY BEHAVIOURS
Unrestricted snacking at homeUnrestricted snacking was included in SPANS for the first time in 2015. The question asked whether children can ‘snack on junk food whenever they like’ or ‘they have to ask me (a parent) first’.
Children from Middle Eastern cultural backgrounds were significantly more likely to have unrestricted snacking at home (34%) than children from English-speaking backgrounds (13%).
Overall, 14% of children snack without restriction on junk food at home. Children in the obese BMI category had a significantly higher prevalence of unrestricted snacking at home (20%) compared with their healthy weight peers (14%).
Chapter 6: Primary school/unrestricted snacking at home
Eating dinner in front of the TVAlmost half of children (45%) rarely or never ate dinner in front of the TV. However 1 in 10 children (11%) ate dinner in front of the TV every day.
Approximately 16% of children ate dinner in front of the TV 5 or more times a week. Children from low SES backgrounds (21%) were significantly more likely to eat dinner in front of the TV 5 or more times a week than their high SES peers (14%).
Prevalence of eating dinner in front of the TV 5 or more times a week was also higher among children from Middle Eastern and Asian cultural backgrounds (22% and 23% respectively) than English-speaking background children (15%).
Chapter 6: Primary school/eating dinner in front of the TV
Being offered sweets as a reward for good behaviourThe American Academy of Paediatrics advises that food should be used as nourishment, not as a reward for good behaviour. 58% of children were usually or sometimes offered sweets by their parents as a reward for good behaviour. There were no apparent changes between 2010 and 2015.
Chapter 6: Primary school/being offered sweets as a reward for good behaviour
Soft drink availability in the home7% of children usually had soft drinks available in the home, 39% sometimes had soft drinks available, and 62% rarely or never had soft drinks available at home.
Having soft drink available in the home was almost three times as likely among children from low SES backgrounds than high SES backgrounds (13% compared with 5% respectively), and children from Middle Eastern cultural backgrounds than English-speaking backgrounds (21% compared with 7%).
Chapter 6: Primary school/soft drink availability in the home
Over 60% of sugar-sweetened beverages are consumed at home, and children are among the highest consumers of these products in Australia. However these beverages have substantial energy, with little or no nutritional benefit.
Junk food includes items such as lollies, ice cream, cakes, biscuits, and soft drinks.
Fast food consumptionFast foods are generally high in kilojoules, saturated fat, sugar and salt. 1 in 5 children (20%) usually ate take away meals or snacks from a fast food outlet 1 or more times a week.
This had decreased from 1 in 4 children (24%) in 2010, and also significantly decreased among children from high SES backgrounds (from 23% in 2010 to 15% in 2015).
Fast food consumption was significantly more prevalent among children from low SES backgrounds (28%) compared with high SES backgrounds (15%), and among children from Middle Eastern cultural backgrounds and in the obese BMI category.
Chapter 6: Primary school/fast food consumption

NSW SCHOOL PHYSICAL ACTIVITY AND NUTRITION SURVEY (SPANS) 2015 | SUMMARY REPORT
17
DIETARY BEHAVIOURS
Buying lunch from the school canteenAround half of children (55%) purchased food from the school canteen 1 or more times a week.
Chapter 6: Primary school/buying lunch from the school canteen
In 2015, prevalence was significantly lower among girls (54%) compared with boys (66%), which may be due to a mistaken perception among adolescents that skipping breakfast is effective for weight maintenance or loss.
Adolescents from low SES and middle SES backgrounds were less likely (55% and 56% respectively) to eat breakfast daily than their high SES background peers (68%).
More adolescents of healthy weight (62%) ate breakfast daily than their counterparts in the overweight (53%) and obese (50%) BMI categories.
Chapter 6: Secondary school/eating breakfast daily
Eating dinner in front of the TVBoth watching TV and watching TV during mealtimes are positively associated with overweight. More than half (53%) of adolescents rarely or never ate dinner in front of the television or did so less than once a week. 1 in 5 (21%) adolescents ate dinner in front of the TV 5 or more times a week.
The prevalence of eating dinner in front of the TV 5 or more times a week was significantly higher among adolescents from low SES (23%) and middle SES (24%) backgrounds than high SES backgrounds (17%).
Similarly, eating dinner in front of the TV on 5 or more nights a week was almost twice as prevalent among girls from Middle Eastern (37%) cultural background as English-speaking background girls (19%).
Chapter 6: Secondary school/eating dinner in front of the TV
The practice of eating breakfast daily significantly declined among adolescents by 6% between 2010 and 2015 (from 66% to 60%).
Drinks purchased at school4 in 10 children (41%) purchased drinks from the school canteen, most often plain or flavoured milk (18%) and fruit juice (12%). Around 1 in 10 children (11%) purchased drinks from a school vending machine.
Chapter 6: Primary school/drinks purchased at school
SECONDARY SCHOOL
Eating breakfast dailyDaily breakfast consumption is associated with a healthier diet pattern, while irregularly eating breakfast is associated with an increased probability of being overweight or obese.
60% of adolescents ate breakfast every day and 12% rarely or never ate breakfast. The practice of eating breakfast daily significantly declined by 6% between 2010 and 2015 (from 66% to 60%).
The school canteen may contribute to a substantial portion of a child’s daily food intake.
Healthy school canteens provide an opportunity to encourage and support healthy eating.
In 2015, adolescents from low SES backgrounds, Middle Eastern cultural backgrounds and Asian cultural backgrounds were more likely than their peers to skip breakfast, eat dinner in front of the TV regularly, have soft drinks available in the home, snack without restriction at home, and consume take away and fast food at least once a week.
More than half (53%)of adolescents rarely or never
ate dinner in front of the television or did so less than once a week.

NSW HEALTH
18
Being offered sweets as a reward for good behaviour46% of adolescents were sometimes or usually offered sweets by parents as a reward for good behaviour.
Chapter 6: Secondary school/being offered sweets as a reward for good behaviour
Soft drink availability in the home38% of adolescents never or rarely had soft drinks available in the home, with 62% sometimes or usually having soft drinks available. While availability at home went down between 2010 and 2015, having soft drink available in the home was still higher in 2015 among low SES homes of adolescents (24%), than in homes of high SES background adolescents (16%).
Chapter 6: Secondary school/soft drink availability in the home
Fast food consumptionAround 1 in 4 adolescents (24%) usually ate a meal or snacks from a fast food outlet 1 or more times a week. Prevalence of fast food consumption one or more times per week was higher among urban adolescents (27%) than rural adolescents (13%). The prevalence of fast food consumption among rural adolescents decreased from 27% in 2010 to 13% in 2015.
The prevalence of fast food consumption also declined between 2010 and 2015 among:
• Adolescents from low SES backgrounds (from 35% to 23%)
• Adolescents from English-speaking backgrounds (from 28% to 22%)
• Adolescents in the healthy weight and overweight BMI categories
• Adolescents from rural areas (27% to 13%).
Chapter 6: Secondary school/fast food consumption
DIETARY BEHAVIOURS
Availability of soft drinks in the home decreased among both rural and urban
adolescents between 2010 and 2015. It also decreased among every socio-economic
group between 2010 and 2015.
Unrestricted snacking at homeOverall, 61% of adolescents did not have to ask their parent’s permission to ‘snack on junk food whenever I like’. Fewer adolescents from rural areas (55%) compared with urban areas (63%) snacked without restriction at home.
Further, almost three-quarters (74% each) of adolescents from Middle Eastern and Asian cultural backgrounds did not have to seek permission for snacking compared to adolescents from English-speaking backgrounds (59%).
Chapter 6: Secondary school/unrestricted snacking at home
The prevalence of fast food consumption declined among adolescents in rural areas, and among adolescents in some socio-demographic groups.
Buying lunch from the school canteenOverall, 61% of adolescents purchased food from the school canteen one or more times a week.
Chapter 6/secondary school/buying lunch from the school canteen
Drinks purchased at school6 out of 10 adolescents (62%) purchased drinks from the school canteen (frequency of purchases is not recorded). Of drinks purchased from the school canteen, 18% were plain or flavoured milk, 14% were plain water, and 10% were fruit juice.
One-third of adolescents (33%) reported purchasing drinks from a school vending machine, with regular soft drink being the most commonly purchased.
Regular soft drink accounted for 9% of school canteen drink purchases and 10% of vending machine purchases.
Chapter 6/secondary school/drinks purchased at school

NSW SCHOOL PHYSICAL ACTIVITY AND NUTRITION SURVEY (SPANS) 2015 | SUMMARY REPORT
19
PHYSICAL ACTIVITY AND HEALTH-RELATED FITNESS
SNAPSHOT: CHILDREN AND ADOLESCENTS AGE 5-16 YEARSIn 2015, only around 1 in 5 children and adolescents (19%) met the daily physical activity recommendation of at least 60 minutes of moderate to vigorous intensity physical activity (MVPA) every day.
Differences between socio-demographic groups were observed, including:
Girls (15%) were less likely to meet the recommendation than boys (24%)
Children and adolescents from rural areas were more likely to meet the recommendation (22%) than those from urban areas (18%)
Children and adolescents from Middle Eastern (13%) and Asian cultural backgrounds (9%) were less likely to meet the recommendation than those from English-speaking backgrounds (20%)
Overweight (14%) and obese (15%) BMI children and adolescents were less likely to meet the recommendation than peers in the healthy weight BMI category (21%).
Overall, around 2 in 3 children and adolescents (65%) achieved the healthy fitness zone for cardiorespiratory fitness, and 1 in 3 (36%) achieved the healthy fitness zone for muscular fitness.
PRIMARY SCHOOL
Physical activityPhysical activity is associated with a wide range of health, social, economic and environmental benefits, and is beneficial across the lifespan. Important health benefits of physical activity during childhood and adolescence include:
• favourable skeletal development
• improved metabolic profile
• improved psychological wellbeing
• increased likelihood of physical activity during adulthood.
Physical activity is generally classified as low, moderate or vigorous intensity on the basis of energy expenditure measured in metabolic equivalents (METs). Health benefits accrue from physical activity which is at least of moderate intensity.
Australia’s physical activity guidelines recommend children 5 to 12 years should do at least 60 minutes of moderate-to-vigorous intensity physical activity (MVPA) every day, participate in a variety of activities including those which strengthen muscle and bone, and engage in more activity to achieve additional health benefits.
NSW HEALTH
20
PHYSICAL ACTIVITY AND HEALTH-RELATED FITNESS
Overall, 23% of children met the physical activity recommendation (60 minutes) on 7 days each week, and 4% of children did not achieve 60 minutes of MVPA on any days.
Indicators of health-related physical fitnessSPANS measures health-related physical fitness in two ways:
• Cardiorespiratory fitness (measured by the 20 metre multi-stage shuttle run, or ‘beep test’)
• Muscular fitness (the ability of muscles to undertake short-duration activities powered by metabolic pathways that do not use oxygen, measured by a standing broad jump which uses lower limb explosive power).
Less than 1 in 4 (23%) children met the physical activity recommendation every day.
Among children from Asian cultural backgrounds this was around 1 in 10 (11%).
63% of children were in the healthy fitness zone for cardiorespiratory fitness.
37% of children were in the healthy fitness zone for muscular fitness.
Children in the overweight BMI category (24%) were half as likely to be in the healthy fitness zone for muscular fitness while children in the obese category were four times less likely (11%), compared with children in the healthy weight category (43%).
The prevalence of meeting the recommendation was significantly lower among:
• Girls (18%) compared with boys (28%)
• Children from urban areas (22%) compared with rural areas (28%)
• Children from Middle Eastern (14%) and Asian (11%) cultural backgrounds compared with children from English-speaking (24%) backgrounds
• Children in the overweight (17%) and obese (16%) BMI categories compared with their healthy weight (25%) peers.
Chapter 8: Primary school/physical activity
Awareness of national physical activity recommendations for childrenParticipants were asked ‘How many minutes of physical activity are recommended for young people to participate in each day?’, and responses included a ‘don’t know’ option. Over 1 in 4 (27%) participants correctly reported the physical activity recommendation (60 minutes). The prevalence of correctly reporting the recommendation significantly increased between 2010 and 2015 (from 17% to 27%). Overall 47% of respondents did not know the recommendation. The prevalence of not knowing the recommendation increased significantly between 2010 and 2015 (from 37% to 47%).
Chapter 8: Primary school/awareness of national children’s physical activity recommendation
In 2015, almost two-thirds of children (63%) were in the healthy fitness zone for cardiorespiratory fitness. This was significantly lower among children from low SES backgrounds (46%) compared with high SES backgrounds (68%), and lower among children from Middle Eastern (42%) and Asian (53%) cultural backgrounds compared with children from English-speaking backgrounds (65%).
Measuring muscular fitness was introduced to SPANS for the first time in 2015. Muscular fitness underpins most of children’s physical activity, typically composed of short bursts of activity. Standing broad jumps were performed by children in years 2, 4 and 6. Overall, one-third of children (37%) were in the healthy fitness zone for muscular fitness.
Achievement of the healthy fitness zone for muscular fitness was lower among children from low SES backgrounds, and Middle Eastern and Asian cultural backgrounds than their counterparts.
Chapter 8: Primary school/indicators of health-related physical fitness
NSW SCHOOL PHYSICAL ACTIVITY AND NUTRITION SURVEY (SPANS) 2015 | SUMMARY REPORT
21
PHYSICAL ACTIVITY AND HEALTH-RELATED FITNESS
SECONDARY SCHOOL
Physical activityPhysical activity is defined as any bodily movement of large muscle groups. Physical fitness is a physiological attribute which allows individuals to achieve certain performance standards for physical activity.
Approximately 1 in 10 adolescents (12%) met the recommendation of at least 60 minutes in MVPA on every day of the week. Girls achieved the recommendation on 3.4 days a week on average and boys achieved the recommendation on 3.9 days a week on average.
5% of adolescents did not achieve the recommended daily physical activity on any days a week.
The prevalence of meeting the physical activity recommendation was significantly lower among adolescents from Asian cultural backgrounds (6%) compared with English-speaking backgrounds (12%).
Chapter 8: Secondary school/physical activity
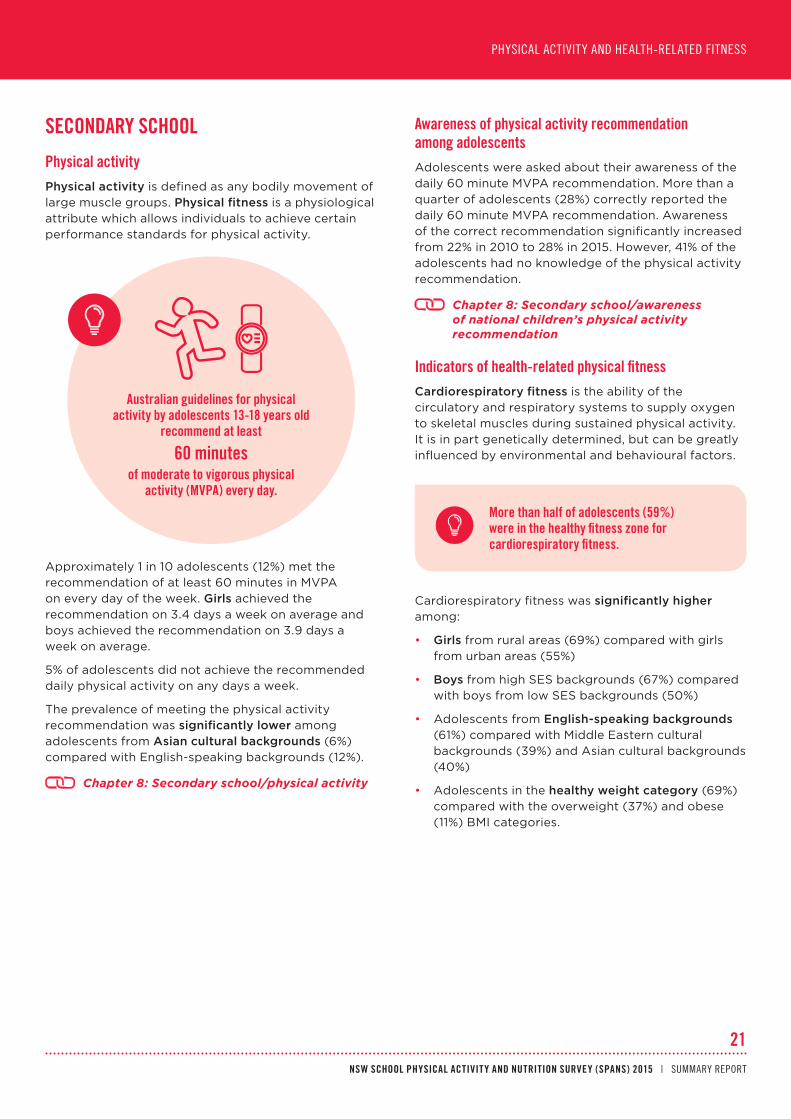
Australian guidelines for physical activity by adolescents 13-18 years old
recommend at least
60 minutesof moderate to vigorous physical
activity (MVPA) every day.
Awareness of physical activity recommendation among adolescentsAdolescents were asked about their awareness of the daily 60 minute MVPA recommendation. More than a quarter of adolescents (28%) correctly reported the daily 60 minute MVPA recommendation. Awareness of the correct recommendation significantly increased from 22% in 2010 to 28% in 2015. However, 41% of the adolescents had no knowledge of the physical activity recommendation.
Chapter 8: Secondary school/awareness of national children’s physical activity recommendation
Indicators of health-related physical fitnessCardiorespiratory fitness is the ability of the circulatory and respiratory systems to supply oxygen to skeletal muscles during sustained physical activity. It is in part genetically determined, but can be greatly influenced by environmental and behavioural factors.
More than half of adolescents (59%) were in the healthy fitness zone for cardiorespiratory fitness.
Cardiorespiratory fitness was significantly higher among:
• Girls from rural areas (69%) compared with girls from urban areas (55%)
• Boys from high SES backgrounds (67%) compared with boys from low SES backgrounds (50%)
• Adolescents from English-speaking backgrounds (61%) compared with Middle Eastern cultural backgrounds (39%) and Asian cultural backgrounds (40%)
• Adolescents in the healthy weight category (69%) compared with the overweight (37%) and obese (11%) BMI categories.

NSW HEALTH
PHYSICAL ACTIVITY AND HEALTH-RELATED FITNESS
There was a significant decrease in the proportion of adolescents who achieved cardiorespiratory fitness between 2010 and 2015 among adolescents from:
• Urban areas (from 66% to 57%)
• High SES backgrounds (from 77% to 66%)
• Asian cultural backgrounds (from 66% to 40%).
Muscular fitness is protective against adiposity (excessive fat), cardiovascular disease, metabolic risk factors and has beneficial effects on bone and self-esteem.
Around one-third (35%) of adolescents achieved the healthy fitness zone for muscular fitness. The prevalence of muscular fitness was significantly lower among adolescents:
• From low SES (31%) and middle SES (31%) backgrounds compared with high SES backgrounds (44%)
• In the overweight (22%) and obese (8%) BMI categories compared with the healthy weight category (41%).
Chapter 8: Secondary school/indicators of health-related physical fitness
22
Adolescents with obesity were the least likely groups to achieve the healthy
fitness zone for muscular fitness (10% and 7% respectively). Overall, 35% of
adolescents achieved the healthy fitness zone.

NSW SCHOOL PHYSICAL ACTIVITY AND NUTRITION SURVEY (SPANS) 2015 | SUMMARY REPORT
23
FUNDAMENTAL MOVEMENT SKILLS
SNAPSHOT: CHILDREN AND ADOLESCENTS AGE 5-16 YEARSIn 2015 the prevalence of fundamental movement skills (FMS) competency was generally low among school age children and adolescents in NSW. However there were significant increases in all fundamental movement skills among both primary school aged boys and girls between 2010 and 2015.
Primary school children
• 67% of boys and 53% of girls demonstrated advanced skills in the catch.
• 54% of boys and 16% of girls demonstrated advanced skills in the kick.
• 52% of boys and 18% of girls demonstrated advanced skills in the over-arm throw.
• 75% of boys and 80% of girls demonstrated advanced skills in the side gallop.
• 45% of boys and 48% of girls demonstrated advanced skills in the vertical jump.
• 24% of boys and 49% of girls demonstrated advanced skills in the leap.
• 52% of boys and 43% of girls demonstrated advanced skills in the sprint run.
Secondary school adolescents
• 87% of boys and 74% of girls demonstrated advanced skills in the catch.
• 74% of boys and 33% of girls demonstrated advanced skills in the kick.
• 67% of boys and 30% of girls demonstrated advanced skills in the over-arm throw.
• 93% of boys and 93% of girls demonstrated advanced skills in the side gallop.
• 74% of boys and 67% of girls demonstrated advanced skills in the vertical jump.
• 34% of boys and 54% of girls demonstrated advanced skills in the leap.
• 70% of boys and 55% of girls demonstrated advanced skills in the sprint run.
Fundamental movement skills (FMS) are the building blocks of movement and form the foundation for many of the specific motor skills required in sports and leisure activities. FMS include activities such as running, jumping, throwing and kicking. Importantly, FMS allow children to interact and explore their environment.
SPANS measures competency in both object control FMS (catch, kick and over-arm throw) and locomotor control FMS (side gallop, vertical jump, leap and sprint run). FMS were assessed using checklists developed by the NSW Department of Education resource Get Skilled: Get Active. Each skill has 5 to 6 components. ‘Advanced skills’ means the combined proportion of participants who clearly demonstrate mastery (all components) and near mastery (all but one component).

NSW HEALTH
24
FUNDAMENTAL MOVEMENT SKILLS
PRIMARY SCHOOL
CatchAround half of girls (53%) and two thirds of boys (67%) demonstrated advanced skills in the catch test. This was a significant increase from 2010, when 59% of boys and 41% of girls demonstrated advanced catch skills.
KickBetween 2010 and 2015, there was a significant increase in advanced skills in the kick among both girls (from 9% to 16%) and boys (from 42% to 54%).
Between 2010 and 2015 prevalence of advanced kick skills significantly increased among children:
• From rural and urban areas
• From low SES backgrounds
• From English-speaking backgrounds
• In the healthy weight, overweight and obese BMI categories.
Over-arm throwOne in 6 girls (18%) and over half of boys (52%) demonstrated advanced skills in the over-arm throw, and this significantly increased among both boys and girls between 2010 and 2015. Prevalence of advanced skills in over-arm throwing was lower among children from Asian cultural backgrounds (24%) compared with English-speaking backgrounds (36%).
Side gallopAdvanced skills in the side gallop in 2015 was significantly lower among children from low SES backgrounds, Middle Eastern cultural backgrounds and in the overweight and obese BMI categories.
Advanced catchBetween 2010 and 2015 the prevalence of advanced catch skills significantly increased among children:
• From urban areas
• From low SES backgrounds
• From English-speaking backgrounds
• In the overweight BMI category.
Between 2010 and 2015 the prevalence of advanced catch skills significantly increased among adolescents:
• From rural and urban areas
• In each SES tertile
• From English-speaking and Asian cultural backgrounds
• In each BMI category.
The fundamental movement skill with the highest prevalence of advanced competency for both girls and boys was the side gallop with 80% and 75% advanced competency respectively. There was a significant increase from 2010 (67% and 61% respectively).
Vertical jumpAlmost half of girls (48%) and boys (45%) demonstrated advanced skills in the vertical jump, and prevalence significantly increased between 2010 and 2015. Prevalence was significantly lower among children from low SES backgrounds, Middle Eastern and Asian cultural backgrounds and the overweight and obese BMI categories, in 2015.
Between 2010 and 2015 prevalence of vertical jump skills significantly increased among children:
• From rural and urban areas
• In each SES tertile
• From English-speaking, Middle Eastern and Asian cultural backgrounds
• In each BMI category.
Children who are proficient at fundamental movement skills are more
likely to be physically active, have adequate cardiorespiratory fitness, and
are less likely to be overweight or obese compared with children
who are not proficient.
NSW SCHOOL PHYSICAL ACTIVITY AND NUTRITION SURVEY (SPANS) 2015 | SUMMARY REPORT
25
FUNDAMENTAL MOVEMENT SKILLS
LeapAlmost twice as many girls (49%) as boys (24%) demonstrated advanced skills in the leap in 2015.
Advanced skills in the leap were significantly lower among children from low SES backgrounds (28%) compared with high SES backgrounds (41%), and among children in the overweight (29%) and obese (26%) BMI categories compared with the healthy weight (41%) BMI category.
Between 2010 and 2015 prevalence of advanced leap skills significantly increased among children:
• From rural and urban areas
• In each SES tertile
• From English-speaking, Middle Eastern and Asian cultural backgrounds
• In each BMI category.
SECONDARY SCHOOL
CatchAdolescents had a high prevalence of advanced skills in catch, and advanced skills were significantly higher among boys (87%) than girls (74%).
KickOne in 3 adolescent girls (33%) had advanced skills in catch compared with almost 3 in 4 (74%) adolescent boys. There were no significant changes between 2010 and 2015.
Sprint runOverall the prevalence of advanced skills in the sprint run was 43% among girls and 53% among boys in 2015. The difference between girls and boys was statistically significant. Between 2010 and 2015 the proportion of children achieving advanced skills in the sprint run significantly increased.
Prevalence of sprint run skills at advanced competency was significantly lower among children from low SES backgrounds, Middle Eastern cultural backgrounds and in the overweight and obese BMI categories, compared with their counterparts.
The development of FMS is developmentally sequenced and contingent upon multiple internal and external factors – biological, psychological, social, motivational, cognitive. The development of these skills occurs through a range of active play experiences and structured programs.
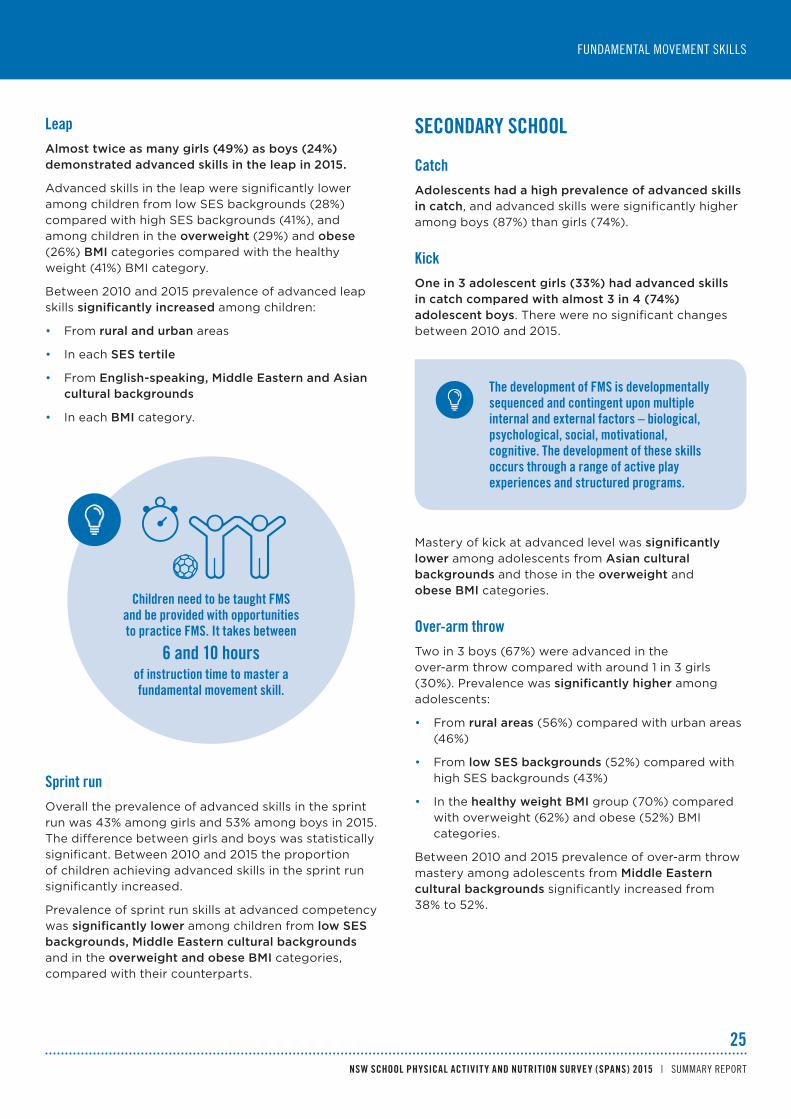
Children need to be taught FMS and be provided with opportunities to practice FMS. It takes between
6 and 10 hours of instruction time to master a fundamental movement skill.
Mastery of kick at advanced level was significantly lower among adolescents from Asian cultural backgrounds and those in the overweight and obese BMI categories.
Over-arm throwTwo in 3 boys (67%) were advanced in the over-arm throw compared with around 1 in 3 girls (30%). Prevalence was significantly higher among adolescents:
• From rural areas (56%) compared with urban areas (46%)
• From low SES backgrounds (52%) compared with high SES backgrounds (43%)
• In the healthy weight BMI group (70%) compared with overweight (62%) and obese (52%) BMI categories.
Between 2010 and 2015 prevalence of over-arm throw mastery among adolescents from Middle Eastern cultural backgrounds significantly increased from 38% to 52%.

NSW HEALTH
FUNDAMENTAL MOVEMENT SKILLS
Side gallopSide gallop was the fundamental movement skill with the highest prevalence of advanced competency (93%).
Between 2010 and 2015 the prevalence of side gallop mastery significantly increased among adolescents from rural areas, high SES backgrounds, English-speaking backgrounds, and in the healthy weight category.
LeapOverall, the prevalence of advanced skills for the leap was significantly lower among adolescent boys (35%) compared with girls (54%). Prevalence significantly increased among boys (from 19% to 35%) between 2010 and 2015. It was also significantly lower among adolescents from Middle Eastern and Asian cultural backgrounds and in the overweight BMI category.
Between 2010 and 2015 prevalence significantly increased among adolescents:
• From rural and urban areas
• In each SES tertile
• From English-speaking backgrounds
• In each BMI category.
Sprint runMore than half of adolescent girls (55%) and 7 in 10 boys (70%) achieved advanced mastery of the sprint run in 2015. Advanced mastery was significantly lower among adolescents from Middle Eastern (49%) and Asian (44%) cultural backgrounds compared with English-speaking backgrounds (66%), and in the overweight (54%) and obese (42%) BMI categories compared with the healthy weight category (68%).
26
Adolescents in the overweight and obese BMI categories were significantly less likely to have advanced skills in kick, throw, side gallop, leap and sprint run fundamental movement skills.
Vertical jumpAround two thirds of adolescent girls (67%) and three quarters of adolescent boys (74%) had advanced mastery of the vertical jump in 2015. This was significantly lower among adolescents from Middle Eastern (58%) and Asian (53%) cultural backgrounds compared with English-speaking backgrounds (73%).
There was a significant increase between 2010 and 2015 among adolescents:
• From rural and urban areas
• In each SES tertile
• From English-speaking backgrounds
• In the healthy weight, overweight and obese BMI categories.
Around two thirds of
adolescent girls (67%)and three quarters of
adolescent boys (74%)had advanced mastery of the vertical jump in 2015.
Chapter 9: Secondary school/mastery and near-mastery of fundamental movement skills
Between 2010 and 2015 advanced mastery of the sprint run significantly increased among adolescents:
From rural areas
From middle SES backgrounds
From English-speaking backgrounds
In the healthy weight and obese BMI categories.

NSW SCHOOL PHYSICAL ACTIVITY AND NUTRITION SURVEY (SPANS) 2015 | SUMMARY REPORT
27
SCHOOL TRAVEL
SNAPSHOT: CHILDREN AND ADOLESCENTS AGE 5-16 YEARSIn 2015 for both children and adolescents, active travel was the least prevalent form of transport to and from school. The primary modes of travel to and from school were car (43% and 37% for children and adolescents respectively), mixed travel modes (24% for both, public transport (19% and 22% respectively), and active travel (15% and 14% respectively).
There has been a significant increase in the proportion of children and adolescents who are driven to school by car, from 36% in 2010 to 43% in 2015, including among children and adolescents from:
Urban areas (from 37% to 47%)
High SES backgrounds (from 33% to 45%)
English-speaking backgrounds (from 36% to 42%)
Middle Eastern cultural backgrounds (from 45% to 66%).
This summary report focuses on travel to school – for results on travel from school, see the full report.
School travel was categorised into four mutually exclusive transport categories according to travel modes to and/or from school for five days a week, as follows:
Travel category Transport modes
Active travel Walking, cycling, skateboard, or scooter on 5 school days
Public transport Travel by train, bus, or ferry and/or walking on 5 school days
Car Travel by car on 5 school days
Mixed mode Multiple modes of travel i.e. active travel and/or public transport and/or car on 5 school days
Chapter 10: Travel home from school
NSW HEALTH
28
SCHOOL TRAVEL
Travel by public transport was significantly higher among:
• Children from rural areas (20%) than from urban areas (5%)
• Low SES (10%) and middle SES backgrounds (11%), compared with children from high SES backgrounds (5%).
Travel to school by car was used by around half (54%) of children in primary schools across NSW. Travel to school by car was lower among children from rural areas (42%) than urban areas (57%). Travel to school by car was also higher for children from Middle Eastern cultural backgrounds and in the obese BMI category, compared with their counterparts.
Travel to school by mixed modes was used by approximately 1 in 4 children (23%). Prevalence was higher among children from rural areas (30%) compared with children from urban areas (21%). Using mixed transport modes to school was less prevalent in children from Middle Eastern (8%) and Asian (13%) cultural backgrounds, compared with children from English-speaking backgrounds (25%).
Between 2010 and 2015 there was an 8% increase overall in children travelling to school by car, from 46% to 54%, especially among children from:
Urban areas (from 47% to 57%)
Low SES backgrounds (from 47% to 62%)
Middle Eastern cultural backgrounds (from 50% to 77%)
Asian cultural backgrounds (from 47% to 61%)
The healthy weight category (from 45% to 53%)
The obese BMI category (from 46% to 62%)
Chapter 10: Primary school/travel to school
PRIMARY SCHOOL
Travel to schoolIn 2015, the prevalence of primary school children’s travel modes to school were:
• 54% for car (median trip time 12 minutes)
• 23% for mixed transport (median trip time 17 minutes)
• 15% for active transport (median trip time 10 minutes)
• 8% for public transport (median trip time 26 minutes).
Active travel was significantly lower among:
• Children from rural areas (9%) compared with children from urban areas (16%)
• Children in the overweight (12%) and obese (11%) weight categories, compared with their healthy weight peers (15%).

NSW SCHOOL PHYSICAL ACTIVITY AND NUTRITION SURVEY (SPANS) 2015 | SUMMARY REPORT
29
SCHOOL TRAVEL
Travel by public transport was significantly:
• Higher among adolescents from middle SES backgrounds (45%) compared with high SES backgrounds (38%)
• Lower among adolescents of Middle Eastern cultural backgrounds (17%) compared with adolescents from English-speaking backgrounds (39%).
Between 2010 and 2015 travel to school by public transport significantly decreased among girls from Middle Eastern cultural backgrounds from 34% to 8%.
Travel to school by car was significantly higher for adolescents from Middle Eastern cultural backgrounds (48%) than their English-speaking background (22%) peers.
Between 2010 and 2015 the prevalence of being driven to school by car significantly increased among adolescent boys from Middle Eastern cultural backgrounds (14% to 43%).
One quarter (24%) of adolescents travel to school by mixed modes of transport.
One in 4 adolescents (24%) travel to school by car. There was an increase between 2010 and 2015 in children being driven to school by car, and among some groups of adolescents.
Chapter 10: Secondary school/travel to school
SECONDARY SCHOOL
In 2015, active travel was the least prevalent form of transport to and from school by children and adolescents. This is cause for concern because active travel contributes towards daily physical activity which is routine-based and regular. The health benefits of active travel to school are well documented. Brisk walking is a form of moderate to vigorous physical activity.
Travel to schoolIn 2015, the prevalence of adolescents’ travel modes to school were:
• 38% for public transport (median trip time 37 minutes)
• 24% for mixed transport (median trip time 33 minutes)
• 24% for car (median trip time 15 minutes)
• 14% for active transport (median trip time 15 minutes).
All of the median trip times for adolescents were longer than for children.
Active travel was significantly higher among:
• Adolescents from rural areas (20%) compared with urban areas (12%)
• Adolescent boys from low SES backgrounds (21%) compared with high SES backgrounds (12%).
Studies suggest that people who use public transport are more likely to
have higher physical activity, be less sedentary and have lower rates of obesity, compared with people who
use private transport modes.

30NSW HEALTH
30
SEDENTARY BEHAVIOUR
Sedentary behaviour is the term applied to a range of activities undertaken while sitting or lying down, and which expend very little energy. Sedentary behaviours during childhood are important because there is evidence that sedentary behaviours are associated with poor health outcomes, and track across the life course.
Screen time is the primary contributor to the total time spent in sedentary behaviours among young people, but children and adolescents also engage in many other sedentary activities that serve many important social and cognitive developmental needs, including homework, sitting around with friends, chatting, doing hobbies and reading.
PRIMARY SCHOOL
SittingDuring weekdays (outside of school hours), children spent 3 hours and 5 minutes sitting. Overall, during weekend days, children spent 6 hours and 4 minutes sitting.
SNAPSHOT: CHILDREN AND ADOLESCENTS AGE 5-16 YEARSOverall, the median sitting time outside of school hours was 3 hours 43 minutes on a weekday, and 6 hours 40 minutes on a weekend day.
Just over half of children (53%) met screen time recommendations of less than 2 hours a day, on weekdays. On weekends 80% of children exceeded 2 hours of screen time.
Groups who were less likely than their peers to meet screen time recommendations, on both weekdays and weekends, included:
Boys
Children and adolescents from low SES backgrounds
Children in the overweight and obese BMI categories.
More than half (54%) of participants did not know the recommended daily limit on screen time was less than 2 hours.
20% of parents rarely or never imposed rules on screen time.
Any decrease in prolonged sitting time is associated with lower health risks. Watching television for more than 2
hours a day is associated with reduced physical and psychosocial health.

NSW SCHOOL PHYSICAL ACTIVITY AND NUTRITION SURVEY (SPANS) 2015 | SUMMARY REPORT
31
SEDENTARY BEHAVIOUR
Across both weekdays and weekend days, total daily sitting time was higher among children from:
• Low SES backgrounds compared with middle and high SES backgrounds
• Middle Eastern cultural backgrounds compared with other cultural backgrounds
• The overweight and obese BMI categories compared with those in the healthy weight category.
Between 2010 and 2015 the highest increases in weekend day sitting time were among low SES children, with an increase of 44 minutes, and obese BMI children, with an increase of 46 minutes.
Chapter 11: Primary school/sitting time
Domain Median time spent on weekdays (outside school hours)
Median time spent on weekend days
Cultural activities 30 mins 59 minutes
Educational activities 19 mins 0
Screen time (including smartphone and tablet use) 1 hour 27 mins 3 hours 15 mins
Screen time (excluding smartphone and tablet use) 1 hour 2 hours 28 mins
Passive travel 10 mins 18 mins
Table 1: Domains of primary school sedentary behaviour and median time spent by weekday and weekend day
Screen timeOn weekdays, 62% of children met the national ‘no more than two hours a day’ recommendation for limiting screen time2. This did not significantly change from 2010.
On weekend days, overall in 2015 only 1 in 5 (21%) children met the recommended daily limits for screen time, and the prevalence was significantly lower among boys (17%), compared with girls (26%).
Chapter 11: Primary school/screen time
Screen time refers to leisure time spent watching television, DVDs, videos, using computers for fun, playing computer or video games, and from 2015, playing on
smartphones or tablet devices.
2 Screen time refers to leisure time spent watching television, DVDs, videos, using computers for fun, playing computer or video games, and from 2015, playing on smartphones or tablet devices.

NSW HEALTH
SEDENTARY BEHAVIOUR
32
Awareness of screen time guidelines13% of participants knew the daily screen time recommendations.
Chapter 11: Primary school/screen time guidelines
Parental rules on children’s screen timeThere are good reasons to reduce screen time by adolescents. Excessive screen time is associated with poorer health outcomes including decreased fitness and lower self-esteem and anti-social behaviour. Family plays a pivotal role in shaping adolescents’ use of screen time.
Screen time is the most modifiable of all sedentary behaviours and strategies such as imposing rules on screen time hold promise to reduce children’s screen use, and to increase their health and healthy lifestyle behaviours across the life course.
1 in 10 (10%) parents rarely or never impose rules on screen time for children. This was significantly higher for parents of children from:
• Middle SES backgrounds (11%), compared with high SES backgrounds (8%)
• The obese BMI category (15%), compared with healthy weight BMI category (9%).
For information on primary school children’s screen time, including television in the bedroom, see the full report Chapter 11: Primary school/television in the bedroom
SECONDARY SCHOOL
SittingDuring weekdays (outside of school hours), the median time adolescents spent sitting was 5 hours and 32 minutes. Overall, the median time adolescents spent sitting during weekend days was 8 hours and 8 minutes.
Across both weekdays and weekends, total daily sitting time was higher among adolescents from urban environments.
Chapter 11: Secondary/sitting time
On both weekdays and weekend days, children from low SES backgrounds, Middle Eastern cultural backgrounds and in the overweight and obese BMI categories, were less likely to meet screen time recommendations.
Adolescent girls spent more time in cultural, educational and social activities, and passive travel, than adolescent boys. Boys had higher screen time than girls.
Screen timeAround 2 out of 3 of adolescents (64%) did not meet the ‘no more than 2 hours a day’ screen time recommendation on weekdays in 2015, and this increased to 83% on weekend days.
Chapter 11: Secondary school/screen time
Awareness of screen time guidelinesAround 1 in 10 adolescents (11%) knew the daily screen time recommendations.
Chapter 11: Secondary/awareness of screen time guidelines
NSW SCHOOL PHYSICAL ACTIVITY AND NUTRITION SURVEY (SPANS) 2015 | SUMMARY REPORT
SEDENTARY BEHAVIOUR
33
Parental rules on adolescent’s screen timeOverall more than one third (39%) of adolescents rarely or never had parental screen time rules. This was significantly higher among adolescents from:
• Middle SES backgrounds (43%) compared with high SES backgrounds (37%)
• Girls from English-speaking backgrounds (39%) compared with girls from Middle Eastern cultural backgrounds (21%)
• Boys in the obese BMI category (59%) compared with the healthy weight BMI category (38%).
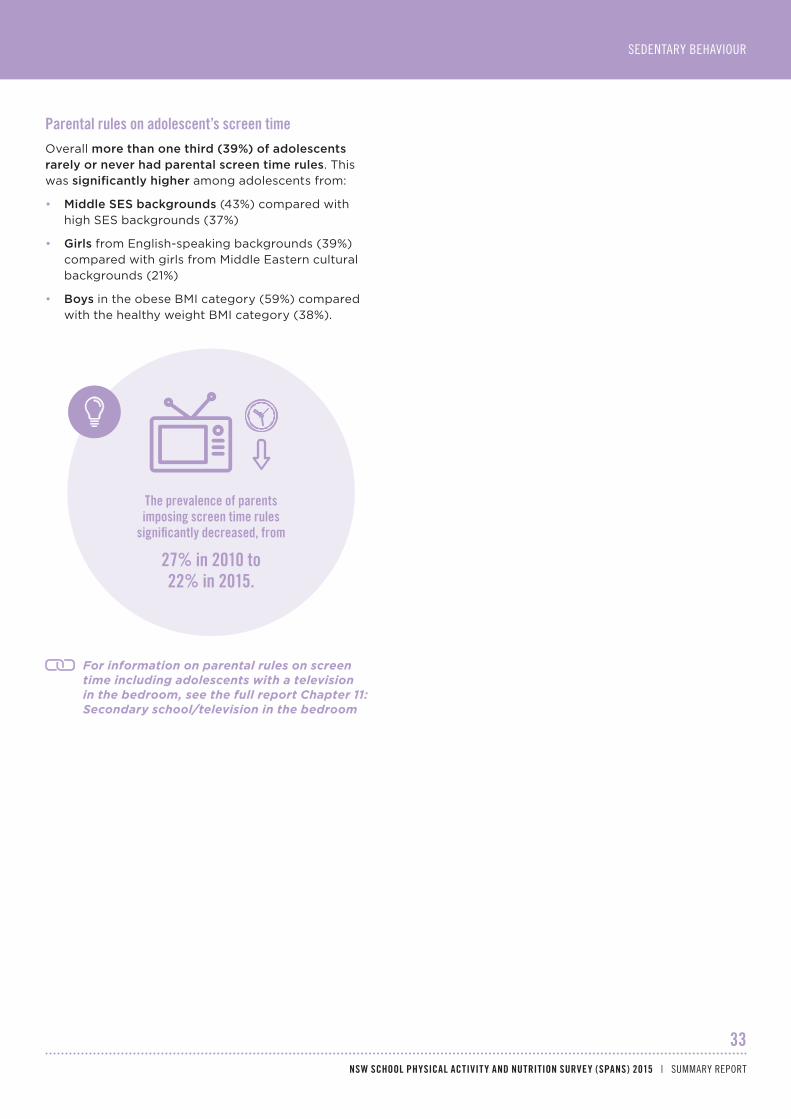
The prevalence of parents imposing screen time rules
significantly decreased, from
27% in 2010 to22% in 2015.
For information on parental rules on screen time including adolescents with a television in the bedroom, see the full report Chapter 11: Secondary school/television in the bedroom

NSW HEALTH
34
SCHOOLS’ NUTRITION AND PHYSICAL ACTIVITY ENVIRONMENTS
School Principals were asked to complete an online questionnaire on their school’s physical and nutrition environment, school policies and school practices. In total, 84 schools participated in the main study, and an additional 15 pilot schools completed the school environment questionnaire. This represents approximately 3% of primary schools and 6% of secondary schools in NSW.
PRIMARY SCHOOL
SNAPSHOT: PRIMARY AND SECONDARY SCHOOL PRINCIPALS85% of primary school Principals and 80% of secondary school Principals considered their school area had adequate green space for active play.
The main barrier across school levels to promoting physical activity was competing demands on curriculum time.
Approaches to encouraging physical activity include encouraging use of facilities and equipment during school (84% of primary school responses) and using merit or achievement awards (61% at primary school and 56% at secondary school).
In NSW primary schools, sport and physical education (PE) programs were delivered primarily by generalist teachers rather than specialist PE teachers.
Around 85% of...
Primary school Principals reported their school had playground markings and usable outdoor courts that were used by students most days of the week
School Principals reported their school had adequate green space for active play
School Principals reported that children were encouraged to use equipment and facilities during breaks.
Facilities for physical activity, sport and PE in primary schoolsAll participating primary schools reported having a playground.
Chapter 13: Primary school/facilities for physical activity, sport and PE in primary schools
Delivery of sport and PE in primary schools 89% of schools reported delivering PE and sports lessons to students in all year groups each week, with the median number of lessons being two. The median time schools allocated to PE and sport per week was:
• 86-99 minutes for years K-2
• 105 minutes for Years 3-6.
23-30% of urban schools did not provide sport to students in Years K-2.
Chapter 13: Primary school/delivery of sport and PE in primary schools
Perceived barriers to enhancing skill development, fitness and physical activity in primary schoolsDemands on curriculum time (52%) and expertise of teachers (27%) were the most common barriers to promoting physical activity reported by Principals. 1 in 5 schools indicated that a lack of hot or wet weather facilities was a strong barrier.
Chapter 13: Primary school/perceived barriers to enhancing skill development, fitness and physical activity in primary schools
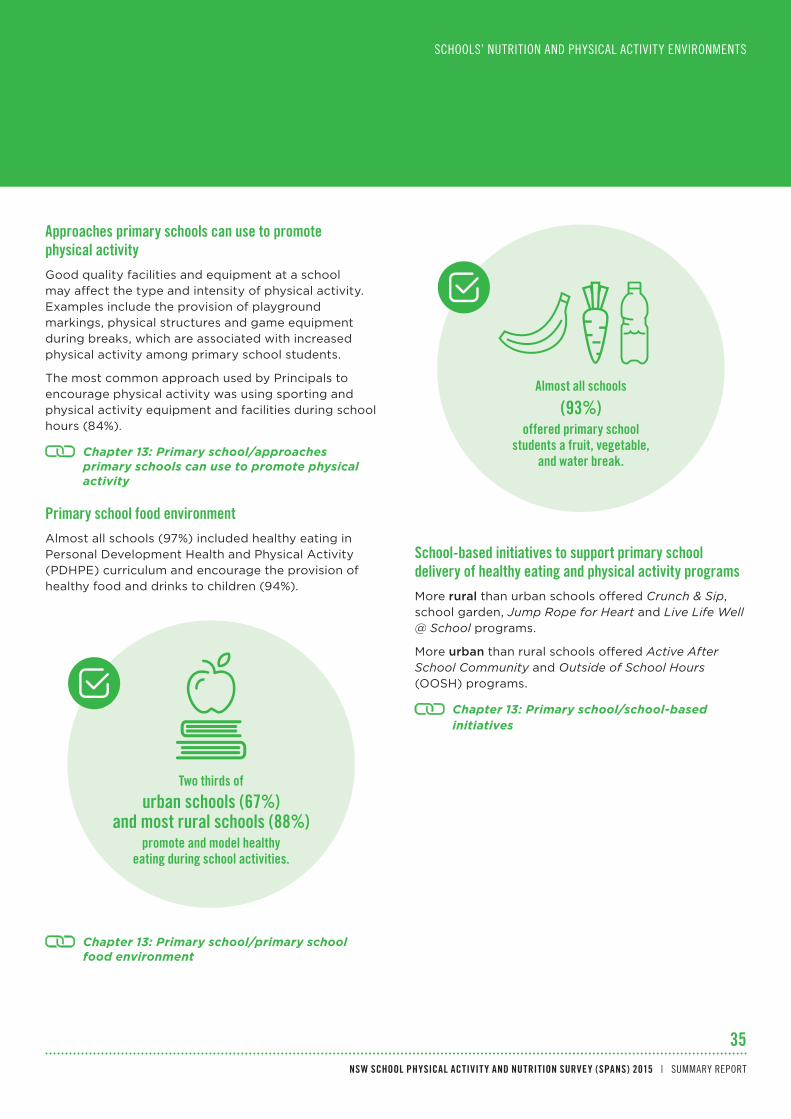
NSW SCHOOL PHYSICAL ACTIVITY AND NUTRITION SURVEY (SPANS) 2015 | SUMMARY REPORT
35
SCHOOLS’ NUTRITION AND PHYSICAL ACTIVITY ENVIRONMENTS
Approaches primary schools can use to promote physical activityGood quality facilities and equipment at a school may affect the type and intensity of physical activity. Examples include the provision of playground markings, physical structures and game equipment during breaks, which are associated with increased physical activity among primary school students.
The most common approach used by Principals to encourage physical activity was using sporting and physical activity equipment and facilities during school hours (84%).
Chapter 13: Primary school/approaches primary schools can use to promote physical activity
Primary school food environmentAlmost all schools (97%) included healthy eating in Personal Development Health and Physical Activity (PDHPE) curriculum and encourage the provision of healthy food and drinks to children (94%).
Chapter 13: Primary school/primary school food environment
Two thirds of
urban schools (67%) and most rural schools (88%)
promote and model healthy eating during school activities.
School-based initiatives to support primary school delivery of healthy eating and physical activity programsMore rural than urban schools offered Crunch & Sip, school garden, Jump Rope for Heart and Live Life Well @ School programs.
More urban than rural schools offered Active After School Community and Outside of School Hours (OOSH) programs.
Chapter 13: Primary school/school-based initiatives
Almost all schools
(93%)offered primary school
students a fruit, vegetable, and water break.
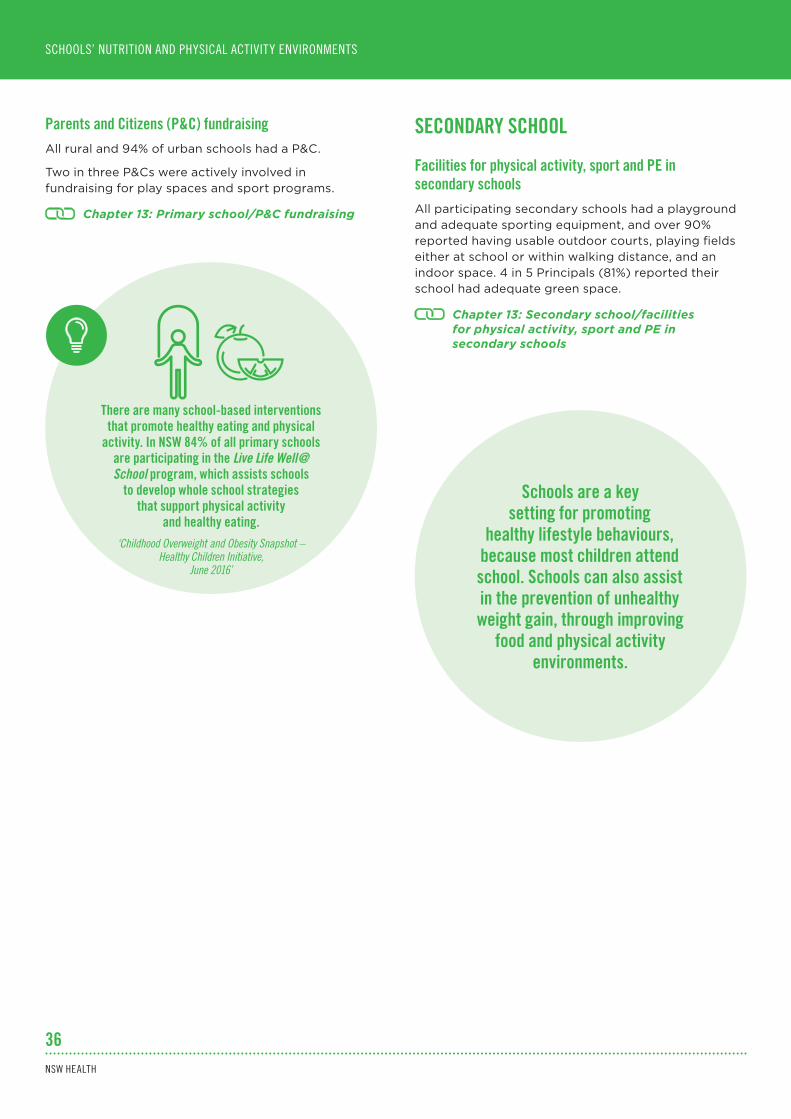
NSW HEALTH
SCHOOLS’ NUTRITION AND PHYSICAL ACTIVITY ENVIRONMENTS
36
Parents and Citizens (P&C) fundraisingAll rural and 94% of urban schools had a P&C.
Two in three P&Cs were actively involved in fundraising for play spaces and sport programs.
Chapter 13: Primary school/P&C fundraising
Schools are a key setting for promoting
healthy lifestyle behaviours, because most children attend school. Schools can also assist in the prevention of unhealthy weight gain, through improving
food and physical activity environments.
SECONDARY SCHOOL
Facilities for physical activity, sport and PE in secondary schoolsAll participating secondary schools had a playground and adequate sporting equipment, and over 90% reported having usable outdoor courts, playing fields either at school or within walking distance, and an indoor space. 4 in 5 Principals (81%) reported their school had adequate green space.
Chapter 13: Secondary school/facilities for physical activity, sport and PE in secondary schools
There are many school-based interventions that promote healthy eating and physical
activity. In NSW 84% of all primary schools are participating in the Live Life Well@School program, which assists schools
to develop whole school strategies that support physical activity
and healthy eating.‘Childhood Overweight and Obesity Snapshot –
Healthy Children Initiative, June 2016’

NSW SCHOOL PHYSICAL ACTIVITY AND NUTRITION SURVEY (SPANS) 2015 | SUMMARY REPORT
SCHOOLS’ NUTRITION AND PHYSICAL ACTIVITY ENVIRONMENTS
37
Delivery of sport and PE in secondary schoolsAll schools delivered PE lessons, with the median of 3 lessons per week in urban schools and 2 lessons per week in rural schools.
Approximately 9% of Principals reported that their school did not provide sport lessons.
Overall the median time allocated to PE and sport lessons each week was 192 minutes for Years 7-9 and 191 minutes for Year 10.
Chapter 13: Secondary school/delivery of sport and PE in secondary schools
Perceived barriers to enhancing skill development, fitness and physical activity in secondary schoolsThe most common barriers to promoting physical activity reported by Principals included:
• Competing demands on curriculum time (81%)
• Level of school/home/community interaction (77%)
• Lack of student interest (76%)
• Lack of wet/hot weather facilities (72%)
• Motivation of staff to promote physical activity (57%).
Chapter 13: Secondary school/perceived barriers
Approaches secondary schools can use to promote physical activityAlmost all schools (96%) included physical activity in the PDHPE curriculum but only around 1 in 3 (33%) included the promotion of physical activity to students in their School Plan.
The most common approaches Principals reported to promoting students’ physical activity included:
• Encouragement or merit awards (>90%)
• Encouraging students to be more active outside school hours (37%)
• Encouraging students to use physical activity equipment and facilities during school (33%).
Chapter 13: Secondary school/approaches secondary schools can use to promote physical activity
Secondary school food environmentAlmost all schools included healthy eating in the PDHPE curriculum (98%) and encourage the provision of healthy food and drinks to adolescents (64%).
2 in 5 secondary schools promote and model healthy eating during school activities but less than a third (29%) had healthy fundraising options.
Almost all schools had a canteen and around two-thirds of Principals reported implementing a healthy canteen strategy.
Chapter 13: Secondary school/school food environment
Parents and Citizens’ (P&C) fundraising90% of schools had a P&C. Less than one-third of P&Cs were actively involved in fundraising for sports programs (29%) or had a strong influence over the school’s physical activity and nutrition policies (31%).
Chapter 13: Secondary school/P&C fundraising
98%of schoolsincluded healthy eating in thePDHPE curriculum and 64%
encourage the provision of healthy food and drinks to adolescents.
NSW HEALTH
38
APPENDIX 1 - METHODS
The Schools Physical Activity and Nutrition Survey (SPANS) is a repeat, cross-sectional, representative, population monitoring survey of NSW school children and adolescents age 5 to 16 years. SPANS has been conducted in 1997, 2004, 2010, and 2015.
2004 and 2010 summary reports
The primary purpose of SPANS is to report on the change in the rates of overweight, obesity and weight-related behaviours in children and adolescents across NSW, to allow policy-makers to develop and target programs and services to increase health in the population.
SPANS methodology including sampling frame, sample size calculations, staff, and indicator measurement protocols, have remained consistent across survey years to allow comparability and generation of trend information.
The prevalence estimates are based on robust (valid and reliable) indicators for population surveillance of children’s and adolescents’ weight and weight-related behaviours.
Over time, indicators of lifestyle behaviours have been added to the survey. In 2015, new indicators included information on sleep time, energy drinks, dental health and muscular fitness.
Key research questionsThe key research questions in relation to children and adolescents age 5 to 16 years are:
• What are the prevalence, population distribution and changes (2010 to 2015) in overweight and obesity, physical activity participation and sedentariness?
• What are the prevalence, population distribution and changes (2010 to 2015) in key weight-related dietary habits and eating behaviours?
• What are the prevalence, population distribution and changes (2010 to 2015) in sufficient physical activity, fitness (cardiorespiratory and muscular), fundamental movement skills and sedentary behaviours?
• What are the prevalence and population distribution of good dental hygiene and sleep hygiene?
Sampling frameThe sampling frame consisted of primary and secondary schools selected randomly from the government, Catholic and independent school sectors, across socio-economic quintiles and in urban and rural areas, to provide representativeness. The Australian Council for Educational Research (ACER) provides the sampling frame.
Sample size calculationsSample size calculations were based on two primary outcomes: (i) achieving reliable estimates of point prevalence; and (ii) the detection of differences between demographically-defined groups (sub-groups including socio-economic tertiles, cultural backgrounds, rural and urban areas and weight categories).
NSW SCHOOL PHYSICAL ACTIVITY AND NUTRITION SURVEY (SPANS) 2015 | SUMMARY REPORT
39
Selection of schools and childrenA two-stage, stratified, cluster design was used to select schools and classes. In order to be comparable with previous SPANS, the target populations were children in Kindergarten, years 2, 4 and 6, and adolescents in years 8 and 10. Non-mainstream schools, schools with a population less than 180, and schools in remote locations across NSW were excluded. The number of schools selected in each sector (government, Catholic and Independent) was proportional to the number of students enrolled in that sector of schools in NSW. Within each sector, the schools were ordered by location, school, gender, socio-economic status and school size to ensure the sample was representative. Separate samples were drawn for primary and secondary schools. 42 primary and 42 secondary schools were invited. Two replacement schools were identified for each selected school from within the same sector, and similar in terms of size and socio-economic status.
In each school that agreed to participate in SPANS, two classes per year group were randomly selected, and information sheets, consent forms and questionnaires were distributed prior to the school visit by field officers. Children in years K and 2 could only participate in the survey with consent forms signed by their parents. Children in years 4, 6, 8 and 10 who themselves consented could participate in the survey.
Parents reported on behalf of their children in Years K, 2 and 4, and children in Year 6 self-reported. This may reflect some of the notable differences in reports between these groups.
Data analysisPost-stratification weights were calculated to correct for variations in school and student response rates across sectors and locations, and for the variable size of the class selected from each sampled school. The purpose of calculating the weights was to permit inferences from children included in the sample to the populations from which they were drawn, and to have tabulations reflect estimates of population totals.
Comparisons were conducted across the following demographic characteristics:
(i) Across year groups for boys and girls separately
(ii) Across locality (urban versus rural) for boys and girls separately
(iii) Across tertiles of SES for boys and girls separately
(iv) Across cultural background strata for boys and girls separately
(v) Across Body Mass Index categories for boys and girls separately.
Chapter 2
NSW HEALTH
40
APPENDIX 2 - RESPONSE RATES AND REPRESENTATIVENESS
RESPONSE RATES84 schools participated (42 primary and 42 secondary). The school response rate was 44%.
A total of 7,557 children and adolescents participated in SPANS 2015 (51.5% girls, 48.5% boys). The participant response rate was 62%.
REPRESENTATIVENESS OF THE SAMPLESPANS 2015 was designed so that the children and adolescents who participated would be representative of the NSW population age 5 to 16 years, in terms of type of school, rurality and socio-economic status.
SPANS student participation rates are comparable to, or higher
than, other national and international school-based surveys of children.
The demographic characteristics of the SPANS sample were very similar to the NSW population overall, indicating the
findings of SPANS 2015 are likely to be generalisable to school children
of the same ages in NSW.

NSW SCHOOL PHYSICAL ACTIVITY AND NUTRITION SURVEY (SPANS) 2015 | SUMMARY REPORT
41
School Year
Measurement K 2 4 6 8 10
Demograpics
Anthropometry
Fundamental movement skills
Standing broad jump(muscular fitness)
Cardiorespiratory endurance(cardiorespiratory fitness)
Student questionnaire*
Parent (proxy) questionnaire*
MEASURESSPANS 2015 administered the measures outlined in the Table below, by year group.
* Includes indicators of physical activity, sedentary behaviours, school travel, dietary patterns and habits, sleep patterns and dental health.

NSW HEALTH
42
ABBREVIATIONS
ABBREVIATION MEANING
BMI Body mass index
FMS Fundamental movement skills
K Kindergarten
METS Metabolic equivalents
Mins Minutes
MVPA Moderate-to-vigorous intensity physical activity
OOSH Out of school hours
P&C Parents and Citizens Association
PDHPE Personal Development, Health and Physical Education
PE Physical education
SES Socio-economic status
SPANS Schools Physical Activity and Nutrition Survey


