4 Nutrition and Social Safety Net 4.1 FOOD AND NUTRITION INTRODUCTION 4.1.1 At the beginning of the Eleventh Plan period there are serious concerns around food and nutritional security. Agriculture has performed well below expec- tations during the two recent Plans. Cereal produc- tion has declined in per capita terms. The number of the poor has barely declined by 20 million people over three decades, 1973–2005, from 320 million to 300 million; and most of this decline has occurred during the most recent decade (1993/94–2004/05). Low and stagnating incomes among the poor has meant that low purchasing power remains a serious constraint to household food and nutritional security, even if food production picks up as a result of interventions in agriculture and creation of rural infrastructure (discussed in Volume III). 4.1.2 Outcomes in terms of protein-energy malnutri- tion (PEM) speak for themselves: in 1998–99, accord- ing to National Family Health Survey-2 (NFHS-2), as much as 36% of the adult population of India had a body mass index (BMI) below 18.5 (the cut-off for adult malnutrition); eight years later (2005–06) that share had barely fallen to 33% of the population, de- spite a decade of robust economic growth. Similarly, share of the under-weight children under-3 in the total child population under-3 had not fallen at all (47% in 1998–99 and 46% in 2004–05/06). There is a need to look at food security issues not in isolation as being confined to cereal production and consumption, but to examine how nutritional outcomes can be improved for the vast majority of the poor. 4.1.3 Ensuring food and nutritional security, however, cannot be enough. There are far too many vulnerabili- ties in the lives of the poor and those just above the poverty line. Around 93% of our labour force works in the informal sector, without any form of social pro- tection, especially against old age. With growing migration of younger rural residents to urban and fast-growing rural areas, elderly parents are often left behind in the village to cope on their own, or are dependent upon women who also have to tend to the family farm, as agriculture feminizes with growing male migration. Old-age pension is thus becoming a crying need for those dependent on insecure employment in the informal economy as well as for parents left behind. Moreover, vulnerability in respect of health arises from the under-funding of the public health system and its inability to provide comprehensive care, which is a major concern for the majority of the population. MALNUTRITION: A CONCEPTUAL AND EMPIRICAL ANALYSIS Some Conceptual Issues 4.1.4 Malnutrition reflects an imbalance of both macro and micro-nutrients that may be due to inappropriate intake and/or inefficient biological utilization due to the internal/external environment. Poor feeding practices
Transcript
4Nutrition and Social Safety Net
4.1 FOOD AND NUTRITION
INTRODUCTION4.1.1 At the beginning of the Eleventh Plan periodthere are serious concerns around food and nutritionalsecurity. Agriculture has performed well below expec-tations during the two recent Plans. Cereal produc-tion has declined in per capita terms. The number ofthe poor has barely declined by 20 million people overthree decades, 1973–2005, from 320 million to 300million; and most of this decline has occurred duringthe most recent decade (1993/94–2004/05). Low andstagnating incomes among the poor has meant thatlow purchasing power remains a serious constraintto household food and nutritional security, even iffood production picks up as a result of interventionsin agriculture and creation of rural infrastructure(discussed in Volume III).
4.1.2 Outcomes in terms of protein-energy malnutri-tion (PEM) speak for themselves: in 1998–99, accord-ing to National Family Health Survey-2 (NFHS-2), asmuch as 36% of the adult population of India had abody mass index (BMI) below 18.5 (the cut-off foradult malnutrition); eight years later (2005–06) thatshare had barely fallen to 33% of the population, de-spite a decade of robust economic growth. Similarly,share of the under-weight children under-3 in thetotal child population under-3 had not fallen at all(47% in 1998–99 and 46% in 2004–05/06). There is aneed to look at food security issues not in isolation as
being confined to cereal production and consumption,but to examine how nutritional outcomes can beimproved for the vast majority of the poor.
4.1.3 Ensuring food and nutritional security, however,cannot be enough. There are far too many vulnerabili-ties in the lives of the poor and those just above thepoverty line. Around 93% of our labour force worksin the informal sector, without any form of social pro-tection, especially against old age. With growingmigration of younger rural residents to urban andfast-growing rural areas, elderly parents are often leftbehind in the village to cope on their own, or aredependent upon women who also have to tend to thefamily farm, as agriculture feminizes with growing malemigration. Old-age pension is thus becoming a cryingneed for those dependent on insecure employment inthe informal economy as well as for parents left behind.Moreover, vulnerability in respect of health arises fromthe under-funding of the public health system and itsinability to provide comprehensive care, which is amajor concern for the majority of the population.
MALNUTRITION: A CONCEPTUAL ANDEMPIRICAL ANALYSIS
Some Conceptual Issues4.1.4 Malnutrition reflects an imbalance of both macroand micro-nutrients that may be due to inappropriateintake and/or inefficient biological utilization due to theinternal/external environment. Poor feeding practices
Nutrition and Social Safety Net 129
in infancy and early childhood, resulting in malnutri-tion, contribute to impaired cognitive and socialdevelopment, poor school performance, and reducedproductivity in later life. Malnutrition therefore is amajor threat to social and economic development as itis among the most serious obstacles to attaining andmaintaining health of this important age group.
4.1.5 When poor nutrition starts in utero, it extendsthroughout the life cycle, particularly in girls and wo-men. This not only amplifies the risks to the individual’shealth but also increases the likelihood of damage tofuture generations, through further foetal retardation.Low birth weight increases the risk of infant and childmortality and those who survive are usually undernour-ished, fall ill frequently, and fail to develop optimally,both physically and mentally. Further, undernourishedadults are functionally impaired and unable to sustainproductive physical activity throughout the day. Nutri-tion-related disabilities, such as memory disturbances,osteoporosis, etc., are found among elderly.
4.1.6 When nutritional needs are not met, recoveryfrom an illness also takes longer. Malnutrition is alsolinked to the growing HIV/AIDS pandemic. Malnu-trition makes adults more susceptible to the virus.Inadequate infant feeding aggravates its transmissionfrom mother to child; and evidence suggests thatmalnutrition makes ARV drugs less effective. In addi-tion, good nutrition can help to extend the periodwhen the person with HIV/AIDS is well and working.There are also new dimensions to the malnutritionproblem. The epidemic of obesity and diet-relatedNCDs is spreading in India slowly but steadily.India is beginning to suffer from a double burdenof undernutrition and obesity. This phenomenon,called ‘nutrition transition’, means that the nationalhealth systems now have to cope with the high costof treating diet-related NCDs and at the same time,fight under nutrition and the traditional communi-cable diseases.
4.1.7 Therefore the challenges that still remainsinclude:
• High levels of adult malnutrition affecting a thirdof the country’s adults,
• Inappropriate infant feeding and caring practices,• High levels of undernutrition, particularly in
women and children,• Micronutrient undernutrition,• Emerging diet-related diseases,• Inadequate access to health care.
Empirical Evidence4.1.8 The absolute weights and heights of Indians onaverage have not shown significant improvement overthe last 25 years. A staggering percentage of babies inIndia are born with LBW, a problem that began inutero. A mean deficit of 1.4 to 1.6 kg in weight at oneyear worsens to a deficit of about 9 kg at 10 years and13–18 kg when adults. A similar trend is seen in thecase of heights (where a deficit of 1cm at 1 year reaches12–13 cm when adult). It is therefore, not surprisingthat about half of children are under weight (moder-ate to severe under nutrition) or are stunted. Thereare no differences in the nutritional status between girlsand boys; however, the mean heights and weights ofchildren from SC/ST and other marginalized sectionsare below the national mean values. In addition, about30% of all adults have BMI<18.5 (33% of women and28% of men), which defines adult malnutrition.
4.1.9 Some of the reasons for this grim picture inIndia are as follows: With a 500–600 kcal deficit inenergy intake (almost 40% of their requirement) andmultiple nutrient deficiencies such as fat, calcium, iron,riboflavin, vitamin C (all 50% deficit), and vitamin A(70% deficit), it is not surprising that there is massiveinadequacy/hunger leading to malnutrition in childrenand adolescents. Studies from 10 States show that lessthan 30% of children have protein-calorie adequacy(Table 4.1.1).
4.1.10 On further scrutiny of the diet surveys, itis obvious that over 70 to 80% of the calories consumedby the children (even though inadequate) are derivedfrom cereals and pulses. This results in two things:
(i) Children cannot consume more cereals to makeup for the calorie deficiency because of its sheermonotony and lack of energy density.
(ii) In the absence of fats, milk, eggs, and sources ofiron, children starve themselves. The resultant
130 Eleventh Five Year Plan
iron deficiency anaemia (IDA), further worsenstheir appetite.
4.1.11 Therefore in the absence of foods other thancereals and pulses in the diets of children and theinability of children in the age groups of (1–18 years)
to derive and satisfy their protein-calorie and othernutrient needs from cereals, the malnutrition scenariocan only get worse. Even fats that provide energydensity in the diets are not available in adequate quan-tities (normally fats should provide 30–40% of calorieneeds). It is therefore not surprising that there is mas-sive hunger leading to multiple nutrient deficiencies.This is not hidden hunger; it is hunger for nutrient-rich foods.
TRENDS IN ALL-INDIA PATTERN OF CONSUMPTIONFOOD EXPENDITURE SINCE 1972–734.1.12 Per capita cereal consumption of the Indianpopulation has been declining in both rural andurban areas over the past two or three decades.Table 4.1.2 gives per capita quantity of cereal con-sumption per month in 15 major States as estimatedfrom the 50th (1993–94), 55th (1999–2000), and61st (2004–05) rounds of NSS, (Ministry of Statisticsand Programme Implementation, GoI). It showsthat the decline is spread over all the major States
TABLE 4.1.1Distribution of Children by
Protein-calorie Adequacy Status(%)
Age (yrs) %
1–3 31.84–6 28.27–9 28.1
Boys Girls10–12 26.0 32.913–15 34.7 43.116–17 50.2 64.0Adult Sedentary Men—68.8 Women—81.8Pregnant Women 64.3Lactation Women 62.2
Source: National Nutrition Monitoring Bureau (NNMB) Reports2002.
TABLE 4.1.2Changes in Average per capita Cereal Consumption in 15 States in
Physical Terms over the Last Decade in Major States
Year RURALMonthly per capita cereal consumption (kg.) in
Note: *includes Jharkhand; # includes Chhattisgarh; ^ includes Uttaranchal
Source: NSS 50th, 55th, and 61st Rounds.
Nutrition and Social Safety Net 131
and affects both rural and urban sectors to a similarextent.
4.1.13 In both rural and urban India, the share of foodin total expenditure continued to fall throughout thethree decades prior to 2004–05. The overall fall wasfrom 73% to 55% in rural areas and from 64.5% to42% in urban areas (Table 4.1.3). In urban India, notonly the shares of cereals and pulses have fallen, butthere has been a fall in the shares of other food groupsas well, such as milk and milk products, edible oil, andsugar. In rural India, however, the shares of milk andmilk products, egg, fish and meat, and fruits and nutshave increased by about 1 percentage point each, theshare of vegetables has increased by 2.5 percentagepoints, and that of beverages, refreshments, and
that in Africa on average. In fact, South Asian coun-tries have the world’s worst rate of malnutrition, andIndia’s rate of malnutrition is among the worst in SouthAsia (together with Nepal and Bangladesh). Even thebest State in India, Kerala, has a rate of child malnu-trition comparable to that for Africa’s average rate.
4.1.15 Even more worrying is the fact that the rate ofmalnutrition, defined as underweight children relativeto an internationally accepted reference population,has not declined significantly over the last decade anda half. In 1992–93 (NFHS-1) it was 54%; in 1998–99(NFHS-2), it was 46%, and in 2005–06 (NFHS-3) itwas 46%—hardly any change over a period in whichthe economy has been growing at over 6% p.a. onaverage. Naturally, given the increase in population,
TABLE 4.1.3Composition of Food Consumption, All-India, Rural, and Urban, 1972–73 to 2004–05
Sector Year % share of major food groups in total expenditure
All food Cereals Pulses Milk and Edible Egg, Vege- Fruits Sugar Beve-milk oil fish and tables and rages,
TABLE 4.1.4Trends in Childhood (0–3 Years of Age)—
Malnutrition in India
Nutritional 1992–93 1998–99 2005–06
Parameter NFHS-1 NFHS-2 NFHS-3
Stunted 52.0 45.5 38.4
Wasted 17.5 15.5 19.1
Underweight 53.4 47.0 45.9
Note: Figures of NFHS-1 above are for 0–4 years. However,NFHS-1 later generated data for below 3 years children with 51.5%children being underweight.
Source: NFHS surveys, IIPS, MoHFW, GoI.
processed food has increased by 2 percentage pointssince 1972–73; only the shares of sugar and pulses (thelatter, largely during the last decade) have declinednoticeably, apart from cereals. In any case, the increasein the share of non-cereals is not enough to compen-sate for the decline in cereal consumption.
THE PROBLEM WITH CHILD MALNUTRITION4.1.14 Sixty years after independence, nearly half ofIndia’s children under three are malnourished (seeTable 4.1.4). India has the largest number of childrenin the world who are malnourished. Even more sig-nificantly, India’s rate of malnutrition is worse than
132 Eleventh Five Year Plan
the number of malnourished is likely to have actuallyincreased.
4.1.16 Bihar, Jharkhand, MP, Chhatisgarh, and UPare the States with malnutrition rates well above thenational average of 46% (Annexure 4.1.1). Some ofthese States have actually seen an increase in theshare of malnourished children in the 0–3 year-oldchild population between 1998–99 (NFHS-2) and2005–06 (NFHS-3). A concerted effort is planned,therefore, in the Eleventh Plan to reduce the childmalnutrition rate in each State to the extent identifiedin Annexure 4.1.2.
4.1.17 NFHS-3 shows that anaemia among childrenand women is on the rise. As much as 74.2% of thechildren of 6–35 months were anaemic (NFHS-2) thathas increased to 79.2% (NFHS-3). Similarly, the per-centage of married women in the age group 15–49 whowere anaemic has increased from 51.8% in 1998–99to 56.2% in 2005–06 and that of pregnant women of15–49 years has increased from 49.7% in 1998–99 to57.9% in 2005–06 (see later section on Micronutrientdeficiencies).
A Summary of the Situation Analysis4.1.18 In other words, what emerges is that first, percapita availability of cereals has declined, and second,the share of non-cereals in food consumption has notgrown to compensate for the decline in cereal avail-ability. Even if the latter has grown there may well be aproblem for significant sections of the population whomay be feeling the distress caused by falling per capitacereal availability, and who also do not have the pur-chasing power to diversify their food consumptionaway from cereals.
4.1.19 In any case, the significant point is that overallper capita intake of calories and protein has declinedconsistently over a 20-year period from 1983 to 2004–05, according to NSS data (see Table 4.1.5). Ruralcalorie consumption per day has fallen from 2221 to2047, an 8% decline. Similarly, the urban calorie con-sumption fell by 3.3%, from 2080 to 2020. The ruralprotein consumption fell by 8% over the same periodand urban consumption remained the same over the20-year period. Since this data is for households, it does
not capture the impact of intra-household fooddistribution. It is well known that women and girls inpoor households receive poorer quality food and lessfood in a normal, patriarchal household.
TABLE 4.1.5Per Capita Intake of Calorie and Protein
Source: NSS Report No. 513, Nutritional Intake in India,2004–05.
4.1.20 So taken together we have a set of overlappingproblems in the country. First, the calorie consump-tion on average in rural areas has fallen way belowthe calorie-norm for the rural poverty line (2400calories). It was lower than that norm 20 years agoand it has actually fallen since then on average.Similarly, the poverty line threshold for urban areasfor calorie consumption is 2100 and urban consump-tion too was lower on average than the norm twodecades ago and has also fallen. It is obvious thatthe non-poor consume more calories on averagethan the poor. Hence, to allow for distributionalinequity that prevails in any society, calorie availabil-ity on average in the country as a whole should beat least 20% higher than the per capita requirement(i.e. 2100 calories for urban and 2400 calories forrural areas). Even 20 years ago, Indian consumptionof calories on average was way below the requirements.So inevitably the poor, let alone the extremely poor,were and still are consuming calories that are waybelow the norm. And the intra-household allocation,not just among the poor but also among those whoare marginally above the poverty line, is likely to behighly skewed against women and girls. When onecombines this fact with the well-known fact (estab-lished in repeated NFHS since the early 1990s) thatwomen and girls are less likely to access health ser-vices when they fall sick, it is hardly surprisingthat the sex ratio in the population is as low as it is,and falling.
Nutrition and Social Safety Net 133
4.1.21 The state of PEM has shown little no or signsof improvement over several decades. It is in thiscontext that the Minimum Support Price (MSP)and the Public Distribution System (PDS) becomesignificant.
MINIMUM SUPPORT PRICE, FOOD PROCUREMENTPOLICY, AND THE PUBLIC DISTRIBUTION SYSTEM4.1.22 Food security is the outcome of both produc-tion and distribution decisions. Agricultural produc-tion issues are discussed in the ‘Agriculture’ chapterof the Eleventh Plan (Volume III). In fact, the GoIhas in 2007 taken the decision to introduce a FoodSecurity Mission, which will focus on increasingproduction of cereals and pulses. This chapter focuseson the distribution, affordability, and availabilityissues in respect of calories. This section discusseswhat changes need to happen in the PDS in order toboth improve food security as well as reduce fiscalsubsidies.
Minimum Support Price (MSP)4.1.23 Foodgrains are procured at the MSP fixedby the government mostly in a small number ofgrain-surplus States in the north of India, whichare then transported across the country to deficitStates (the latter mostly in the south and west ofthe country). MSPs are fixed on rates recommendedby Commission for Agricultural Costs and Prices(CACP), which are set using mainly cost of cultiva-tion. These grain stocks essentially supply the PDSof the country. Through the PDS, cereals are madeavailable to BPL households, as well as to AbovePoverty Line (APL) households—at differentialprices. There is a third category of beneficiaries—Antyodaya card holders. Under the Antyodaya AnnaYojana (AAY), 35 kg of foodgrains are being providedto the poorest of the poor families at the highly subsi-dized rate of Rs 2 per kg for wheat and Rs 3 per kgfor rice.
4.1.24 During the years of accumulation of stocksin the Central Pool until 2001–02, it was believedthat excess procurement was on account of thegovernment’s decision to fix the MSP for paddy andwheat in excess of the levels prescribed by the CACP.Grain stocks have declined since then.
Stabilization4.1.25 Given the limited purchasing power of the poor,there is a need to contain cereal price rises. For thispurpose government maintains foodgrains bufferstocks through the Food Corporation of India (FCI).Stocks had reached to 256.17 lakh tonnes (rice) and324.15 lakh tonnes (wheat) for the year 2001–02. Butin 2007, the stocks of these two foodgrains fell to 131.71lakh tonnes (rice) and 45.63 lakh tonnes (wheat),respectively.
4.1.26 To achieve the cereal price stabilization objec-tive of PDS, food stocks with FCI should be at areasonable level. In recent years, both procurementand stocks with FCI have tended to fall. If the needs ofprocurement to maintain adequate stocks requires pro-curement prices to be higher than MSP, a transparentmechanism is needed that enables government toundertake commercial purchases at prices comparableto those paid by private traders. This could be doneif the procurement price (i.e. MSP plus bonus) wasannounced at the beginning of the purchase season,along with a procurement target in terms of quantity.After the procurement target was met, the bonus wouldbe suspended. However, if procurement quantities,even with bonus are not met, FCI should be able totender from both domestic as well as internationalmarkets, after standard procurement operations, tomake up the deficit to maintain stocks with the FCI.
Decentralized Procurement4.1.27 Unlike the mid-1990s, cereal procurement wasearlier concentrated in a few northern States. However,under the decentralized procurement scheme intro-duced in 1997–98, the State Governments themselvesundertake direct purchase of paddy and wheat andprocurement of levy rice on behalf of the GoI. Purchasecentres are opened by the State Governments andtheir agencies as per their requirements. The StateGovernments procure, store, and distribute foodgrainsunder Targeted Public Distribution System (TDPS)and other welfare schemes. In the event of the totalquantity of wheat and rice thus procured fallingshort of the total allocation made by the CentralGovernment, FCI meets the deficit out of the CentralPool stocks. Under this scheme, State-specific economiccost is determined by the GoI and the difference
134 Eleventh Five Year Plan
between the economic cost so fixed and the centralissue prices (CIP) is passed on to the State as foodsubsidy.
4.1.28 The Decentralized Procurement Scheme, whichis presently in operation in 11 States, has been verysuccessful in increasing procurement of rice inmany non-traditional States, as can be seen below inTable 4.1.6.
4.1.29 There is a need for States to increase procure-ment to reduce their requirement of foodgrains fromthe Central Pool. There is also a need for more Stateswith large production, such as Bihar for wheat and riceand Assam for rice, to adopt the Decentralized Procure-ment scheme. If this were to happen, there could be aconsiderable saving in terms of transportation costs.
with higher MSPs declared more recently, there is adanger that the subsidy is likely to rise (see Table 4.1.7)due to increase in MSP, announcement of bonus, andcarrying cost of FCI. The Table 4.1.7 gives the figuresof food subsidy of the GoI.
Public Distribution System4.1.32 The PDS is a major State intervention in thecountry aimed at ensuring food security to all thepeople, especially the poor. The PDS operates througha large distribution network of around 4.89 lakhfair price shops (FPS), and is supplemental in nature.Under the PDS, the Central Government is respon-sible for the procurement and transportation offoodgrains up to the principal distribution centresof the FCI while the State Governments are respon-sible for the identification of families living below the
TABLE 4.1.6Procurement of Rice in DCP States during Kharif Marketing Season
(Figures in lakh tonnes)
S. No. State 2002–03 2003–04 2004–05 2005–06 2006–07*
Food Subsidy4.1.30 Food subsidy is provided in the Budget of theDepartment of Food and Public Distribution to meetthe difference between the economic cost of foodgrainsprocured by FCI and their sales realization at CIP forTPDS and other welfare schemes. In addition, theCentral Government also procures foodgrains formeeting the requirements of buffer stock. Hence, partof the food subsidy also goes towards meeting thecarrying cost of buffer stock.
4.1.31 The food subsidy bill of the GoI peaked in2004–05 and declined as stocks declined. However,
poverty line, the issue of ration cards, and the distri-bution of foodgrains to the vulnerable sectionsthrough FPSs. PDS seems to have failed in serving thesecond objective of making foodgrains available to thepoor. If it had, the consumption levels of cereals shouldnot have fallen on average—as it has consistently overthe last two decades.
4.1.33 With a view to improving its efficiency, thePDS was redesigned as TDPS with effect fromJune 1997. The TPDS envisages identifying the poorhouseholds and giving them a fixed entitlement offoodgrains at subsidized prices. Under the TPDS,higher rates of subsidies are being given to the poorand the poorest among the poor. The APL familiesare also being given foodgrains under TPDS butwith lower subsidy. The scale of issue under TDPSfor Antyodaya cardholders began with 10 kg perfamily per month, which has been progressivelyincreased to 35 kg per family per month with effectfrom April 2002.
4.1.34 Under the TPDS, the identification of BPLfamilies was to be carried out by the State Governmentsbased on criteria adopted by the Ministry of RuralDevelopment (MoRD). However, the total number of
beneficiaries was to be limited to the State-wise pov-erty estimates (1993–94) of the Planning Commissionprojected to the population as on 1.03.2000. Against atotal ceiling of 6.52 crore BPL households (as per thepoverty estimates of the Planning Commission for1993–94 and population projection of the RegistrarGeneral as on 01.03.2000), more than 8 crore BPLration cards have been issued. Similarly against thefigure of 18.03 crore households in the country (asper the population projections as on 1.03.2000 of theRegistrar General of India), the total number ofration cards issued is around 22.32 crore. This doesraise problems at the field level.
Major Deficiencies of TPDS4.1.35 As identified by various studies, the major de-ficiencies of the TPDS include: (i) high exclusion andinclusion errors, (ii) non-viability of FPSs, (iii) failurein fulfilling the price stabilization objective, and(iv) leakages.
(I) HIGH EXCLUSION AND INCLUSION ERRORS4.1.36 The Programme Evaluation Organization’s(PEO’s) Study (2005) establishes large-scale exclusionand inclusion errors in most States (see Box 4.1.1).It also questions the BPL methodology used for
Box 4.1.1Performance Evaluation of TPDS
• Only 22.7% FPSs are viable in terms of earning a return of 12% on capital.• The offtake by APL cardholders was negligible except in Himachal Pradesh, Tamil Nadu, and West Bengal.• The offtake per BPL card was high in WB, Kerala, Himachal Pradesh, and Tamil Nadu.• The offtake by the poor under TPDS was substantially higher than under universal PDS.• There are large errors of exclusion and inclusion and ghost cards are common.• High exclusion errors mean a low coverage of BPL households. The survey estimated that TPDS covers only 57% BPL
families.• Errors of inclusion are high in Andhra Pradesh, Karnataka, and Tamil Nadu. This implies that the APL households receive
an unacceptably large proportion of subsidized grains.• Leakages vary enormously between States. In Bihar and Punjab, the total leakage exceeds 75% while in Haryana and UP,
it is between 50 and 75%.• Leakage and diversion imply a low share of the genuine BPL households of the distribution of the subsidized grains.
During 2003–04, it is estimated that out of 14.1 million tonnes of BPL quota from the Central Pool, only 6.1 milliontonnes reached the BPL families and 8 million tonnes did not reach the target families.
• Leakage and diversion raised the cost of delivery. For every 1 kg that was delivered to the poor, GoI had to issue 2.32 kgfrom the Central Pool.
• During 2003–04, out of an estimated subsidy of Rs 7258 crore under TPDS, Rs 4123 crore did not reach BPL families.Moreover, Rs 2579 crore did not reach any consumer but was shared by agencies involved in the supply chain.
136 Eleventh Five Year Plan
identification of households at State level. There aretwo problems here. One is the criterion used for allo-cation of foodgrains by the Central Government toStates. The Central Government allocates foodgrainsto States based on a narrow official poverty line. Thereis a need to look at this allocation criterion to States. Ifwe go by the official poverty ratio criterion, only 28%of the population is eligible under PDS at all-India levelin 2004–05. However, food-insecure households maybe much higher than the official poverty ratios. Forexample, undernutrition among children and house-holds is much higher than this figure. The use of BPLestimates to determine Central allocations should berevisited because there is a significant mass of house-holds just above the poverty line.
4.1.37 A second problem is the use of BPL methodfor identifying households by the States. This identifi-cation differs from State to State. For example, someof the south Indian States do not follow the officialpoverty ratio for limiting the ration cards. In AndhraPradesh, more than 70% of the households haveration cards. This is one of the reasons for highinclusion errors in Andhra Pradesh.
(II) VIABILITY OF FPSs4.1.38 An important institutional concern is that ofthe economic viability of FPSs, which appears tohave been badly affected by the exclusion of APL popu-lation from the PDS (which happened after PDSbecame TPDS in 1997). The virtual exclusion of theAPL population has led to a big decline in offtake. Withfewer ration cards to serve, lower turnover, and upperbounds on the margins that can be charged to BPLconsumers, the net profits of FPS owners and dealersare lower under the TPDS than before. Since there areeconomies of scale here, for instance, with respect totransport, the distribution of smaller quantities islikely to make many shops unviable. When FPSs areeconomically viable, there are fewer incentives to cheat.
4.1.39 Some of the steps suggested by the High-levelCommittee (HLC) on Long Term Grain Policy torevive the retail network were the following:
‘Relax restriction on eligibility to be a licensed FPS;make NGOs and village-level retailers eligible to
undertake licensed PDS distribution, and in particu-lar, encourage women; remove restrictions on therange of commodities that can be sold in a FPS; andallow registered associations of FPS dealers to purchasethe grain allocated directly from the FCI’.
(III) REGIONAL ALLOCATION AND PRICESTABILIZATION OBJECTIVE4.1.40 One of the objectives of the PDS has alwaysbeen to ensure price stabilization in the country bytransferring grain from cereals-surplus to cereals-deficit regions. Targeted PDS has reduced the effec-tiveness of this objective. This is because under TPDS,the demand for cereals is no longer determined byState Governments (based on their requirements andin practical terms on past utilization) but on alloca-tions decided by the Central Government (based onpoverty estimates prepared by the Planning Commis-sion). The new system of allocation, as pointed out bythe HLC, has led to imbalances between actual alloca-tions and ‘allocations necessary to meet the differencebetween cereals production and requirement’.
(IV) LEAKAGES AND DIVERSION4.1.41 Undoubtedly, in many parts of India, the cur-rent system of delivery has weaknesses resulting in leak-ages at different stages. As the Programme EvaluationOrganization, PEO Study (2005) points out, ‘the shareof leakages in offtake from the Central Pool is abnor-mally high, except in the States of West Bengal andTamil Nadu’. Further, ‘in terms of leakages throughghost BPL cards, there are fewer problems in AndhraPradesh, Haryana, Kerala, Punjab, Rajasthan and TamilNadu than in other States’. At the FPS level, leakageswere found to be high in Bihar, Punjab, and Haryana.
4.1.42 The study goes on to identify the factors asso-ciated with relatively low leakages at the FPS level andconcludes that ‘general awareness of the beneficiaries,high literacy and strong grass root-level organizations(particularly PRIs) have helped States like WestBengal and Himachal Pradesh in minimising FPSlevel leakage, while in the case of Tamil Nadu, it isthe elimination of private retail outlets’. It has beendocumented that strong political commitment andcareful monitoring by the bureaucracy are the keyelements of the success of PDS in Tamil Nadu.
Nutrition and Social Safety Net 137
4.1.43 Leakages cannot be lowered by finer targetingusing official poverty criterion. They require politicalcommitment and participation of the people in thedelivery process. The nexus between officials, the mafia,and ration shop dealers must be broken in order toreduce leakages. Monitoring and accountability ofTPDS (food security watch) should be improved in asignificant way. The TPDS needs to be strengthenedby means of the effective use of IT including intro-duction of a unique ID-based smart card system.
Coverage of Commodities Suppliedthrough TPDS4.1.44 If nutrition security is one of the considerationsof TPDS, the government may explore the possibilityof including more commodities under TPDS. For ex-ample, cereals such as jowar, bajra, and also pulsescould be introduced in TPDS because of nutritionalconsiderations. The consumption of pulses is lowfor the poor. Operational details of supplying thesecommodities, particularly, pulses have to be workedout. It is true that presently the country has a shortageof these commodities. However, the introduction ofthese commodities may encourage production ofthese crops especially in dry land areas. The NationalFood Security Mission has identified pulses as anarea of focus.
Steps Taken to Strengthen the TPDS andPlan Schemes4.1.45 The GoI has taken following measures tostrengthen TPDS and check diversion of foodgrainsmeant for TPDS:
CITIZEN’S CHARTER• A Citizens’ Charter has been issued in November
1997 for adoption by the State Governments toprovide services in a transparent and accountablemanner under PDS. Instructions have been issuedfor involvement of PRIs in identifications of BPLfamilies and in Vigilance Committee.
PDS (CONTROL) ORDER, 2001• The Order, inter alia, covers a range of areas relat-
ing to correct identification of BPL families, issueof ration cards, proper distribution, and monitor-ing of PDS-related operations. Contraventions
of the provisions of the Order are punishableunder the Essential Commodities Act, 1955.Clearly, these do not seem to have had muchimpact, since the NSSO estimates of 2006 suggestthat the extent of leakage and diversion of grain hasonly increased.
4.1.46 In addition, a number of Plan Schemes havebeen introduced.
(I) CONSTRUCTION OF GODOWNS4.1.47 The Scheme was conceived during the Fifth FiveYear Plan to build and increase the storage capacityavailable with FCI for storage of foodgrains.
(II) INTEGRATED INFORMATION SYSTEM FORFOODGRAINS MANAGEMENT (IISFM)4.1.48 The main objective of the IISFM project in theFCI, initiated in 2003–04, is to put in place an onlineMIS that would give the stock position in any depot atany given point of time.
(III) STRENGTHENING OF PDS
Food Credit Cards/Computerization ofPDS Operations4.1.49 A new scheme ‘Computerization of PDSOperations’ with a token provision of Rs 5 crore wasintroduced in 2006–07. The computerization of PDSoperations would be an improvement on the existingsystem of ration cards, that is, the present manualsystem of making entries, etc. The new system will havepersonal details of all members of the family includ-ing their entitlement and the entire network of PDSfrom taluk to State level will be linked. With thiskind of system in place, the objectives of Food CreditCard Scheme of checking diversion of foodgrainsand eliminating the problem of bogus ration cards areexpected to be met.
Curbing Leakages/Diversion of FoodgrainsMeant for TPDS4.1.50 This is a new scheme introduced during theEleventh Five Year Plan to strengthen the PDS. Thescheme aims at taking effective measures to curbdiversion and leakages through Global PositioningSystem, Radio Frequency Identification Device, etc.
138 Eleventh Five Year Plan
Generating Awareness amongst TPDS Beneficiariesabout their Entitlement and Redressal Mechanismand Monitoring4.1.51 A mass awareness campaign on the rightsand entitlements of TPDS beneficiaries is proposedthrough newspaper advertisements, bill boards, post-ers, printing of annual calendar on the themes ofTPDS, and audio-visual publicity measures such asshort spots/quickies, audio jingles/radio spots, TVserials/documentaries.
Training and Awareness of NegotiableWarehouse Receipt System4.1.52 This is a new scheme for the Eleventh Five YearPlan. The warehousing receipts at present do notenjoy the fiduciary trust of depositors and banks, asthere is fear of not being able to recover the loans inevents such as fraud or mismanagement on behalf ofthe warehouse or insolvency of depositor. The legalremedies are also time consuming and inadequate.In this context, it is proposed to develop a negotiablewarehouse receipt system for commodities includingagricultural commodities. The negotiable warehousereceipt system will result in increase in the liquidity inthe rural areas, encouragement of scientific warehous-ing of goods, lower cost of financing, etc.
(IV) VILLAGE GRAIN BANK SCHEME4.1.53 The Village Grain Bank Scheme, which washitherto with the Ministry of Tribal Affairs, has beentransferred to the Department of Food and PublicDistribution w.e.f. The objective of the scheme is toestablish Grain Banks in chronically food-scarce areaand to provide safeguard against starvation during thelean period. The scheme is also to mitigate drought-induced migration and food shortages by makingfoodgrains available within the village during suchcalamities. During 2006–07, there was a budget provi-sion of Rs 50 crore for setting up 8591 Village GrainBanks in food-scarce areas.
Further Innovations Needed to StrengthenTPDS and the Way Forward4.1.54 One of the long-standing criticisms of theTPDS has been that offtake of PDS cereals (rice andwheat) by States from FCI does not match with NSSestimates of PDS consumption of those same grains
(as we noted earlier). For instance, Table 4.1.8 showsthat, according to NSS, over 1993–94, 1999–2000, and2004–05, consumption of PDS grains rose. It alsoshows that offtake of PDS grain from FCI by Statesincreased much more than consumption over the samedecade. The difference between the two shows theextent of leakage of PDS wheat and rice. This leakage[defined as 1—{ratio of (a) to (b)}] was 28% for wheatand rice together in 1993–94, but it had risen to 54%by 2004–05—a very significant increase in leakage.These facts clearly show that TPDS is in urgent needof reform.
TABLE 4.1.8PDS Implied Leakage—Offtake vs Consumption
Ratio of (a) to (b)Rice 0.81 0.82 0.60Wheat 0.59 0.52 0.27
Total 0.72 0.72 0.46
Source: NSS.
4.1.55 These facts are further underlined by Annex-ure 4.1.4, which demonstrates the massive leakage ofthe fiscal subsidy to the non-poor on the one handand the ineffective targeting of the poor by thecardholder-based TPDS system.
4.1.56 Annexure 4.1.5 drives home the point aboutthe poor targeting by TPDS benefits. It estimates thebenefits in rupees per household of PDS grain benefi-ciaries [calculated as PDS quantity consumed* (PDSPrice—Average Market Price)]. It shows that the ben-efits to the household are dependent upon whetheryou have a card or not (and which card you have—APL, BPL, or Antyodaya), and not on whether youare poor or non-poor. In fact, it demonstrates thatthere is very little difference between the benefits (inRs/household) of poor and non-poor households
Nutrition and Social Safety Net 139
when one compares poor BPL cardholders with non-poor BPL cardholders, or when comparing poor AAYcardholders with non-poor AAY cardholders.
4.1.57 The TPDS in its current form as a anti-povertyprogramme clearly is not doing very well. Given thesefacts, a restructuring of the TPDS has been suggested.
4.1.58 In this context, a recommendation of the HLCon Long Term Grain Policy (2000) was that instead ofthe current distinction between APL, BPL, andAntyodaya in terms of issue pricing for rice and wheat,there should be a single issue price for grain issued bythe FCI from its warehouses. This recommendation,sometimes identified with the return to universal PDSfrom TPDS adopted in 1997, has been criticized on anumber of grounds. First, that if the same price forBPL and APL households was charged, this would notbe financially viable for the BPL. If existing AAYand BPL cardholders were charged a higher price,there would be a diversion of benefits from therelatively poor to the relatively rich. Second, theremight be pressure to keep the uniform CIP low as highcommon price for BPL and APL would have adverseconsequences for the poor. On the other hand, a lowCIP would increase even further the fiscal subsidy.Third, any widening in the effective reach of PDS dueto its universalization would put unbearable pressuresfor the supply of grain into the PDS.
4.1.59 It needs, however, to be noted that the HLChad not altogether ruled out the continuation TPDSin States where this might be the best option. Itsrecommendation was that there should be a single CIPas far as FCI is concerned for each grain fixed at FCI’sacquisition cost and that the existing subsidy beyondthis should be passed on to the States on the conditionthat this be used for food based schemes.
4.1.60 The key issue here is whether or not the exist-ing subsidies that the HLC recommended shouldbe given to the States as cash or best targeted to theintended beneficiaries by means of the existing differ-ential pricing system with lowest prices for Antyodaya,slightly higher price for BPL, and higher still for APLcardholders. The view of the HLC was that althoughthis differential pricing system may work well for some
States, it was not necessarily the case in most othersand that removing the price differentials in PDS wouldenable FCI to concentrate on its proper role of pricestabilization rather than get involved, as it has, withthe complexities of an anti-poverty programme. Also,the HLC had pointed out that differential pricing ofthe same grain is an invitation to corruption and, there-fore, to leakages and other deadweight losses—asalready shown by the PEO study cited above as well asmore recent evidence emerging from the NSSO. TheHLC had suggested that large savings were possible ifthe subsidy on FCI account could be used to expandother food-based schemes like ICDS, Mid Day Meals,and food entitlement in employment programmes.However, as already mentioned, the HLC left thischoice to the States allowing them to continue withthe existing TPDS if they so wish to do, by having theirown differential prices rather than differential price atthe FCI stage.
4.1.61 As we have noted in the tables above, data avail-able from the 61st Round of NSS supports some ofthe concerns expressed by the HLC. NSS 61st Roundalso enables an assessment of how effectively PDS andother food based schemes such as MDM, ICDS,and Food for Work are able to reach the poor. Thisshows that: (i) only about 36% of the poor have eitherBPL or Antyodaya cards, and also that about 40% ofsuch cards are with the non-poor (Annexure 4.1.4);(ii) possession of appropriate cards (e.g. BPL orAntyodaya) rather than actual poverty status is thedeterminant of the benefits derived from targetedTPDS (Annexure 4.1.5); (iii) in more self-selectingschemes such as MDM, ICDS, and Food for Work, thetotal number of beneficiaries is similar to the numbercurrently benefiting from a BPL or AAY status andindeed these self-targeted schemes are somewhatbetter reaching the poor than the assignment of BPLcards (Annexure 4.1.6). Although not conclusive, thisobservation taken together suggests that the leakagesof physical grain could be reduced without greater fiscalcost and with somewhat better targeting towards the poorby redirecting subsidies currently in the PDS to betterfunding of the other schemes (i.e. the MDM, the ICDS).However, it was noted by the HLC that the incidentof leakages and the effectiveness of PDS targetingvaries considerably from State to State, suggesting that
140 Eleventh Five Year Plan
a one-size-fits-all approach to food and nutrition man-agement is highly mistaken.
Other Measures Needed to Reform TPDS
INTRODUCTION OF FOOD STAMPS4.1.62 If markets are integrated, food stamps systemmay be introduced, which is supposed to be moreeffective than the present system. On food stamps/coupons, the HLC has observed as follows: ‘In the longrun, as markets get better in tegrated, the PDS func-tion need not remain restricted to designated FPS anda food coupon system valid even outside PDS outletsmay become possible. Food coupons may allow widerchoice of consumers in terms of commodities andoutlets. In the Committee’s view, this is a course whichshould be followed with considerable caution in viewof the experience of other countries, and the possibil-ity of counterfeiting. However, the more importantreason food stamps have not been successful elsewherehas been the erosion in the value of the coupons whereit was fixed in nominal terms. If the coupon system isto succeed the PDS suggested above, the value ofthe coupon should be indexed to food inflation. Thecoupon system should not lead to a dilution of theCentral Government commitment to food security’.Cash for food subsidies (sometimes known as foodstamps) eliminate the need for dual retail marketingmechanisms. This can resolve the endemic problemof uneconomic viability of FPS. As a way of restoringeconomic viability, the HLC on Grain Policy recom-mended that FPS should be allowed to sell othercommodities. This recommendation of the HLCneeds to be considered by the States.
MULTI-APPLICATION SMART CARDS (MASCS)4.1.63 MASCs is one of the technological break-throughs of recent times. MASCs facilitate simplifica-tion of procedures and enhancing the efficiency inadministering various schemes. The National e-Gov-ernance Policy fully recognizes the significance of thistechnological revolution. On-the-spot availability ofproof of identity, authentic transaction history, andentitlement details are required at the point of servicedelivery. It will also allow other innovations/experi-ments such as the division of the PDS food entitle-ment between the Head of household and his/her
(non-earning) spouse or transfer of entire householdentitlement to the housewife/mother. Similarly, differ-ent models can be used for kerosene supply and fertil-izer supply to farmers. In other words, the precisemodel for delivery of the subsidy or income transferto individuals/households can be decided separatelyand/or modified overtime.
WEB-ENABLED SYSTEMS4.1.64 Many departments of the Central Government,notably the MoRD, are in the process of developingweb-enabled systems that provide information aboutgovernment programmes to beneficiaries and alsodetails of the benefits received by the targeted benefi-ciaries. Easy access to such information is the mosteffective means to empower the beneficiaries and theirwell-wishers/representatives. Such web-enabledsystems can be created for the PDS.
Way Forward• NSS 61st Round enables an assessment of how
effectively PDS and other food based schemes suchas MDM, ICDS, and Food for Work are able to reachthe poor. This shows that in more self-selectingschemes such as MDM, ICDS, and Food for Work,the total number of beneficiaries is similar to thenumber currently benefiting BPL or AAY statusand indeed these self-targeted schemes are some-what better reaching the poor than the assignmentof BPL cards. Thus the leakages of physical graincould be reduced without greater fiscal cost and withsomewhat better targeting towards the poor byredirecting subsidies currently in the PDS to betterfunding of the other schemes (i.e. the MDM, theICDS).
• However, a one-size-fits-all approach to food andnutrition management is mistaken. As there arelarge differences in the efficiency of implementa-tion of the PDS among the States, it may bedesirable to introduce State-specific designs andimplementation strategies rather than continuingwith a uniform design. Separate designs and imple-mentation strategies may be thought of for areaswith high concentration of the poor.
• Since some distinction needs to remain between the‘poor’ and ‘non-poor’, the nature of exclusion/inclusion errors suggests that it is much better to
Nutrition and Social Safety Net 141
define ‘poor’ for PDS purposes as much larger thancurrent Planning Commission estimates of thenumber of poor, and exclude altogether the residual‘non-poor’. If the current allocation of 35 kg perhousehold per month continues, the present PDSofftake (rice + wheat) of about 40 million tonneswould meet PDS requirements of nearly 10 crorehouseholds, that is, roughly 60% more householdsthan those defined to be poor by current officialpoverty estimates.
• The effectiveness of the system can also be improvedby better management with the help of IT. Comput-erization of PDS operations and introduction of aunique ID-based Smart Card System would helpin addressing the issues related to bogus ration cards,diversion of foodgrains, etc. The Eleventh Planwill therefore focus on improving the deliverymechanisms and the monitoring arrangementsbased on IT.
• There is also a need to make concerted efforts forminimizing the operational costs of the FCI fromthe present high levels through better managementpractices so that major part of the food subsidyactually accrues to the beneficiaries.
• Attention should also be given to streamlining andstandardizing the State level taxes on procurementof foodgrains. Decentralized procurement will befurther encouraged and extended to other Stateswith potential for procurement. It is also necessaryto strengthen both domestic and international tradein foodgrains by means of appropriate changes intrade policies.
4.1.65 The centralized system involving FCI’s stabili-zation operations would need to be strengthened. Thiswould be helped if FCI is relieved of having to operatethe system involving differential prices (i.e. betweenBPL and APL prices). The total projected GBS for theEleventh Plan for the Department of Food and PublicDistribution is Rs 614 crore (at 2006–07 prices) andRs 694 crore (at current prices).
MALNUTRITION: ADDRESSING IT THROUGH AREVAMPED ICDS4.1.66 The ICDS, which has been in existence for overthree decades, was intended to address the problemof child and maternal malnutrition, but has clearly had
limited impact. Child malnutrition has barely declinedat all in a decade and a half, anaemia among womenand children has actually risen (see Annexure 4.1.3)and a third of all adult women were undernourishedat the end of 1990s and also in 2005–06. It has also hadlimited coverage. Therefore, the answers are increas-ing coverage to ensure rapid universalization; chang-ing the design; and planning the implementationin sufficient detail that the objectives are not vitiatedby the design of implementation. Besides, all itsoriginal six services have to be delivered fully forthe programme to be effective: (i) supplementarynutrition programme (SNP), (ii) immunization,(iii) health check-up, (iv) health and nutrition educa-tion, (v) referral services, and (vi) PSE.
4.1.67 First, the ICDS has to be universalized. Second,the current scheme does not focus on 0–3 year chil-dren. But malnutrition sets in in utero and is likelyto intensify during the 0–3 year period, if not ad-dressed. In fact, this window of opportunity neverreturns in the lifetime of the child. A child malnour-ished during 0–3 years will be marred physicallyand mentally for life. The design of the scheme hasto address this problem frontally. This has severalimplications:
• Mother’s malnutrition and its knock-on effects onchild malnutrition: Malnutrition begins in utero, asIndian mothers on average put on barely 5 kg ofweight during pregnancy. This is a fundamentalreason underlying the LBW problem. They shouldput on at least 10 kg of weight, which is the averagefor a typical African woman. Middle class Indianwomen tend to put on well over 10 kg weight dur-ing pregnancy. But this is not the only problem;LBW is also partly explained by low BMI of womenin general, prior to their becoming pregnant. Smallwomen (who are small before they become preg-nant) give birth to small babies. In 1998–99 as muchas 36% of all Indian women (48% in Orissa andChhattisgarh) had a below normal BMI; the sharehad barely dropped to 33% in 2005–06 (accordingto NFHS-3).
• Breastfeeding in the first hour: Within the first hourof birth, the infant must be breastfed. Only 23% ofIndian babies were breastfed within the first hour
142 Eleventh Five Year Plan
(in 2005–06). If Indian mothers enhance earlyinitiation of breastfeeding within one hour, we cansave 250000 babies from death annually by just thisaction; this would reduce the overwhelming shareof neonatal mortality in our IMR.
• Exclusive breastfeeding for six months is necessary toavoid unnecessary infections to the baby, developthe baby’s immunity, and ensure growth. Only46% of Indian babies are exclusively breastfed; theremaining half is exposed to unhygienic methodsof feeding (see Annexure 4.1.2).
• Solid food six months on. The baby must begin toreceive solid, mushy food at 6 months (i.e. togetherwith breastfeeds) for the baby to continue to growin the way nature intended her to grow. Only 56%of mothers introduce appropriate solid, mushy foodin a timely manner after 6 months. Not surprisingthat NFHS-2 data shows that the proportion ofunderweight children rises from 16% to more than60% between the ages of 6 months and 2 years. Thismalnutrition also affects the mental developmentof the child for life. About 90% of the developmentof the brain takes place before a child reaches theage of two years (see Annexure 4.1.2).
4.1.68 The ICDS scheme accordingly needs to berestructured in a manner that addresses some of theweaknesses that have emerged and is suitable foruniversalization. The programme must effectivelyintegrate the different elements that affect nutritionand reflect the different needs of children in differentage groups. For the purpose the programme needs tobe restructured in a Mission Mode with a MissionStructure at the central level and a similar structure atthe State level. The Ministry of Women and ChildDevelopment (MoWCD) will prepare proposals forrestructuring along the following lines so that therestructured programme can become effective on 1April 2008.
• 0–3 year old children. Without prejudicing theinterest of the 3–6 year olds, the focus of the entireICDS has to shift to a much greater extent thanbefore to the 0–3-year-olds. The AWWs in allanganwadi centres could focus on children underthree years of age, pregnant, and lactating mothers.The tasks of this AWW would include breastfeeding
counselling, nutrition and health education andcounselling to ensure solid, mushy food is intro-duced by six months to all infants, growth moni-toring, provision of SNP to children in the sixmonths to three years age group and pregnant andlactating mothers, and motivation for ANC, immu-nization, and related matters.
• 3–6 years. At present SNP is provided to children inthe age group of 3–6 years. A major factor adverselyaffecting the success of ICDS is leakages which atleast in part is due to centralized procurement ofready to eat (RTE) foods. Centralized procurementof food has the additional problem of irregular sup-ply of food in the anganwadis, and thrusting fooditems on beneficiaries irrespective of their taste andpreferences. Very often this leads to non-acceptanceor rejection of the food distributed. The fooddistributed has to be hygienically prepared andculturally acceptable. Some States, for exampleTamil Nadu and Maharashtra, are successfully serv-ing hot cooked meals.
• Accordingly, it is necessary that the existing mecha-nism of fund flow to States for implementation ofthe scheme of ICDS be reviwed and restructuredin the Eleventh Plan. In the vision for the EleventhPlan outlined in Volume I, funds should ideally bereleased directly by the Centre through States todistricts, with DPC and PRI institutions involved.The District Planning process will be strengthenedif Gram Panchayats were involved for local levelprocurement of food items and supervisionof AWWs. The Women and Child Development(WCD) prefers a fund release mechanism involv-ing State, district, and block level societies workingin Mission mode. The actual restructuring inthe Eleventh Plan would need to keep in viewboth the urgency implicit in the Mission-modeapproach and the convergence aspects that areimplied in the overall Eleventh Plan vision foreffective delivery.
• The feeding components present some choices. Oneapproach is to rely on hot cooked meals accordingto local taste and provided at the anganwadicentres. Preparation of meals will be entrusted toSelf-help Groups (SHGs) or Mothers’ Groups, asper decision of the Village Committee. An alterna-tive approach is to rely upon RTE micronutrient
Nutrition and Social Safety Net 143
fortified hygienically prepared food. The decisionbetween these two options need to be based on acareful evaluation of pros and cons and will be animportant part of the proposed restructuring. Thechoice between the two could also be left to decen-tralized decision making.
• Poor sanitation leads to high incidence of diarrhoealdisease in the early years, undermining whateverlittle poor nutrition the infant taking in; hence,the Total Sanitation Campaign (TSC) must forceits pace, particularly in urban areas where thedensity of population is high and the risk of fecalcontamination even higher than in rural areas.
• Convergence between nutrition and health inter-ventions needs to be ensured. An institutionalmechanism should be put in place to ensure betterdelivery of the services through regular periodicmeetings of the functionaries of the two program-mes at village, block, district, State, and Centrallevel. Even more importantly, joint training ofICDS and Health Department staff, includingthe Accredidated Social Health Activists (ASHAs),is necessary.
• Micronutrients do not work unless the child andmother are consuming sufficient calories throughproper quantity of fat, protein, etc. For childrenbetween 3–6 years food diversification is necessary,that is, addition of egg, milk, fruits, leafy vegetablesto their meal. There is also need for fortificationin the diet of adolescent children especially girls.This is especially needed to address iron deficiency.It would be desirable to have an area-specificapproach to the issue of micronutrients, ratherthan a thin spread across the country. There hasbeen very little research on the efficacy of differentforms of fortified foods/micronutrient supple-mentation for resolving micronutrient deficiencies.There needs to be much greater research into thestrategy of providing fortified foods to addressmicronutrient deficiencies. The Eleventh Planwill support food fortification based on scientificevidence.
• LBW. It is necessary to improve the nutritional sta-tus of adolescent girls to make a significant dent onLBW babies and infant/child maternal mortality.The fact that the Mid Day Meal programme is be-ing extended to UPS from 2007–08 will provide SNP
to all girls between the ages of 12–14, which will gosomeway towards meeting the additional calorie re-quirements of adolescent girls. However, on its own,this intervention will not suffice, and more seriousthought needs to be given on how to address theLBW problem.
• Maternity benefit. Poor women continue to workto earn a living for the family right upto the lastdays of their pregnancy, thus not being able to puton as much weight as they otherwise might. Theyalso resume working soon after childbirth, eventhough their bodies might not permit it—prevent-ing their bodies from fully recovering, and theirability to exclusively breastfeed their new born inthe first six months. Therefore, there is urgent needfor introducing a modest maternity benefit to partlycompensate for their wage loss. This could be anextension of the scheme of JSY of the MoHFW orpart of a restructured ICDS.
• PSE is the weakest link of the ICDS. There is incon-trovertible research that preschool education is criti-cal to improve primary school readiness of the childof functionally illiterate parents, and thus improv-ing dropout rates. Keeping in view the potential ofPSE in enhancing enrolment and reducing schooldropout rates, the component of PSE has to be nec-essarily strengthened (either under ICDS or in theprimary school).
If this is to be done under ICDS, AWWs will needto be provided adequate training to upgrade theirskills for imparting Pre-school Education (PSE) atanganwadis and the issues of their work-load andincentives would need to be considered. It may also beadvisable to train and involve adolescent girls to im-part PSE to supplement efforts of existing AWWs, forwhich too incentives will be required.
4.1.69 The aim should be to halve the incidence ofmalnutrition by the end of the Eleventh Plan to thelevel noted in Annexure 4.1.3 and to reduce anaemiaamong pregnant women and children to under 10%.There has to be provision made for annual or biennialsurveys throughout the country to measure the inci-dence of underweight (mild, moderate, and severe),stunting, and wasting. There should also be a regularmeasurement of the status of anaemia among women
144 Eleventh Five Year Plan
and children. This task could be assigned to theNational Institute of Nutrition, Hyderabad.
MICRONUTRIENT MALNUTRITION CONTROL:CURRENT SCENARIO4.1.70 The National Nutrition Monitoring Bureau(NNMB) Report of December 2006 reveals that theconsumption of protective foods such as pulses, greenleafy vegetables (GLV), milk, and fruits was grossly in-adequate. Consequently, the intakes of micronutrientssuch as iron, vitamin A, riboflavin, and folic acid werefar below the recommended levels in all the age groups.The data from nutritional survey of children underfive years shows that the prevalence of signs of mod-erate vitamin A deficiency (VAD) (Bitot spots onconjunctiva in eyes) and that of B-complex deficiency(angular stomatitis) was about 0.6% and 0.8% respec-tively among the preschool children. Among the schoolage children, Bitot Spots were found in 1.9%, and theprevalence of B-complex deficiency and of mottlingof teeth (dental fluorosis) was 2% each.
4.1.71 We look at some of the specific micronutrientdeficiencies in the country that are of a magnitude thatcauses public health concerns.
Anaemia4.1.72 IDA is the most widespread micronutrientdeficiency in the world affecting more than a billionpeople. It affects all age groups irrespective of gender,race, caste, creed, and religion, with higher incidenceamong vulnerable groups in developing world.Anaemia is associated with increased susceptibilityto infections, reduction in work capacity, and poorconcentration. In India, this silent emergency isrampant among women belonging to reproductiveage group, children, and low socio-economic strataof the population. IDA reduces the capacity to learnand work, resulting in lower productivity and loss ofwages, limiting economic and social development.Anaemia in pregnant women leads to adverse preg-nancy outcomes such as high maternal and neonatalmortality, LBW, increased risk of obstetrical compli-cations, increased morbidity, and serious impairmentof the physical and mental development of the child.Anaemia remains one of the major indirect causesof maternal mortality in India. In children, anaemia
causes low scholastic skills leading many of them tobe below average in classes or premature dropping outfrom schools. It also triggers increased morbidity frominfectious diseases.
4.1.73 It is also seen that children born to motherswho were illiterate or who belonged to scheduledcastes/tribes were more likely to be anaemic than theircounterparts. Further, children born to moderately andseverely anaemic mothers were also anaemic, reflect-ing the consequences of poor maternal health statuson the health of the children. Research studies havesuggested that severe IDA during the first two years oflife, when the brain is still developing, may causepermanent neurologic damage adding further senseof urgency to the current efforts to prevent IDA inchildren.
4.1.74 As per District Level Health Survey (DLHS)(2002–04), the prevalence of anaemia in adolescentgirls is very high (72.6%) in India with prevalence ofsevere anaemia among them much higher (21.1%)than that in preschool children (2.1%). In adolescentgirls, educational or economic status does not seem tomake much of a difference in terms of prevalence ofanaemia. Prevention, detection, or management ofanaemia in adolescent girls has till now not receivedmuch attention. In view of the high prevalence ofmoderate and severe anaemia in this group and thefact that many of them get married early, conceive,and face the problems associated with anaemia inpregnancy, it is imperative to screen them for anaemiaand treat them.
4.1.75 Low dietary intake and poor iron and folic acidintake are major factors responsible for high preva-lence of anaemia in India. Poor bioavailability of ironin Indian diet aggravates the situation. High levels ofinfection such as water—and food-borne infections,malaria, and hook worm infestations further aggra-vate the situation.
4.1.76 Prevalence of anaemia is very high amongyoung children (6–35 months), ever married women(15–49 years), and pregnant women (Annexure 4.1.3).Overall, 72.7% of children up to the age of three inurban areas and 81.2% in rural areas are anaemic.
Nutrition and Social Safety Net 145
Also, the overall prevalence has increased from 74.2%(1998–99) to 79.2% (2005–06). Nagaland had thelowest prevalence (44.3%), Goa was next (49.3%),followed by Mizoram (51.7%). Bihar had the highestprevalence (87.6%) followed closely by Rajasthan(85.1%), and Karnataka (82.7%). Moderate and severeanaemia is seen even among the educated familiesboth in urban and rural areas. There are inter-Statedifferences in prevalence of anaemia that are perhapsattributable partly to differences in dietary intake andpartly to access to health care.
4.1.77 While analysing the data for States with anaemialevel of 70% among children it was found that, exceptfor Punjab, all other States had more than 50% preva-lence of anaemia among pregnant women. This againreiterates the strong relationship between anaemialevels of mothers and children.
4.1.78 India was the first developing country to takeup a National Nutritional Anaemia ProphylaxisProgramme (NNAP) in 1972 to prevent anaemiaamong pregnant women and children. However,coverage under the programme needs improvementas only 22.3% of pregnant women consumed ironand folic acid for 90 days and only 50.7% had atleast three antenatal visits for their last child birth(NFHS-3, 2005–06).
4.1.79 The current strategy, included as part ofRCH Programme under NRHM, recommends thatpregnant and lactating women, 6–12 months infants,school children, 6–10 year olds, and adolescents (11–18 year old) should be targeted in the NAPP as per therecommended dosage.
Iodine Deficiency Disorders (IDD)4.1.80 IDD is a major public health problem for popu-lations throughout the world, particularly for preg-nant women and young children. They are a threatto the social and economic development of countries.The most devastating outcomes of iodine deficiencyare increased perinatal mortality and mental retarda-tion. Iodine deficiency is the greatest cause of pre-ventable brain damage in childhood, which is theprimary motivation behind the current worldwidedrive to eliminate it. The main factor responsible
for iodine deficiency is a low dietary supply ofiodine. It occurs in populations living in areaswhere the soil has low iodine content as a result of pastglaciation or the repeated leaching effects of snow,water, and heavy rainfall. Crops grown in this soil,therefore, do not provide adequate amounts of iodinewhen consumed.
4.1.81 Goitre is the most visible manifestation ofIDD. In severely endemic areas, cretinism may affectup to 5–15% of the population. While cretinism isthe most extreme manifestation, of considerablygreater significance are the more subtle degreesof mental impairment leading to poor school perfor-mance, reduced intellectual ability, and impaired workcapacity.
4.1.82 IDDs have been recognized as a public healthproblem in India since the 1920s. No State in India iscompletely free from IDDs. A third of all children inthe world that are born with IDD-related mental dam-age live in India.
4.1.83 The Indian National Goitre Control Program-me (NGCP) was started in 1962 with a focus on thegoitre belt in the country. However, the programme ofuniversal iodization was introduced only in 1984, whenall edible salt in the market was required to offer 30 ppm(parts per million) iodine at the production level. Thiswas legalized through the PFA (Prevention of FoodAdulteration) Act of 1988 that also banned the avail-ability of crystalline salt (non-iodized) as an edibleproduct. It was accepted variably by the different States,some putting only a partial ban and others none atall. Based on the recommendations of the CentralCouncil of Health, the government took a policydecision to iodise the entire edible salt in the countryby 1992. Since 1992, the National Iodine DeficiencyDisorders Control Programme (NIDDCP) is the newname given to the erstwhile NGCP. This change hasbeen effected with a view to cover the wide spectrumof iodine deficiency such as mental and physical re-tardation, deaf-mutism, and cretinism under theprogramme. Due to various research reports, theCentral Government lifted the ban on the sale of non-iodized salt in 2000. The States chose to retain orrevoke the ban depending upon their own assessment.
146 Eleventh Five Year Plan
In 2005, a country-wide universal ban on sale of non-iodized salt for human consumption has again beenpromulgated by the Central Government.
4.1.84 Studies indicate that after a certain level, theprevalence of goitre does not decrease by iodinationalone due to role of various other factors like goitro-gens in food, pollutants in water, etc. Definite identifi-cation of the active agents and knowledge of theirbiological and physicochemical properties maypermit public health officials to develop proceduresfor eliminating these compounds at the communitylevel and eradicating goitre from endemic areas.
4.1.85 Evidence also provides basis to have a freshlook about: iodine as the sole factor in causality;magnitude of the problem as a major public healthproblem universally; effectiveness of universalizationof iodized salt as a measure that leads to decreasinggoitre and other IDD by itself; and possible negativeimpacts on health like increase in hyperthyroidism andhypothyroidism, and interaction with other mineralslike iron.
Vitamin A Deficiency4.1.86 VAD has been recognized as a major control-lable public health and nutritional problem. An esti-mated 5.7% children in India suffer from eye signs ofVAD. Recent evidence suggests that even mild VADprobably increases morbidity and mortality in chil-dren, emphasizing the public health importance ofthis disorder.
4.1.87 Vitamin A is an important micronutrient formaintaining normal growth, regulating cellular pro-liferation and differentiation, controlling development,and maintaining visual and reproductive functions.VAD is one of the major deficiencies among lowerincome strata population in India. Human beings can-not produce this micronutrient in the body itself. Henceit has to be externally provided. This deficiency is seengreater in preschool children and pregnant and lactat-ing women due to higher need for this micronutrient.In severe cases it can even lead to total blindness.
4.1.88 Though the prevalence of severe forms ofVAD such as corneal ulcers/softening of cornea
(keratomalacia) has in general become rare, Bitot spotswere present in varying magnitudes in different partsof the country (NNMB 2003). The prevalence washigher than the WHO cut-off level of 0.5%, indicatingthe public health significance of the problem of VAD.There is huge inter-State variation in the prevalence ofVAD among children. It is also a matter of concern thatonly 21% children of age 12–35 months received a vi-tamin A dose in last six months. Less than 10% cover-age is reported in Nagaland (8.7%) and UP (7.3%).Only States such as Tamil Nadu (37.2%), Goa (37.3%),Tripura (38.0%), Kerala (38.2%), WB (41.2%), andMizoram (42.2%) have better coverage, though sub-stantially low.
4.1.89 In India way back in 1970 a National Pro-gramme for Prevention of Nutritional Blindness wasinitiated to fight this deficiency. The beneficiaries ofthis programme were preschool children (1–5 years).Further, the programme was modified in 1992 to coverchildren in the age group of nine months to three yearsonly. Since Tenth Five Year Plan Vitamin A Supplemen-tation exists as an integral component of RCHprogramme that is a part of NRHM.
4.1.90 During the past few years, series of expertconsultations were held among various stakeholders.In view of disaggregated age-wise prevalence ofVAD in children (NNMB reports), all these stakehold-ers recommended extending the programme tocover children up to five years. Consequently, MoHFW,GoI, issued guidelines to the States in November2006 extending the programme to cover up to fiveyears.
4.1.91 The programme focuses on:
• Promoting consumption of vitamin A rich foodsby pregnant and lactating women and by childrenunder five years of age and appropriate breast-feeding.
• Administering massive doses of vitamin A up tofive years.– First dose of 100000 IU with measles vaccina-
tion at nine months.– Subsequent doses of 200000 IU each every six
months.
Nutrition and Social Safety Net 147
4.1.92 Vitamin A supplementation and nutritioneducation is being implemented through the PHCs,Sub Centres, and the Anganwadis. The services ofICDS Programme, under the MoWCD, are utilizedfor the distribution of vitamin A to children in theICDS blocks and for educa-tion of mothers in preven-tion of VAD.
Other Micronutrient Deficiencies4.1.93 Recently, GoI examined the issue of use of zincin the management of diarrhoea for the children andrecommended to administer zinc as part of ORS inthe management of diarrhoea for children older thanthree months. It is expected that introduction of zincfor diarrhoea will go a long way in reducing IMR inthe country.
4.1.94 Apart from major macro and micronutrientsthere exist more than 300 nutrients, which are vitalfor the body. In recent years micronutrients and phytonutrients (nutrients in edible plants having anti-oxidant and anti-inflammatory) have acquired centrestage in the field of nutrition. Phyto nutrients in thefoods have biological property for disease preventionand health promotion. Truly nutritious diet is onethat promotes health and prevents diseases. There isconsiderable interaction between different micronu-trients with respect to metabolic function. Diets ofthe poor and even of some rich people may be defi-cient in a number of nutrients. Evidences basedon research suggest that consumption of balancedfood including protective foods like milk; variedkind of fruits, vegetables, etc. will meet the nutritionalneeds of the body. However, limited data is availableregarding causes of deficiencies, interactions amongvarious micronutrients when given as supple-ments, modalities of prevention and management ofdeficiencies, stability of micronutrients in fortifiedfoods, etc.
4.1.95 ISSUES OF CONCERN• Micronutrient malnutrition continues unabated in
the country leading to heavy economic loss.• Exact mapping of micronutrient deficiencies has not
been done for the country.• Existing programmes do not address the problem in
a holistic manner. Only nutrient supplementation
programmes are in existence and that too not cov-ering the entire high risk group.
• There is inadequate monitoring of micronutrientdeficiencies in the country. NFHS undertaken everysix years covers only anaemia levels in women andchildren under three years and projects only State-level picture. NNMB exists only in few States givingState-level projections for the eight States only.
• Dietary diversification and nutrition education havenot been given the required thrust.
• Food fortification has not been studied adequately.• Nutrition-oriented horticultural interventions
to promote production of fruits and vegetablesat household and community level are yet to betaken up.
• Awareness generation on consequences of micro-nutrient malnutrition, its prevention, and manage-ment is not being addressed adequately.
TOWARDS FINDING SOLUTIONS4.1.96 A five-pronged strategy will be adopted dur-ing the Eleventh Plan to accelerate the programmes toovercome micronutrient deficiency in the country.These relate to:
(i) Dietary Diversification: It means increasing therange of micronutrient-rich foods consumed. Inpractice, this requires the implementation ofprogrammes that improve the availability andconsumption of, and access to, different typesof micronutrient-rich foods (such as animalproducts, fruits, and vegetables) in adequatequantities, especially among those who are at riskfor, or vulnerable to, micronutrient malnutrition.Attention also needs to be paid to ensure thatdietary intakes of oils and fats are adequate forenhancing the absorption of the limited suppliesof micronutrients. It includes activities thatimprove production, availability, and access tomicronutrient-rich and locally produced foodsas a major focus of this type of intervention.Equally important is the use of communicationand education activities to motivate changes inbehaviour that increase consumption of benefi-cial foods, increase food production, and improvefeeding practice in infants and children. Manydietary diversification activities operate at the
148 Eleventh Five Year Plan
community level where they are more likely tobe sustainable and cause enduring behaviourchange in micronutrient consumption. Suchefforts are primarily to be taken up by the Minis-tries of Health and Family Welfare, WCD, andInformation and Broadcasting.
(ii) Nutrient Supplementation: It concerns the Min-istries of Health and Family Welfare, WCD, andDepartment of School Education and Literacyand could be achieved through biannual cam-paigns for administration of vitamin A to chil-dren between nine months to five years, providingiron and folic acid supplements to children fromsix months to two years and to adolescent girlsof 10–19 years, administering iron tablets to allpregnant and lactating women and by emphasiz-ing breastfeeding of infants up to six monthsunder the NRHM implementation plans. Whilesingle supplements for various deficiencies arebeing used world over, evidence for a shift tomultiple micronutrient supplementation isconflicting.
(iii) Horticulture Intervention: Although India is oneof the leading producers of vegetables; GLV con-stitute only 16% of the total vegetable production.Horticulture intervention will include increasingthe nutrient-rich crops to meet the requirements.Promotion of home gardening is important toincrease availability at the household level. Em-phasis should be put on perennial varieties ofGLVs that are relatively easy to grow. It includestraining farmers in agriculture technologies toimprove production and also providing them in-centives to move away from cash crops. There is aneed to develop a mechanism of coordinationbetween the various departments involved in hor-ticultural and educational activities for optimumbenefit of the community. The activities also in-clude increasing both production and productiv-ity through adoption of improved technologiesfor ensuring quality, post-harvest activities, andfood processing. Horticulture Intervention willalso involve the Ministry of Agriculture for thesupply of seeds, extension, and storage support.
(iv) Public Health Measures: These will involve theMinistries of Health and Family Welfare, WCD,Commerce, Rural Development, and Urban
Development. This would require streamliningprocedures of procurement and supply, buildinginstitutional capacity in organizations for moni-toring and mapping micronutrient deficiencies,deworming children at regular intervals, andproviding safe drinking water and sanitation.
(v) Food Fortification: The activities involve the ad-dition of one or more essential nutrients to a food,whether or not it is normally contained in it, forthe purpose of preventing or correcting a dem-onstrated deficiency of one or more nutrients inthe population or specific population groups.Examples of food fortification include addingspecific micronutrients to commercially pro-cessed staple foods, such as vitamin A in sugarand margarine, iron and B vitamins in wheatand corn flour, and iodine in salt. The activitieswould involve the Ministries and Department ofHealth, Food Processing Industries, Food andPublic Distribution, Consumer Affairs, Finance,Panchayati Raj, and State Governments. Whilefortification of foods supplied by the PDS hasbeen suggested by some, the implications of thisare not yet clear. The effects of fortification whenthere is a calorie gap are suspect. There are defi-nitely some issues regarding the proposed formsof food fortification such as providing fortifiedatta instead of grain under the PDS; as grain canbe stored for a longer period. Clearly, there needsto be much greater research into the strategy ofproviding fortified foods to address micronutri-ent deficiencies. The Eleventh Plan will supportfood fortification based on scientific evidence.
4.1.97 During the Eleventh Plan importance wouldbe given to the following strategies and measures:
• High priority to micronutrient malnutritioncontrol, specifically so to tackle anaemia, will beaccorded at Centre and State levels. The goal is toreduce anaemia among women and girls by 50%by the end of the Eleventh Plan. State-specific goalshave also been suggested (Annexure 4.1.1).
• DLHS of RCH Programme will recognize malnu-trition including micronutrient as a serious publichealth problem and monitor prevalence of micro-nutrient deficiencies on priority.
Nutrition and Social Safety Net 149
• NNMB of ICMR will be expanded to all States/UTsto assist in monitoring micronutrient deficienciesthrough existing programmes.
• Existing Iron and Folic Acid SupplementationProgrammes under RCH (NRHM) to cover infantand young children, by providing IFA in syrup form,and adolescent girls (10–19 years) by providingweekly iron supplements with immediate effect.
• Vitamin A Supplementation Programme to coverall children between nine months to five years ofage and existing low coverage to be brought to 90%by 2009.
• Promotion of breastfeeding will be taken up forprevention of VAD.
• The NIDDCP will balance between preventing theill-effects due to iodine deficiency and aggravationof other forms of hypothyroidism or hyperthyroid-ism that have been ignored until now. Multi-causality and regional diversity requires a range ofapproaches rather than a universal mono-solution.Based on this epidemiological understanding,the rational approach will be used to evolve adifferential strategy for regions above and below thethreshold levels.
• Research will be encouraged regarding causes ofmicronutrient deficiencies, understanding thecomplex web of causality, preventive strategies, andhealth behaviour regarding diet need to be carriedout for a holistic view.
• Studies will be undertaken for collection of evidenceregarding interaction amongst micronutrients,taste, smell, and shelf life of fortified foods, regionalvariations in deficiency, differing requirements ofindividuals, etc. before implementation of anymultiple micronutrient supplementation and foodfortification strategies.
• Community and household level production offruits and vegetables will be promoted.
• Public health measures like deworming of allchildren every six months will be undertakenthrough schools and ICDS.
• Environmental sanitation and hygiene will bepromoted vigorously and safe drinking water to bemade universally accessible.
• A vigorous awareness campaign in the form ofPoshan Jagriti Abhiyan will be launched utilizing allavailable channels of communication.
• A high level inter-agency coordination mechanismwill be set up to enable policy directions to theconcerned sectors.
4.2 SOCIAL SECURITY
ISSUES IN SOCIAL SECURITY FOR WORKERS4.2.1 In India, traditionally, the aspects of socialsecurity were taken care of by the set up of family/community. Rapid industrialization/urbanization thatbegan in the early twentieth century has largely ledto the collapse of the joint family set up, thus necessi-tating institutionalized intervention in the form ofState-cum-society regulated social security arrange-ments. The need has been felt for social security ar-rangements for workers and their families to enablethem to deal with transient poverty/vulnerabilitycaused by shock/adversity. Social protection could beinstrumental in motivating the workers to workbetter and to increase productivity insofar as it wouldenable them to work free from domestic worries to agreat extent. Indisputably, the best strategy to improvethe condition of unorganized labour is to improve thedemand for labour. Employment is the best form ofsocial protection.
4.2.2 Institutionalized social security was available inIndia before 1947 to only a handful of governmentemployees who had the benefit of retirement pensionor contributory provident fund together with othercomplementary support for them and their familymembers. Few of the industrial/commercial sectorestablishments had extended certain measures in thisregard on voluntary basis for their employees. Themajority of workers remained uncovered and wereleft to fend for themselves. The situation worsenedwith the weakening of family support system due tovarious social and economic factors. The need assumesgreater relevance with longer life span and the chang-ing economic environment.
4.2.3 The concept of social security is to provide asafety mechanism through series of public interven-ing against the economic and social distress that iscaused by the stoppage or substantial reduction ofearnings resulting from sickness, maternity, employ-ment injury, occupational distress, unemployment,
150 Eleventh Five Year Plan
invalidity, and old age. In the Eleventh Plan socialsecurity will be treated as an inclusive concept that alsocovers housing, safe drinking water, sanitation, health,educational, and cultural facilities for the society atlarge. It is necessary to ensure living wages, distinctfrom the concept of minimum wages, which can guar-antee the workers a decent life. A number of schemesimplemented by the government, both in the ruraland urban areas seek to provide many services thatsupplement incomes of the people, which otherwiseare fairly low.
CONSTITUTIONAL PROVISION4.2.4 Articles 39(a) and 41 of the constitution requirethat the State should within the limits of its economiccapacity, make effective provision for securing the rightto work, to education, and to public assistance in caseof unemployment, old age, sickness, and disablement.Though social security is not viewed as a fundamentalright, Article 42 requires that the State should makeprovision for securing just and humane conditionsof work and for maternity relief. Article 43 statesthat States shall endeavour to secure to all workers—agricultural, industrial, or otherwise, a living wage,such conditions of work that ensure a decent standardof life. Article 47 requires that the State should, asits primary duty, raise the level of nutrition and thestandard of living of its people and improve publichealth.
LEGISLATIVE SUPPORT4.2.5 Currently, there are contributory and non-contributory social security laws in our country.The contributory laws are those that provide forfinancing of the social security programmes bycontributions paid by workers and employers andin some cases supplemented by contribution/grantsfrom the government. The important contributoryschemes include the Employees State InsuranceAct, 1948 and the Provident Fund, Pension andDeposit linked insurance schemes framed underEmployees Provident Funds and MiscellaneousProvisions Act, 1952. The major non-contributorysocial security measures are provided for underthe Workmen’s Compensation Act, 1923, the Mater-nity Benefit Act, 1961, and the Payment of GratuityAct, 1972.
EXISTING SOCIAL SECURITY SCENARIO4.2.6 The existing social security system in Indiaexhibits diverse characteristics. There are a large num-ber of schemes, administered by different agencies,each scheme designed for a specific purpose andtarget group of beneficiaries, floated as they are by theCentral and State Governments as well as by VO inresponse to their own perceptions of needs, of the par-ticular time. The result is often ambiguous. Many atime some scheme(s) might be responsible for creat-ing ‘exclusion’ of the large number of those ‘in mostcritical need for support from the planning process’,on grounds of practicability or to protect the interestsof those who are already ‘in’. There are wide gaps incoverage (a large population is still uncovered underany scheme) and overlapping of benefits (a section ofthe population is covered under two or more schemes).In the existing system, coverage varies from scheme toscheme, with different groups of people receivingdifferent types of benefits. In other words, no one isinsured against all risks of life.
4.2.7 Over the years, both Central and State Govern-ments have been taking initiatives for the welfare andsocial security of the workers in the unorganizedsector. The Ministry of Labour and Employment isimplementing welfare schemes for certain categoriesof unorganized sector workers like beedi workers, cineworkers, and certain non-coal mine workers. Similarly,several insurance/poverty alleviation schemes arebeing implemented by various ministries/departments,as well as by States like Kerala and Tamil Nadu, whichhave constituted Welfare Funds for some occupationalgroups. Some States have launched group insuranceschemes for their workers. Yet, some States likeWest Bengal initiated State-Assisted Provident FundSchemes for the unorganized workers.
WORKERS WITH INSTITUTIONALIZEDSOCIAL SECURITY COVER4.2.8 The organized sector includes primarily thoseestablishments that are covered by the Factories Act,1948, the Shops and Establishments Acts of the States,Industrial Employment Standing Orders Act, 1946, etc.This sector already has a structure through whichsocial security benefits are extended to its workers.While some of them such as Provident Fund, pension,
Nutrition and Social Safety Net 151
insurance, medical and sickness benefits are contribu-tory (workers alone, or workers and employers, some-times supported by the State), others like employmentinjury benefits, gratuity, maternity benefit are purelynon-contributory and are met by the employers alone.Most workers under the organized sector are coveredunder the Institutionalized social security providedthrough Employees Provident Fund Organization(EPFO), and the Employees State Insurance Corpora-tion (ESIC).
4.2.9 The EPFO is one of the largest provident fundinstitutions in the world in terms of members andvolume of financial transactions that it has been car-rying on. The EPFO caters to: (i) every establishmentthat is engaged in any one or more of the industriesspecified in the Act or any activity notified by CentralGovernment, employing 20 or more persons, (ii) allcinema theatres employing five or more persons, otherthan those under the control of Central/State/localgovernment that provide equivalent/better benefits ofsocial security, and co-operative societies employingless than 50 persons and working without the aid ofpower, and (iii) any other establishment seeking cov-erage under the scheme voluntarily. As on 31.03.2006,429.53 lakh persons were members of the Employees’Provident Fund, while 323.89 lakh persons were mem-bers of the Pension Fund.
4.2.10 The ESI Act was originally applicable to non-seasonal factories using power and employing 20 ormore persons; but it is now applicable to non-seasonalpower using factories employing 10 or more personsand non-power using factories employing 20 or morepersons. The ESI Scheme has now been extended toshops, hotels, restaurants, cinemas including previewtheatre, road motor transport undertakings, and news-paper establishments employing 20 or more persons.The existing wage limit for coverage is Rs 10000 permonth (with effect from 1.10.2006). The ESI Scheme isbeing implemented area-wise by stages and it nowcovers all the States except Nagaland, Manipur, Tripura,Sikkim, Arunachal Pradesh, and Mizoram; and in UnionTerritories of Delhi, Chandigarh, and Pondicherry.
4.2.11 A scheme for providing employment to per-sons with disabilities in the organized sector has
been proposed to be launched. The main objective ofthe scheme is to provide incentives to the employersin the organized sector for promotion of regularemployment to persons with disabilities. Under thisscheme, the government would reimburse the employ-ers’ contribution of EPF and ESI for the first three years,aiming at creation of one lakh jobs for the physicallychallenged persons.
WORKERS WITHOUT INSTITUTIONALIZEDSOCIAL SECURITY COVER4.2.12 Workers in the informal economy include:(i) the vast majority of the workers in the unorganized/informal as well as; (ii) the workers employed in aninformal capacity in the organized sector—the twotogether account for 93% of workforce. This categoryof the workforce is excluded from the institutional-ized social security cover referred to above.
4.2.13 A number of schemes and systems are inoperation in the nature of social security to workersin the informal economy, following four differentmajor models. However, the major deficiency in thisapproach is the limited coverage (geographical areasand industrial activity). The benefits are confined toonly about 5–6% of the informal sector workers. TheNational Farming benefit scheme that provides anassistance of Rs 10000 in the event of death of familybreadwinner and the National Old Age Pension todestitutes above 65 years of age are other elements ofexisting social security structure.
4.2.14 The Social Insurance Schemes available to theunorganized sector are operated through the LICsuch as Social Security Group Insurance Scheme. Allpersons in the age group of 18 to 60 years belongingto the 24 approved occupation groups, that is, beediworkers, brick-kiln workers, carpenters, cobblers, fish-ermen, hamals, handicraft artisans, handloom weav-ers, handloom and khadi weavers, lady tailors, leatherand tannery workers, papad workers attached toSelf-Employed Women’s Association (SEWA), physi-cally handicapped self-employed persons, primarymilk producers, rickshaw pullers/auto drivers, safaikarmcharies, salt growers, tendu leaf collectors,urban poor, forest workers, sericulture, toddy tappers,powerloom workers, women in remote rural hilly
152 Eleventh Five Year Plan
areas are covered. The most important and compre-hensive scheme that has been launched is the JanashreeBima Yojana providing insurance cover of Rs 20000in case of natural death, Rs 50000 in case of deathor total permanent disability due to an accident, andRs 25000 in case of partial disability. The premiumfor these benefits is Rs 200 per beneficiary, of which50% of the premium, that is, Rs 100 is contributedfrom the ‘Social Security Fund’ and 50% contributedby the beneficiary/State Government/nodal agency.Janashree Bima Yojana is available to persons in the agegroup of 18 to 60 years and living below or marginallyabove the poverty line. The scheme is extended to agroup of 25 members or more. The limited reach ofthe schemes’ benefits to the unorganized workers andthe absence of direct link between a beneficiary and LIChave been the major drawbacks of these schemes.
NEED FOR AN INCLUSIVE SOCIAL SECURITY SYSTEM4.2.15 More than 91% of India’s workforce consistsof informal workers working either in the unorganizedinformal sector (85%) or in the organized formal sec-tor (6%). A large majority of them face the problem of‘deficiency’ or capability deprivation (of basic needs)as well as the problem of ‘adversity’ (arising out of suchcontingencies as sickness and accidents). As stated ear-lier, the social security schemes that are currently inplace hardly cover even 5 to 6% of the estimated num-ber of total informal workers of 362 million (as of1999–2000). With the exception of a small number ofStates with some social security cover for workers inthe unorganized sector, a majority of the States do notoffer any cover, especially for addressing such coreconcerns as health care and maternity. Among theCentral and State Government initiatives that addressthe social security needs of the population, there arevery few schemes addressed specifically for the unor-ganized workers. Kerala and Tamil Nadu are theonly States that offer some reasonable coverage ofboth old age pension for the aged poor and other pro-tective social security schemes for the workers in theunorganized sector. Some States like Maharashtra,Gujarat, West Bengal, Punjab, Haryana, Tripura,Karnataka, and Goa have a number of schemes forthe aged poor and vulnerable population, but exceptin MP, no State has social security schemes specificallymeant for the unorganized sector workers.
ISSUES ON SOCIAL SECURITY IN THECONTEXT OF INCLUSIVE GROWTH4.2.16 The majority of workers in the unorganized/informal sector come from the socially backwardcommunities. Viewed in this light, the provision ofsocial security to these workers should be seen as aform of social uplift. Further, the absence of a viableand comprehensive social security arrangement is notmerely the problem of individual workers and theirfamilies. It also has wider ramifications for theeconomy and society. Economically speaking a workerwith no social security cover is likely to have moredomestic worries than the one with a reasonable cover.This, as noted above, debilitates the worker’s efficiencyand productivity. Lack of purchasing power, as aresult of low earning power, along with vulnerabilitieswill have the effect of reducing the aggregate demandin the economy. Socially, the demonstration effect ofthe prospering section is likely to lead the uncoveredsection to disillusionment, dissatisfaction, and dis-affection. The overall well-being of the country asmeasured by health, education, longevity of life, andaccess to resources will be affected adversely, at timesmanifesting itself in crimes and other illegal activities.
PROVISION OF SOCIAL SECURITY IN THEPERSPECTIVE PERIOD—RECENT INITIATIVES4.2.17 The Recent Initiatives on Social Securityconsist of the Unorganized Sector Workers SocialSecurity Bill, 2007, the Aam Admi Bima Yojana (AABY),2007, and Health Insurance Scheme for UnorganizedSector BPL workers, 2007. The major features are listedbelow:
Unorganized Sector WorkersSocial Security Bill, 20074.2.18 The Unorganized Sector Workers Social Secu-rity Bill, 2007, which has been introduced in the RajyaSabha, seeks to provide statutory backing to the vari-ous social security schemes of the Central governmentincluded in the Schedule to the Act. These relate to:(i) life and disability cover, (ii) health and maternitybenefits, (iii) old age protection, and (iv) any otherbenefits to be determined by the Central government.The State Governments may formulate schemes for:(i) provident fund, (ii) employment injury benefits,(iii) housing, (iv) educational schemes for children,
Nutrition and Social Safety Net 153
(v) skill upgradation of workers, (vi) funeral assistance,and (vii) old age homes. There will be a NationalSocial Security Advisory Board and State SocialSecurity Advisory Boards to make recommendationsto the governments on suitable schemes for differentsections of unorganized workers. The Boards will alsomonitor the administration of the schemes, reviewthe processes of registration, issue of identity cards,recordkeeping, and the expenditure under the schemes,and also advise the governments on administration ofthe schemes. The benefits shall be admissible to all per-sons above 14 years of age based on a self-declarationthat he/she is an unorganized sector worker. Uponan application to the District Administration in theprescribed form, such persons will be given an iden-tity card in the form of a smart card. The law alsorequires the governments to make their contributionsunder the schemes regularly. The Schedule to the Actwill have 11 schemes including the AABY and theHealth Insurance Scheme for Unorganized SectorBPL workers.
Aam Admi Bima Yojana (AABY), 20074.2.19 Group Insurance Schemes do not attractunorganized sector workers or the organizations work-ing for their welfare and development because theschemes do not provide the annuity in the cases ofsurvivor members. All categories of unorganized work-ers are not covered under the existing schemes ofsocial security. Further, lack of awareness aboutschemes amongst rural population and the poordelivery mechanism at the village level contribute tothe ineffectiveness of the programmes.
4.2.20 Taking the above factors into account, thegovernment has announced the AABY. The membersof All Rural Landless Households, in the age groupof 18–59 years will be eligible. The premium of Rs 200per member will be borne by the Centre and Statesequally. The State Government will be the NodalAgency. A sum of Rs 30000 in case of natural death andRs 75000 in case of accidental death will be payable.A compensation of Rs 75000 will be payable in caseof total permanent disability and of Rs 37500 in caseof partial permanent disability. The scheme alsohas a provision for the payment of a scholarship ofRs 300 per quarter per child for two children of the
beneficiaries studying in 9th to 12th standard for itsbeneficiaries.
4.2.21 The AABY scheme also proposes the creationof a fund of Rs 1000 crore to be operated by LIC formeeting the liability of Central government towardsits share of premium payment. As per the NSS, thenumber of rural landless households in the country is1.5 crore. It is expected that in the first year approx.70 to 80 lakh of rural landless households would becovered under the scheme requiring an expenditureof Rs 70–80 crore by the Central government towardsits share of 50% premium. With an 8% per annumreturn expected on the Rs 1000 crore fund, the amountwould be sufficient to meet the liability of premiumpayment.
4.2.22 A separate Rs 500 crore fund will be createdfor the purpose of providing scholarships to childrenof beneficiaries. This will make available Rs 40 crorefor the full year at 8% per annum return. This amountwould suffice for the coverage of 333000 children ofthe beneficiaries.
4.2.23 This scheme would extend the benefit of lifeinsurance coverage as well as coverage of partial andpermanent disability to the head of the family or anearning member of the family of rural landless house-holds in the States and also educational assistance totheir children studying from 9th to 12th standard asan extended benefit.
Health Insurance Scheme forUnorganized Sector BPL Workers, 2007(Rashtriya Swasthaya Bima Yojana)4.2.24 In order to provide accessible, affordable, andaccountable quality health services to households inrural areas, the government has launched the NRHM.The principle thrust of NRHM is to make public sys-tem fully functional at all levels and to place a frame-work that would reduce the distress of households inseeking health care system through Health InsuranceScheme. Many efforts in the past for providing healthinsurance for the rural poor have not been successfulbecause of inadequacies in design and implementa-tion. The cost of insurance coupled with lack of per-ception of the benefits in the target group, and the
154 Eleventh Five Year Plan
procedure for claiming reimbursements have posedserious challenges in the administration. A transpar-ent scheme that lists the entitlements, administeredthrough a smart card obviating the need for out-of-pocket expenses is expected to streamline the admin-istration, ensuring the benefits. With these objectivesin view, the government has introduced the RashtriyaSwasthya Bima Yojana to cover all BPL unorganizedsector workers and their families (of five members),whose identity will be verified by the implementingagency and be issued a smart card. The cost of smartcard will be borne by Central government, and thebeneficiary will be required to pay Rs 30 per annum asregistration/renewal fee. The prescribed premiumof Rs 750 per member-family will be borne by theCentral and State Governments in the ratio of 75:25.The package of benefits will include: (i) cashless at-tendance to all covered ailments; (ii) hospitalizationexpenses, taking care of most common illnesses, (iii)all pre-existing diseases to be covered, (iv) transporta-tion costs subject to prescribed limits payable to thebeneficiary. Flexibility is provided to the States to addto the benefits by meeting the additional premiumrequirements from their own resources. State govern-ments would decide the Implementing Agency andalso bear the administrative costs.
4.2.25 There are 6 crore BPL families. They will becovered in five years (1.2 crore per annum). The totalcost of the scheme over the Eleventh Five Year Plan isestimated at Rs 7078.25 crore.
Extension of National Old Age PensionScheme (NOAPS)4.2.26 The National Social Assistance Programme(NSAP) came into effect from 15 August 1995 as a100% Centrally Sponsored Programme, with threecomponents namely, NOAPS, National Family Ben-efit Scheme, and NMBS. The NMBS has since beentransferred to the MoHFW with effect from 1.4.2001.The NSAP aims at providing social security in case ofold age, death of primary breadwinner, and maternity.The main objective of the NOAPS is ensure a mini-mum national standard of social assistance in addi-tion to the benefit that States are already providing,without displacing the expenditure by States on socialprotection schemes. The scheme is aimed at senior
citizens, that is, over 65 years or above, who are desti-tute in the sense of having little or no regular meansof subsistence from his/her own sources of income orthrough support from family members or othersources. Major modifications in NSAP are beingproposed in the Eleventh Plan to provide more com-prehensive coverage to the old (details in Chapter 3,Vol. III).
Unorganized Sector Workers—Conditionsof Service Law4.2.27 The unorganized section of agricultural sector(consisting of crop cultivation and other agriculturalactivities such as forestry, livestock, and fishing), notprotected under the Plantations Workers Act, hasneither formal system of social security nor regula-tion of conditions of work. The government hastaken note of the concerns expressed by the NCEUSand is examining the desirability of enacting laws regu-lating the minimum conditions of work of agricul-tural wage workers and provide a measure of socialsecurity to agricultural wage workers and marginal andsmall farmers in the unorganized sector. Similarprovisions would be made for other workers in thenon-agricultural unorganized sector as well as infor-mal/unorganized workers in the organized sectorconsisting of wage workers, independent self-employed, and workers who are self-employed athome, whose minimum conditions of work arenot regulated by any other legislation. The provisionof a statutory package of National Minimum SocialSecurity to which all unorganized (agricultural andnon-agricultural) workers are entitled need to beconsidered. There may be Social Security AdvisoryBoards and dispute resolution mechanisms to overseeand monitor the implementation and ensure that eachsuch worker has the sense of being provided with whatis due to him/her.
SOCIAL SECURITY: APPROACH AND STRATEGYFOR THE ELEVENTH FIVE YEAR PLAN4.2.28 A protective social security mechanism, takingcare of the adversity aspects of ill-health, accidents/death, and old age would be established at the core.The other vulnerability aspects due to in-built deficien-cies as they exist now, such as lack of access for the poorto credit/finance (especially for the self-employed),
Nutrition and Social Safety Net 155
loans for upgrading skills, loans for housing, children’seducation, etc. shall be tailored to meet the socialsecurity concerns of workers qua workers in the unor-ganized/ informal sector, subject to the availability ofresources. The National Old Age Pension presentlycovers persons who are destitute and old aged. SomeStates cover the old aged BPL persons. NSAP wouldbe made more comprehensive.
4.2.29 Considering the achievements made by theESIC and the EPFO in providing institutionalizedsocial security cover to a majority of the workers inthe organized sector, attempt would be made to widentheir coverage and strengthen them. To cover morenumber of beneficiaries, measures should be taken toenhance the capability of these institutions to cope withthe workload. To reduce harassment and corruptionin these institutions, the government will strive tostreamline the delivery system in these institutions.
4.2.30 A national policy for fixing minimum wages
would be crystallized and made effective. Discrimina-tion in wages based on gender and age would beabolished/penalized. The recovery of minimum wageswould be simplified and be equated with recovery dueof land revenue. An information network will also bebuilt to promote awareness, to educate employers(some of whom do alternate as wage labour too), andto prevent malpractices (perpetrated by design or byignorance) with the help of the media, NGOs, andPRIs.
4.2.31 Assigning an identity to the beneficiary is anessential condition to create empowerment to lay aclaim to what one is expected to receive. The NationalSocial Security Numbers schemes shall be extended toall citizens in the country, so that the most vulnerablepeople who need it the most, including migrant labourand nomads could use it. In fact, considering that suchpersons do not even get the rations under the PDS,which is an important social security measure, thisexercise will be taken up urgently.
156 Eleventh Five Year Plan
ANNEXURE 4.1.1Malnutrition of Children (0–3 Years), by State
S.No. State Current level of Eleventh PlanWt-for-age below–2 SD Goal-redn. by 50%
11 Andhra Pradesh 36.5 18.3
12 Arunachal Pradesh 36.9 18.5
13 Assam 40.4 20.2
14 Bihar 58.4 29.2
15 Jharkhand 59.2 29.6
16 Goa 29.3 14.7
17 Gujarat 47.4 23.7
18 Haryana 41.9 21.0
19 Himachal Pradesh 36.2 18.1
10 J&K 29.4 14.7
11 Karnataka 41.1 20.6
12 Kerala 28.8 14.4
13 MP 60.3 30.2
14 Chattisgarh 52.1 26.1
15 Maharashtra 39.7 19.9
16 Manipur 23.8 11.9
17 Meghalaya 46.3 23.2
18 Mizoram 21.6 10.8
19 Nagaland 29.7 14.9
20 Orissa 44.0 22.0
21 Punjab 27.0 13.5
22 Rajasthan 44.0 22.0
23 Sikkim 22.6 11.3
24 Tamil Nadu 33.2 16.6
25 Tripura 39.0 19.5
26 UP 47.3 23.7
27 Uttarakhand 38.0 19.0
28 WB 43.5 21.8
29 Delhi 33.1 16.6
INDIA 45.9 23.0
Note: 1. Figures for current level are that of NFHS 2005–06.2. For State level figures, pro-rata reduction has been applied on the basis of targeted reduction at All Indialevel. Figures for other States are not available.
Source: NFHS 2005–06.
Nutrition and Social Safety Net 157
ANNEXURE 4.1.2State-wise Malnutrition Rate of Children in Various Age Groups
State Children age 0–5 Children age 6–9 months Children under 3 yearsmonths exclusively receiving solid or semi-solid who are underweight
breastfed (%) food and breast milk (%) (%)
India 46.3 55.8 45.9
Andhra Pradesh 62.7 63.7 36.5
Arunachal Pradesh 60.0 77.6 36.9
Assam 63.1 59.6 40.4
Bihar 27.9 57.3 58.4
Chhattisgarh 82.0 54.5 52.1
Delhi 34.5 59.8 33.1
Goa 17.7 69.8 29.3
Gujarat 47.8 57.1 47.4
Haryana 16.9 44.8 41.9
Himachal Pradesh 27.1 66.0 36.2
J&K 42.3 58.3 29.4
Jharkhand 57.8 65.3 59.2
Karnataka 58.0 72.5 41.1
Kerala 56.2 93.6 28.8
Maharashtra 53.0 47.8 39.7
MP 21.6 51.9 60.3
Manipur 61.7 78.1 23.8
Meghalaya 26.3 76.3 46.3
Mizoram 46.1 84.6 21.6
Nagaland 29.2 71.0 29.7
Orissa 50.2 67.5 44.0
Punjab 36.0 50.0 27.0
Rajasthan 33.2 38.7 44.0
Sikkim 37.2 89.6 22.6
Tamil Nadu 33.3 77.9 33.2
Tripura 36.1 59.8 39.0
UP 51.3 45.5 47.3
Uttaranchal 31.2 51.6 38.0
WB 58.6 55.9 43.5
Source: NFHS-3 (2005–06), IIPS, MoHFW, GoI.
158 Eleventh Five Year Plan
ANNEXURE 4.1.3Anaemia among Women (15–49 Years)
S. No. State Current Level Eleventh Plan Goal:reduction by 50%
India 56.1 28.1
11 Delhi 43.4 21.7
12 Haryana 56.5 28.3
13 Himachal Pradesh 40.9 20.5
14 J&K 53.1 26.6
15 Punjab 38.4 19.2
16 Rajasthan 53.1 26.6
17 MP 57.6 28.8
18 Chattisgarh 57.6 28.8
19 UP 50.8 25.4
10 Uttarakhand 47.6 23.8
11 Bihar 68.3 34.2
12 Jharkhand 70.4 35.2
13 Orissa 62.8 31.4
14 WB 63.8 31.9
15 Arunachal Pradesh 48.9 24.5
16 Assam 69.0 34.5
17 Manipur 39.3 19.7
18 Meghalaya 45.4 22.7
19 Mizoram 38.2 19.1
20 Nagaland 30.8 15.4
21 Sikkim 46.8 23.4
22 Goa 38.9 19.5
23 Gujarat 55.5 27.8
24 Maharashtra 49.0 24.5
25 Andhra Pradesh 62.0 31.0
26 Karnataka 50.3 25.2
27 Kerala 32.3 16.2
28 Tamil Nadu 53.3 26.7
29 Tripura 67.4 33.7
Notes: 1. Figures for current level are that of NFHS 2005–06.2. For State-level figures, pro-rata reduction has been applied on the basis of targeted reduction atAll India level.3. Figures for other States are not available.
Source: NFHS 2005–06.
Nutrition and Social Safety Net 159
ANNEXURE 4.1.4Distribution of Cardholders among Poor and Non-poor
% poor having % of poor having % BPL/AAY cards % non-poor havingno ration card BPL/AAY cards with non-poor BPL/AAY cards
J&K 7.9 55.1 85.4 17.2
Himachal Pradesh 3.3 45.1 73.6 13.7
Punjab 15.8 19.5 83.0 8.5
Uttranchal 6.1 35.2 34.2 12.0
Haryana 4.4 32.6 74.8 15.2
Rajasthan 5.0 23.6 65.2 12.1
UP 16.4 22.9 48.7 10.6
Bihar 25.5 21.2 45.1 12.6
Assam 25.7 23.3 56.0 7.6
WB 11.2 40.5 60.7 20.6
Jharkhand 22.1 31.9 42.4 17.0
Orissa 29.3 54.8 38.1 29.4
Chhatisgarh 24.1 47.9 47.0 29.4
MP 30.0 41.9 46.2 22.2
Gujarat 10.9 48.1 71.2 24.2
Maharashtra 19.2 39.9 51.1 18.4
Andhra Pradesh 24.1 66.8 81.3 50.3
Karnataka 20.7 59.6 65.6 36.5
Kerala 10.0 48.4 74.8 25.0
Tamil Nadu 9.0 29.7 63.1 15.0
All India 19.1 36.0 59.8 20.7
Source: NSS, 61st Round, 2004–05.
160 Eleventh Five Year Plan
ANNEXURE 4.1.5PDS Benefits—Rice and Wheat
(Rs per Household)
Poor Non poor
No APL BPL Antyodaya No APL BPL Antyodayacard card card card card card card card


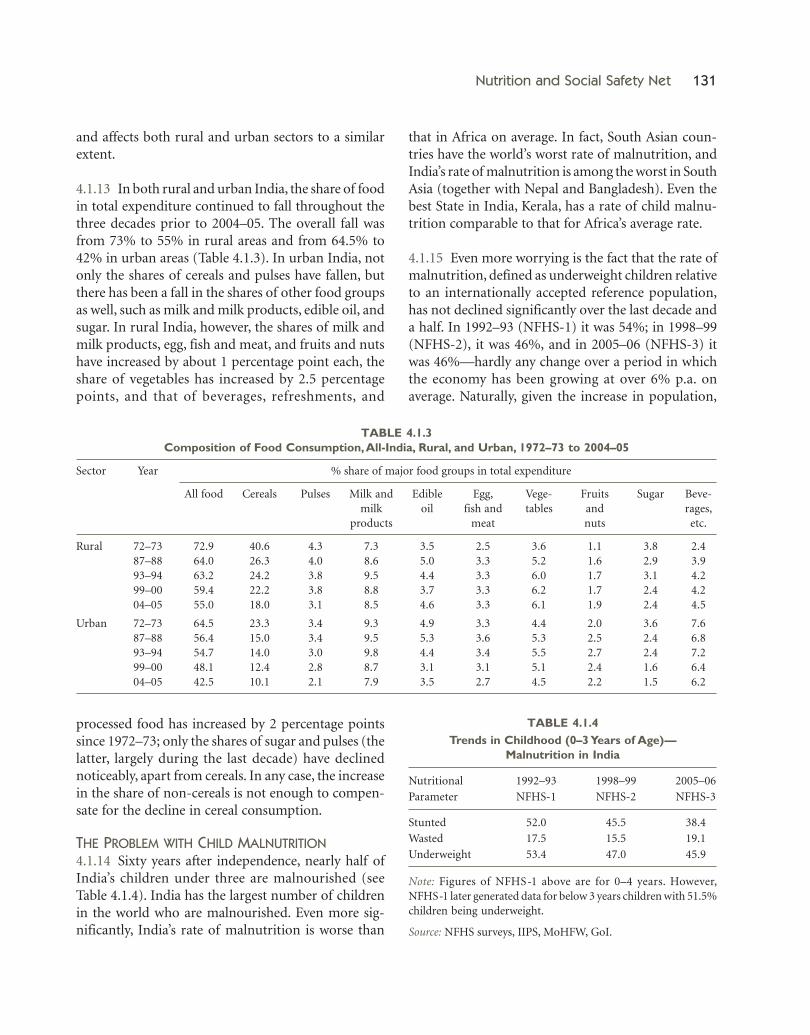


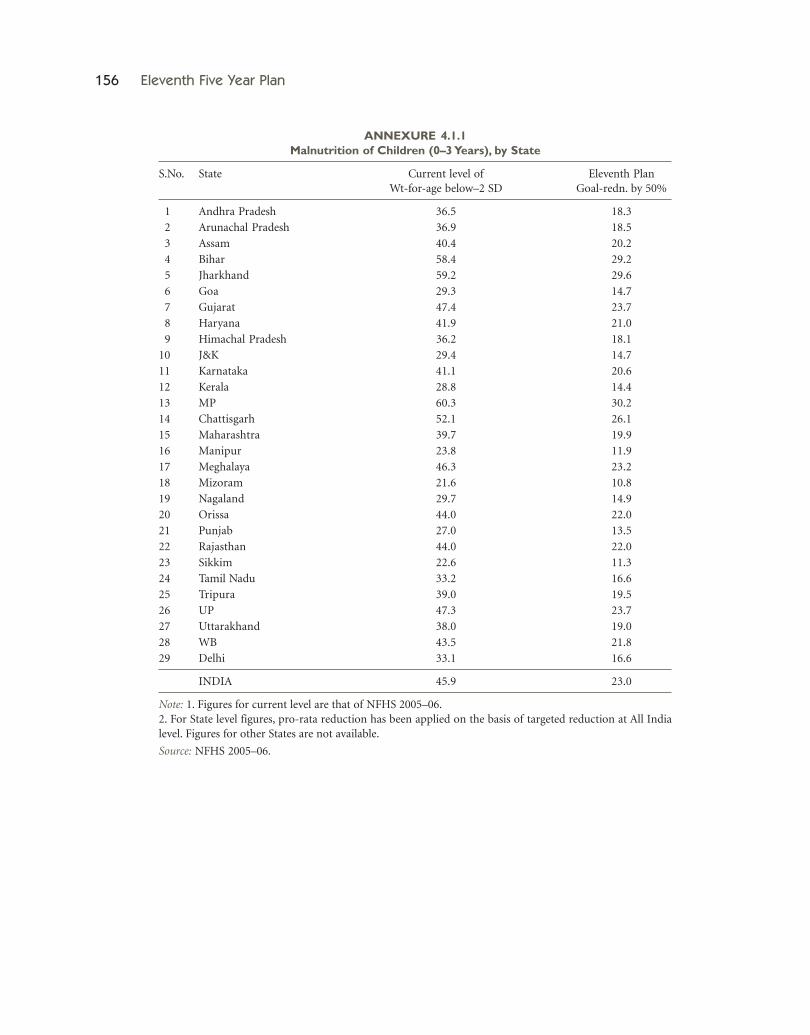


![®ûWkR. Aû]jûRÙm Es[Pd¡V Y[of£ûV úSôd¡planningcommission.nic.in/plans/planrel/11appdrft/11app_tamil.pdf · _ýu 14. 2006 11YÕ IkRôiÓj ... CkR ùTôÚ[ôRôW Y[of£ TpúY](https://static.documents.pub/doc/80x56/5c91ca3409d3f207228bfe7e/uwkr-aujurum-espdv-yofuv-usod-yu-14-2006-11yo-ikroioj.jpg)


