81
OnCommand Insight for Enterprise and Cloud Monitoring June 2017 | SL10357 Version 1.3.0
OnCommand Insight for Enterprise andCloud Monitoring
June 2017 | SL10357 Version 1.3.0
OnCommand Insight for Enterprise and Cloud Monitoring2 © 2017 NetApp, Inc. All rights reserved. NetApp Proprietary
1 IntroductionThis lab features NetApp OnCommand Insight (OCI) 7.3. The lab employs key use cases to illustrate thevalue that OnCommand Insight delivers to on premise and globally dispersed data centers. The lab activitiesdemonstrate how to leverage many of the new features in OnCommand Insight.
OCI collects and analyzes capacity, performance, and service path metrics in near real time over IP, and withoutthe use of agents. In OCI 7.3, the web UI interface, performance correlation analytics, new landing pages, andnumerous troubleshooting and enterprise integration enhancements vastly improve the user experience. The labincludes a fully configured OnCommand Insight environment, populated with a heterogeneous mix of Storage,Hypervisors, and fabric, including Clustered Data ONTAP.
The objective of this lab is to provide you with an understanding of the scalability, interoperability, consolidation,and correlation capabilities of OnCommand Insight. The lab walks you through a typical performancetroubleshooting exercise in a multi-vendor, multi-platform environment. You can quickly identify the contendingresources and bottlenecks within the demonstration by using OnCommand Insight’s patent pending correlationanalytics. In addition, you can analyze an end-to-end service path violation triggered by OnCommand Insight’sconfigurable alert-based policies.
You do not have to follow sections in order; the aim is to show the possibilities of what the OnCommand Insightcan deliver, so self-exploration is encouraged. If you do not follow the flow in this document, it will not breakanything. OnCommand Insight leverages the Web browser’s built in capabilities for navigation, so use thebrowser’s saved history if you want to navigate back to pages you previously viewed.
1 Prerequisities• To make the best use of this lab, you should have a detailed understanding of SAN and NAS storage
concepts. For instance: performance analysis, storage architectures, and troubleshooting storage.• You should also be familiar with NetApp storage.
OnCommand Insight for Enterprise and Cloud Monitoring3 © 2017 NetApp, Inc. All rights reserved. NetApp Proprietary
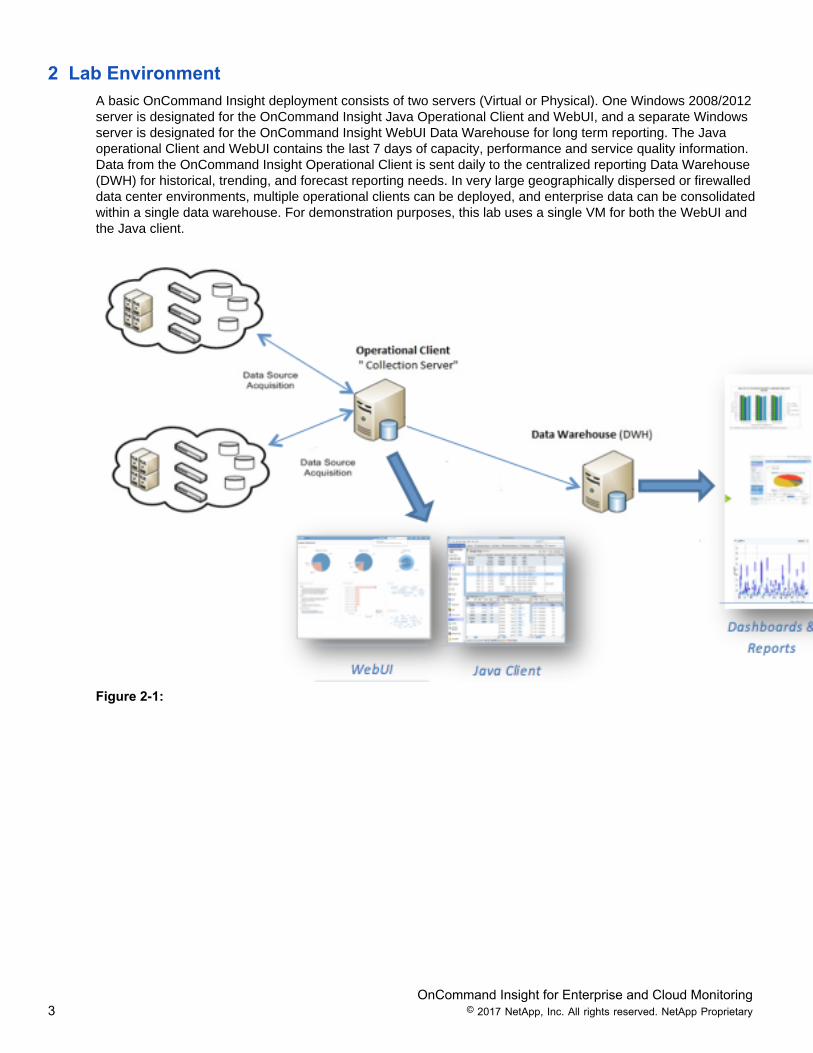
2 Lab EnvironmentA basic OnCommand Insight deployment consists of two servers (Virtual or Physical). One Windows 2008/2012server is designated for the OnCommand Insight Java Operational Client and WebUI, and a separate Windowsserver is designated for the OnCommand Insight WebUI Data Warehouse for long term reporting. The Javaoperational Client and WebUI contains the last 7 days of capacity, performance and service quality information.Data from the OnCommand Insight Operational Client is sent daily to the centralized reporting Data Warehouse(DWH) for historical, trending, and forecast reporting needs. In very large geographically dispersed or firewalleddata center environments, multiple operational clients can be deployed, and enterprise data can be consolidatedwithin a single data warehouse. For demonstration purposes, this lab uses a single VM for both the WebUI andthe Java client.
Figure 2-1:
OnCommand Insight for Enterprise and Cloud Monitoring4 © 2017 NetApp, Inc. All rights reserved. NetApp Proprietary
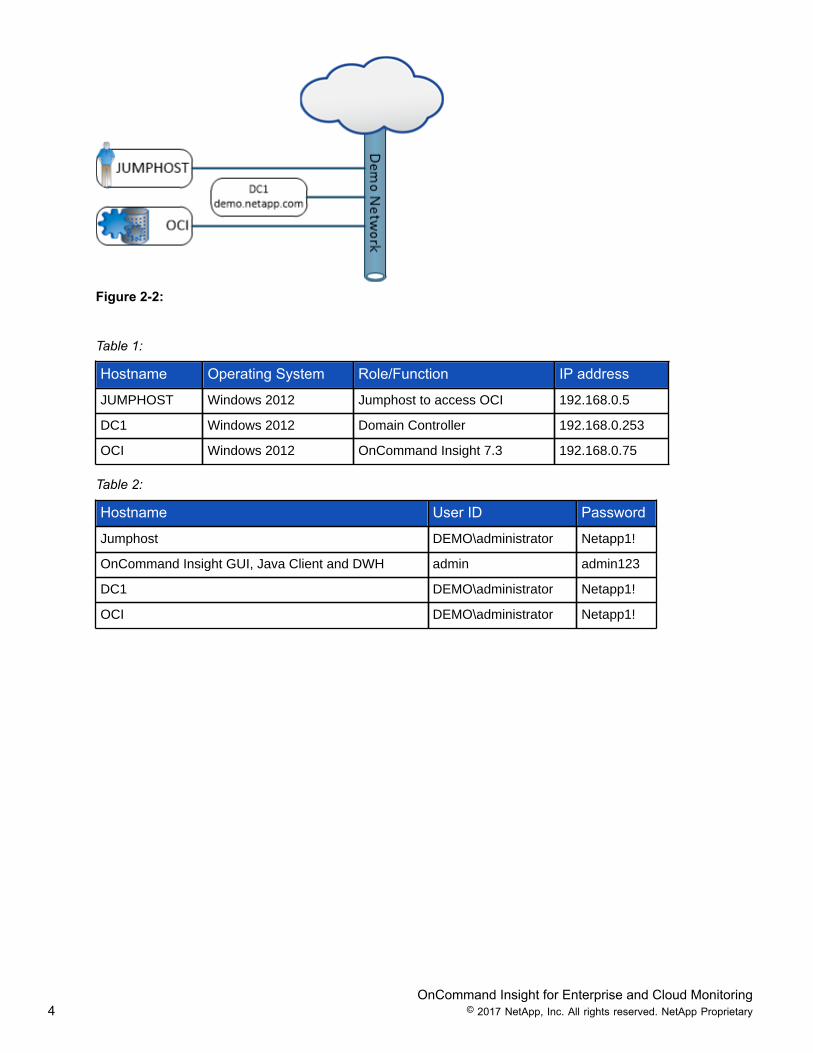
Figure 2-2:
Table 1:
Hostname Operating System Role/Function IP address
JUMPHOST Windows 2012 Jumphost to access OCI 192.168.0.5
DC1 Windows 2012 Domain Controller 192.168.0.253
OCI Windows 2012 OnCommand Insight 7.3 192.168.0.75
Table 2:
Hostname User ID Password
Jumphost DEMO\administrator Netapp1!
OnCommand Insight GUI, Java Client and DWH admin admin123
DC1 DEMO\administrator Netapp1!
OCI DEMO\administrator Netapp1!
OnCommand Insight for Enterprise and Cloud Monitoring5 © 2017 NetApp, Inc. All rights reserved. NetApp Proprietary
3 Lab ActivitiesThe following lab activities will demonstrate the key value benefits of using OCI 7.3:
• Analyzing Virtual Machine Latency Issues on page 5• Modernize Your Datacenter Leveraging Anomaly Detection for Mission Critical Application
Infrastructures on page 17• Creating Performance Policies (optional) on page 23• Understanding the Impact of Buffer to Buffer (B/B) Credit Zero Errors in Fibre Channel Environments on
page 31• Analyze a Service Quality Missing Redundancy Violation on page 42• Defining Fibre Channel (FC) Policies (optional) on page 54• Annotating Assets for Query Lists and Dashboard Widgets on page 57• Discovering NFS Clients Impacting Internal Volume Latency on page 73
3.1 Analyzing Virtual Machine Latency IssuesThe following lab activity offers information about the contending resources and their direct impact onperformance. In what is referred to as the “Noisy Neighbor” use case, you will witness a common finger pointingsituation where VM performance is suffering, and shared storage services are suspected as being insufficient.
1. Launch the IE web browser (or click on the link for the shortcut named OnCommand Insight 7.3 WebClient).
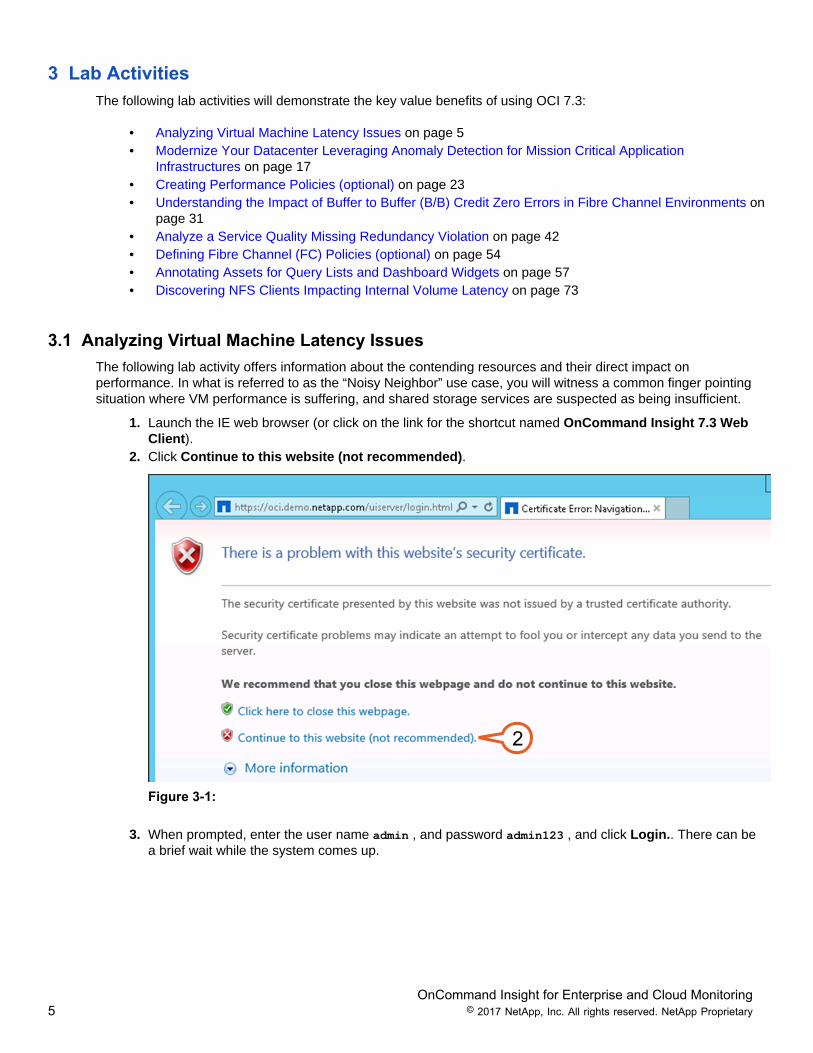
2. Click Continue to this website (not recommended).
2
Figure 3-1:
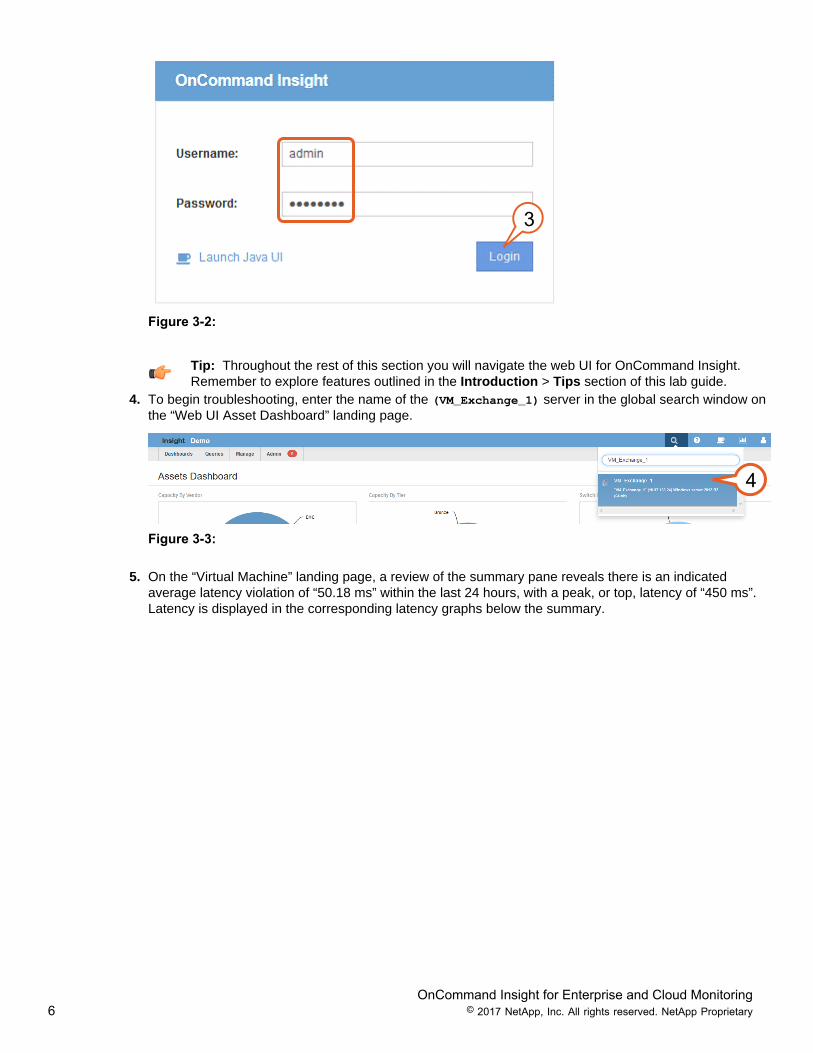
3. When prompted, enter the user name admin , and password admin123 , and click Login.. There can bea brief wait while the system comes up.
OnCommand Insight for Enterprise and Cloud Monitoring6 © 2017 NetApp, Inc. All rights reserved. NetApp Proprietary
3
Figure 3-2:
Tip: Throughout the rest of this section you will navigate the web UI for OnCommand Insight.Remember to explore features outlined in the Introduction > Tips section of this lab guide.
4. To begin troubleshooting, enter the name of the (VM_Exchange_1) server in the global search window onthe “Web UI Asset Dashboard” landing page.
4
Figure 3-3:
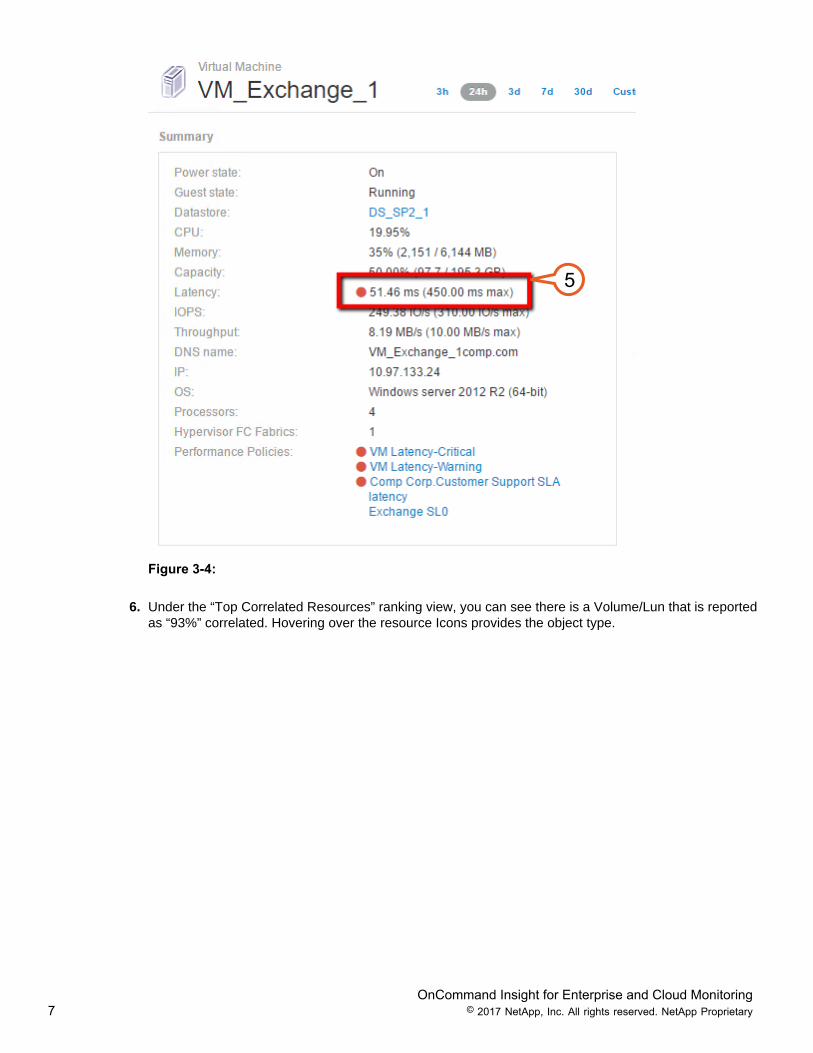
5. On the “Virtual Machine” landing page, a review of the summary pane reveals there is an indicatedaverage latency violation of “50.18 ms” within the last 24 hours, with a peak, or top, latency of “450 ms”.Latency is displayed in the corresponding latency graphs below the summary.
OnCommand Insight for Enterprise and Cloud Monitoring7 © 2017 NetApp, Inc. All rights reserved. NetApp Proprietary
5
Figure 3-4:
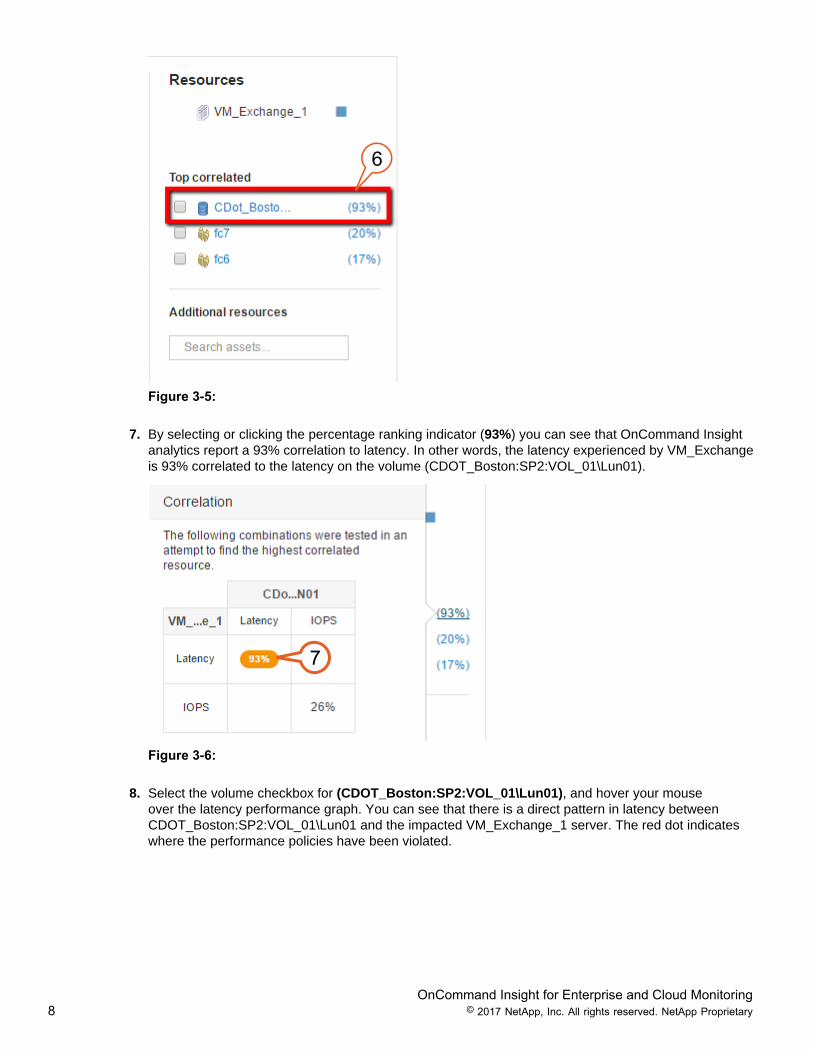
6. Under the “Top Correlated Resources” ranking view, you can see there is a Volume/Lun that is reportedas “93%” correlated. Hovering over the resource Icons provides the object type.
OnCommand Insight for Enterprise and Cloud Monitoring8 © 2017 NetApp, Inc. All rights reserved. NetApp Proprietary
6
Figure 3-5:
7. By selecting or clicking the percentage ranking indicator (93%) you can see that OnCommand Insightanalytics report a 93% correlation to latency. In other words, the latency experienced by VM_Exchangeis 93% correlated to the latency on the volume (CDOT_Boston:SP2:VOL_01\Lun01).
7
Figure 3-6:
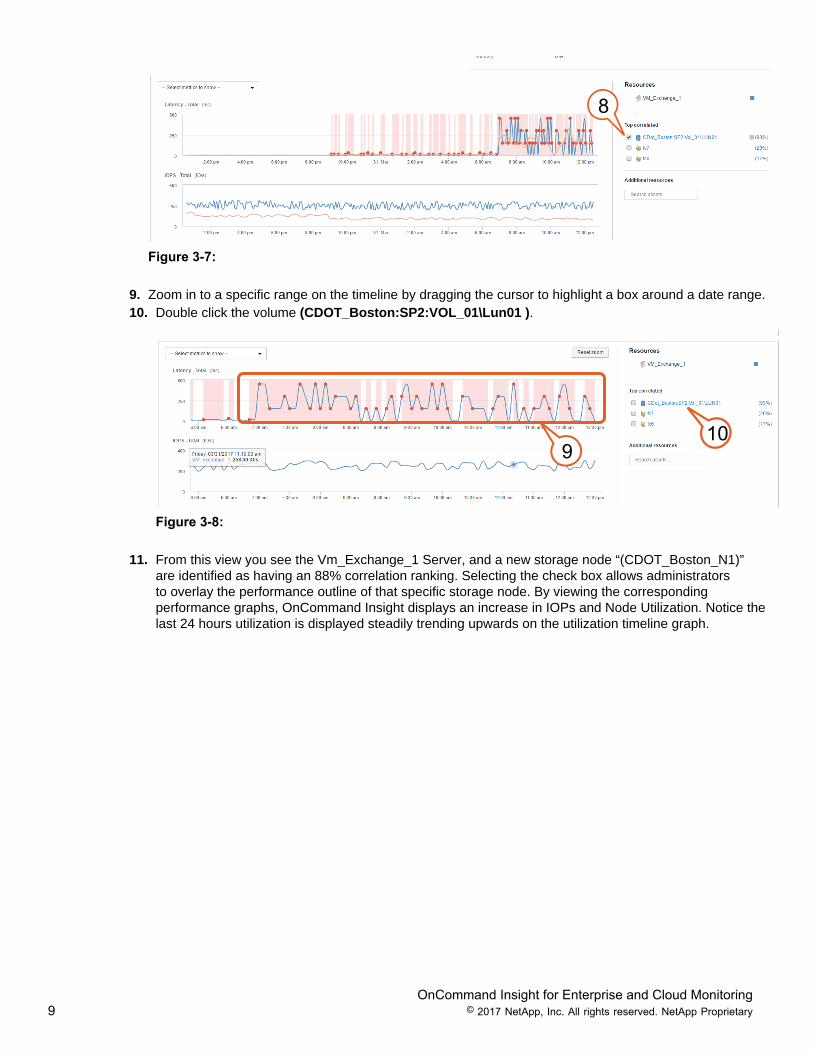
8. Select the volume checkbox for (CDOT_Boston:SP2:VOL_01\Lun01), and hover your mouseover the latency performance graph. You can see that there is a direct pattern in latency betweenCDOT_Boston:SP2:VOL_01\Lun01 and the impacted VM_Exchange_1 server. The red dot indicateswhere the performance policies have been violated.
OnCommand Insight for Enterprise and Cloud Monitoring9 © 2017 NetApp, Inc. All rights reserved. NetApp Proprietary
8
Figure 3-7:
9. Zoom in to a specific range on the timeline by dragging the cursor to highlight a box around a date range.10. Double click the volume (CDOT_Boston:SP2:VOL_01\Lun01 ).
910
Figure 3-8:
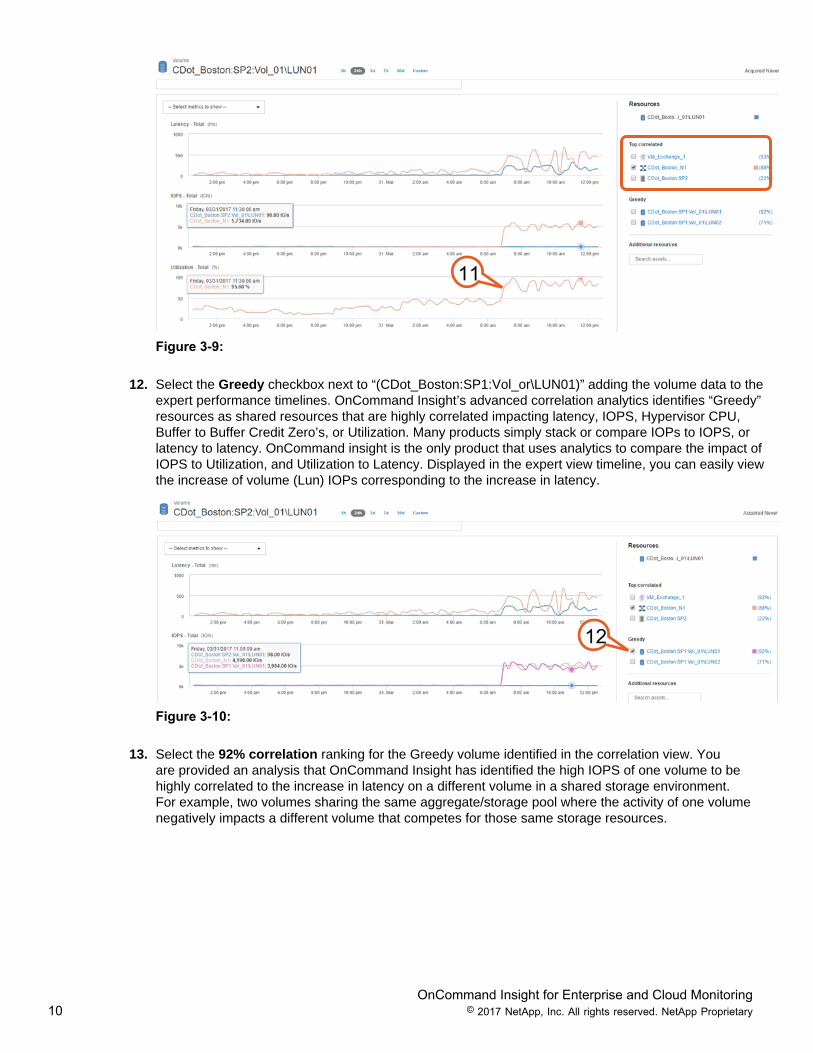
11. From this view you see the Vm_Exchange_1 Server, and a new storage node “(CDOT_Boston_N1)”are identified as having an 88% correlation ranking. Selecting the check box allows administratorsto overlay the performance outline of that specific storage node. By viewing the correspondingperformance graphs, OnCommand Insight displays an increase in IOPs and Node Utilization. Notice thelast 24 hours utilization is displayed steadily trending upwards on the utilization timeline graph.
OnCommand Insight for Enterprise and Cloud Monitoring10 © 2017 NetApp, Inc. All rights reserved. NetApp Proprietary
11
Figure 3-9:
12. Select the Greedy checkbox next to “(CDot_Boston:SP1:Vol_or\LUN01)” adding the volume data to theexpert performance timelines. OnCommand Insight’s advanced correlation analytics identifies “Greedy”resources as shared resources that are highly correlated impacting latency, IOPS, Hypervisor CPU,Buffer to Buffer Credit Zero’s, or Utilization. Many products simply stack or compare IOPs to IOPS, orlatency to latency. OnCommand insight is the only product that uses analytics to compare the impact ofIOPS to Utilization, and Utilization to Latency. Displayed in the expert view timeline, you can easily viewthe increase of volume (Lun) IOPs corresponding to the increase in latency.
12
Figure 3-10:
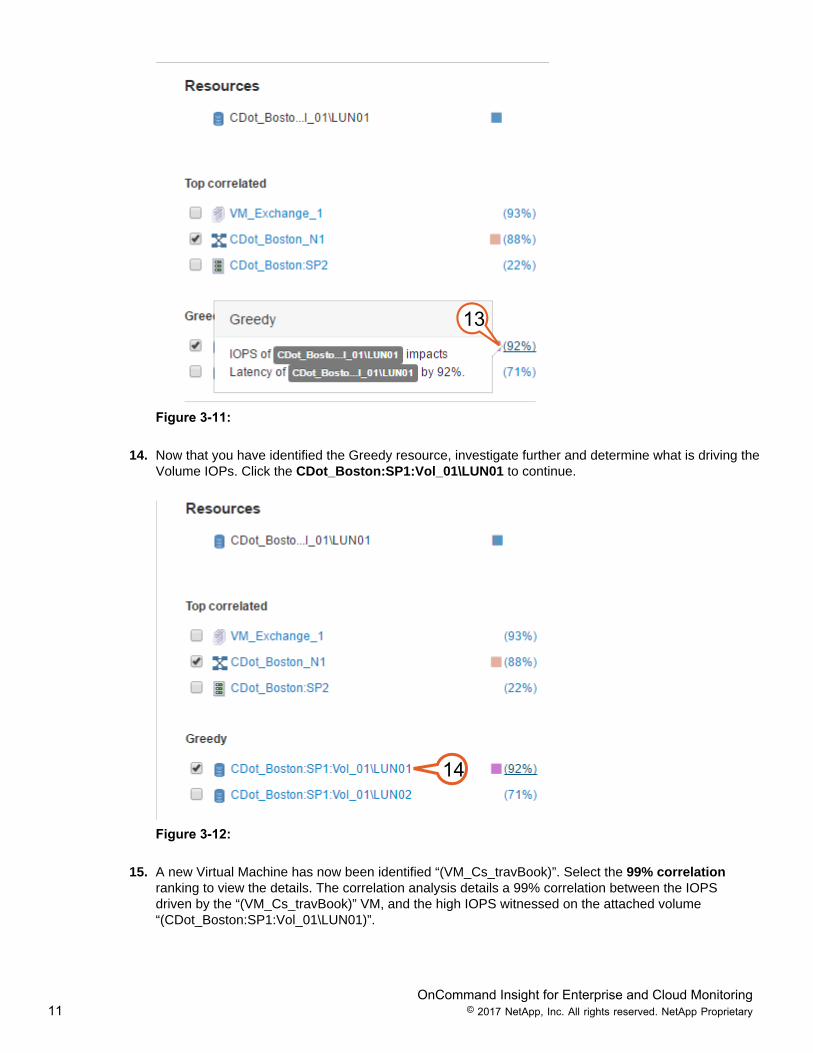
13. Select the 92% correlation ranking for the Greedy volume identified in the correlation view. Youare provided an analysis that OnCommand Insight has identified the high IOPS of one volume to behighly correlated to the increase in latency on a different volume in a shared storage environment.For example, two volumes sharing the same aggregate/storage pool where the activity of one volumenegatively impacts a different volume that competes for those same storage resources.
OnCommand Insight for Enterprise and Cloud Monitoring11 © 2017 NetApp, Inc. All rights reserved. NetApp Proprietary
13
Figure 3-11:
14. Now that you have identified the Greedy resource, investigate further and determine what is driving theVolume IOPs. Click the CDot_Boston:SP1:Vol_01\LUN01 to continue.
14
Figure 3-12:
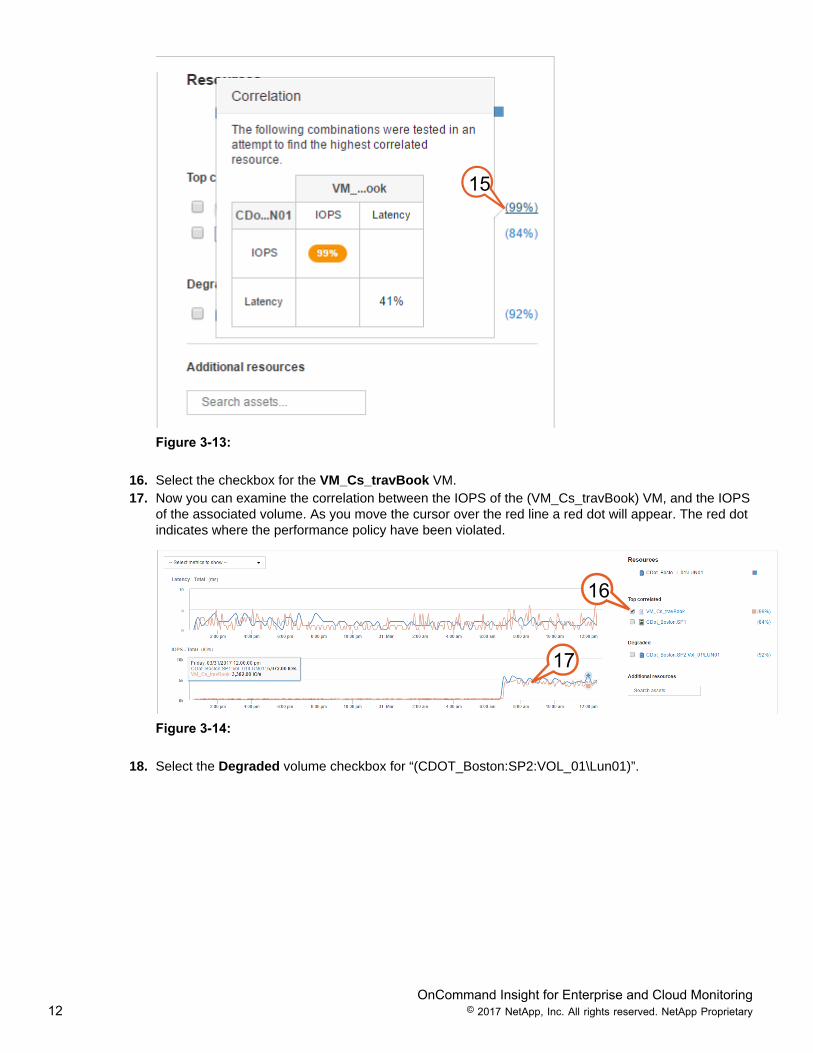
15. A new Virtual Machine has now been identified “(VM_Cs_travBook)”. Select the 99% correlationranking to view the details. The correlation analysis details a 99% correlation between the IOPSdriven by the “(VM_Cs_travBook)” VM, and the high IOPS witnessed on the attached volume“(CDot_Boston:SP1:Vol_01\LUN01)”.
OnCommand Insight for Enterprise and Cloud Monitoring12 © 2017 NetApp, Inc. All rights reserved. NetApp Proprietary
15
Figure 3-13:
16. Select the checkbox for the VM_Cs_travBook VM.17. Now you can examine the correlation between the IOPS of the (VM_Cs_travBook) VM, and the IOPS
of the associated volume. As you move the cursor over the red line a red dot will appear. The red dotindicates where the performance policy have been violated.
16
17
Figure 3-14:
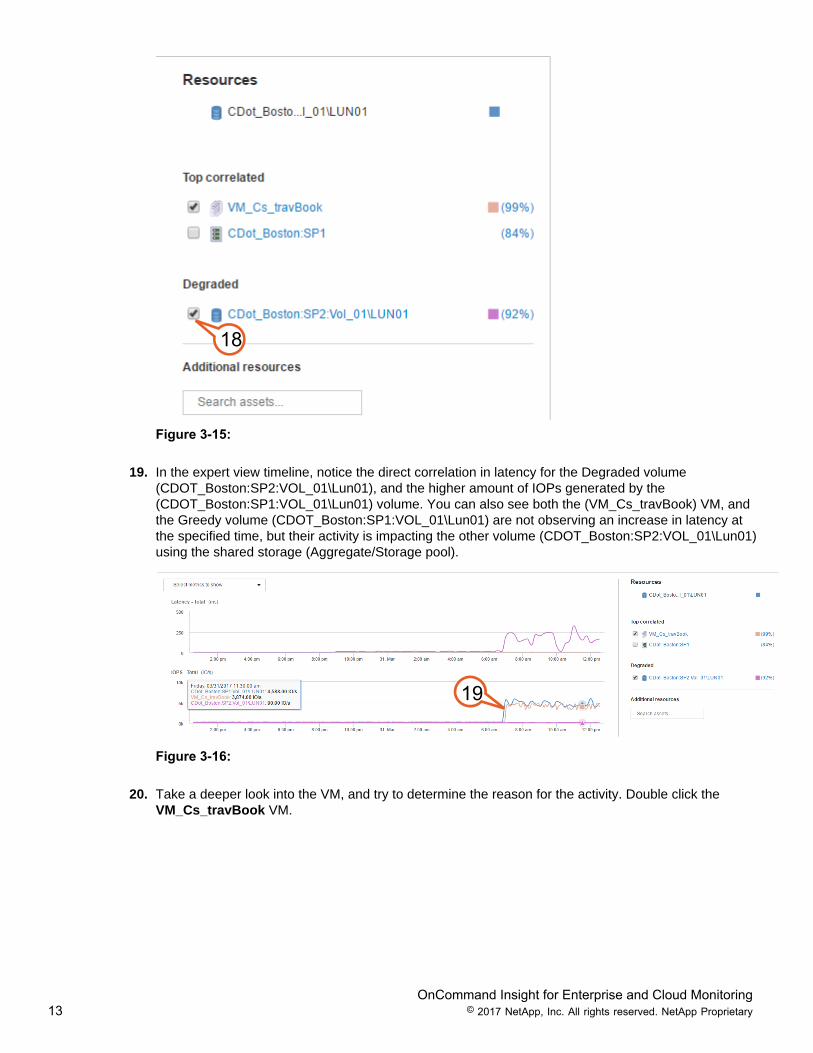
18. Select the Degraded volume checkbox for “(CDOT_Boston:SP2:VOL_01\Lun01)”.
OnCommand Insight for Enterprise and Cloud Monitoring13 © 2017 NetApp, Inc. All rights reserved. NetApp Proprietary
18
Figure 3-15:
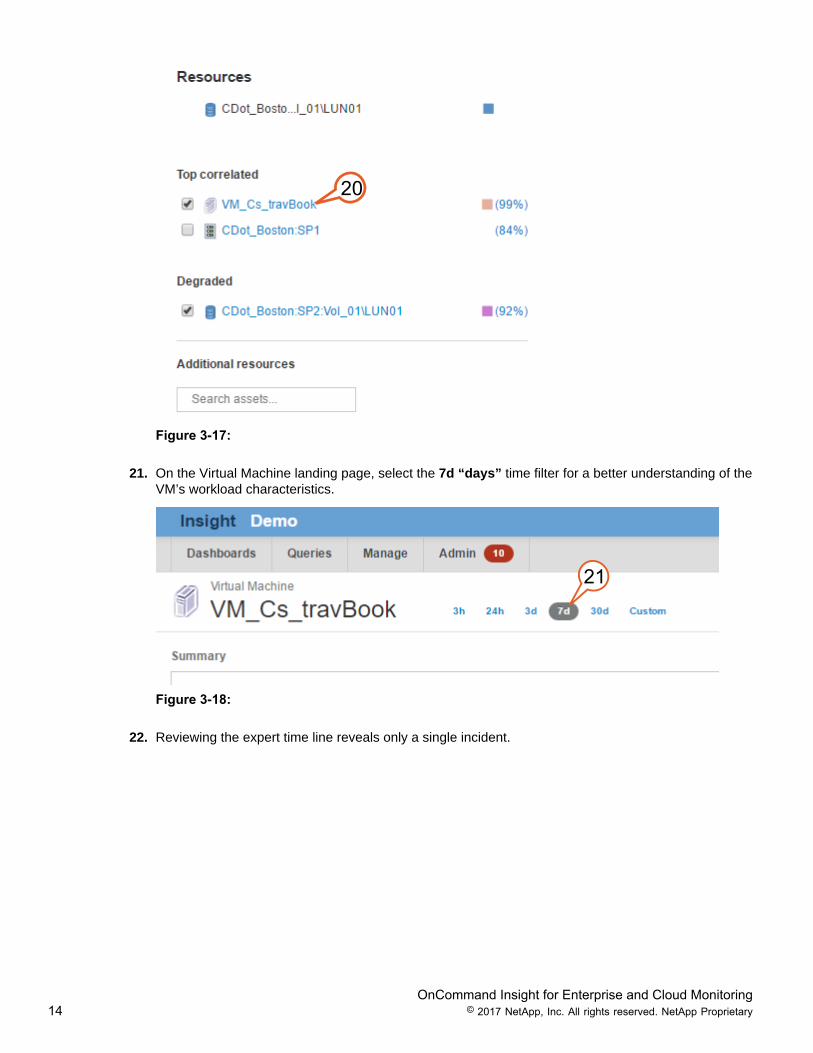
19. In the expert view timeline, notice the direct correlation in latency for the Degraded volume(CDOT_Boston:SP2:VOL_01\Lun01), and the higher amount of IOPs generated by the(CDOT_Boston:SP1:VOL_01\Lun01) volume. You can also see both the (VM_Cs_travBook) VM, andthe Greedy volume (CDOT_Boston:SP1:VOL_01\Lun01) are not observing an increase in latency atthe specified time, but their activity is impacting the other volume (CDOT_Boston:SP2:VOL_01\Lun01)using the shared storage (Aggregate/Storage pool).
19
Figure 3-16:
20. Take a deeper look into the VM, and try to determine the reason for the activity. Double click theVM_Cs_travBook VM.
OnCommand Insight for Enterprise and Cloud Monitoring14 © 2017 NetApp, Inc. All rights reserved. NetApp Proprietary
20
Figure 3-17:
21. On the Virtual Machine landing page, select the 7d “days” time filter for a better understanding of theVM’s workload characteristics.
21
Figure 3-18:
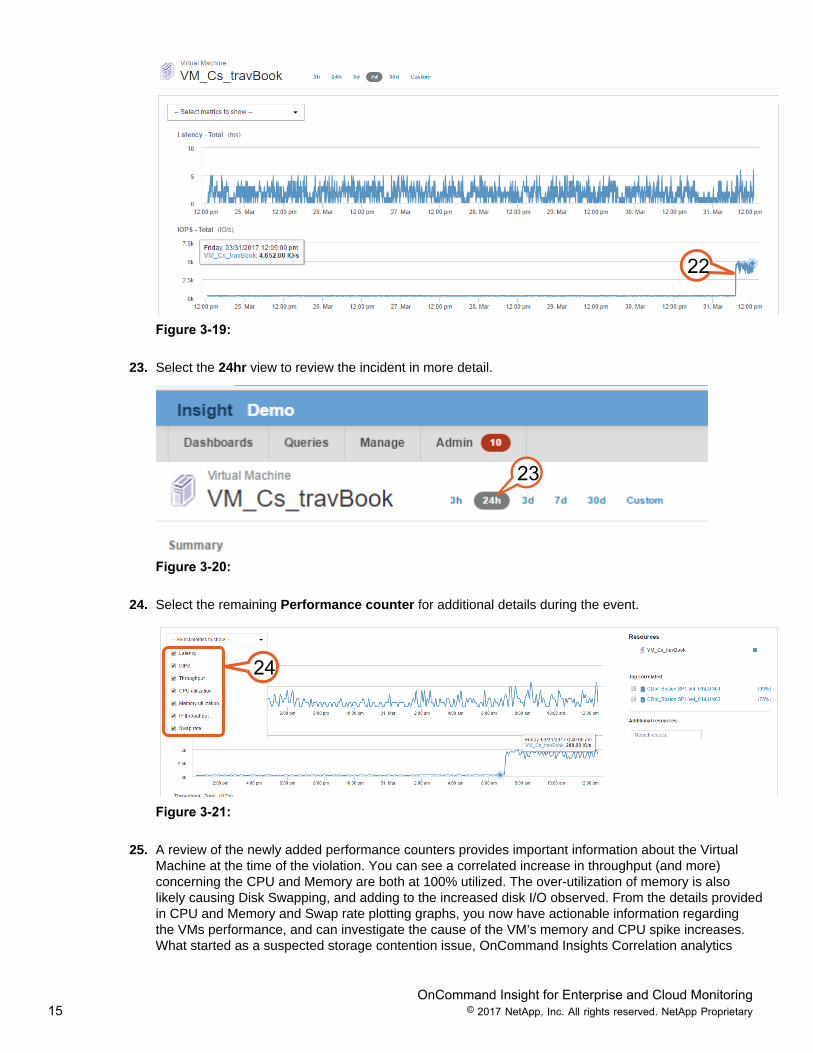
22. Reviewing the expert time line reveals only a single incident.
OnCommand Insight for Enterprise and Cloud Monitoring15 © 2017 NetApp, Inc. All rights reserved. NetApp Proprietary
22
Figure 3-19:
23. Select the 24hr view to review the incident in more detail.
23
Figure 3-20:
24. Select the remaining Performance counter for additional details during the event.
24
Figure 3-21:
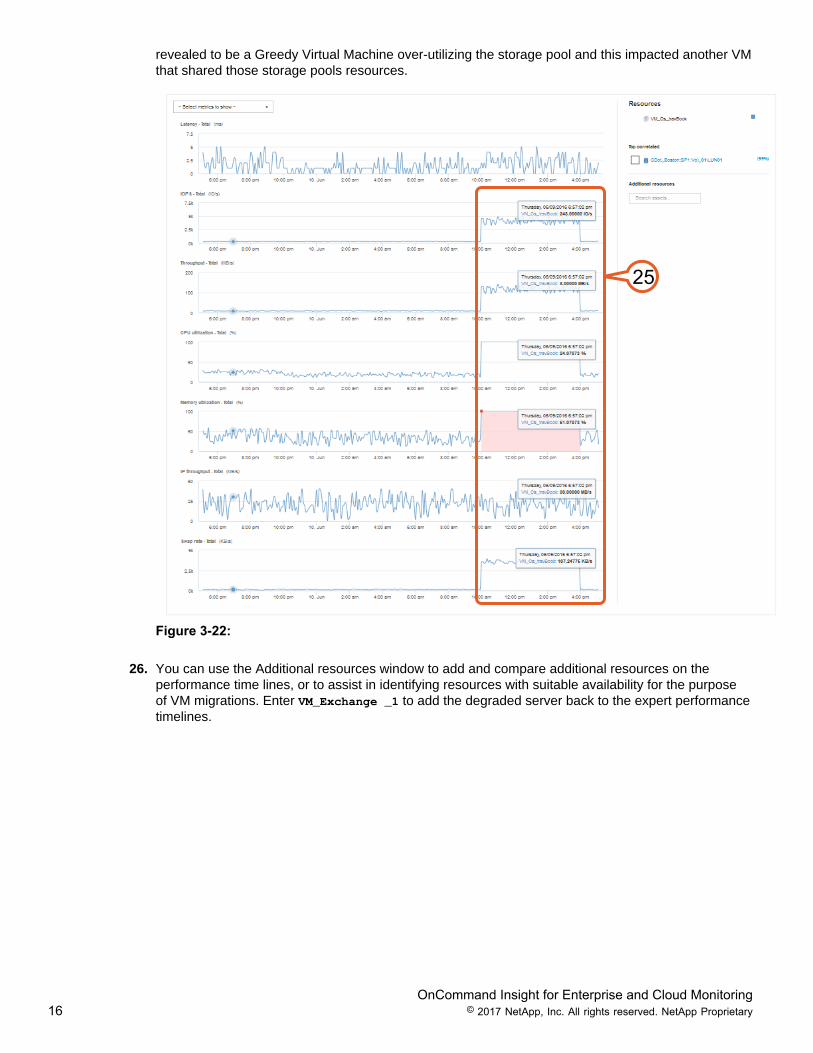
25. A review of the newly added performance counters provides important information about the VirtualMachine at the time of the violation. You can see a correlated increase in throughput (and more)concerning the CPU and Memory are both at 100% utilized. The over-utilization of memory is alsolikely causing Disk Swapping, and adding to the increased disk I/O observed. From the details providedin CPU and Memory and Swap rate plotting graphs, you now have actionable information regardingthe VMs performance, and can investigate the cause of the VM’s memory and CPU spike increases.What started as a suspected storage contention issue, OnCommand Insights Correlation analytics
OnCommand Insight for Enterprise and Cloud Monitoring16 © 2017 NetApp, Inc. All rights reserved. NetApp Proprietary
revealed to be a Greedy Virtual Machine over-utilizing the storage pool and this impacted another VMthat shared those storage pools resources.
25
Figure 3-22:
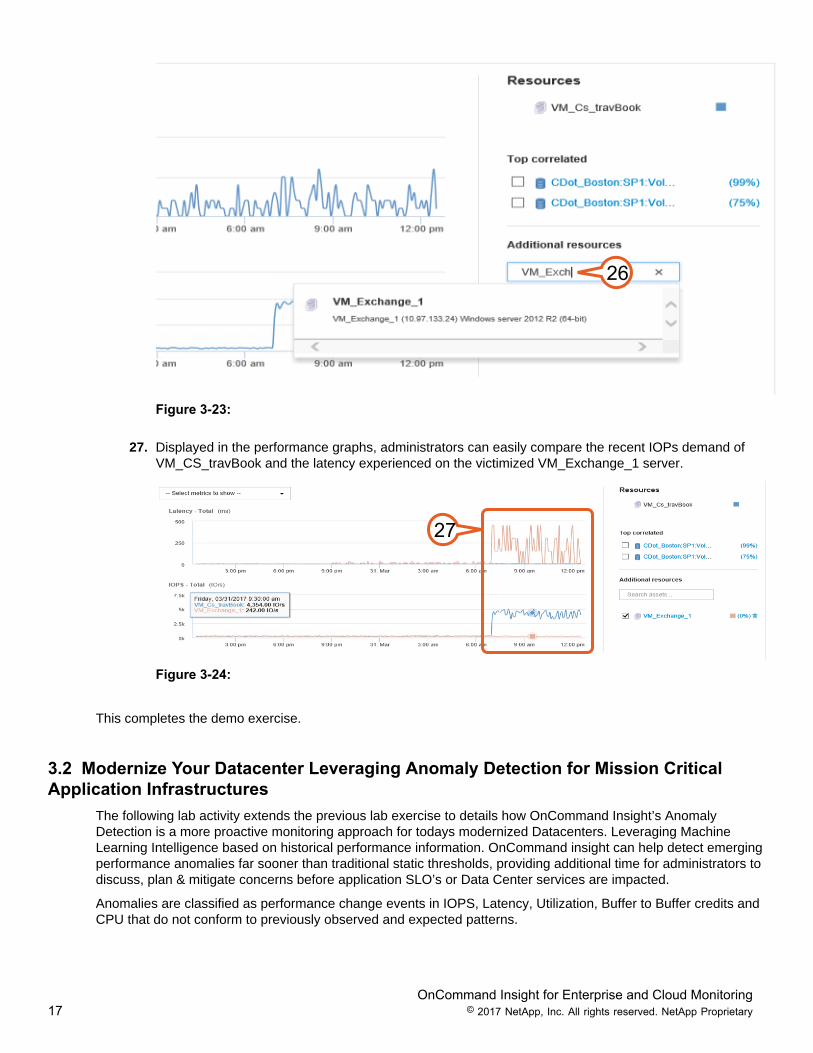
26. You can use the Additional resources window to add and compare additional resources on theperformance time lines, or to assist in identifying resources with suitable availability for the purposeof VM migrations. Enter VM_Exchange _1 to add the degraded server back to the expert performancetimelines.
OnCommand Insight for Enterprise and Cloud Monitoring17 © 2017 NetApp, Inc. All rights reserved. NetApp Proprietary
26
Figure 3-23:
27. Displayed in the performance graphs, administrators can easily compare the recent IOPs demand ofVM_CS_travBook and the latency experienced on the victimized VM_Exchange_1 server.
27
Figure 3-24:
This completes the demo exercise.
3.2 Modernize Your Datacenter Leveraging Anomaly Detection for Mission CriticalApplication Infrastructures
The following lab activity extends the previous lab exercise to details how OnCommand Insight’s AnomalyDetection is a more proactive monitoring approach for todays modernized Datacenters. Leveraging MachineLearning Intelligence based on historical performance information. OnCommand insight can help detect emergingperformance anomalies far sooner than traditional static thresholds, providing additional time for administrators todiscuss, plan & mitigate concerns before application SLO’s or Data Center services are impacted.
Anomalies are classified as performance change events in IOPS, Latency, Utilization, Buffer to Buffer credits andCPU that do not conform to previously observed and expected patterns.
OnCommand Insight for Enterprise and Cloud Monitoring18 © 2017 NetApp, Inc. All rights reserved. NetApp Proprietary
OnCommand Insights Anomaly detection feature can be enabled on up to 48 mission critical applicationinfrastructures within the monitored data center environment.
Note: It is important to understand that OnCommand Insight monitors the Infrastructure that supports theindividual applications, and not the application database configuration itself. Applications as referred toin this lab exercise, is OnCommand Insights ability to annotate objects such as virtual machines, hostswith an application name. OnCommand Insight then applies the application name to the logical andphysical constructs it dynamically maps for the Host/Vm and Lun infrastructure providing richer applicationawareness and business context to infrastructure administrators and business executives.
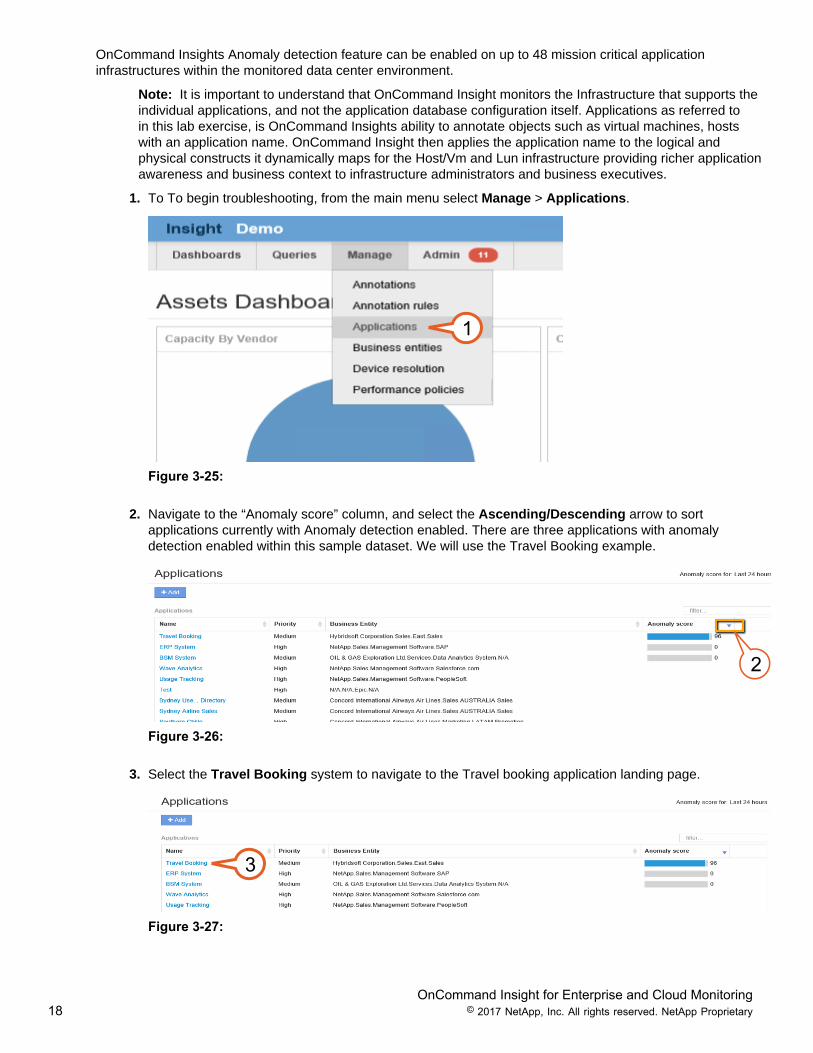
1. To To begin troubleshooting, from the main menu select Manage > Applications.
1
Figure 3-25:
2. Navigate to the “Anomaly score” column, and select the Ascending/Descending arrow to sortapplications currently with Anomaly detection enabled. There are three applications with anomalydetection enabled within this sample dataset. We will use the Travel Booking example.
2
Figure 3-26:
3. Select the Travel Booking system to navigate to the Travel booking application landing page.
3
Figure 3-27:
OnCommand Insight for Enterprise and Cloud Monitoring19 © 2017 NetApp, Inc. All rights reserved. NetApp Proprietary
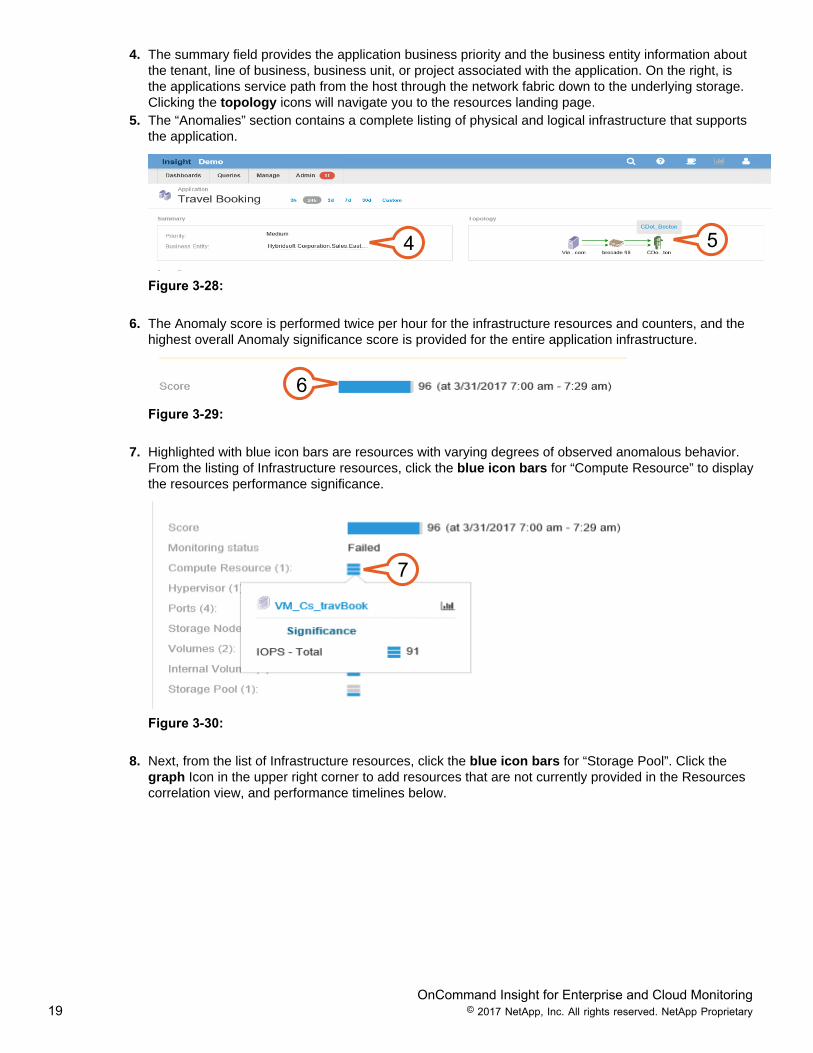
4. The summary field provides the application business priority and the business entity information aboutthe tenant, line of business, business unit, or project associated with the application. On the right, isthe applications service path from the host through the network fabric down to the underlying storage.Clicking the topology icons will navigate you to the resources landing page.
5. The “Anomalies” section contains a complete listing of physical and logical infrastructure that supportsthe application.
4 5
Figure 3-28:
6. The Anomaly score is performed twice per hour for the infrastructure resources and counters, and thehighest overall Anomaly significance score is provided for the entire application infrastructure.
6Figure 3-29:
7. Highlighted with blue icon bars are resources with varying degrees of observed anomalous behavior.From the listing of Infrastructure resources, click the blue icon bars for “Compute Resource” to displaythe resources performance significance.
7
Figure 3-30:
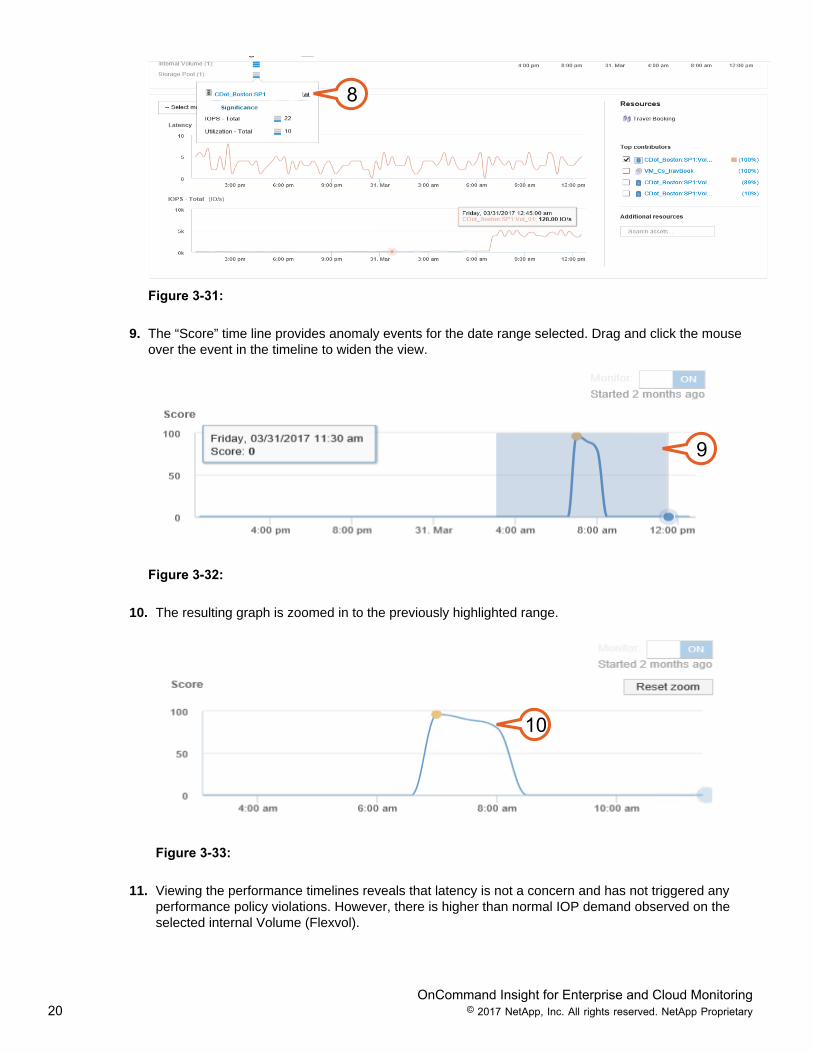
8. Next, from the list of Infrastructure resources, click the blue icon bars for “Storage Pool”. Click thegraph Icon in the upper right corner to add resources that are not currently provided in the Resourcescorrelation view, and performance timelines below.
OnCommand Insight for Enterprise and Cloud Monitoring20 © 2017 NetApp, Inc. All rights reserved. NetApp Proprietary
8
Figure 3-31:
9. The “Score” time line provides anomaly events for the date range selected. Drag and click the mouseover the event in the timeline to widen the view.
9
Figure 3-32:
10. The resulting graph is zoomed in to the previously highlighted range.
10
Figure 3-33:
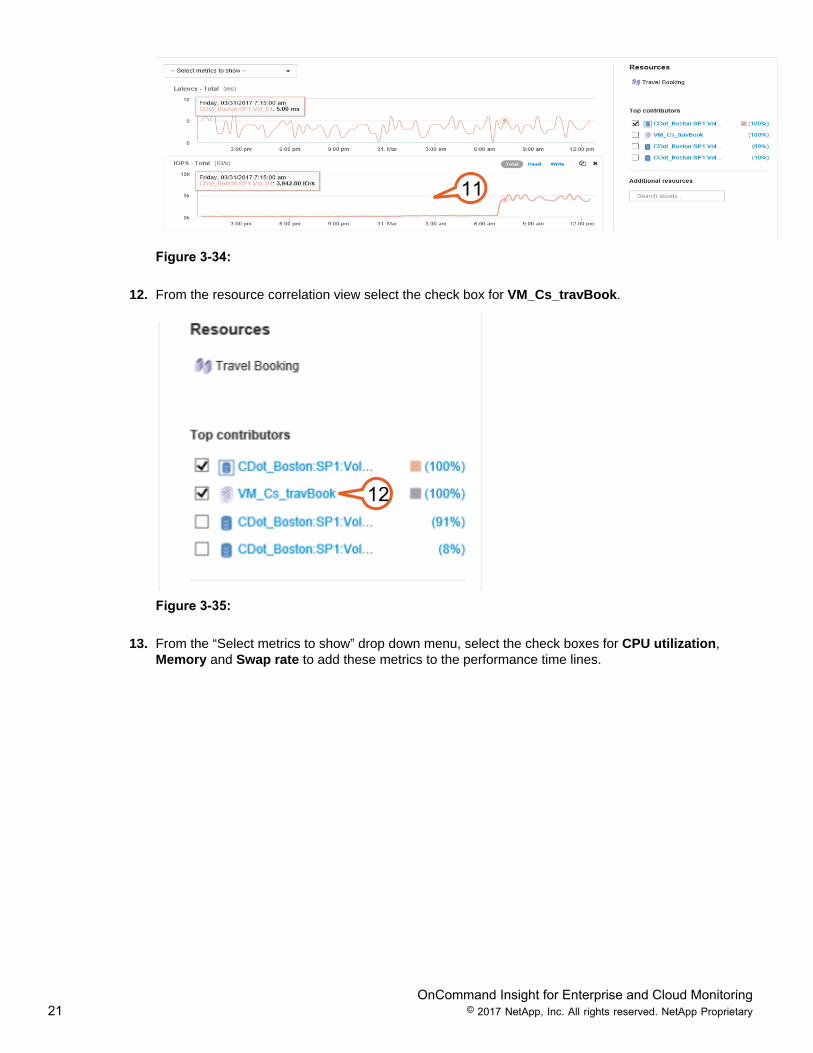
11. Viewing the performance timelines reveals that latency is not a concern and has not triggered anyperformance policy violations. However, there is higher than normal IOP demand observed on theselected internal Volume (Flexvol).
OnCommand Insight for Enterprise and Cloud Monitoring21 © 2017 NetApp, Inc. All rights reserved. NetApp Proprietary
11
Figure 3-34:
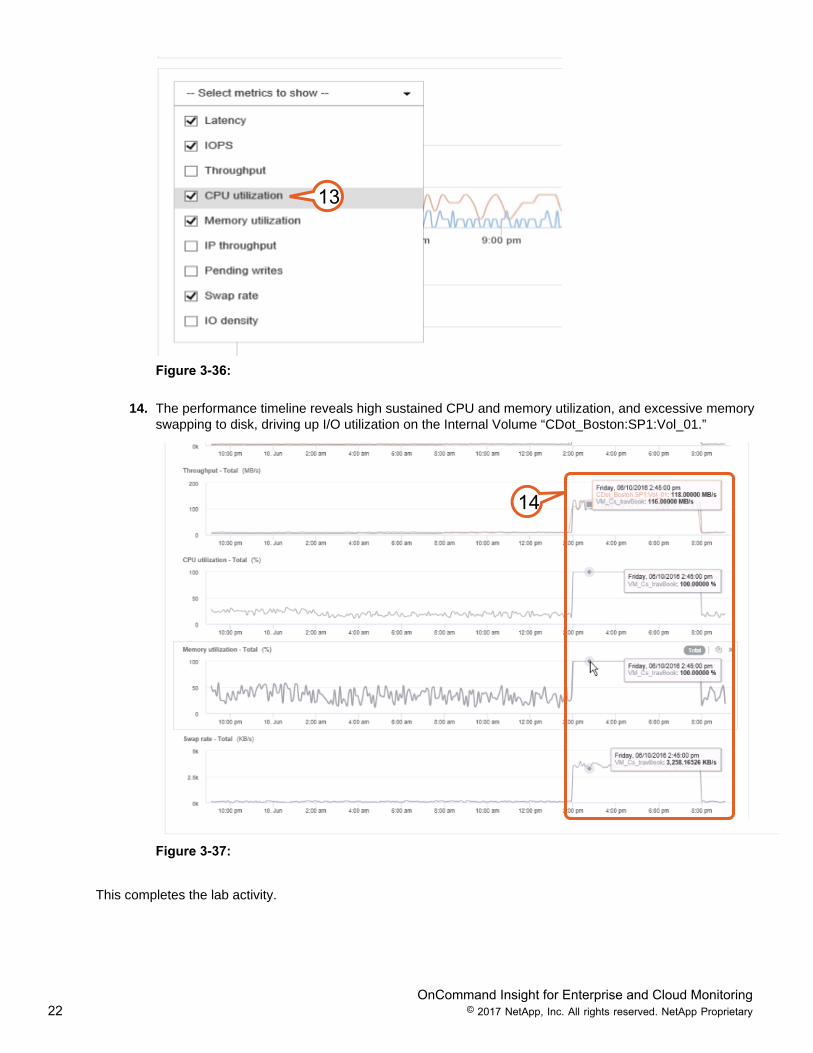
12. From the resource correlation view select the check box for VM_Cs_travBook.
12
Figure 3-35:
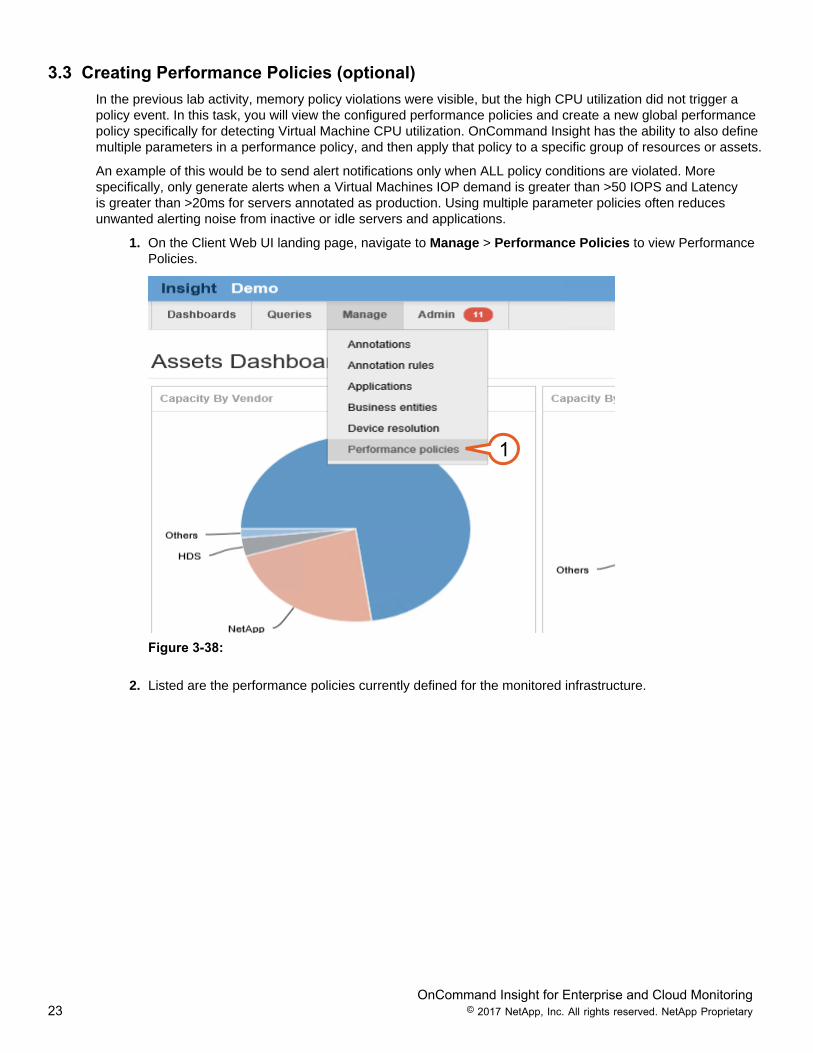
13. From the “Select metrics to show” drop down menu, select the check boxes for CPU utilization,Memory and Swap rate to add these metrics to the performance time lines.
OnCommand Insight for Enterprise and Cloud Monitoring22 © 2017 NetApp, Inc. All rights reserved. NetApp Proprietary
13
Figure 3-36:
14. The performance timeline reveals high sustained CPU and memory utilization, and excessive memoryswapping to disk, driving up I/O utilization on the Internal Volume “CDot_Boston:SP1:Vol_01.”
14
Figure 3-37:
This completes the lab activity.
OnCommand Insight for Enterprise and Cloud Monitoring23 © 2017 NetApp, Inc. All rights reserved. NetApp Proprietary
3.3 Creating Performance Policies (optional)In the previous lab activity, memory policy violations were visible, but the high CPU utilization did not trigger apolicy event. In this task, you will view the configured performance policies and create a new global performancepolicy specifically for detecting Virtual Machine CPU utilization. OnCommand Insight has the ability to also definemultiple parameters in a performance policy, and then apply that policy to a specific group of resources or assets.
An example of this would be to send alert notifications only when ALL policy conditions are violated. Morespecifically, only generate alerts when a Virtual Machines IOP demand is greater than >50 IOPS and Latencyis greater than >20ms for servers annotated as production. Using multiple parameter policies often reducesunwanted alerting noise from inactive or idle servers and applications.
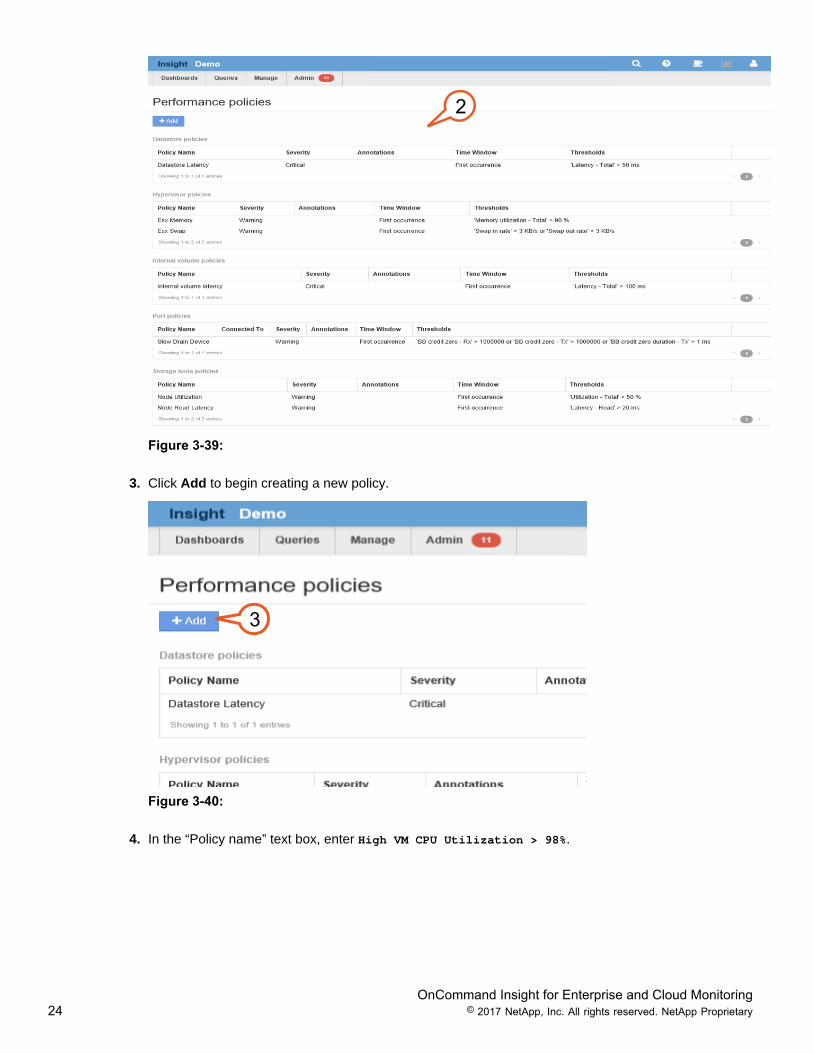
1. On the Client Web UI landing page, navigate to Manage > Performance Policies to view PerformancePolicies.
1
Figure 3-38:
2. Listed are the performance policies currently defined for the monitored infrastructure.
OnCommand Insight for Enterprise and Cloud Monitoring24 © 2017 NetApp, Inc. All rights reserved. NetApp Proprietary
2
Figure 3-39:
3. Click Add to begin creating a new policy.
3
Figure 3-40:
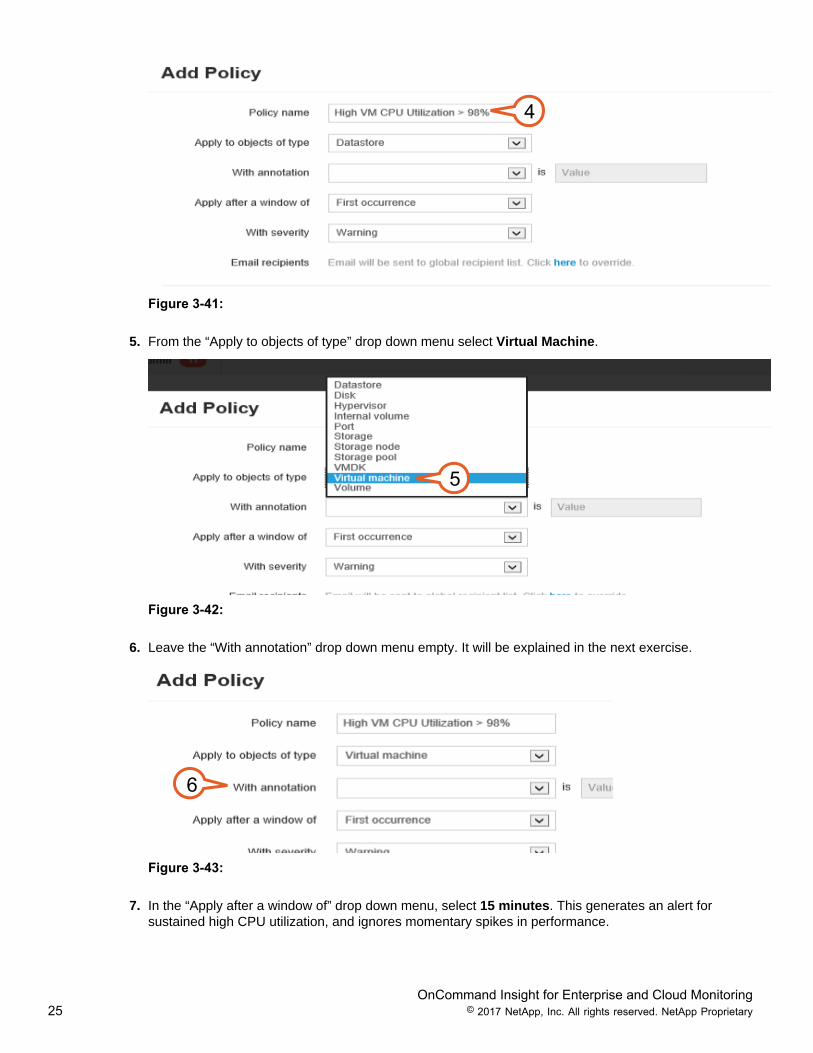
4. In the “Policy name” text box, enter High VM CPU Utilization > 98%.
OnCommand Insight for Enterprise and Cloud Monitoring25 © 2017 NetApp, Inc. All rights reserved. NetApp Proprietary
4
Figure 3-41:
5. From the “Apply to objects of type” drop down menu select Virtual Machine.
5
Figure 3-42:
6. Leave the “With annotation” drop down menu empty. It will be explained in the next exercise.
6
Figure 3-43:
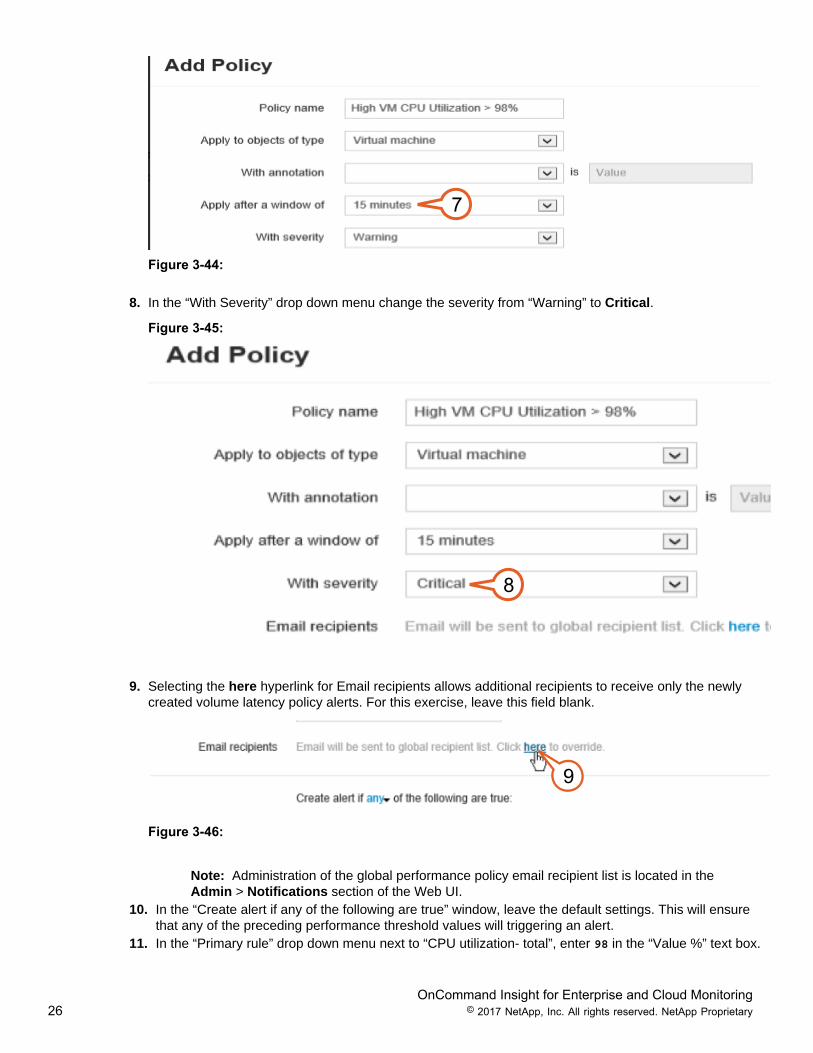
7. In the “Apply after a window of” drop down menu, select 15 minutes. This generates an alert forsustained high CPU utilization, and ignores momentary spikes in performance.
OnCommand Insight for Enterprise and Cloud Monitoring26 © 2017 NetApp, Inc. All rights reserved. NetApp Proprietary
7
Figure 3-44:
8. In the “With Severity” drop down menu change the severity from “Warning” to Critical.
Figure 3-45:
8
9. Selecting the here hyperlink for Email recipients allows additional recipients to receive only the newlycreated volume latency policy alerts. For this exercise, leave this field blank.
9
Figure 3-46:
Note: Administration of the global performance policy email recipient list is located in theAdmin > Notifications section of the Web UI.
10. In the “Create alert if any of the following are true” window, leave the default settings. This will ensurethat any of the preceding performance threshold values will triggering an alert.
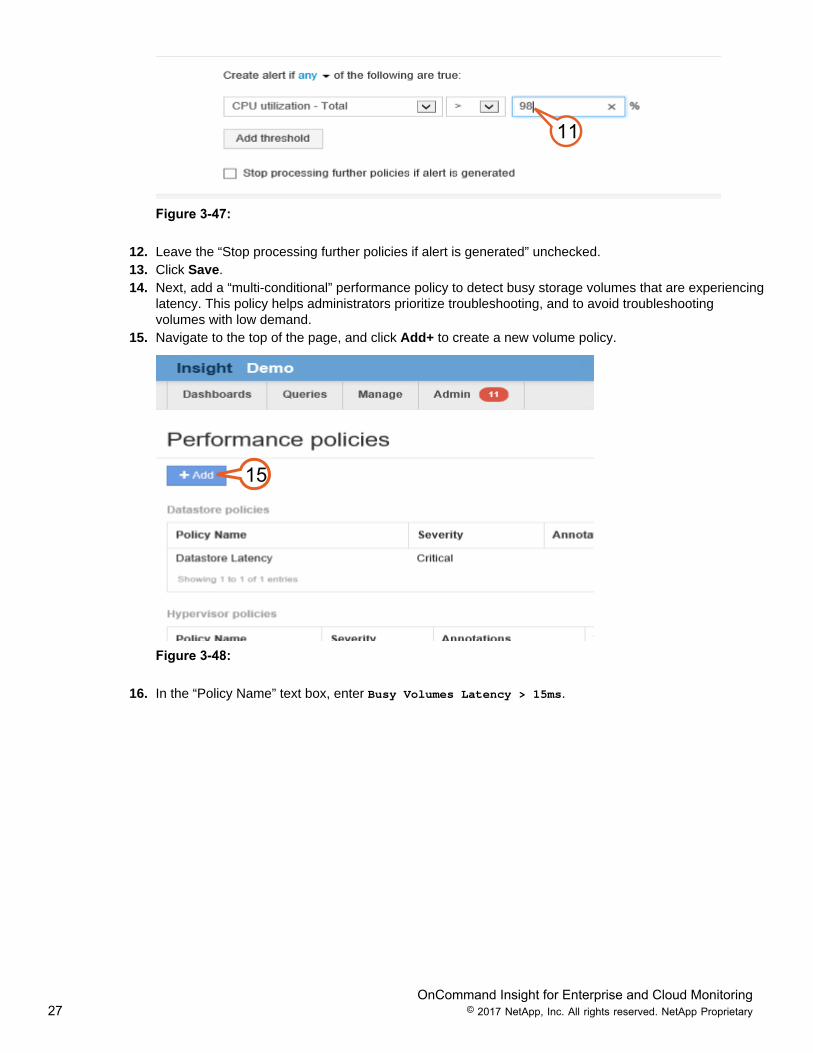
11. In the “Primary rule” drop down menu next to “CPU utilization- total”, enter 98 in the “Value %” text box.
OnCommand Insight for Enterprise and Cloud Monitoring27 © 2017 NetApp, Inc. All rights reserved. NetApp Proprietary
11
Figure 3-47:
12. Leave the “Stop processing further policies if alert is generated” unchecked.13. Click Save.14. Next, add a “multi-conditional” performance policy to detect busy storage volumes that are experiencing
latency. This policy helps administrators prioritize troubleshooting, and to avoid troubleshootingvolumes with low demand.
15. Navigate to the top of the page, and click Add+ to create a new volume policy.
15
Figure 3-48:
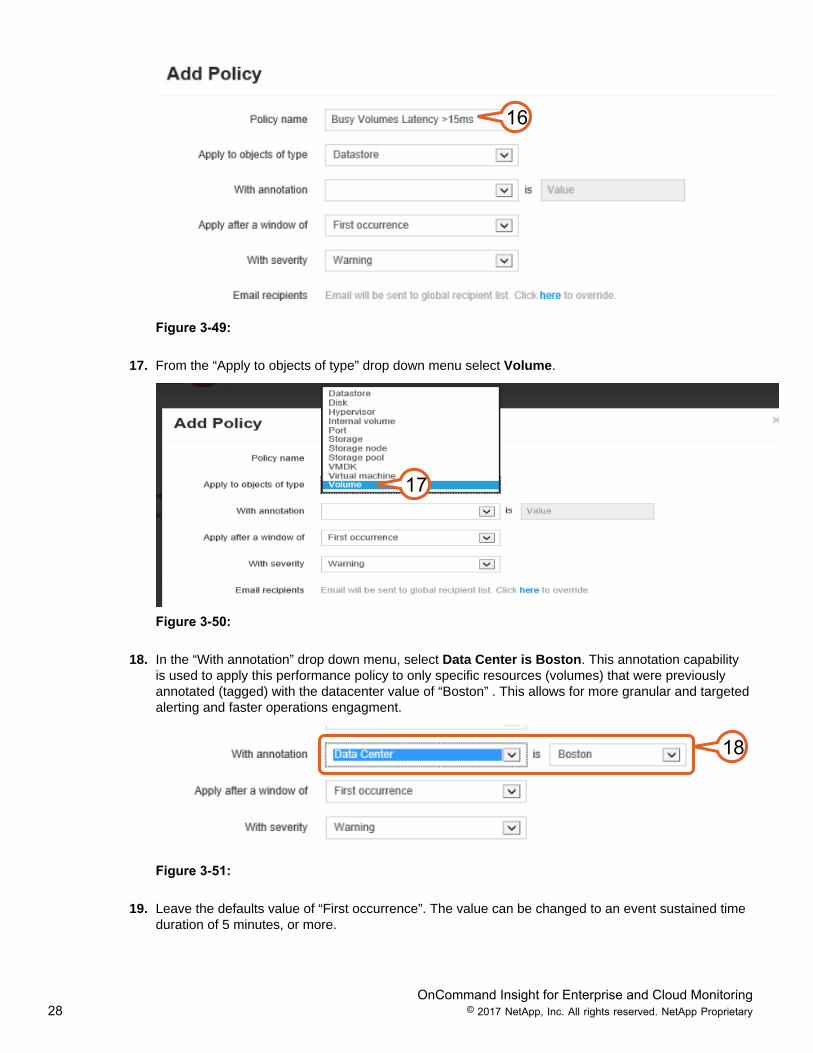
16. In the “Policy Name” text box, enter Busy Volumes Latency > 15ms.
OnCommand Insight for Enterprise and Cloud Monitoring28 © 2017 NetApp, Inc. All rights reserved. NetApp Proprietary
16
Figure 3-49:
17. From the “Apply to objects of type” drop down menu select Volume.
17
Figure 3-50:
18. In the “With annotation” drop down menu, select Data Center is Boston. This annotation capabilityis used to apply this performance policy to only specific resources (volumes) that were previouslyannotated (tagged) with the datacenter value of “Boston” . This allows for more granular and targetedalerting and faster operations engagment.
18
Figure 3-51:
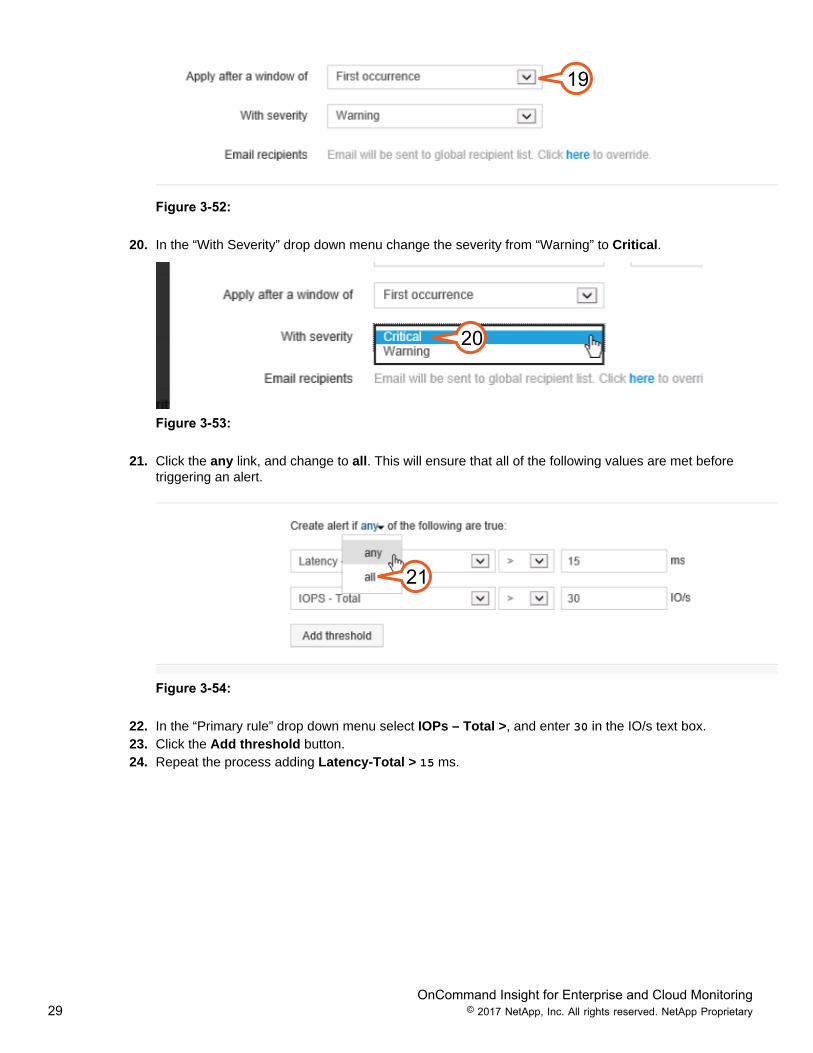
19. Leave the defaults value of “First occurrence”. The value can be changed to an event sustained timeduration of 5 minutes, or more.
OnCommand Insight for Enterprise and Cloud Monitoring29 © 2017 NetApp, Inc. All rights reserved. NetApp Proprietary
19
Figure 3-52:
20. In the “With Severity” drop down menu change the severity from “Warning” to Critical.
20
Figure 3-53:
21. Click the any link, and change to all. This will ensure that all of the following values are met beforetriggering an alert.
21
Figure 3-54:
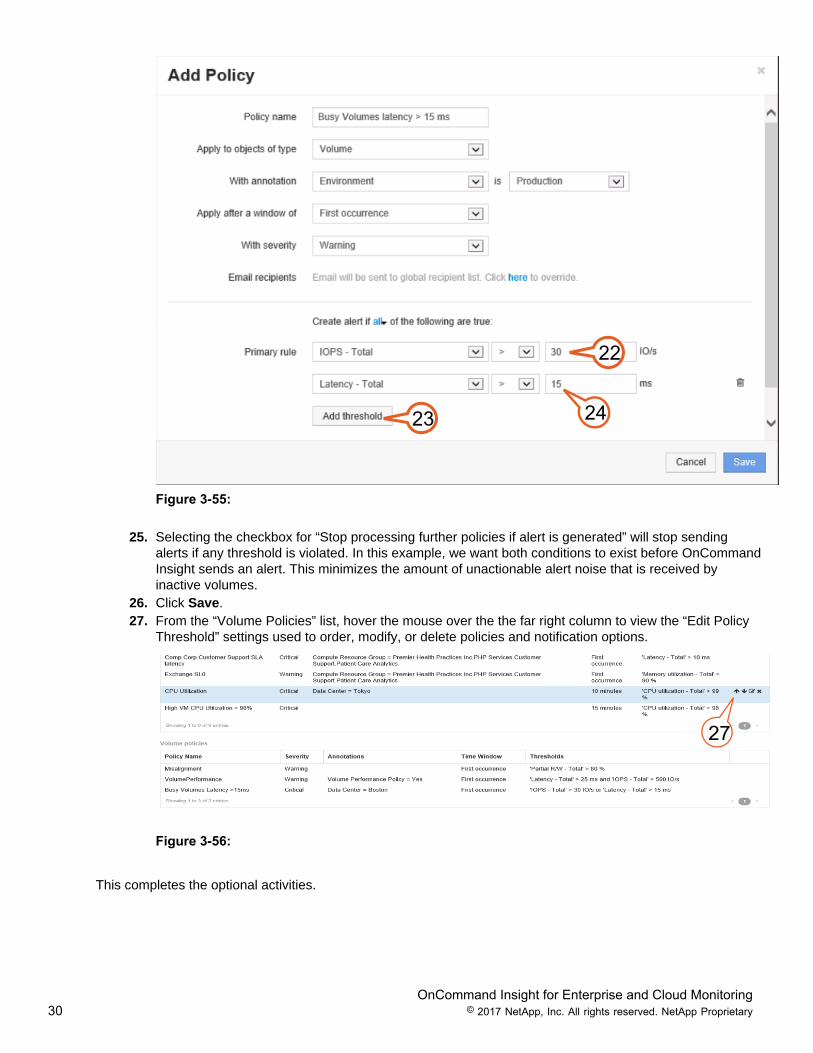
22. In the “Primary rule” drop down menu select IOPs – Total >, and enter 30 in the IO/s text box.23. Click the Add threshold button.24. Repeat the process adding Latency-Total > 15 ms.
OnCommand Insight for Enterprise and Cloud Monitoring30 © 2017 NetApp, Inc. All rights reserved. NetApp Proprietary
22
23 24
Figure 3-55:
25. Selecting the checkbox for “Stop processing further policies if alert is generated” will stop sendingalerts if any threshold is violated. In this example, we want both conditions to exist before OnCommandInsight sends an alert. This minimizes the amount of unactionable alert noise that is received byinactive volumes.
26. Click Save.27. From the “Volume Policies” list, hover the mouse over the the far right column to view the “Edit Policy
Threshold” settings used to order, modify, or delete policies and notification options.
27
Figure 3-56:
This completes the optional activities.
OnCommand Insight for Enterprise and Cloud Monitoring31 © 2017 NetApp, Inc. All rights reserved. NetApp Proprietary
3.4 Understanding the Impact of Buffer to Buffer (B/B) Credit Zero Errors in FibreChannel Environments
Buffer to Buffer (B/B) Credit Zero errors come from the inability of a port, be it a host facing switch port, astorage facing switch port, or a switch facing switch port (ISL), to receive the next packet. Essentially it is a ticketexchange from the FC SW port that says, “Device XX, you now can send me more data”.
If the Fibre Channel port runs out of available credits, then the requestor (host, switch, or array) gets an error thatstates, “I’m out of tickets, you can’t send data at this time”. This condition happens on a regular basis, and theSAN handles these errors in stride, though it does have the potential for slowing down traffic (increased latency)when the error count becomes excessive.
Note: Throughout the rest of this section you will navigate the web UI for OnCommand Insight.Remember to explore features outlined in the Introduction > Tips section of this lab guide.
This exercise begins by navigating to the Violations Dashboard, and revealing a buffer to buffer credit zeropolicy violation on a fabric port. Then troubleshoot the impact of buffer to buffer credits zeros, and the latencyimpact to assets that share those port resources.
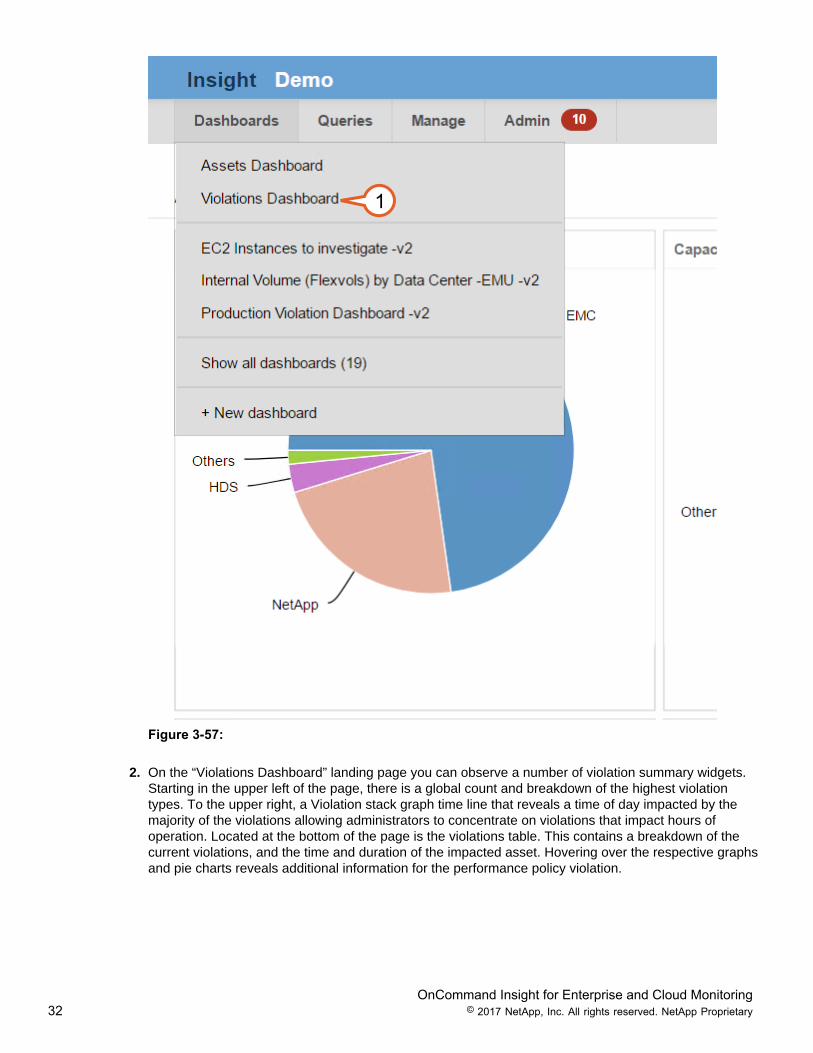
1. To begin troubleshooting, navigate to and select the Violation Dashboard located in the WebUI landingpage.
OnCommand Insight for Enterprise and Cloud Monitoring32 © 2017 NetApp, Inc. All rights reserved. NetApp Proprietary
1
Figure 3-57:
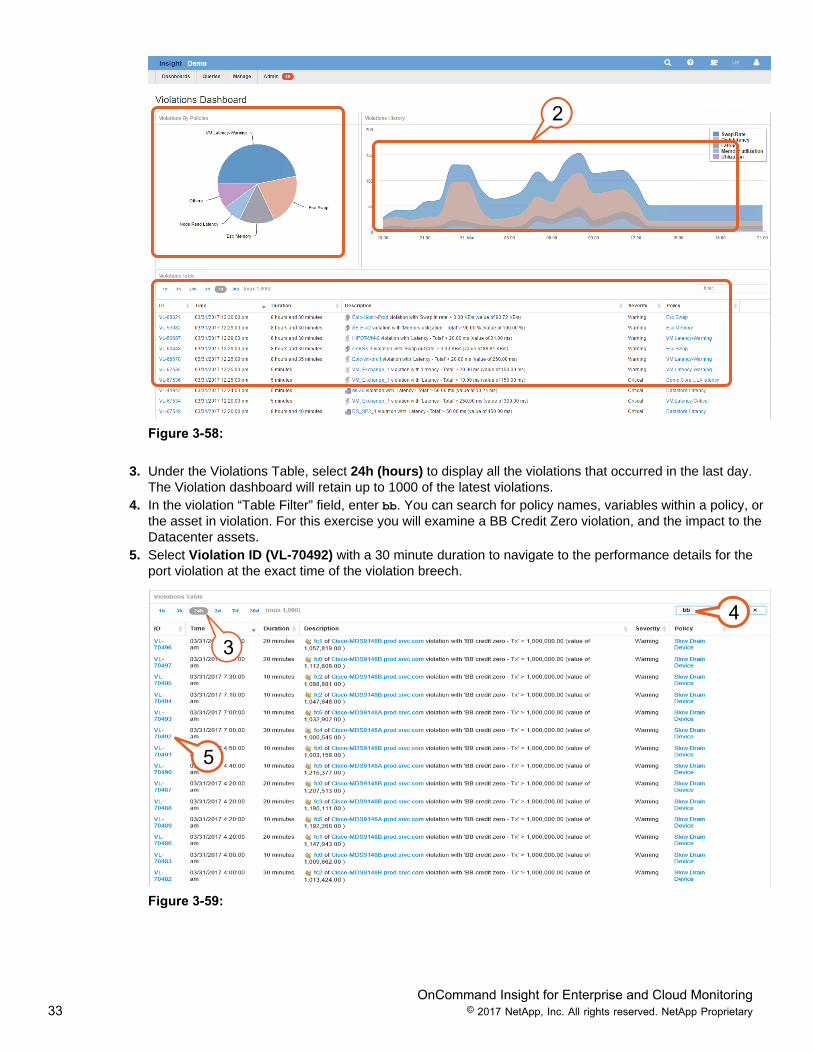
2. On the “Violations Dashboard” landing page you can observe a number of violation summary widgets.Starting in the upper left of the page, there is a global count and breakdown of the highest violationtypes. To the upper right, a Violation stack graph time line that reveals a time of day impacted by themajority of the violations allowing administrators to concentrate on violations that impact hours ofoperation. Located at the bottom of the page is the violations table. This contains a breakdown of thecurrent violations, and the time and duration of the impacted asset. Hovering over the respective graphsand pie charts reveals additional information for the performance policy violation.
OnCommand Insight for Enterprise and Cloud Monitoring33 © 2017 NetApp, Inc. All rights reserved. NetApp Proprietary
2
Figure 3-58:
3. Under the Violations Table, select 24h (hours) to display all the violations that occurred in the last day.The Violation dashboard will retain up to 1000 of the latest violations.
4. In the violation “Table Filter” field, enter bb. You can search for policy names, variables within a policy, orthe asset in violation. For this exercise you will examine a BB Credit Zero violation, and the impact to theDatacenter assets.
5. Select Violation ID (VL-70492) with a 30 minute duration to navigate to the performance details for theport violation at the exact time of the violation breech.
3
4
5
Figure 3-59:
OnCommand Insight for Enterprise and Cloud Monitoring34 © 2017 NetApp, Inc. All rights reserved. NetApp Proprietary
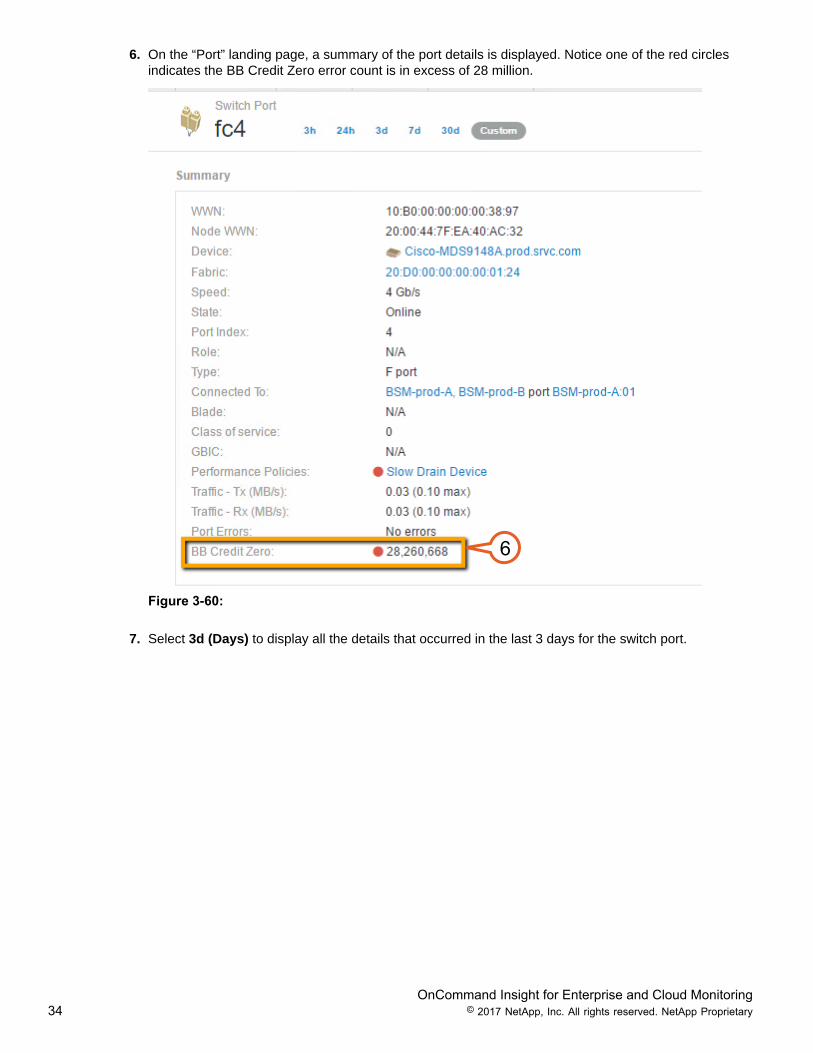
6. On the “Port” landing page, a summary of the port details is displayed. Notice one of the red circlesindicates the BB Credit Zero error count is in excess of 28 million.
6
Figure 3-60:
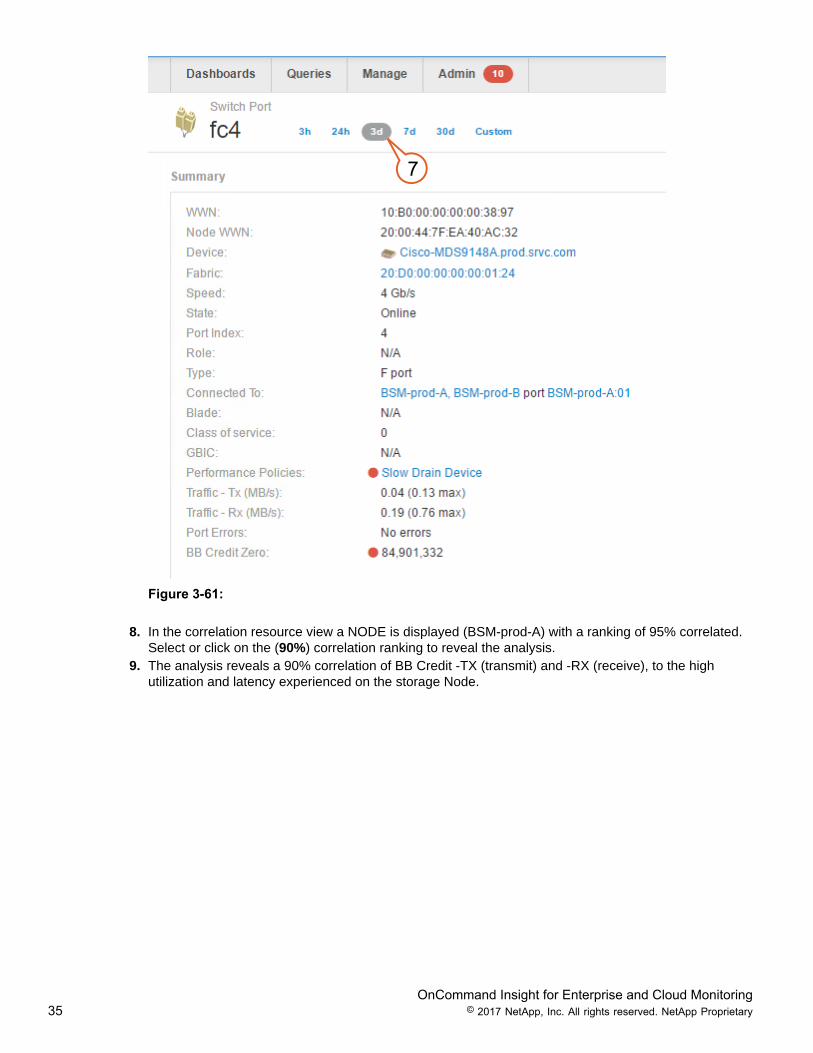
7. Select 3d (Days) to display all the details that occurred in the last 3 days for the switch port.
OnCommand Insight for Enterprise and Cloud Monitoring35 © 2017 NetApp, Inc. All rights reserved. NetApp Proprietary
7
Figure 3-61:
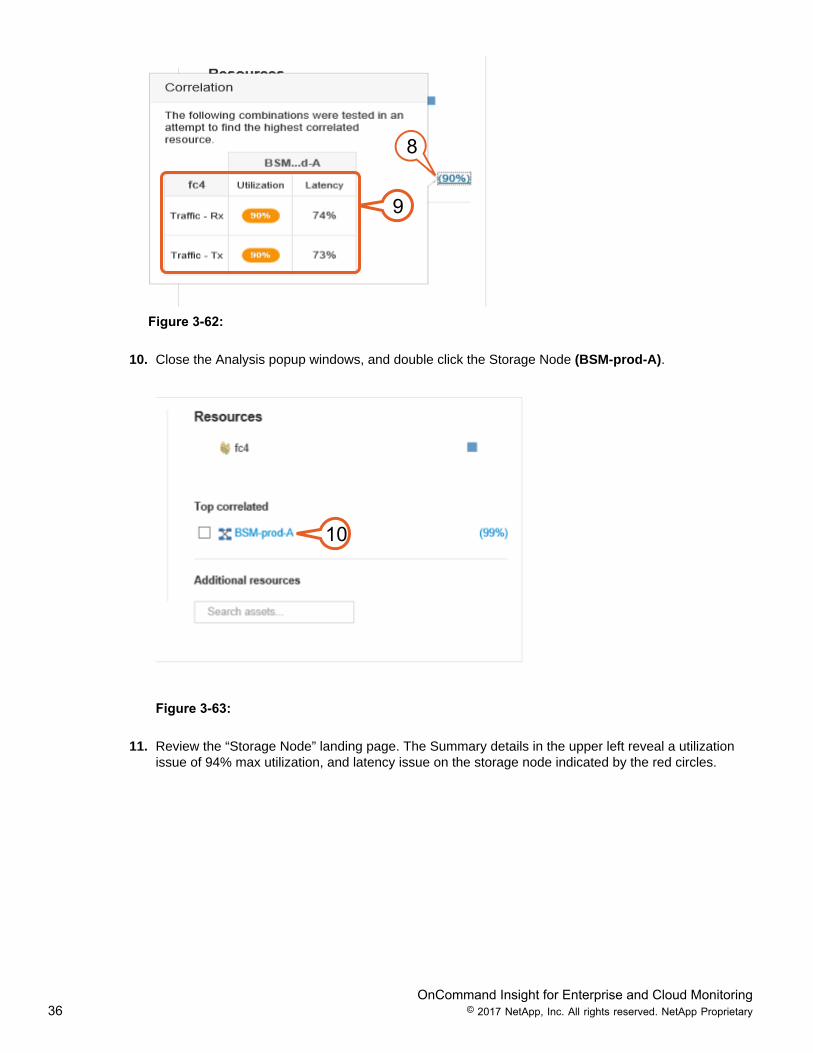
8. In the correlation resource view a NODE is displayed (BSM-prod-A) with a ranking of 95% correlated.Select or click on the (90%) correlation ranking to reveal the analysis.
9. The analysis reveals a 90% correlation of BB Credit -TX (transmit) and -RX (receive), to the highutilization and latency experienced on the storage Node.
OnCommand Insight for Enterprise and Cloud Monitoring36 © 2017 NetApp, Inc. All rights reserved. NetApp Proprietary
8
9
Figure 3-62:
10. Close the Analysis popup windows, and double click the Storage Node (BSM-prod-A).
10
Figure 3-63:
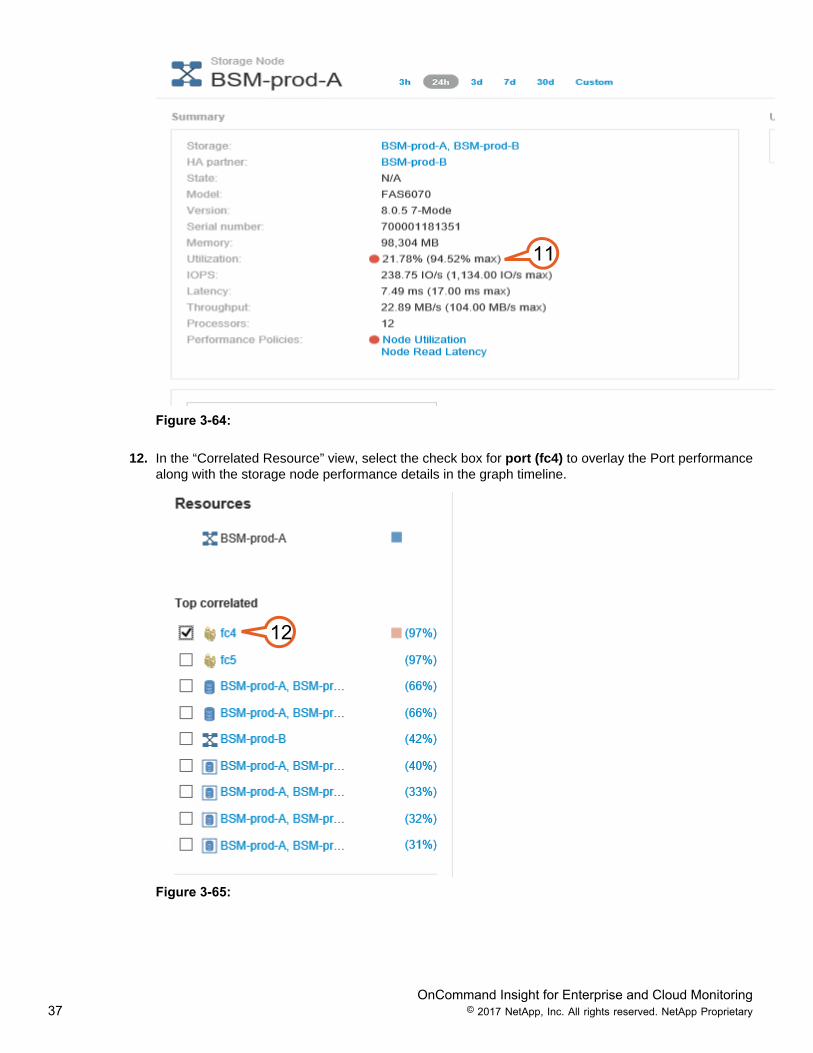
11. Review the “Storage Node” landing page. The Summary details in the upper left reveal a utilizationissue of 94% max utilization, and latency issue on the storage node indicated by the red circles.
OnCommand Insight for Enterprise and Cloud Monitoring37 © 2017 NetApp, Inc. All rights reserved. NetApp Proprietary
11
Figure 3-64:
12. In the “Correlated Resource” view, select the check box for port (fc4) to overlay the Port performancealong with the storage node performance details in the graph timeline.
12
Figure 3-65:
OnCommand Insight for Enterprise and Cloud Monitoring38 © 2017 NetApp, Inc. All rights reserved. NetApp Proprietary
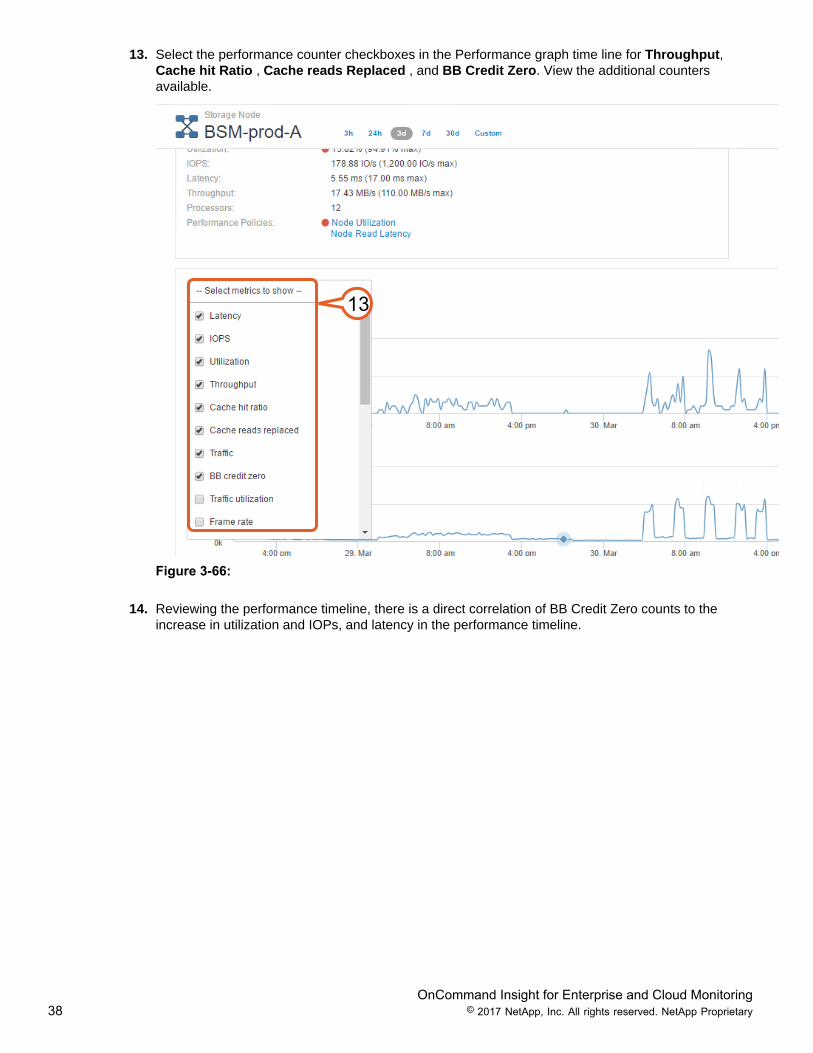
13. Select the performance counter checkboxes in the Performance graph time line for Throughput,Cache hit Ratio , Cache reads Replaced , and BB Credit Zero. View the additional countersavailable.
13
Figure 3-66:
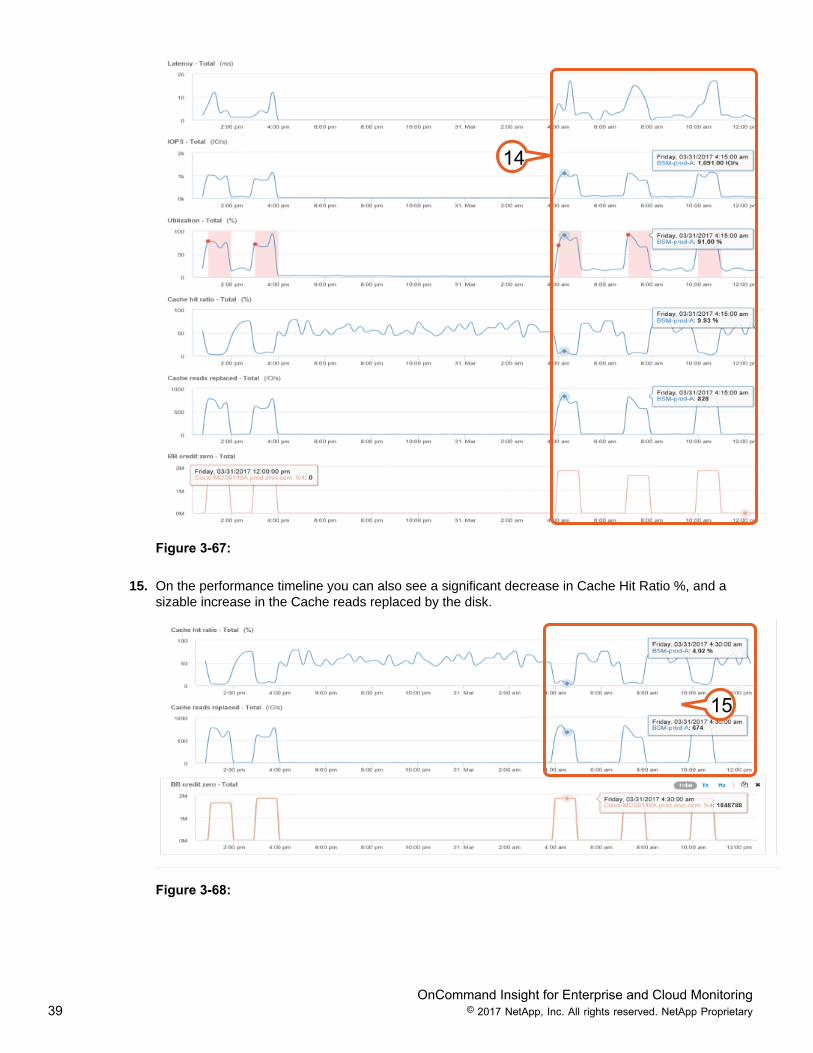
14. Reviewing the performance timeline, there is a direct correlation of BB Credit Zero counts to theincrease in utilization and IOPs, and latency in the performance timeline.
OnCommand Insight for Enterprise and Cloud Monitoring39 © 2017 NetApp, Inc. All rights reserved. NetApp Proprietary
14
Figure 3-67:
15. On the performance timeline you can also see a significant decrease in Cache Hit Ratio %, and asizable increase in the Cache reads replaced by the disk.
15
Figure 3-68:
OnCommand Insight for Enterprise and Cloud Monitoring40 © 2017 NetApp, Inc. All rights reserved. NetApp Proprietary
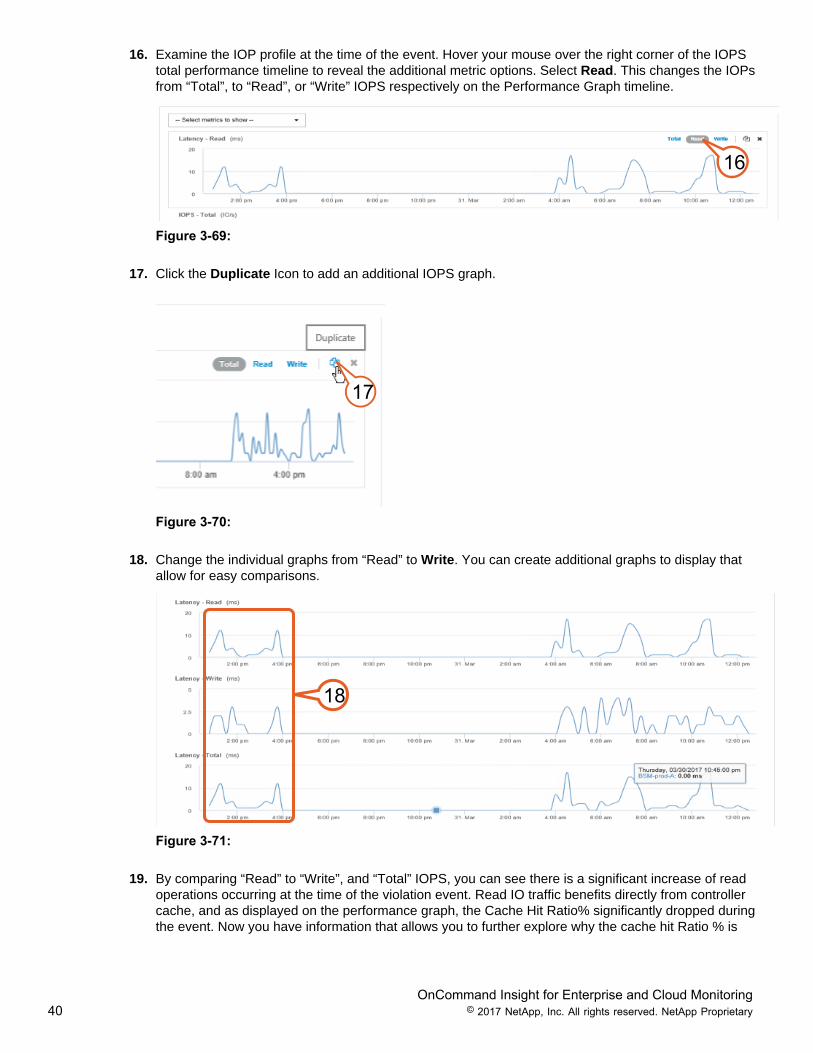
16. Examine the IOP profile at the time of the event. Hover your mouse over the right corner of the IOPStotal performance timeline to reveal the additional metric options. Select Read. This changes the IOPsfrom “Total”, to “Read”, or “Write” IOPS respectively on the Performance Graph timeline.
16
Figure 3-69:
17. Click the Duplicate Icon to add an additional IOPS graph.
17
Figure 3-70:
18. Change the individual graphs from “Read” to Write. You can create additional graphs to display thatallow for easy comparisons.
18
Figure 3-71:
19. By comparing “Read” to “Write”, and “Total” IOPS, you can see there is a significant increase of readoperations occurring at the time of the violation event. Read IO traffic benefits directly from controllercache, and as displayed on the performance graph, the Cache Hit Ratio% significantly dropped duringthe event. Now you have information that allows you to further explore why the cache hit Ratio % is
OnCommand Insight for Enterprise and Cloud Monitoring41 © 2017 NetApp, Inc. All rights reserved. NetApp Proprietary
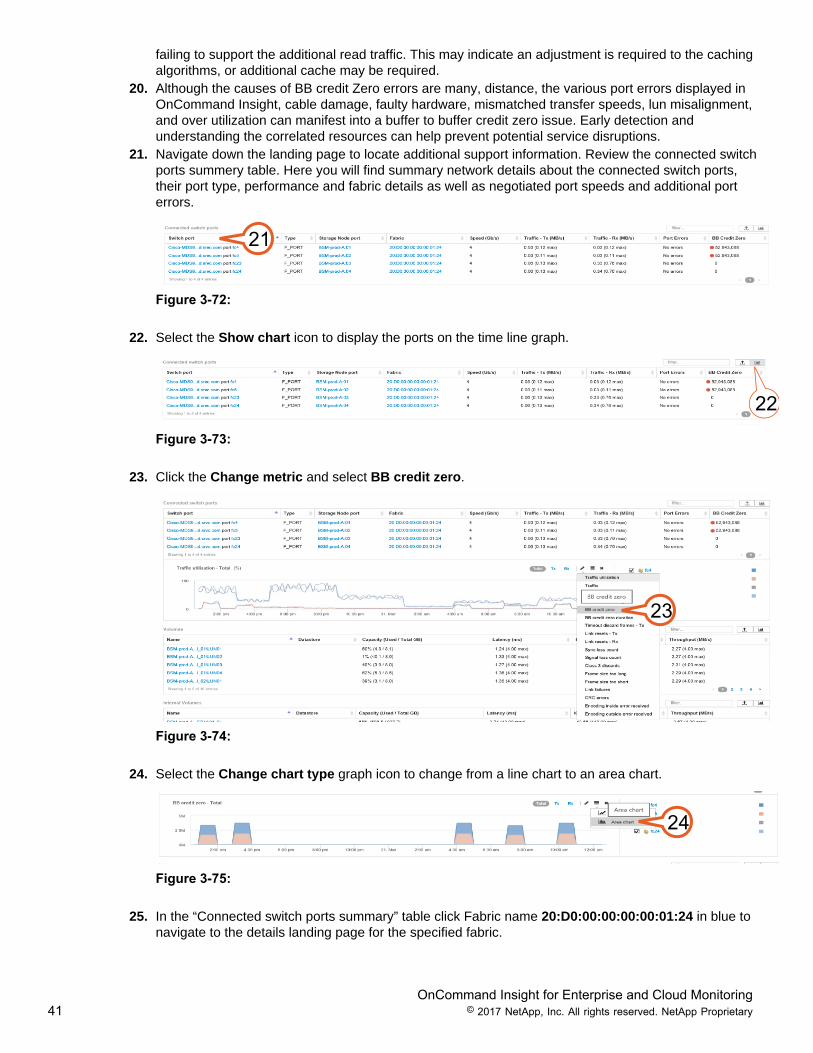
failing to support the additional read traffic. This may indicate an adjustment is required to the cachingalgorithms, or additional cache may be required.
20. Although the causes of BB credit Zero errors are many, distance, the various port errors displayed inOnCommand Insight, cable damage, faulty hardware, mismatched transfer speeds, lun misalignment,and over utilization can manifest into a buffer to buffer credit zero issue. Early detection andunderstanding the correlated resources can help prevent potential service disruptions.
21. Navigate down the landing page to locate additional support information. Review the connected switchports summery table. Here you will find summary network details about the connected switch ports,their port type, performance and fabric details as well as negotiated port speeds and additional porterrors.
21
Figure 3-72:
22. Select the Show chart icon to display the ports on the time line graph.
22Figure 3-73:
23. Click the Change metric and select BB credit zero.
23
Figure 3-74:
24. Select the Change chart type graph icon to change from a line chart to an area chart.
24
Figure 3-75:
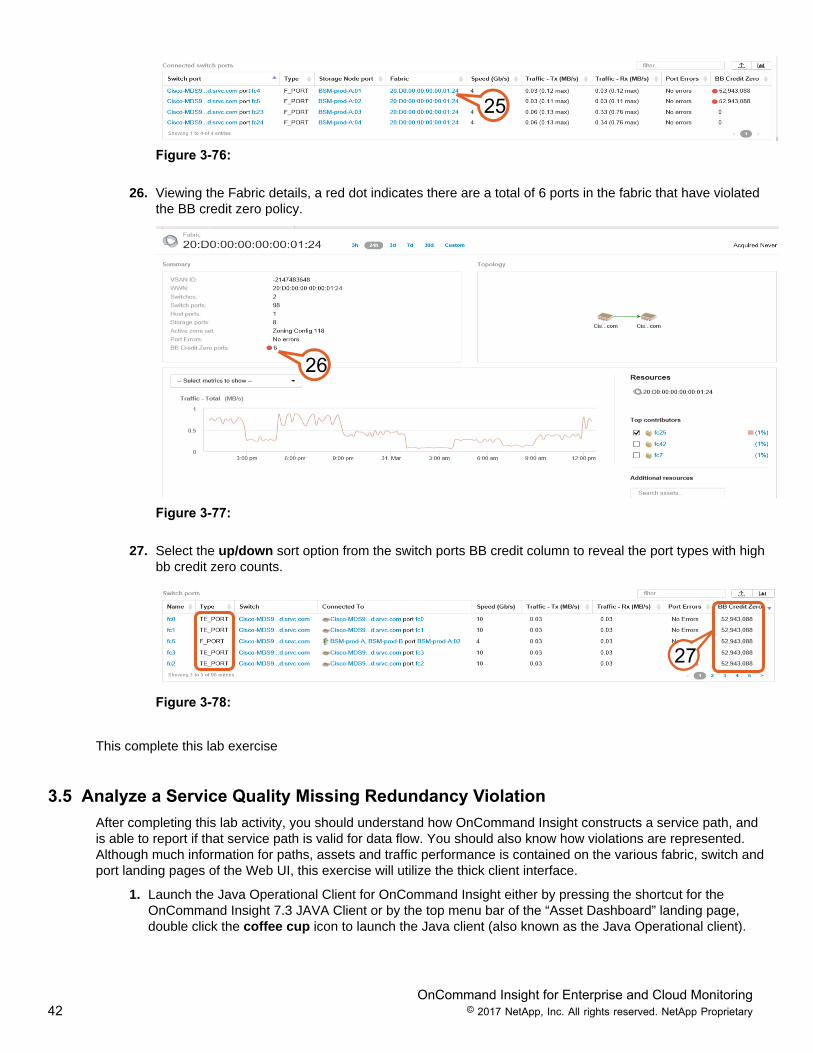
25. In the “Connected switch ports summary” table click Fabric name 20:D0:00:00:00:00:01:24 in blue tonavigate to the details landing page for the specified fabric.
OnCommand Insight for Enterprise and Cloud Monitoring42 © 2017 NetApp, Inc. All rights reserved. NetApp Proprietary
25
Figure 3-76:
26. Viewing the Fabric details, a red dot indicates there are a total of 6 ports in the fabric that have violatedthe BB credit zero policy.
26
Figure 3-77:
27. Select the up/down sort option from the switch ports BB credit column to reveal the port types with highbb credit zero counts.
27
Figure 3-78:
This complete this lab exercise
3.5 Analyze a Service Quality Missing Redundancy ViolationAfter completing this lab activity, you should understand how OnCommand Insight constructs a service path, andis able to report if that service path is valid for data flow. You should also know how violations are represented.Although much information for paths, assets and traffic performance is contained on the various fabric, switch andport landing pages of the Web UI, this exercise will utilize the thick client interface.
1. Launch the Java Operational Client for OnCommand Insight either by pressing the shortcut for theOnCommand Insight 7.3 JAVA Client or by the top menu bar of the “Asset Dashboard” landing page,double click the coffee cup icon to launch the Java client (also known as the Java Operational client).
OnCommand Insight for Enterprise and Cloud Monitoring43 © 2017 NetApp, Inc. All rights reserved. NetApp Proprietary
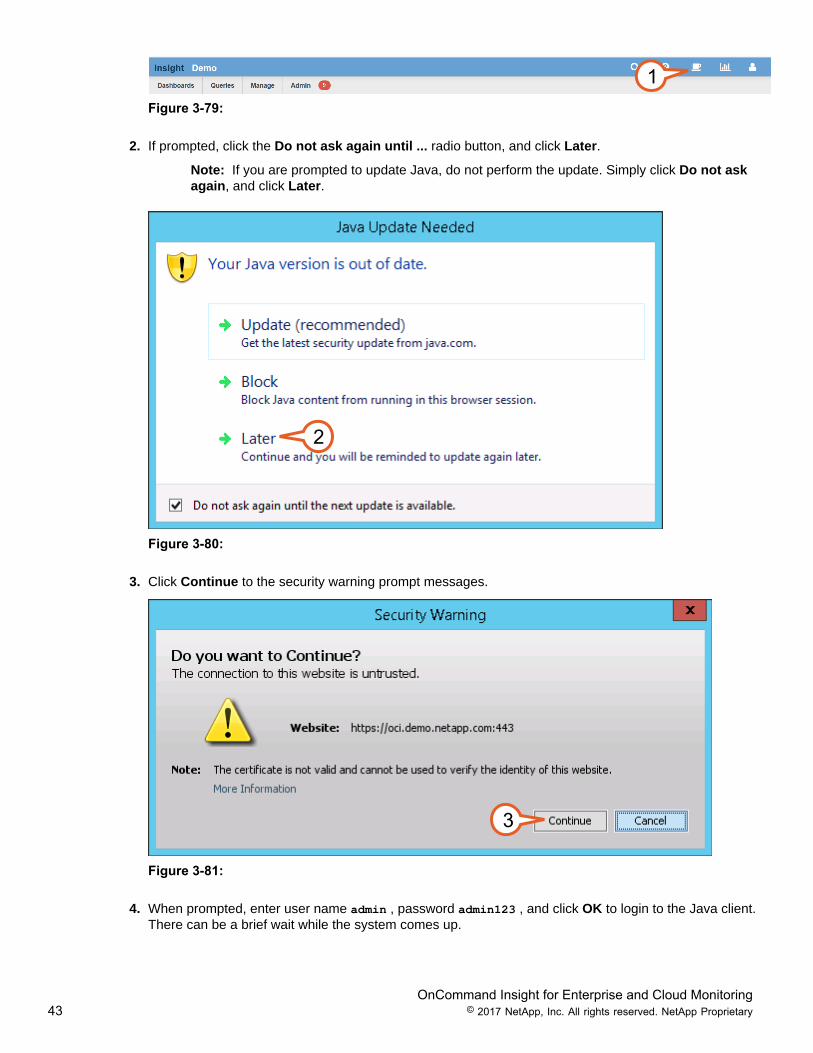
1Figure 3-79:
2. If prompted, click the Do not ask again until ... radio button, and click Later.
Note: If you are prompted to update Java, do not perform the update. Simply click Do not askagain, and click Later.
2
Figure 3-80:
3. Click Continue to the security warning prompt messages.
3
Figure 3-81:
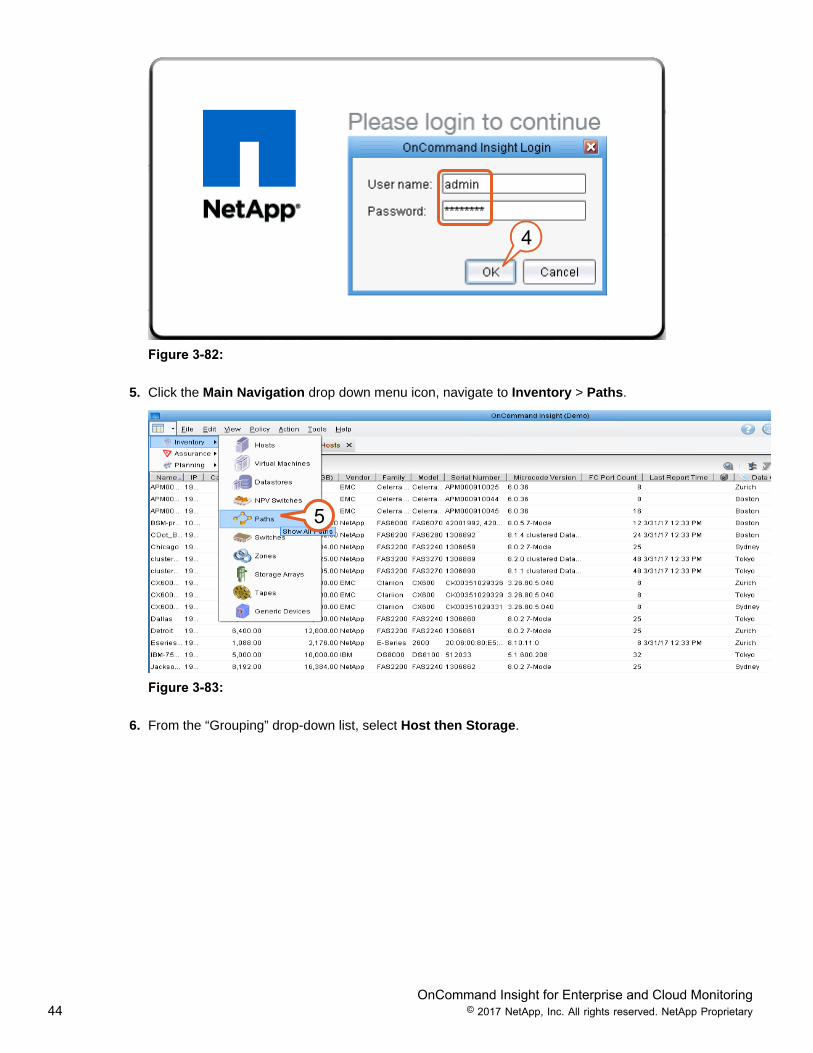
4. When prompted, enter user name admin , password admin123 , and click OK to login to the Java client.There can be a brief wait while the system comes up.
OnCommand Insight for Enterprise and Cloud Monitoring44 © 2017 NetApp, Inc. All rights reserved. NetApp Proprietary
4
Figure 3-82:
5. Click the Main Navigation drop down menu icon, navigate to Inventory > Paths.
5
Figure 3-83:
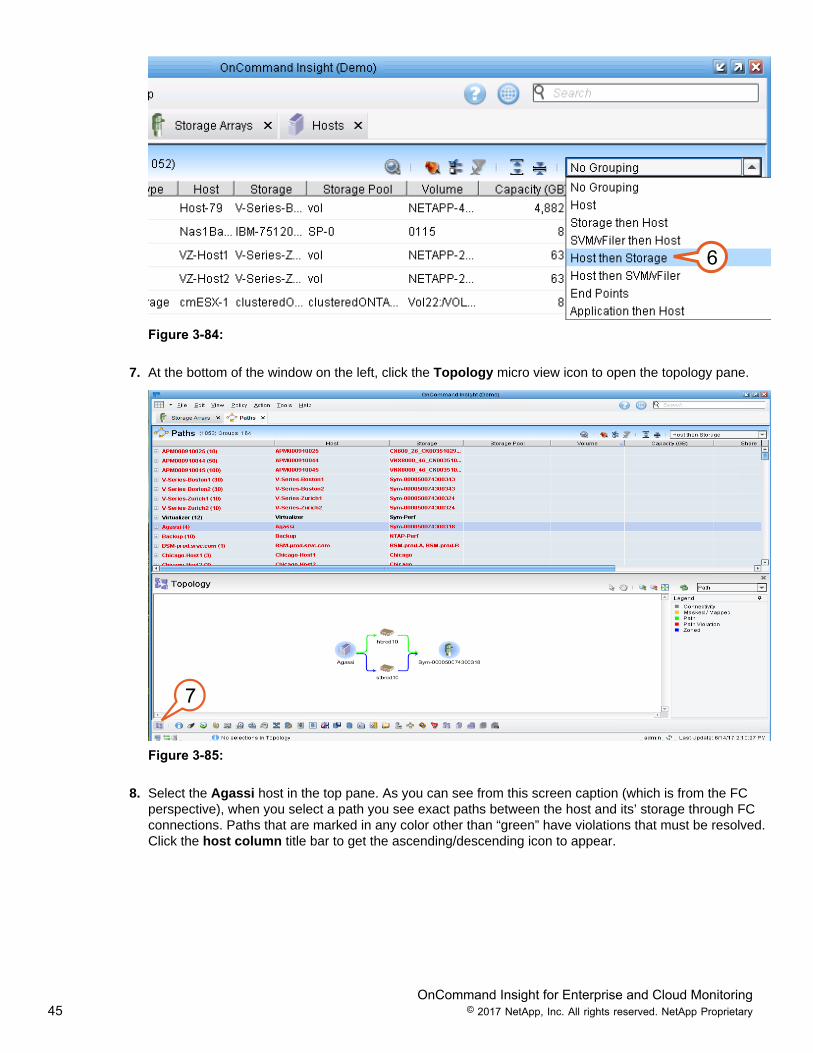
6. From the “Grouping” drop-down list, select Host then Storage.
OnCommand Insight for Enterprise and Cloud Monitoring45 © 2017 NetApp, Inc. All rights reserved. NetApp Proprietary
6
Figure 3-84:
7. At the bottom of the window on the left, click the Topology micro view icon to open the topology pane.
7
Figure 3-85:
8. Select the Agassi host in the top pane. As you can see from this screen caption (which is from the FCperspective), when you select a path you see exact paths between the host and its’ storage through FCconnections. Paths that are marked in any color other than “green” have violations that must be resolved.Click the host column title bar to get the ascending/descending icon to appear.
OnCommand Insight for Enterprise and Cloud Monitoring46 © 2017 NetApp, Inc. All rights reserved. NetApp Proprietary
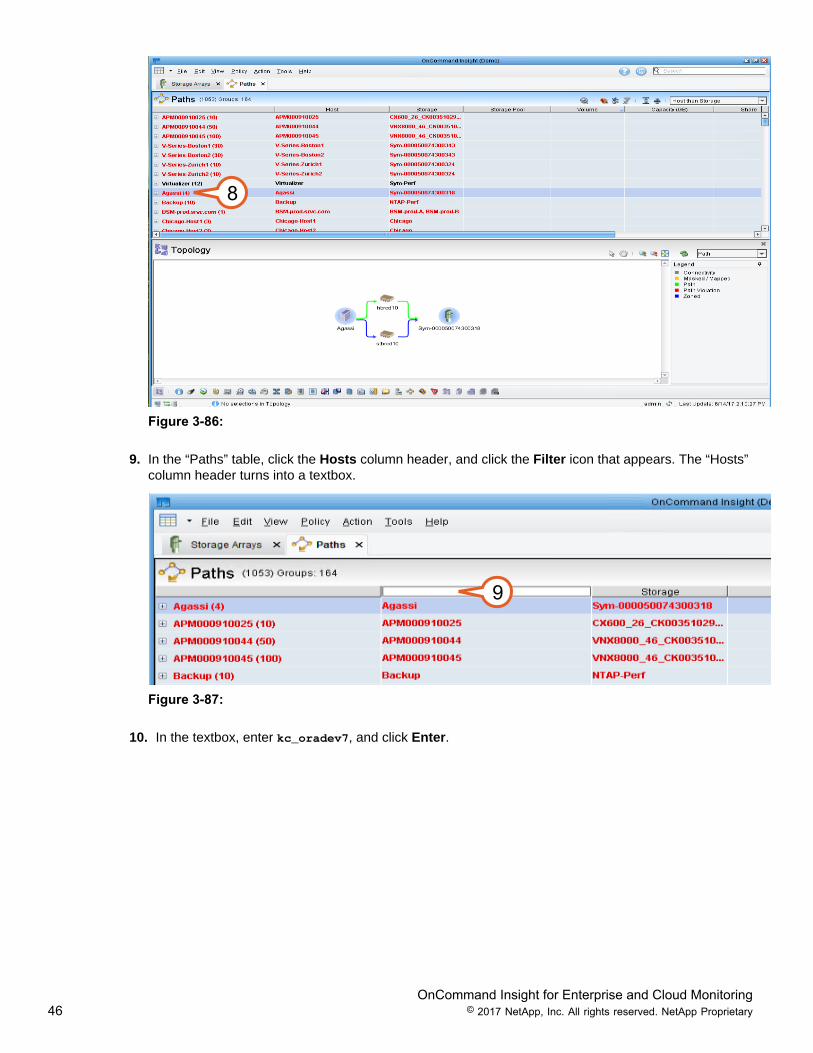
8
Figure 3-86:
9. In the “Paths” table, click the Hosts column header, and click the Filter icon that appears. The “Hosts”column header turns into a textbox.
9
Figure 3-87:
10. In the textbox, enter kc_oradev7, and click Enter.
OnCommand Insight for Enterprise and Cloud Monitoring47 © 2017 NetApp, Inc. All rights reserved. NetApp Proprietary
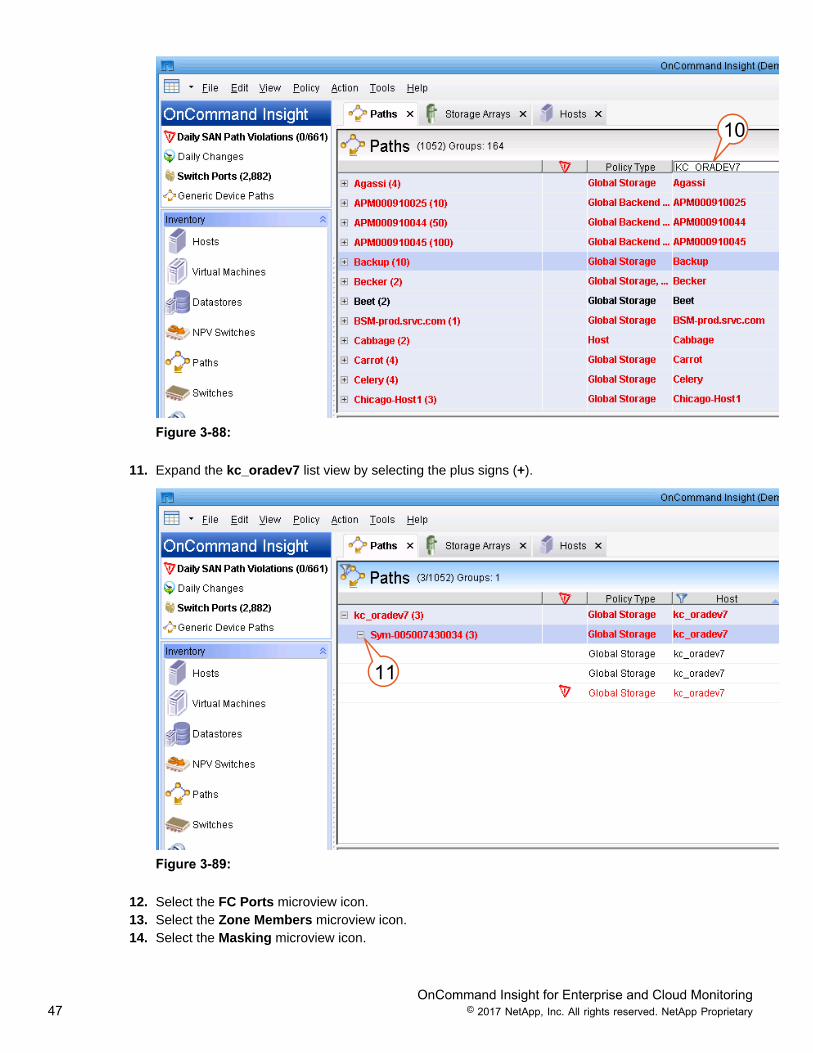
10
Figure 3-88:
11. Expand the kc_oradev7 list view by selecting the plus signs (+).
11
Figure 3-89:
12. Select the FC Ports microview icon.13. Select the Zone Members microview icon.14. Select the Masking microview icon.
OnCommand Insight for Enterprise and Cloud Monitoring48 © 2017 NetApp, Inc. All rights reserved. NetApp Proprietary
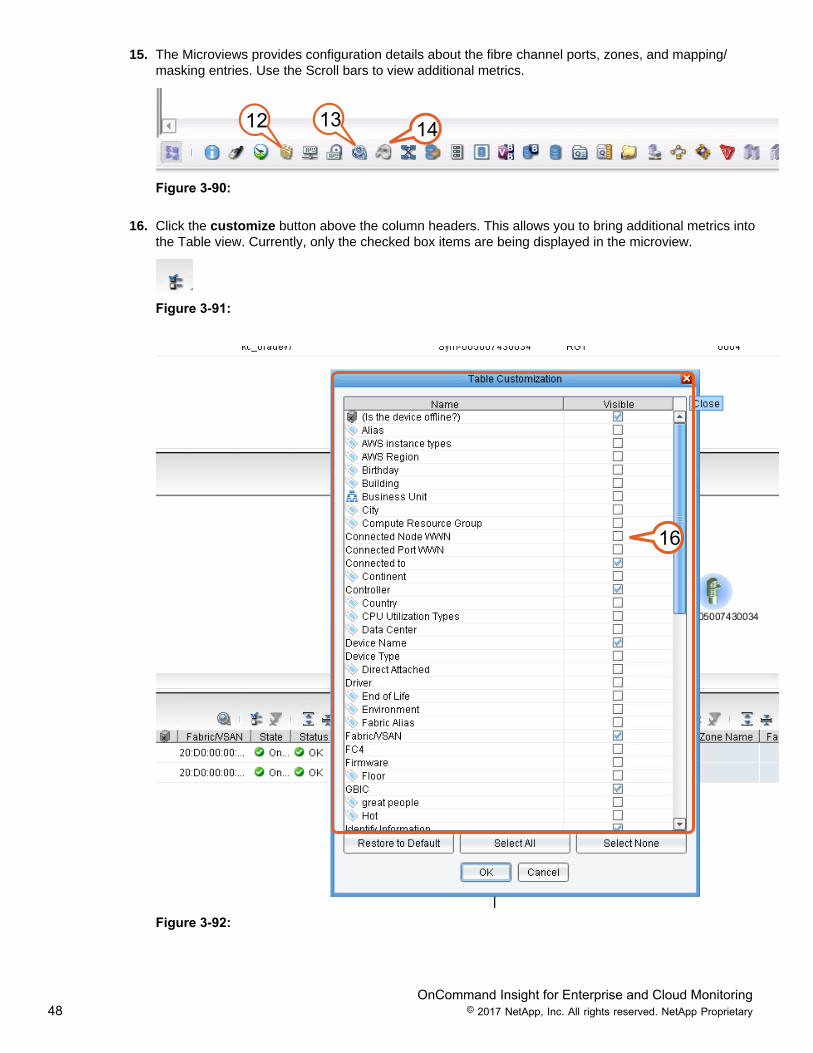
15. The Microviews provides configuration details about the fibre channel ports, zones, and mapping/masking entries. Use the Scroll bars to view additional metrics.
12 13 14
Figure 3-90:
16. Click the customize button above the column headers. This allows you to bring additional metrics intothe Table view. Currently, only the checked box items are being displayed in the microview.
Figure 3-91:
16
Figure 3-92:
OnCommand Insight for Enterprise and Cloud Monitoring49 © 2017 NetApp, Inc. All rights reserved. NetApp Proprietary
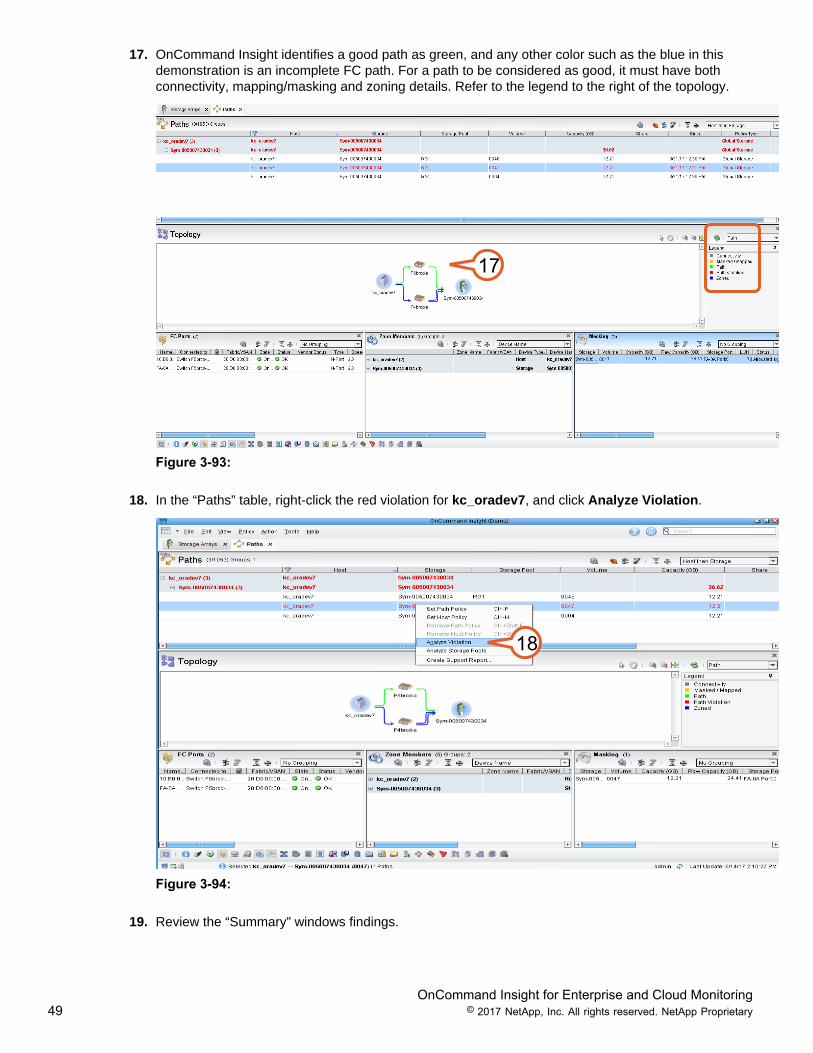
17. OnCommand Insight identifies a good path as green, and any other color such as the blue in thisdemonstration is an incomplete FC path. For a path to be considered as good, it must have bothconnectivity, mapping/masking and zoning details. Refer to the legend to the right of the topology.
17
Figure 3-93:
18. In the “Paths” table, right-click the red violation for kc_oradev7, and click Analyze Violation.
18
Figure 3-94:
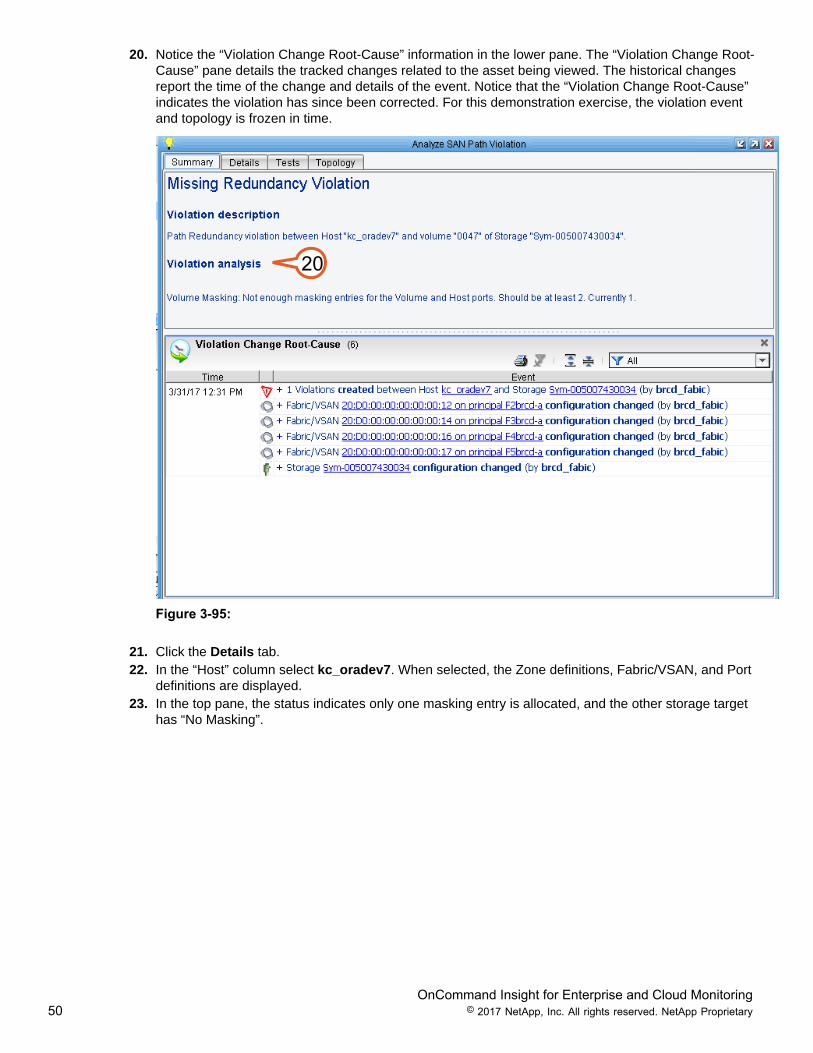
19. Review the “Summary” windows findings.
OnCommand Insight for Enterprise and Cloud Monitoring50 © 2017 NetApp, Inc. All rights reserved. NetApp Proprietary
20. Notice the “Violation Change Root-Cause” information in the lower pane. The “Violation Change Root-Cause” pane details the tracked changes related to the asset being viewed. The historical changesreport the time of the change and details of the event. Notice that the “Violation Change Root-Cause”indicates the violation has since been corrected. For this demonstration exercise, the violation eventand topology is frozen in time.
20
Figure 3-95:
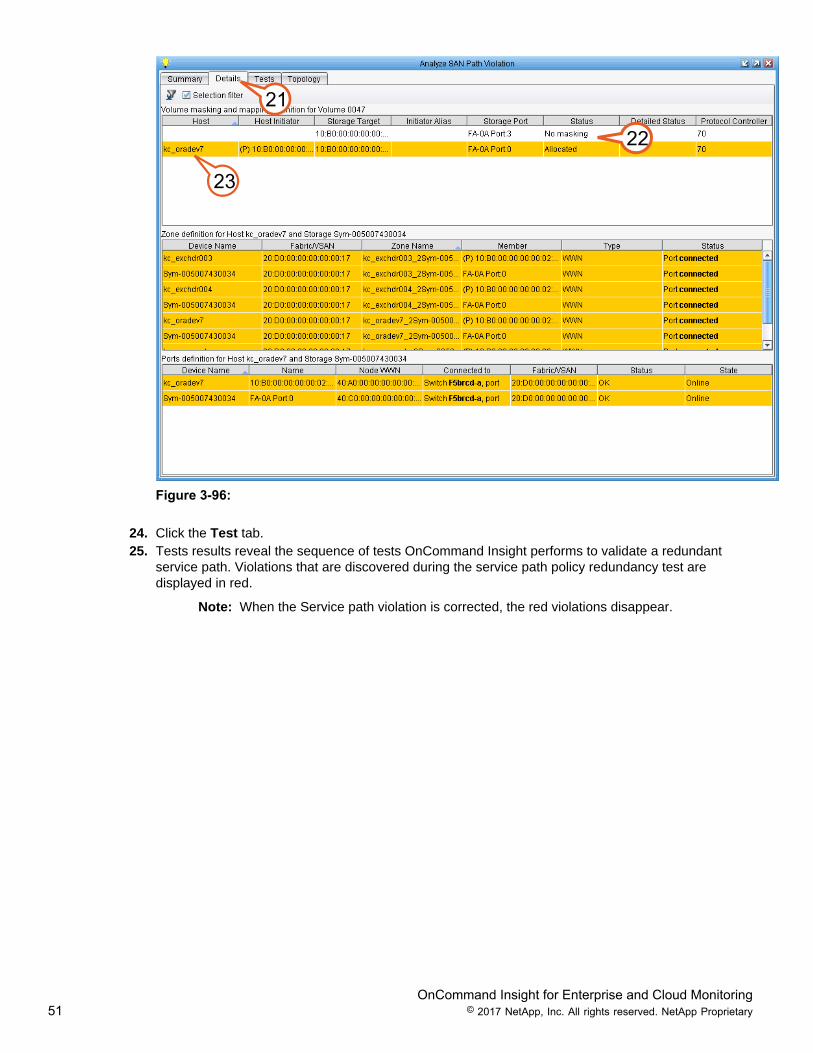
21. Click the Details tab.22. In the “Host” column select kc_oradev7. When selected, the Zone definitions, Fabric/VSAN, and Port
definitions are displayed.23. In the top pane, the status indicates only one masking entry is allocated, and the other storage target
has “No Masking”.
OnCommand Insight for Enterprise and Cloud Monitoring51 © 2017 NetApp, Inc. All rights reserved. NetApp Proprietary
21
22
23
Figure 3-96:
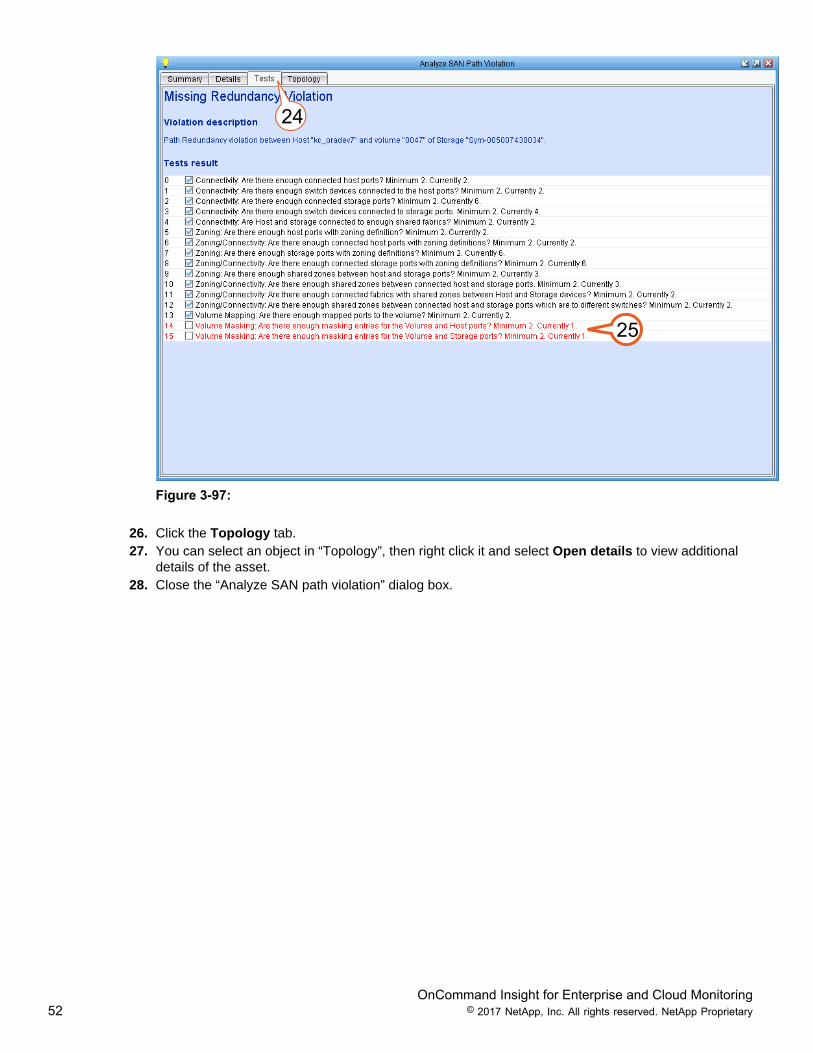
24. Click the Test tab.25. Tests results reveal the sequence of tests OnCommand Insight performs to validate a redundant
service path. Violations that are discovered during the service path policy redundancy test aredisplayed in red.
Note: When the Service path violation is corrected, the red violations disappear.
OnCommand Insight for Enterprise and Cloud Monitoring52 © 2017 NetApp, Inc. All rights reserved. NetApp Proprietary
24
25
Figure 3-97:
26. Click the Topology tab.27. You can select an object in “Topology”, then right click it and select Open details to view additional
details of the asset.28. Close the “Analyze SAN path violation” dialog box.
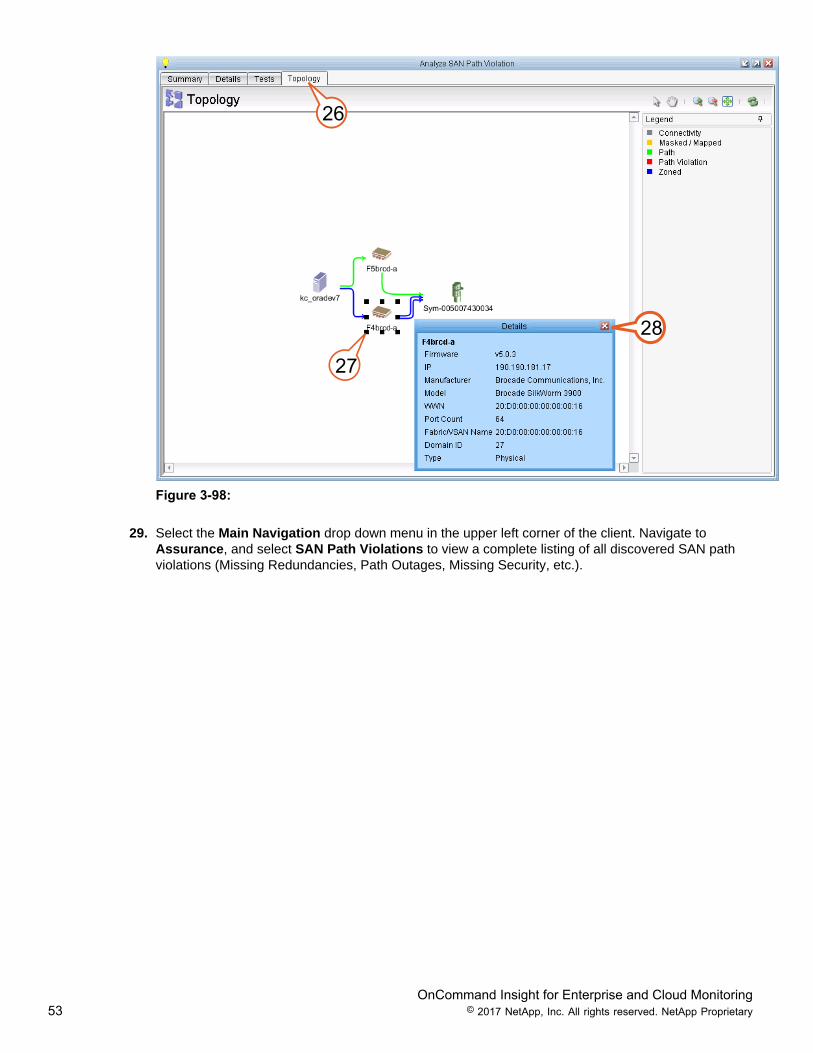
OnCommand Insight for Enterprise and Cloud Monitoring53 © 2017 NetApp, Inc. All rights reserved. NetApp Proprietary
26
27
28
Figure 3-98:
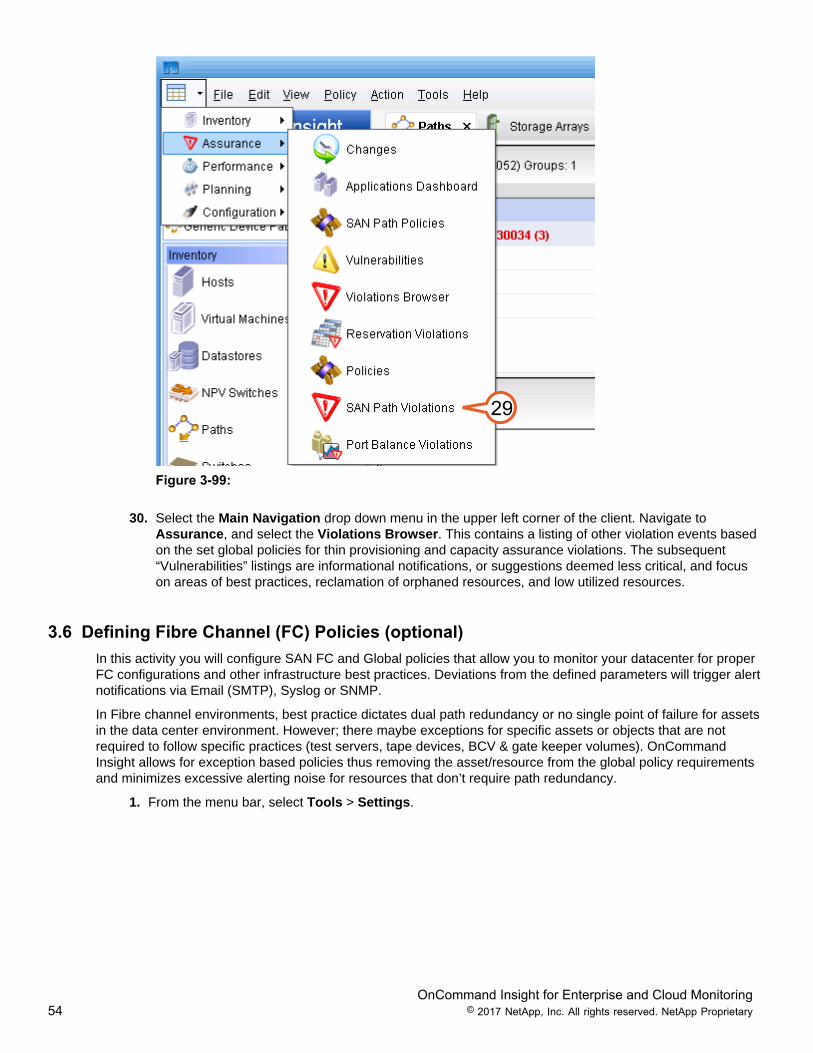
29. Select the Main Navigation drop down menu in the upper left corner of the client. Navigate toAssurance, and select SAN Path Violations to view a complete listing of all discovered SAN pathviolations (Missing Redundancies, Path Outages, Missing Security, etc.).
OnCommand Insight for Enterprise and Cloud Monitoring54 © 2017 NetApp, Inc. All rights reserved. NetApp Proprietary
29
Figure 3-99:
30. Select the Main Navigation drop down menu in the upper left corner of the client. Navigate toAssurance, and select the Violations Browser. This contains a listing of other violation events basedon the set global policies for thin provisioning and capacity assurance violations. The subsequent“Vulnerabilities” listings are informational notifications, or suggestions deemed less critical, and focuson areas of best practices, reclamation of orphaned resources, and low utilized resources.
3.6 Defining Fibre Channel (FC) Policies (optional)In this activity you will configure SAN FC and Global policies that allow you to monitor your datacenter for properFC configurations and other infrastructure best practices. Deviations from the defined parameters will trigger alertnotifications via Email (SMTP), Syslog or SNMP.
In Fibre channel environments, best practice dictates dual path redundancy or no single point of failure for assetsin the data center environment. However; there maybe exceptions for specific assets or objects that are notrequired to follow specific practices (test servers, tape devices, BCV & gate keeper volumes). OnCommandInsight allows for exception based policies thus removing the asset/resource from the global policy requirementsand minimizes excessive alerting noise for resources that don’t require path redundancy.
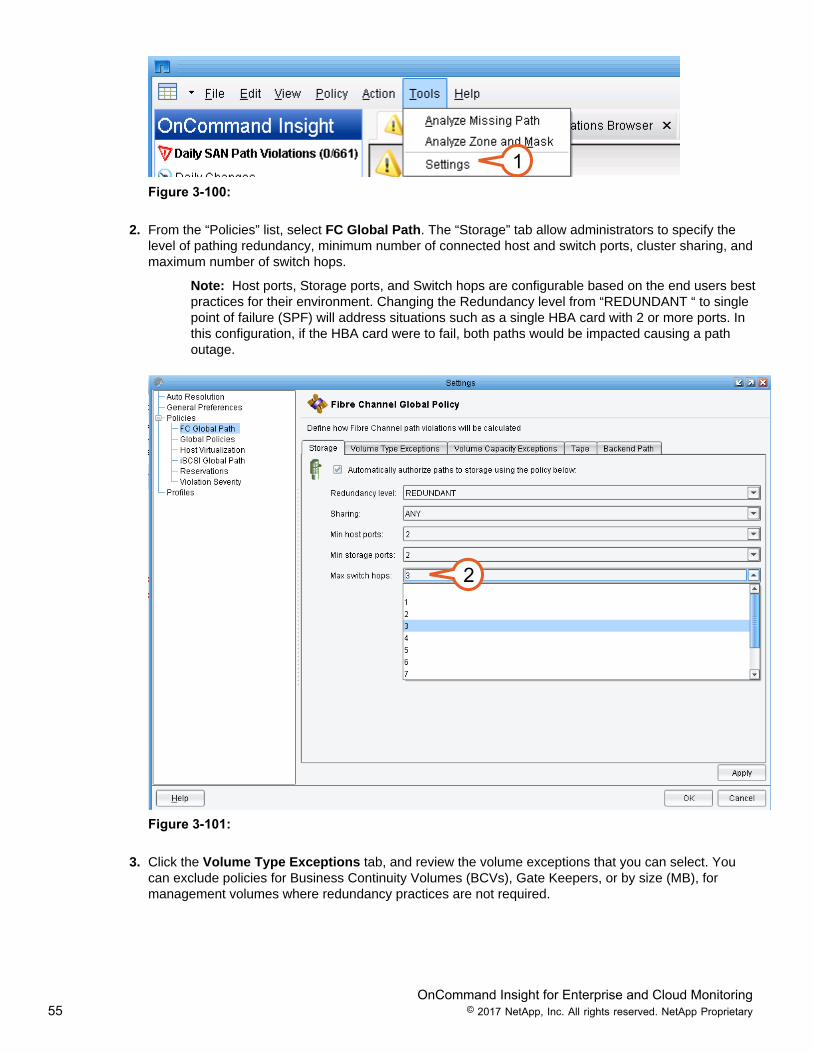
1. From the menu bar, select Tools > Settings.
OnCommand Insight for Enterprise and Cloud Monitoring55 © 2017 NetApp, Inc. All rights reserved. NetApp Proprietary
1Figure 3-100:
2. From the “Policies” list, select FC Global Path. The “Storage” tab allow administrators to specify thelevel of pathing redundancy, minimum number of connected host and switch ports, cluster sharing, andmaximum number of switch hops.
Note: Host ports, Storage ports, and Switch hops are configurable based on the end users bestpractices for their environment. Changing the Redundancy level from “REDUNDANT “ to singlepoint of failure (SPF) will address situations such as a single HBA card with 2 or more ports. Inthis configuration, if the HBA card were to fail, both paths would be impacted causing a pathoutage.
2
Figure 3-101:
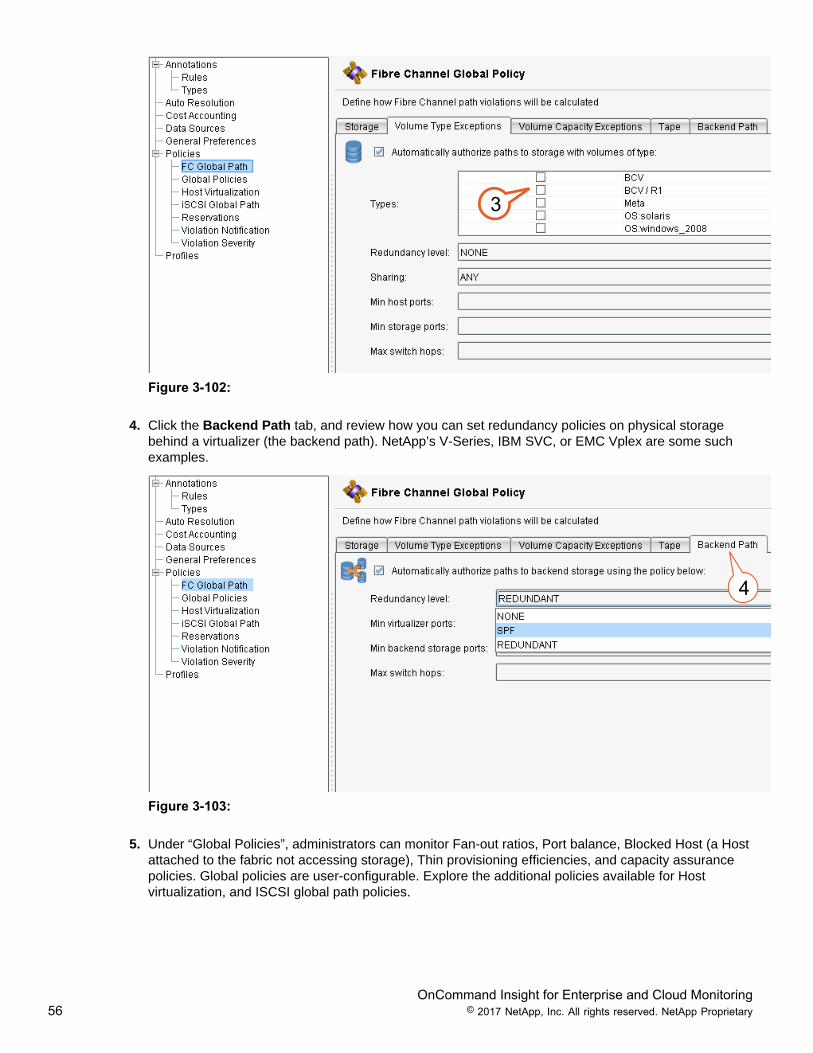
3. Click the Volume Type Exceptions tab, and review the volume exceptions that you can select. Youcan exclude policies for Business Continuity Volumes (BCVs), Gate Keepers, or by size (MB), formanagement volumes where redundancy practices are not required.
OnCommand Insight for Enterprise and Cloud Monitoring56 © 2017 NetApp, Inc. All rights reserved. NetApp Proprietary
3
Figure 3-102:
4. Click the Backend Path tab, and review how you can set redundancy policies on physical storagebehind a virtualizer (the backend path). NetApp’s V-Series, IBM SVC, or EMC Vplex are some suchexamples.
4
Figure 3-103:
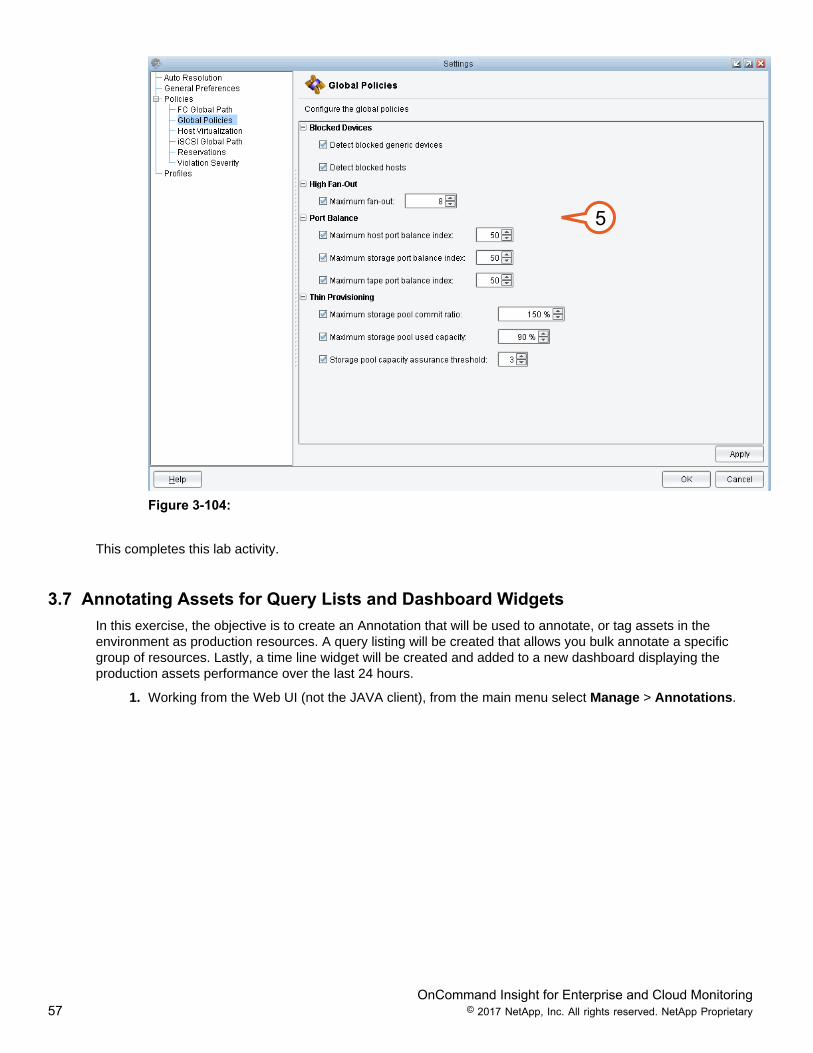
5. Under “Global Policies”, administrators can monitor Fan-out ratios, Port balance, Blocked Host (a Hostattached to the fabric not accessing storage), Thin provisioning efficiencies, and capacity assurancepolicies. Global policies are user-configurable. Explore the additional policies available for Hostvirtualization, and ISCSI global path policies.
OnCommand Insight for Enterprise and Cloud Monitoring57 © 2017 NetApp, Inc. All rights reserved. NetApp Proprietary
5
Figure 3-104:
This completes this lab activity.
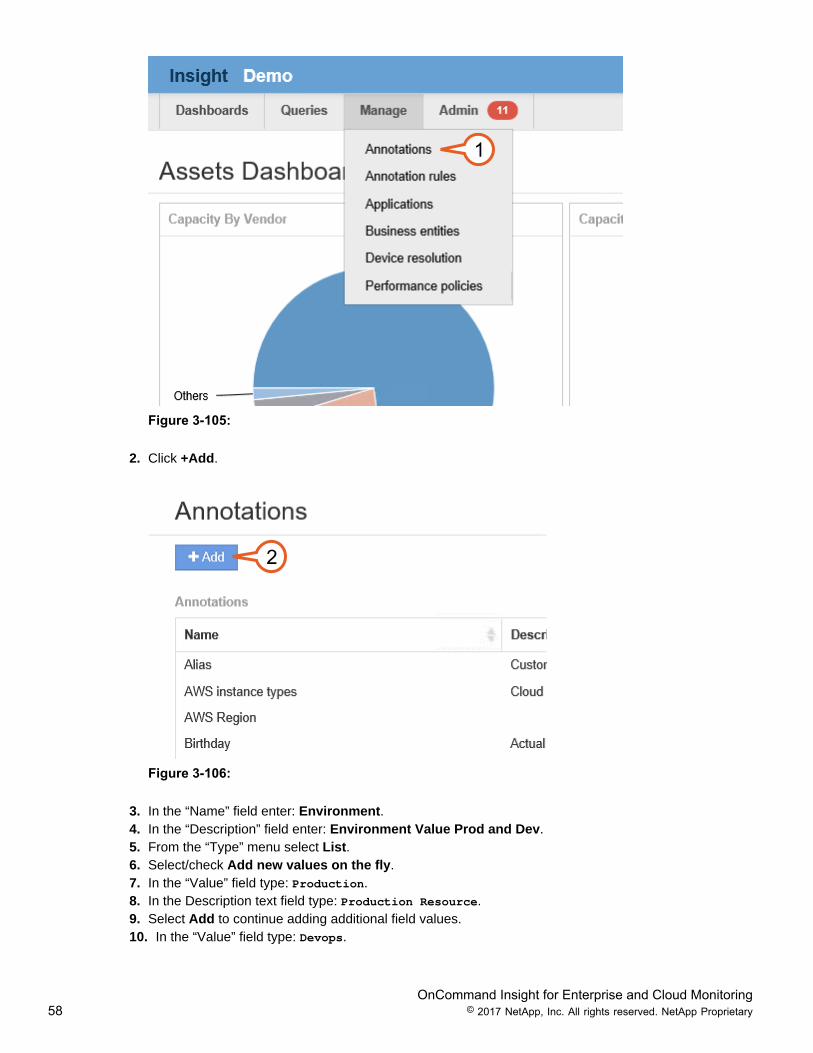
3.7 Annotating Assets for Query Lists and Dashboard WidgetsIn this exercise, the objective is to create an Annotation that will be used to annotate, or tag assets in theenvironment as production resources. A query listing will be created that allows you bulk annotate a specificgroup of resources. Lastly, a time line widget will be created and added to a new dashboard displaying theproduction assets performance over the last 24 hours.
1. Working from the Web UI (not the JAVA client), from the main menu select Manage > Annotations.
OnCommand Insight for Enterprise and Cloud Monitoring58 © 2017 NetApp, Inc. All rights reserved. NetApp Proprietary
1
Figure 3-105:
2. Click +Add.
2
Figure 3-106:
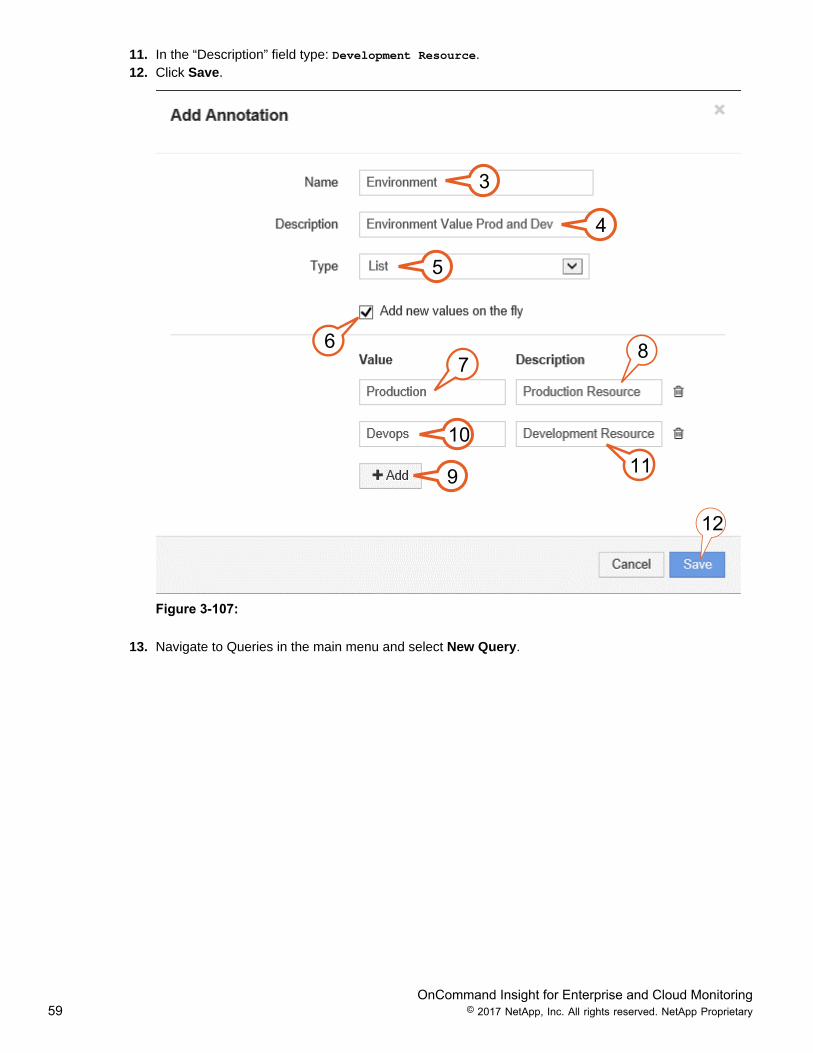
3. In the “Name” field enter: Environment.4. In the “Description” field enter: Environment Value Prod and Dev.5. From the “Type” menu select List.6. Select/check Add new values on the fly.7. In the “Value” field type: Production.8. In the Description text field type: Production Resource.9. Select Add to continue adding additional field values.10. In the “Value” field type: Devops.
OnCommand Insight for Enterprise and Cloud Monitoring59 © 2017 NetApp, Inc. All rights reserved. NetApp Proprietary
11. In the “Description” field type: Development Resource.12. Click Save.
3
4
5
67
8
10119
12
Figure 3-107:
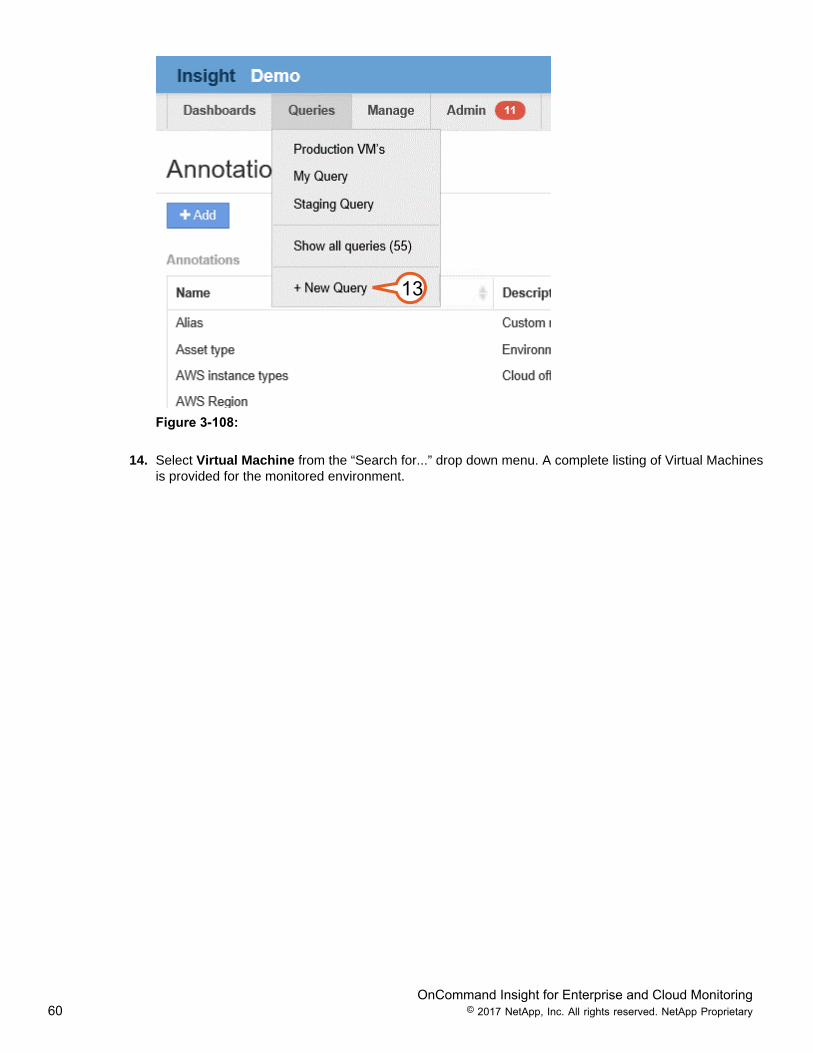
13. Navigate to Queries in the main menu and select New Query.
OnCommand Insight for Enterprise and Cloud Monitoring60 © 2017 NetApp, Inc. All rights reserved. NetApp Proprietary
13
Figure 3-108:
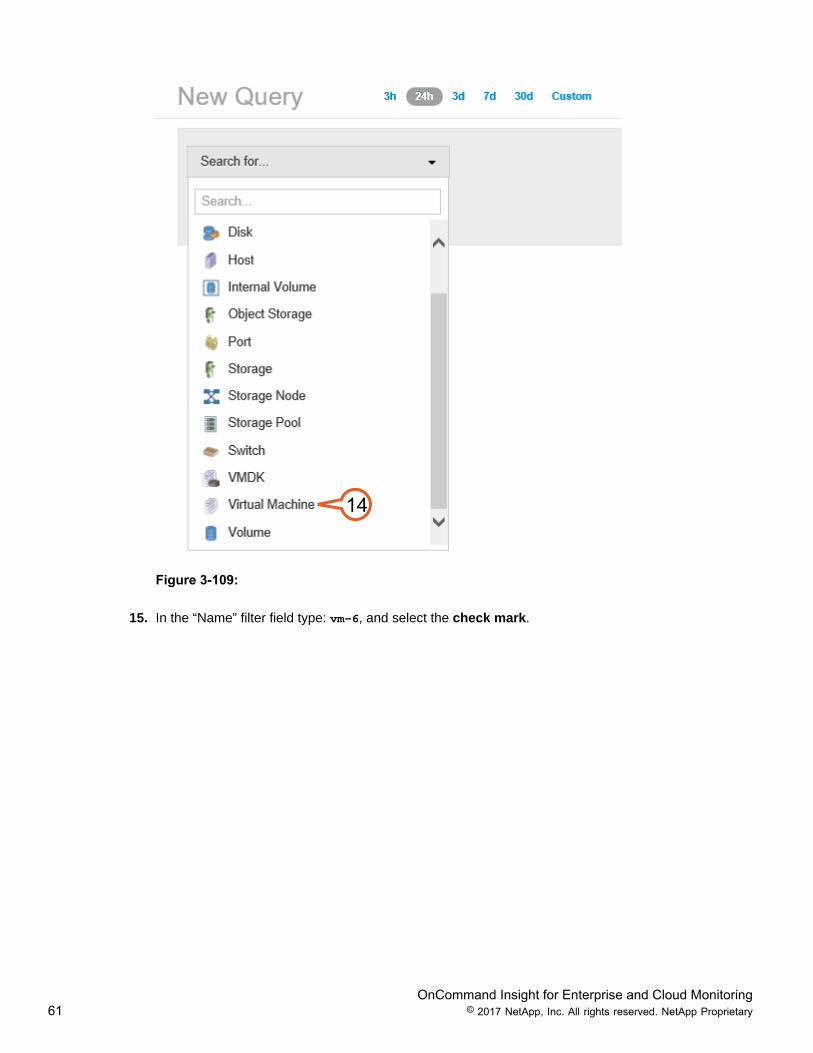
14. Select Virtual Machine from the “Search for...” drop down menu. A complete listing of Virtual Machinesis provided for the monitored environment.
OnCommand Insight for Enterprise and Cloud Monitoring61 © 2017 NetApp, Inc. All rights reserved. NetApp Proprietary
14
Figure 3-109:
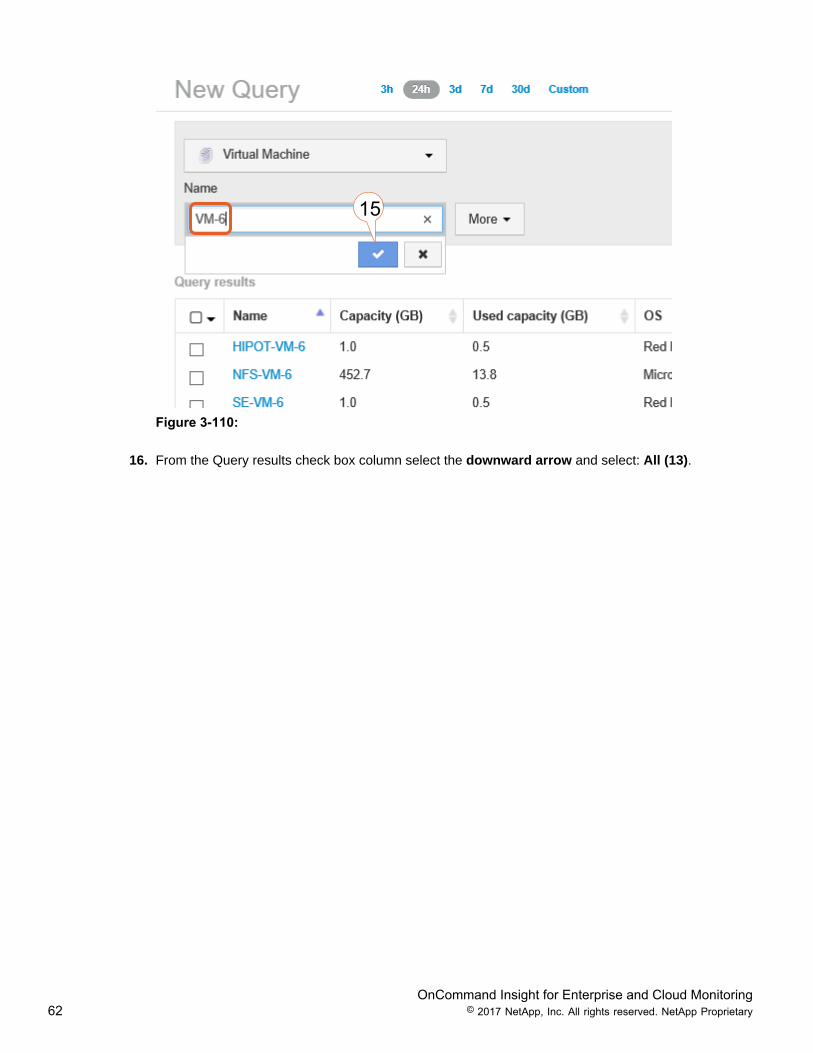
15. In the “Name” filter field type: vm-6, and select the check mark.
OnCommand Insight for Enterprise and Cloud Monitoring62 © 2017 NetApp, Inc. All rights reserved. NetApp Proprietary
15
Figure 3-110:
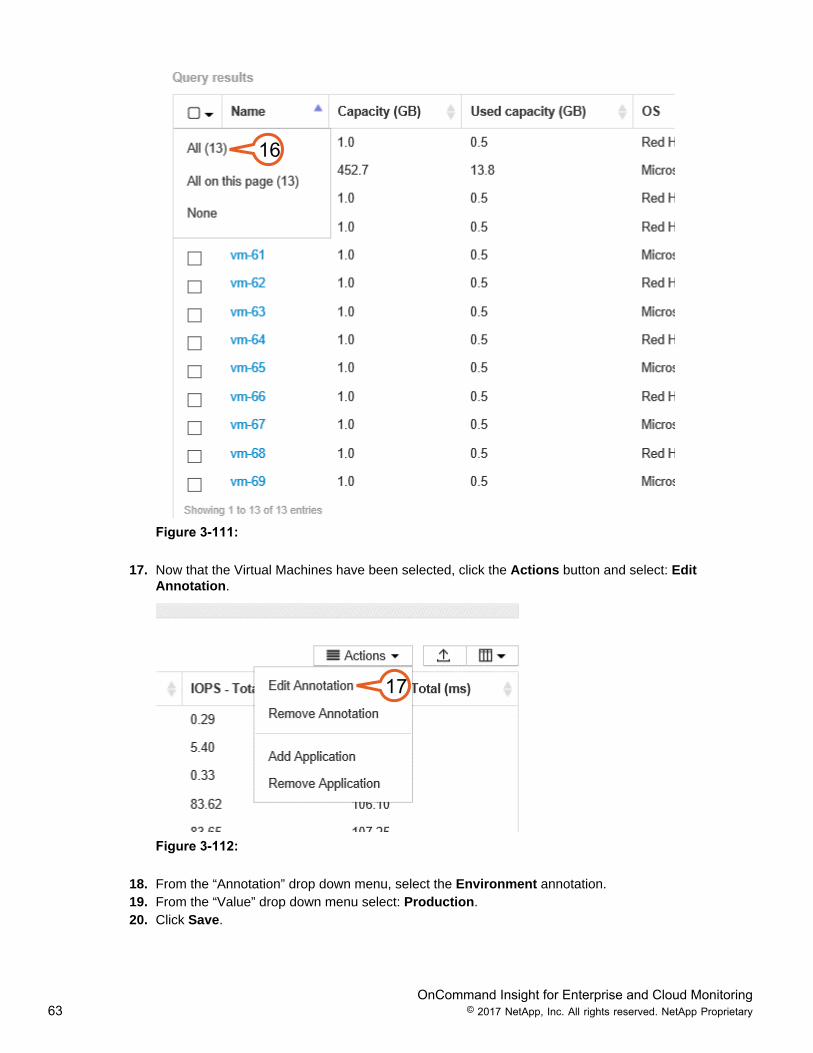
16. From the Query results check box column select the downward arrow and select: All (13).
OnCommand Insight for Enterprise and Cloud Monitoring63 © 2017 NetApp, Inc. All rights reserved. NetApp Proprietary
16
Figure 3-111:
17. Now that the Virtual Machines have been selected, click the Actions button and select: EditAnnotation.
17
Figure 3-112:
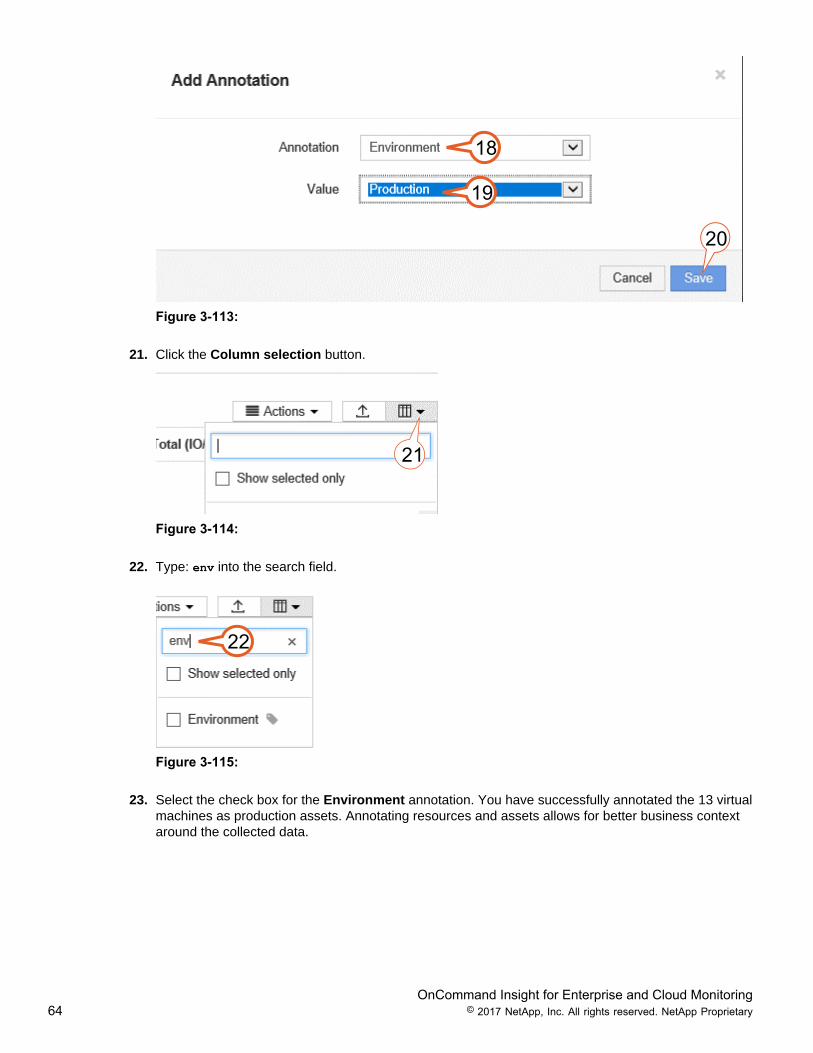
18. From the “Annotation” drop down menu, select the Environment annotation.19. From the “Value” drop down menu select: Production.20. Click Save.
OnCommand Insight for Enterprise and Cloud Monitoring64 © 2017 NetApp, Inc. All rights reserved. NetApp Proprietary
18
19
20
Figure 3-113:
21. Click the Column selection button.
21
Figure 3-114:
22. Type: env into the search field.
22
Figure 3-115:
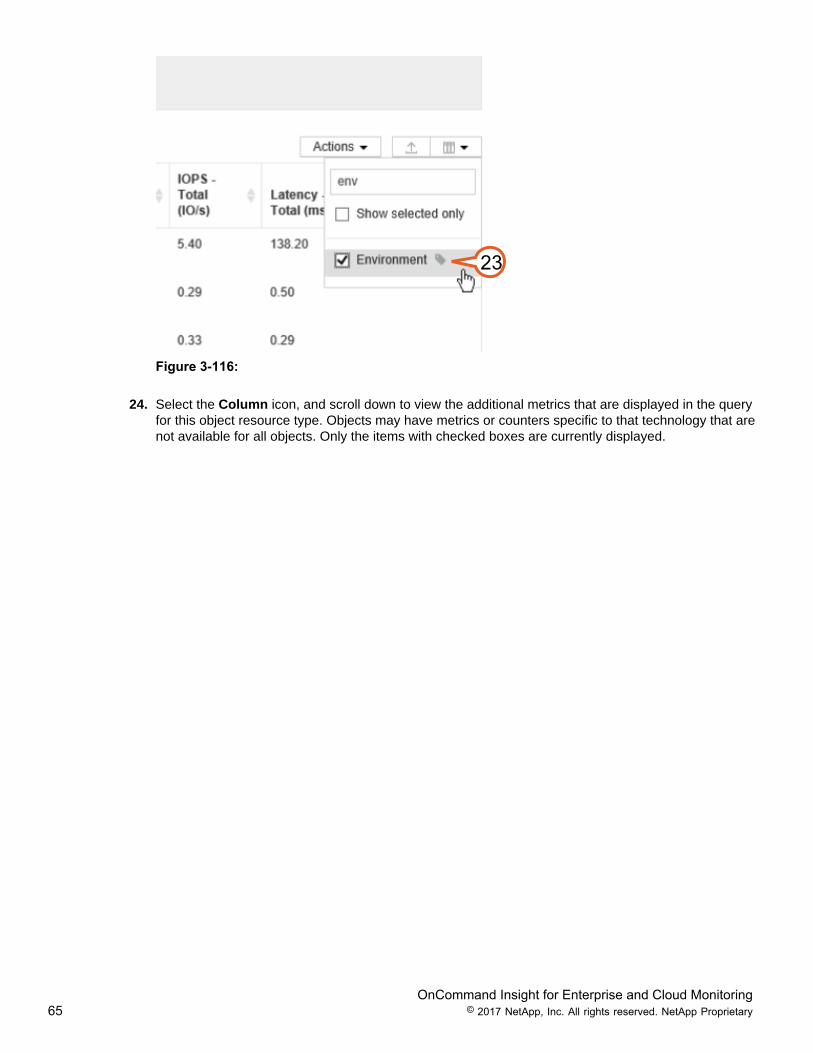
23. Select the check box for the Environment annotation. You have successfully annotated the 13 virtualmachines as production assets. Annotating resources and assets allows for better business contextaround the collected data.
OnCommand Insight for Enterprise and Cloud Monitoring65 © 2017 NetApp, Inc. All rights reserved. NetApp Proprietary
23
Figure 3-116:
24. Select the Column icon, and scroll down to view the additional metrics that are displayed in the queryfor this object resource type. Objects may have metrics or counters specific to that technology that arenot available for all objects. Only the items with checked boxes are currently displayed.
OnCommand Insight for Enterprise and Cloud Monitoring66 © 2017 NetApp, Inc. All rights reserved. NetApp Proprietary
24
Figure 3-117:
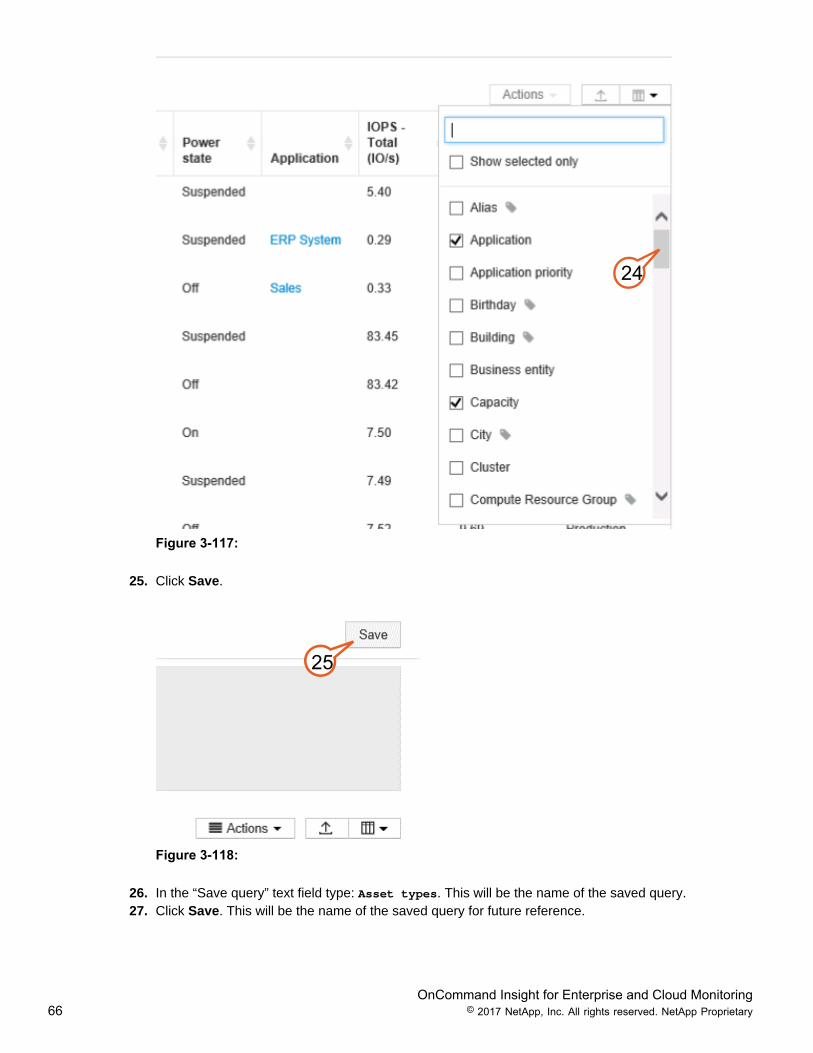
25. Click Save.
25
Figure 3-118:
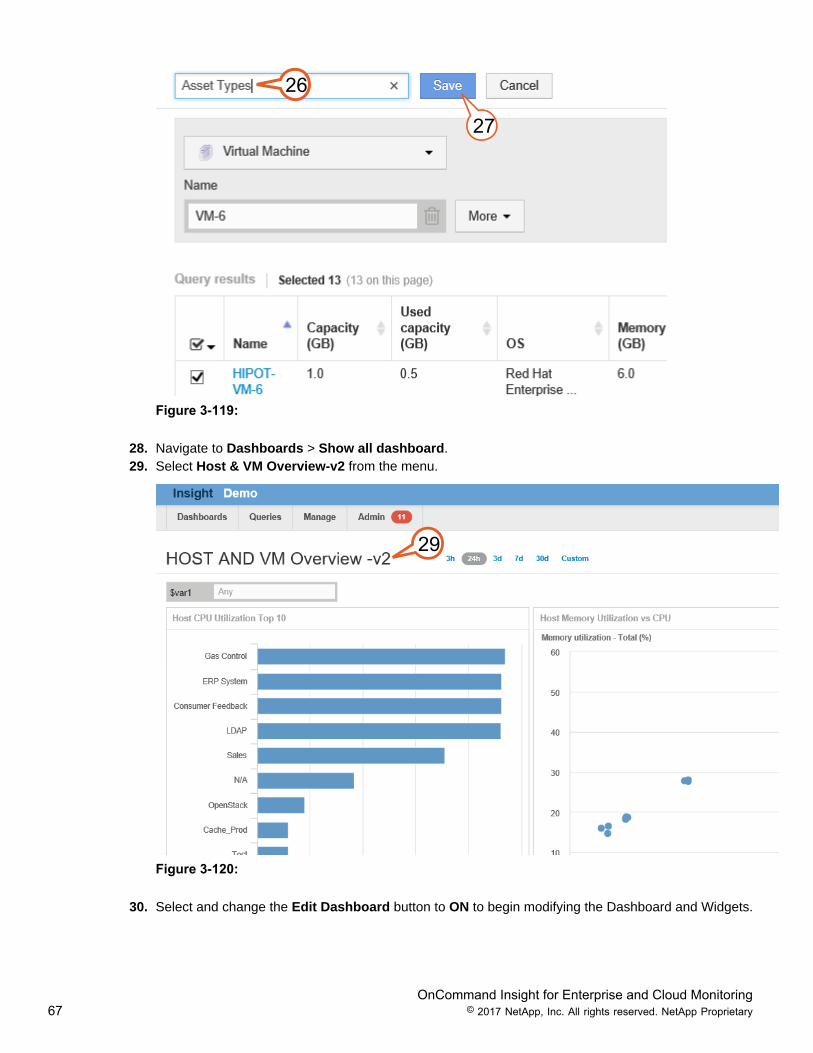
26. In the “Save query” text field type: Asset types. This will be the name of the saved query.27. Click Save. This will be the name of the saved query for future reference.
OnCommand Insight for Enterprise and Cloud Monitoring67 © 2017 NetApp, Inc. All rights reserved. NetApp Proprietary
26
27
Figure 3-119:
28. Navigate to Dashboards > Show all dashboard.29. Select Host & VM Overview-v2 from the menu.
29
Figure 3-120:
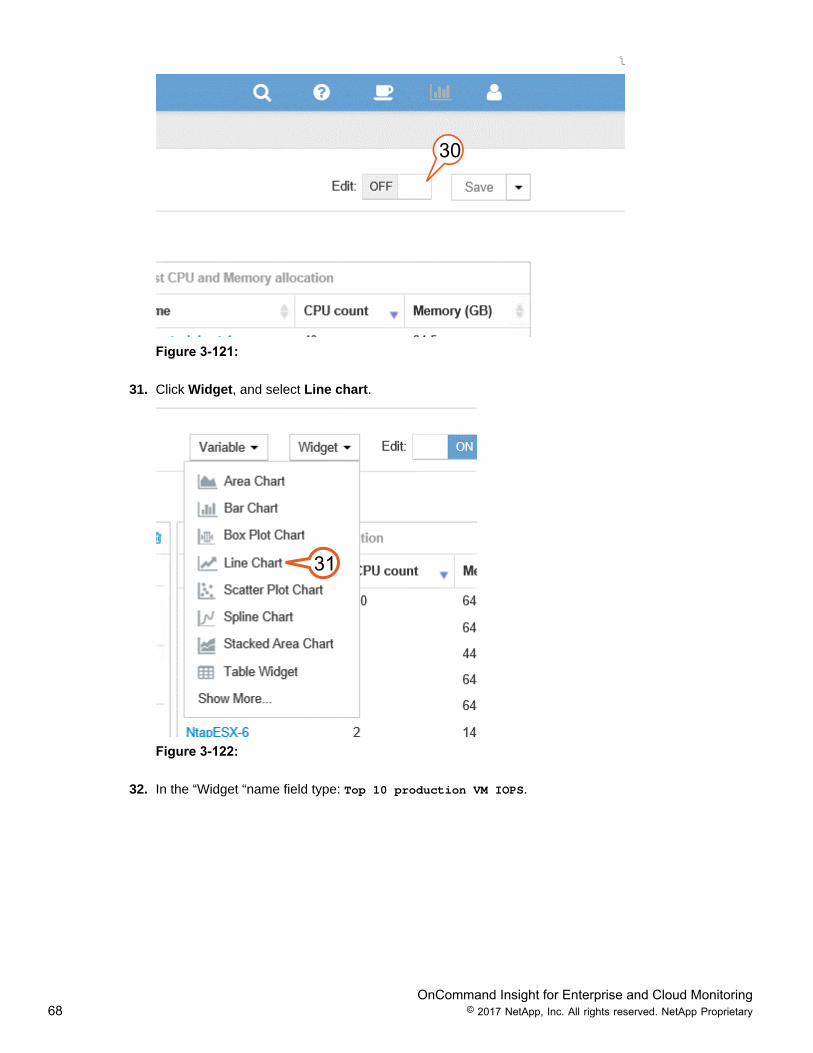
30. Select and change the Edit Dashboard button to ON to begin modifying the Dashboard and Widgets.
OnCommand Insight for Enterprise and Cloud Monitoring68 © 2017 NetApp, Inc. All rights reserved. NetApp Proprietary
30
Figure 3-121:
31. Click Widget, and select Line chart.
31
Figure 3-122:
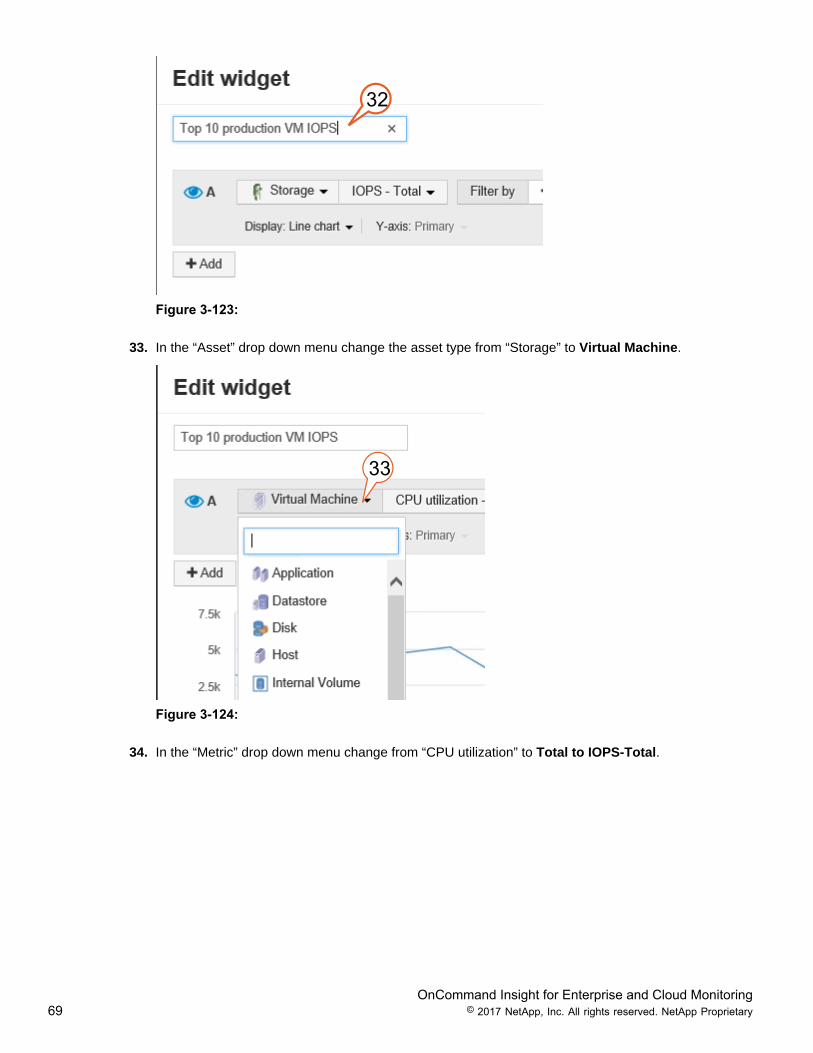
32. In the “Widget “name field type: Top 10 production VM IOPS.
OnCommand Insight for Enterprise and Cloud Monitoring69 © 2017 NetApp, Inc. All rights reserved. NetApp Proprietary
32
Figure 3-123:
33. In the “Asset” drop down menu change the asset type from “Storage” to Virtual Machine.
33
Figure 3-124:
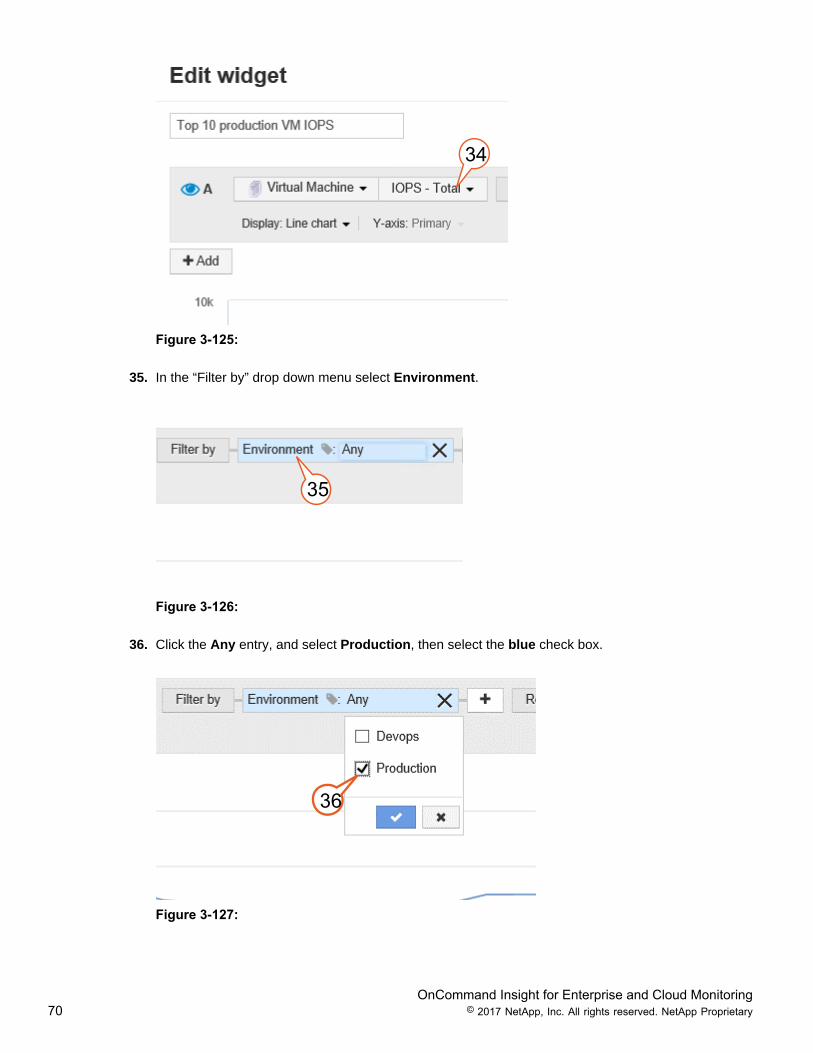
34. In the “Metric” drop down menu change from “CPU utilization” to Total to IOPS-Total.
OnCommand Insight for Enterprise and Cloud Monitoring70 © 2017 NetApp, Inc. All rights reserved. NetApp Proprietary
34
Figure 3-125:
35. In the “Filter by” drop down menu select Environment.
35
Figure 3-126:
36. Click the Any entry, and select Production, then select the blue check box.
36
Figure 3-127:
OnCommand Insight for Enterprise and Cloud Monitoring71 © 2017 NetApp, Inc. All rights reserved. NetApp Proprietary
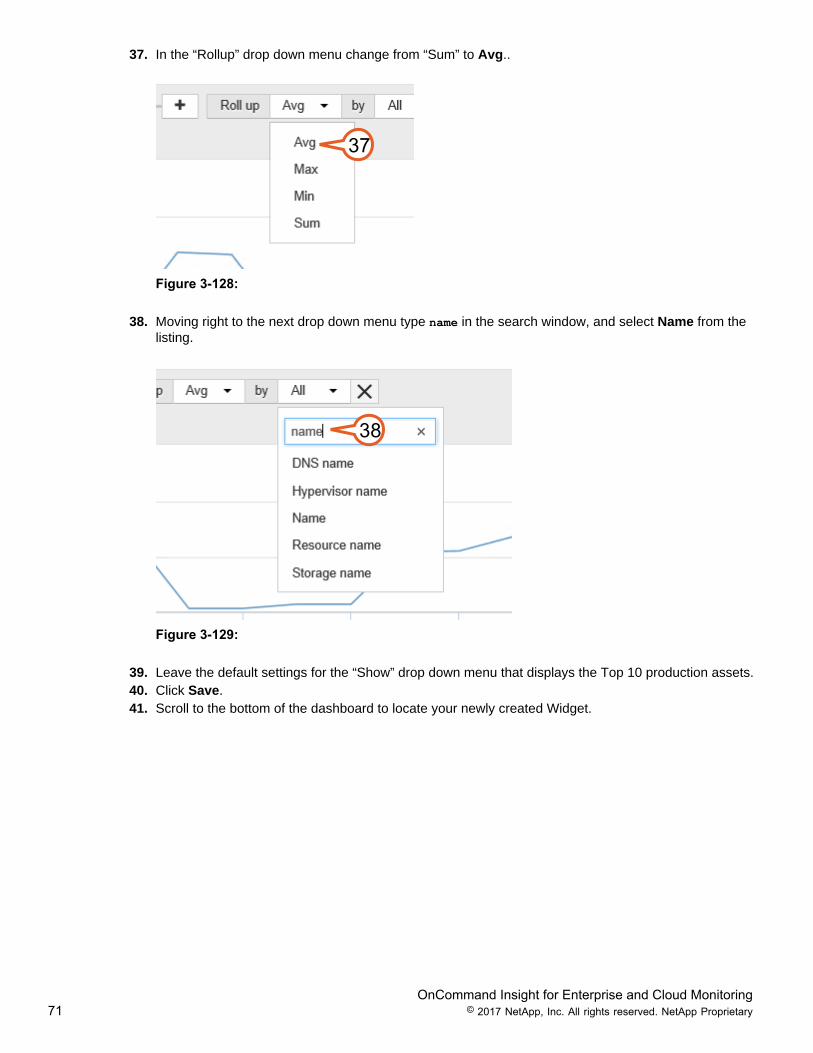
37. In the “Rollup” drop down menu change from “Sum” to Avg..
37
Figure 3-128:
38. Moving right to the next drop down menu type name in the search window, and select Name from thelisting.
38
Figure 3-129:
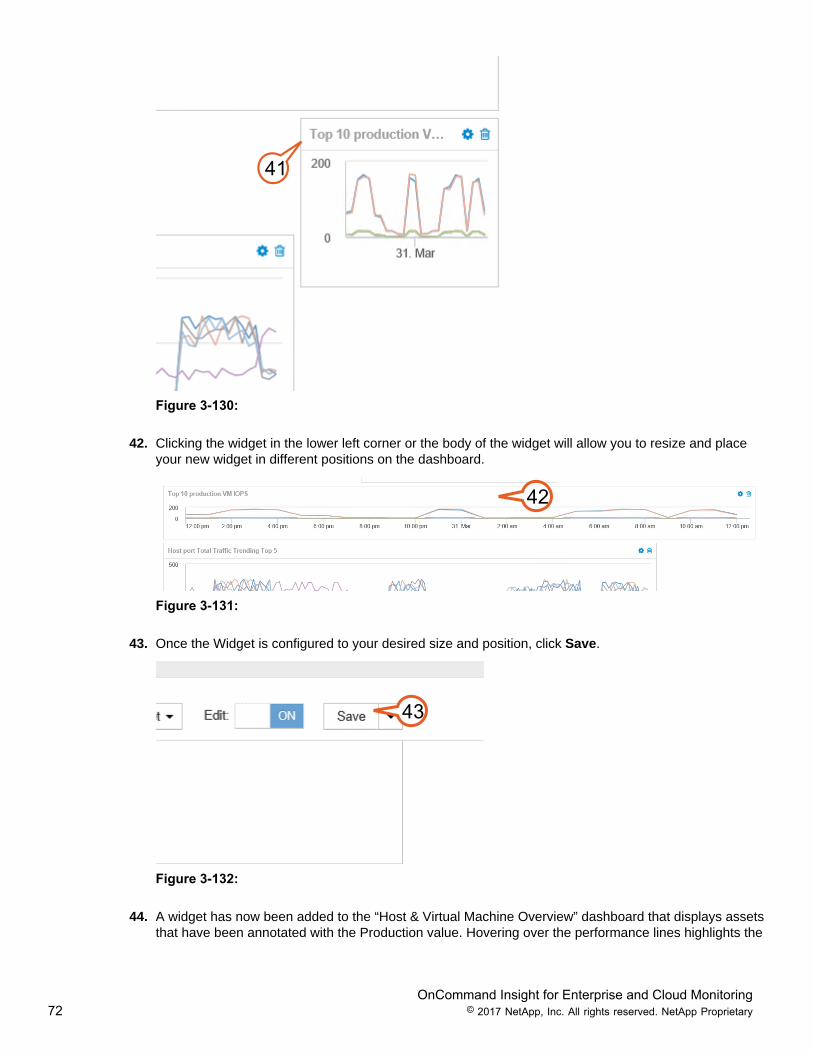
39. Leave the default settings for the “Show” drop down menu that displays the Top 10 production assets.40. Click Save.41. Scroll to the bottom of the dashboard to locate your newly created Widget.
OnCommand Insight for Enterprise and Cloud Monitoring72 © 2017 NetApp, Inc. All rights reserved. NetApp Proprietary
41
Figure 3-130:
42. Clicking the widget in the lower left corner or the body of the widget will allow you to resize and placeyour new widget in different positions on the dashboard.
42
Figure 3-131:
43. Once the Widget is configured to your desired size and position, click Save.
43
Figure 3-132:
44. A widget has now been added to the “Host & Virtual Machine Overview” dashboard that displays assetsthat have been annotated with the Production value. Hovering over the performance lines highlights the
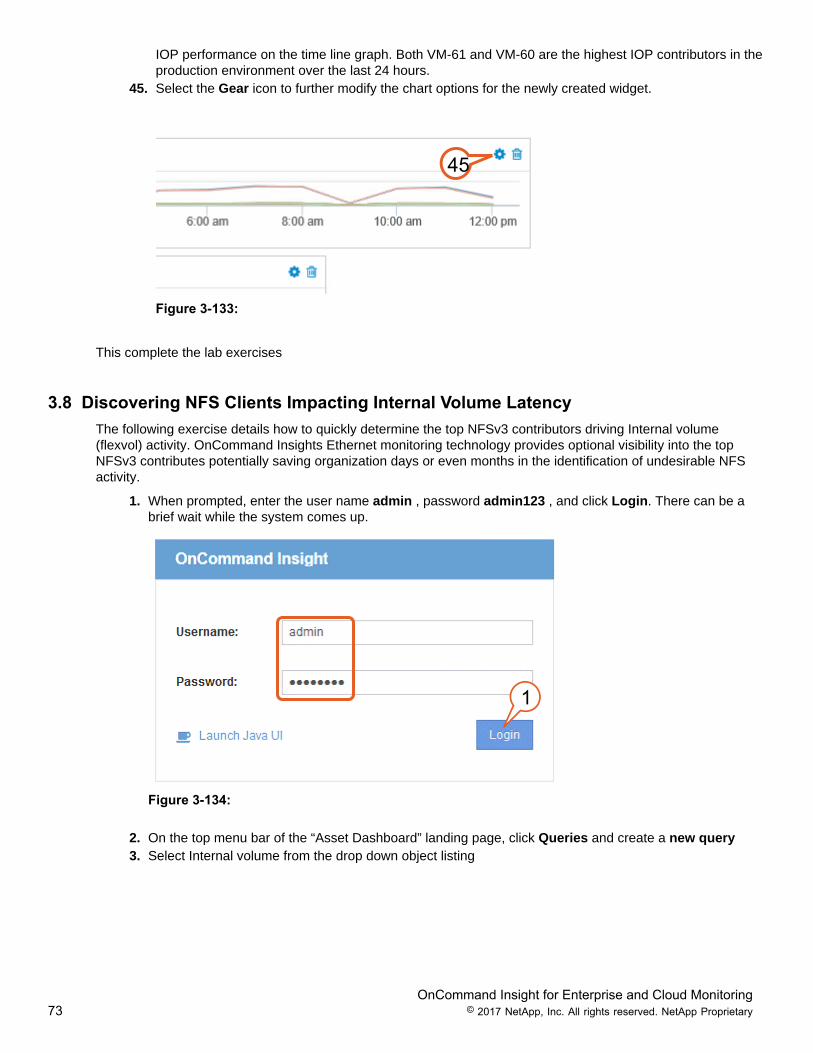
OnCommand Insight for Enterprise and Cloud Monitoring73 © 2017 NetApp, Inc. All rights reserved. NetApp Proprietary
IOP performance on the time line graph. Both VM-61 and VM-60 are the highest IOP contributors in theproduction environment over the last 24 hours.
45. Select the Gear icon to further modify the chart options for the newly created widget.
45
Figure 3-133:
This complete the lab exercises
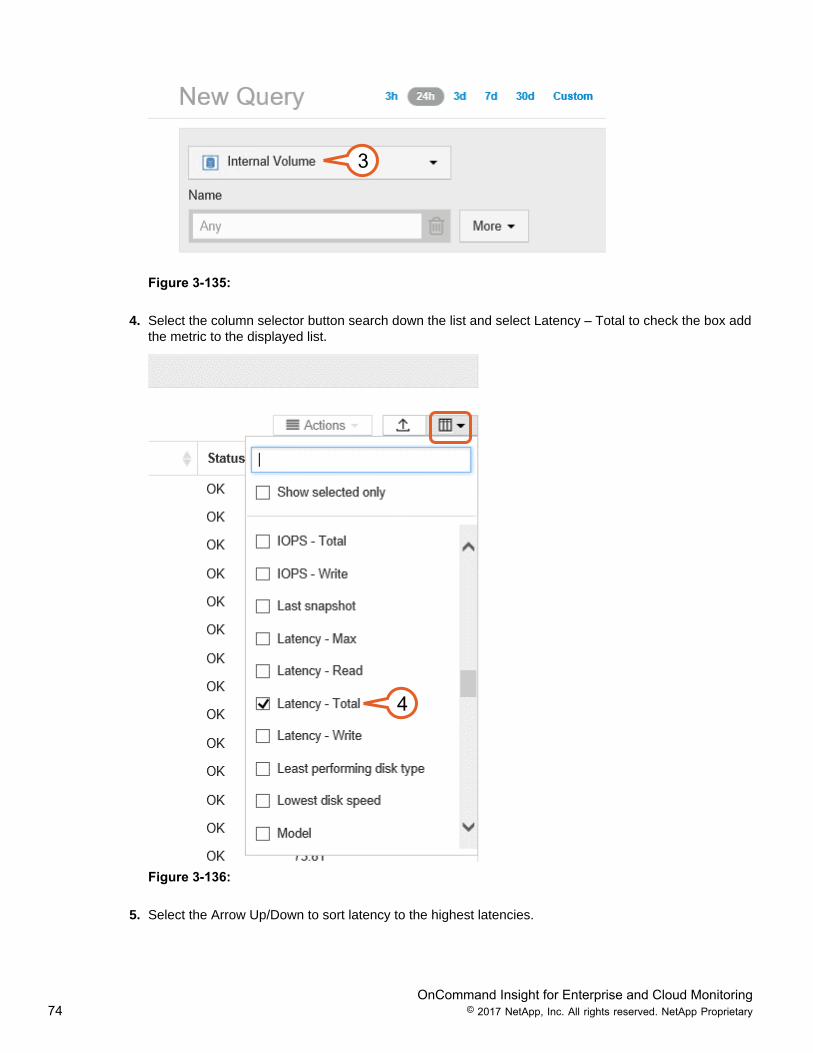
3.8 Discovering NFS Clients Impacting Internal Volume LatencyThe following exercise details how to quickly determine the top NFSv3 contributors driving Internal volume(flexvol) activity. OnCommand Insights Ethernet monitoring technology provides optional visibility into the topNFSv3 contributes potentially saving organization days or even months in the identification of undesirable NFSactivity.
1. When prompted, enter the user name admin , password admin123 , and click Login. There can be abrief wait while the system comes up.
1
Figure 3-134:
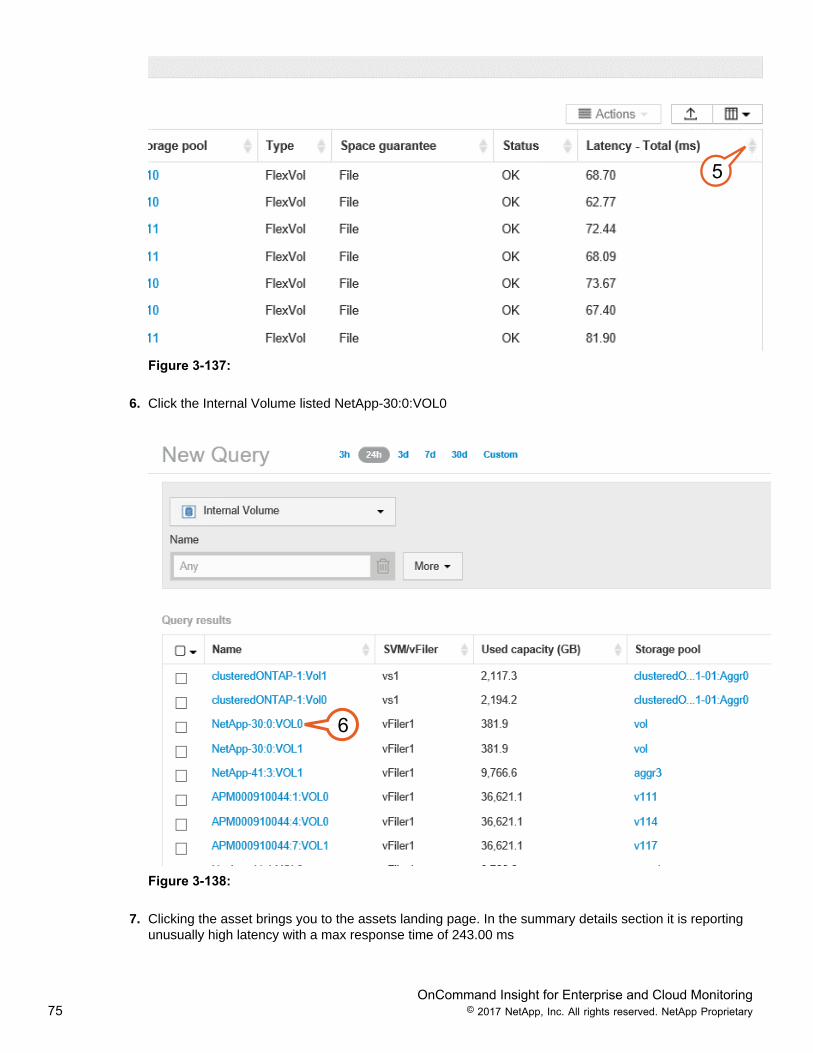
2. On the top menu bar of the “Asset Dashboard” landing page, click Queries and create a new query3. Select Internal volume from the drop down object listing
OnCommand Insight for Enterprise and Cloud Monitoring74 © 2017 NetApp, Inc. All rights reserved. NetApp Proprietary
3
Figure 3-135:
4. Select the column selector button search down the list and select Latency – Total to check the box addthe metric to the displayed list.
4
Figure 3-136:
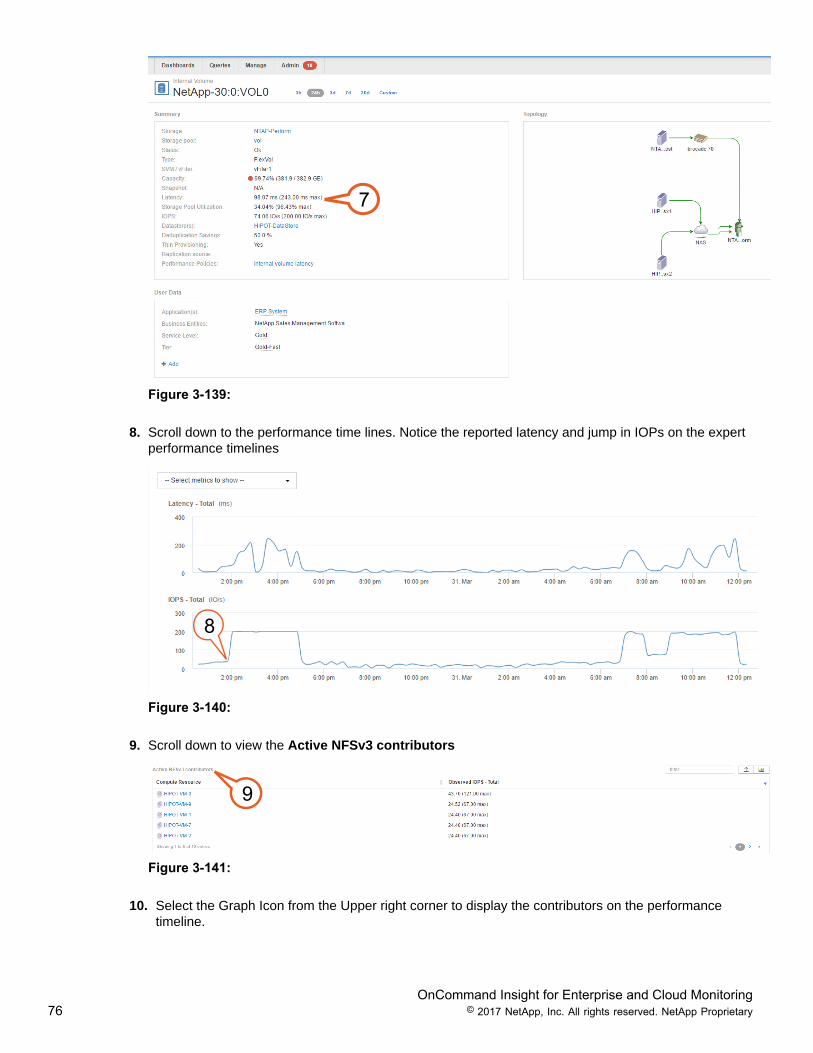
5. Select the Arrow Up/Down to sort latency to the highest latencies.
OnCommand Insight for Enterprise and Cloud Monitoring75 © 2017 NetApp, Inc. All rights reserved. NetApp Proprietary
5
Figure 3-137:
6. Click the Internal Volume listed NetApp-30:0:VOL0
6
Figure 3-138:
7. Clicking the asset brings you to the assets landing page. In the summary details section it is reportingunusually high latency with a max response time of 243.00 ms
OnCommand Insight for Enterprise and Cloud Monitoring76 © 2017 NetApp, Inc. All rights reserved. NetApp Proprietary
7
Figure 3-139:
8. Scroll down to the performance time lines. Notice the reported latency and jump in IOPs on the expertperformance timelines
8
Figure 3-140:
9. Scroll down to view the Active NFSv3 contributors
9
Figure 3-141:
10. Select the Graph Icon from the Upper right corner to display the contributors on the performancetimeline.
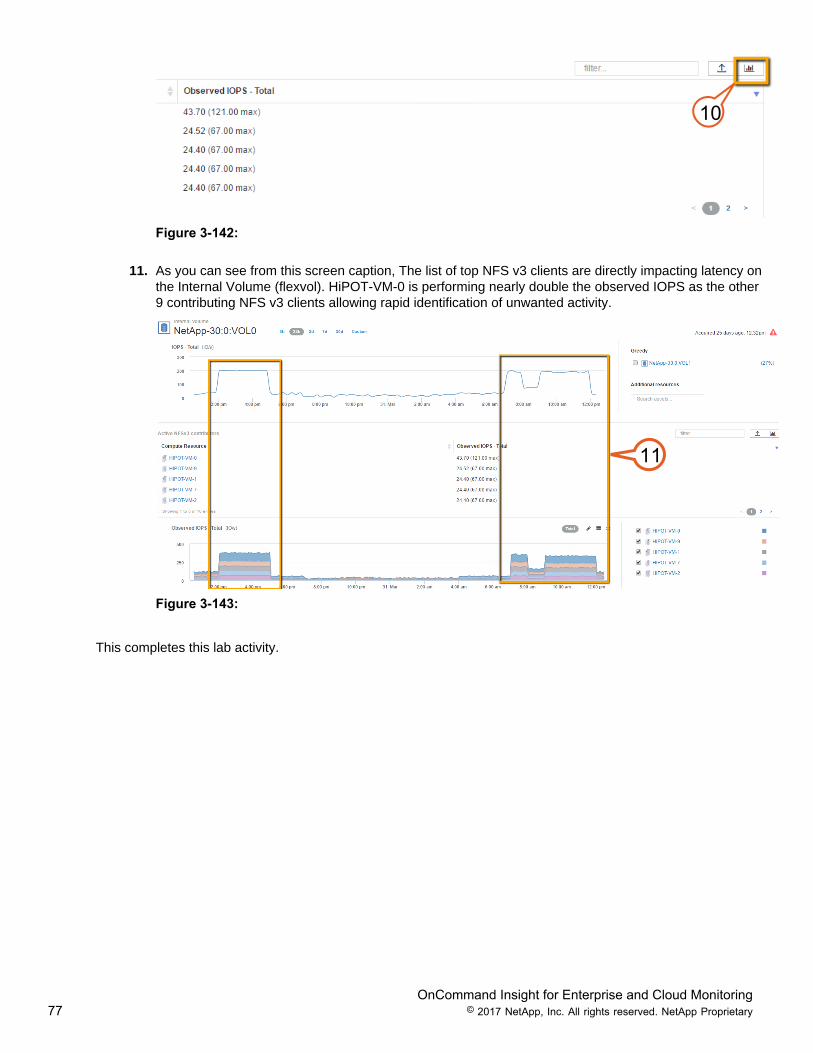
OnCommand Insight for Enterprise and Cloud Monitoring77 © 2017 NetApp, Inc. All rights reserved. NetApp Proprietary
10
Figure 3-142:
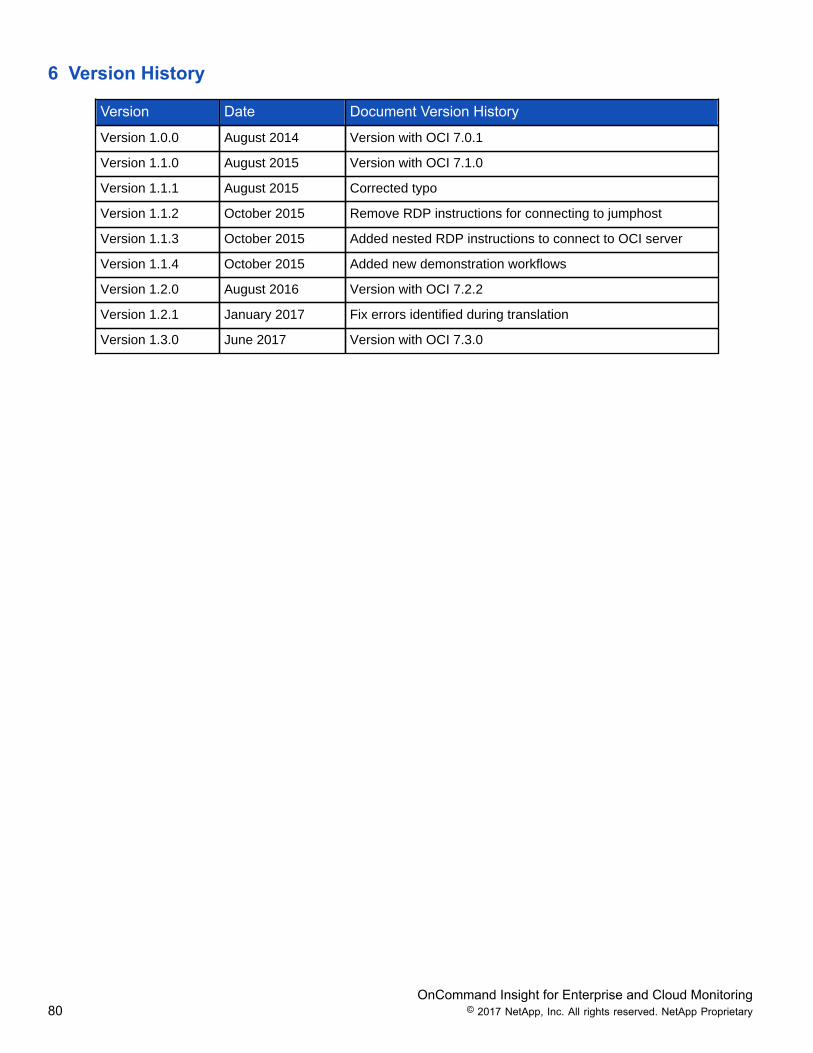
11. As you can see from this screen caption, The list of top NFS v3 clients are directly impacting latency onthe Internal Volume (flexvol). HiPOT-VM-0 is performing nearly double the observed IOPS as the other9 contributing NFS v3 clients allowing rapid identification of unwanted activity.
11
Figure 3-143:
This completes this lab activity.

OnCommand Insight for Enterprise and Cloud Monitoring78 © 2017 NetApp, Inc. All rights reserved. NetApp Proprietary
4 Lab LimitationsThe OnCommand Insight Lab on Demand, and its corresponding violations, capacity, and performance metricshave been manually populated to represent the scalability, interoperability and service quality capabilities ofthe OnCommand Insight. Values are fictitious to generate desired scenarios and outcomes, and have no actualbearing of the actual vendor, or device capabilities. Not all areas of the product are populated with capacity andperformance in this lab, and you should not assume it’s a result of OnCommand Insight inability to collect thedata.

OnCommand Insight for Enterprise and Cloud Monitoring79 © 2017 NetApp, Inc. All rights reserved. NetApp Proprietary
5 References• Customer Resources
• http://www.netapp.com/us/products/management-software/oncommand-insight/• Customer Community
• http://community.netapp.com/t5/OnCommand-Storage-Management-Software-Discussions/bd-p/oncommand-storage-management-software-discussions
OnCommand Insight for Enterprise and Cloud Monitoring80 © 2017 NetApp, Inc. All rights reserved. NetApp Proprietary
6 Version History
Version Date Document Version History
Version 1.0.0 August 2014 Version with OCI 7.0.1
Version 1.1.0 August 2015 Version with OCI 7.1.0
Version 1.1.1 August 2015 Corrected typo
Version 1.1.2 October 2015 Remove RDP instructions for connecting to jumphost
Version 1.1.3 October 2015 Added nested RDP instructions to connect to OCI server
Version 1.1.4 October 2015 Added new demonstration workflows
Version 1.2.0 August 2016 Version with OCI 7.2.2
Version 1.2.1 January 2017 Fix errors identified during translation
Version 1.3.0 June 2017 Version with OCI 7.3.0
Refer to the Interoperability Matrix Tool (IMT) on the NetApp Support site to validate that the exactproduct and feature versions described in this document are supported for your specific environment.The NetApp IMT defines the product components and versions that can be used to constructconfigurations that are supported by NetApp. Specific results depend on each customer's installation inaccordance with published specifications.
NetApp provides no representations or warranties regarding the accuracy, reliability, or serviceability of anyinformation or recommendations provided in this publication, or with respect to any results that may be obtainedby the use of the information or observance of any recommendations provided herein. The information in thisdocument is distributed AS IS, and the use of this information or the implementation of any recommendations ortechniques herein is a customer’s responsibility and depends on the customer’s ability to evaluate and integratethem into the customer’s operational environment. This document and the information contained herein may beused solely in connection with the NetApp products discussed in this document.
Go further, faster®
© 2017NetApp, Inc. All rights reserved. No portions of this document may be reproduced without prior written consentof NetApp, Inc. Specifications are subject to change without notice. NetApp, the NetApp logo, Data ONTAP®,ONTAP®, OnCommand®, SANtricity®, FlexPod®, SnapCenter®, and SolidFire® are trademarks or registeredtrademarks of NetApp, Inc. in the United States and/or other countries. All other brands or products are trademarks orregistered trademarks of their respective holders and should be treated as such.


