Carnegie Mellon Potential of Hydro Power and Storage for the Integration of Wind Generation CMU Electricity Conference March 9th, 2011 Gabriela Hug Gabriela Hug Assistant Professor [email protected]1
Transcript
Carnegie Mellon
Potential of Hydro Power and Storage for the Integration of Wind Generation
O tliOutline• Introduction• Control Concept & Modeling• Case 1: Wind and Run-of River Power Plants• Case 2: Generation/Storage DispatchCase 2: Generation/Storage Dispatch• Conclusions
2
Carnegie Mellon
I t d tiIntroduction• Goal
– up to 20% wind penetration by 2030
• Challenges:Challenges:– Intermittency and variability– Missing infrastructure
Run-of River Power Plant Storage Power Plant Pumped Hydro Power Plant
4
Carnegie Mellon
O tliOutline• Introduction• Control Concept & Modeling• Case 1: Wind and Run-of River Power Plants• Case 2: Generation/Storage DispatchCase 2: Generation/Storage Dispatch• Conclusions
5
Carnegie Mellon
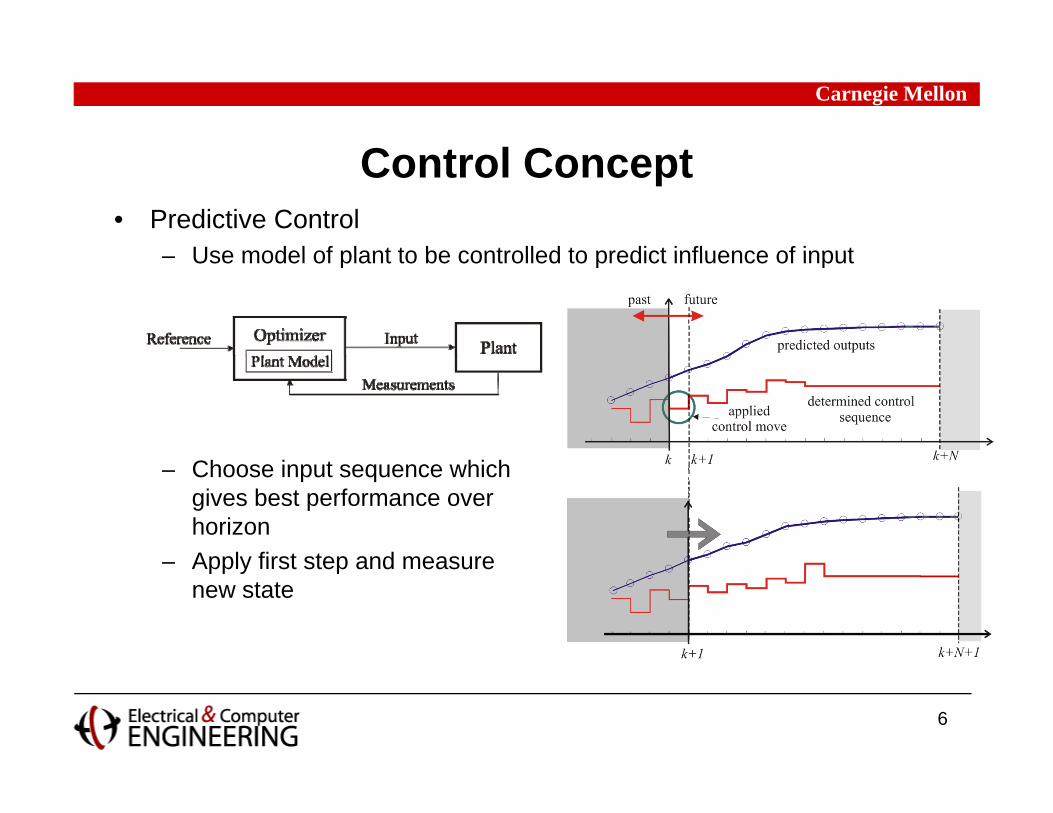
C t l C tControl Concept• Predictive Control
Use model of plant to be controlled to predict influence of input– Use model of plant to be controlled to predict influence of input
– Choose input sequence which gives best performance over horizonApply first step and measure– Apply first step and measure new state
6
Carnegie Mellon
M d li StModeling: Storage• Storage
Limits on – Storage size– Charging and
discharging rateNo simultaneous charging and discharging
7
Carnegie Mellon
M d li H d P• Pumped Hydro Power Plant
Modeling: Hydro Power
• Storage Power Plantg
)(kQIS
)(1 kPOS⋅
β
8
Carnegie Mellon
M d li H d P• Run-of River Power Plant
Modeling: Hydro Power
– Retention differentiates a river from a tank
– Goal:• Minimize discharge variations• Minimize deviations of water levels from reference value (and keep within
limits)
9
Carnegie Mellon
M d li H d PModeling: Hydro Power• Saint Venant Equations
=> dependency between water discharge and water level at each individual point in the river=> Linearization and discretization in time and space
• Dependency between discharge and electric power
10
Carnegie Mellon
M d li G ti d L dModeling: Generation and Load• Conventional Generation
– Capacity limit– Ramp rate
• Intermittent Generation– Predictions of output available– Allow curtailmentAllow curtailment
• LoadPredictions of demand available– Predictions of demand available
– Allow demand control
11
Carnegie Mellon
O tliOutline• Introduction• Control Concept & Modeling• Case 1: Wind and Run-of River Power Plants• Case 2: Generation/Storage DispatchCase 2: Generation/Storage Dispatch• Conclusions
12
Carnegie Mellon
C 1 Wi d d R f Ri Pl t• Objective Function
Case 1: Wind and Run-of River Plants
minimize discharge changes
• ConstraintsRi fl d l
minimize level deviations
smoothen wind power
– River flow model– Constraints on water level and turbine/weir discharges
13
Carnegie Mellon
C 1 T t S tCase 1: Test System• Cascade of four run of river power plants (20km apart)
O tliOutline• Introduction• Control Concept & Modeling• Case 1: Wind and Run-of River Power Plants• Case 2: Generation/Storage DispatchCase 2: Generation/Storage Dispatch• Conclusions
17
Carnegie Mellon
C 2 G ti /St Di t hCase 2: Generation/Storage Dispatch• Economic Objectives
Case 2: Simulation ResultsCase 2: Simulation Results
21
Carnegie Mellon
C 2 Si l ti R ltCase 2: Simulation Results
22
Carnegie Mellon
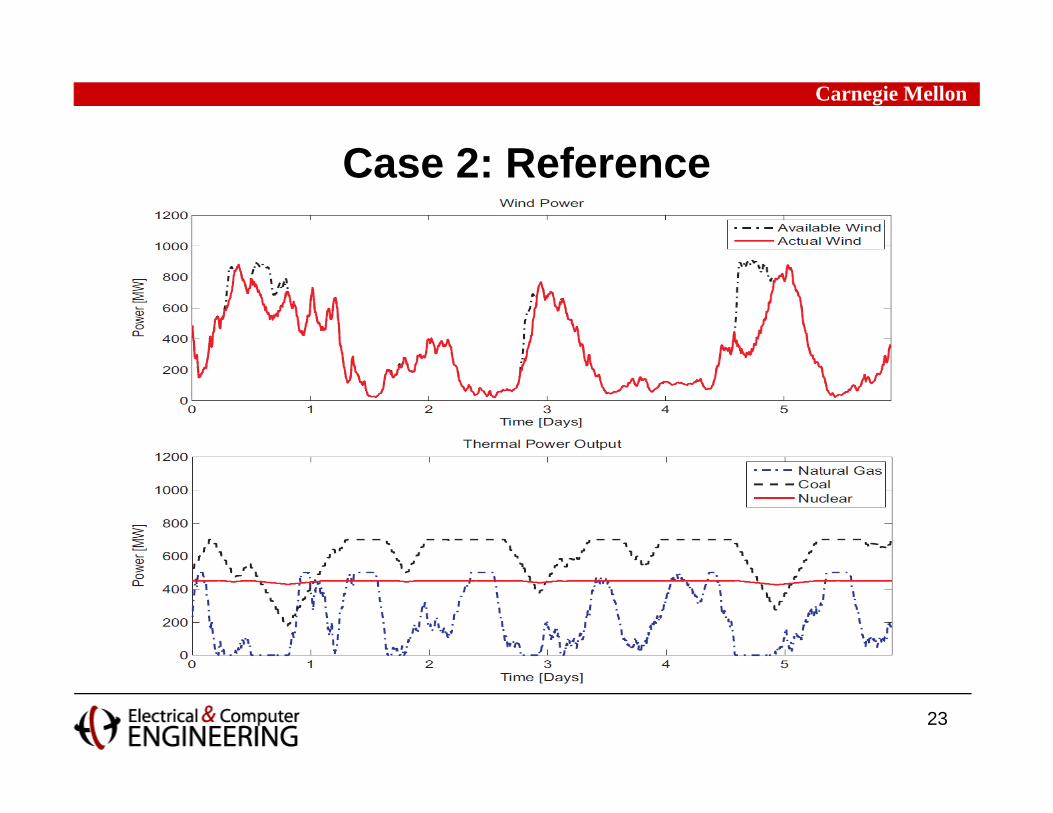
C 2 R fCase 2: Reference
23
Carnegie Mellon
C 2 R fCase 2: Reference
24
Carnegie Mellon
C 2 Si l ti R ltCase 2: Simulation Results
25
Carnegie Mellon
C 2 Si l ti R ltCase 2: Simulation Results
26
Carnegie Mellon
C l iConclusions• Electric power systems field is currently in a major transition
⇒ Major challenges need to be resolved• Predictive control allows for full exploitation of device potentials• Storage reduces need for fast-ramping backup generation and requiredStorage reduces need for fast ramping backup generation and required
ramp rates if optimally controlled• Existing hydro power provides storage capacity• Coordination achieves overall optimal performanceCoordination achieves overall optimal performance• Integration of intermittent renewable generation asks for hybrid solution
27
Carnegie Mellon
28
Carnegie Mellon
C ti l H d PConventional Hydro Power100%
60%
70%
80%
90%
30%
40%
50%
60%
0%
10%
20%
29
Carnegie Mellon
M d li H d PModeling: Hydro Power• Linear Model
– River Flow
– Discharge to Electric Power
30
Carnegie Mellon
C 1 Si l ti R ltCase 1: Simulation Results• Smoothness of Total Power Output
31
Carnegie Mellon
C 2 G ti /St Di t hCase 2: Generation/Storage Dispatch• Objective Function