61
Poverty Maps of Sub-districts and Villages in Kota Pekalongan (Based on CBMS Database 2008-2009) The SMERU Research Institute Indonesia

Poverty Maps of Sub-districts and Villages in Kota Pekalongan(Based on CBMS Database
2008-2009)
The SMERU Research InstituteIndonesia

Administrative Level
Sub-District (Kecamatan)
Regencies (Kabupaten) and Cities (Kota)
Province
Village (Desa and Kelurahan)
Household
Rw* (local administration)
Rt** (neighborhood unit)
*unit of local administration consisting of several RT
**Neighborhood unit, consist of a number of households

List of Poverty IndicatorsIndicators Definition
1. Proportion of households with poor eating habits Proportion of households who eat less than three times a day
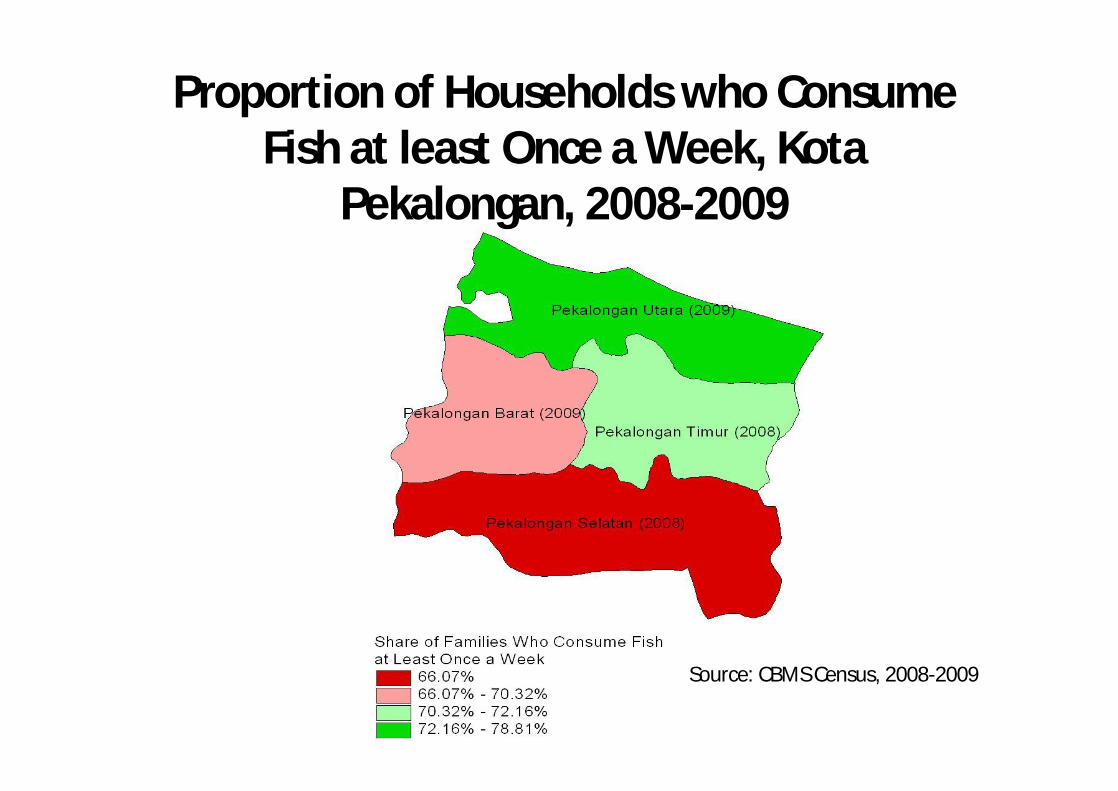
2. Proportion of households with poor dietary intake Proportion of households who consume meat, fish, egg, and milk at least once a week
3. Proportion of households with poor cooking fuel Proportion of households who use firewood or coal
4. Proportion of households with poor floor types Proportion of households with bamboo or dirt type of floor
5. Proportion of households without house ownership Proportion of households who do not own house
6. Proportion of households with poor lighting source
Proportion of households who use Non-PLN, wall lamp/oil lamp or kerosene lamp
7. Proportion of households without toilet ownership Proportion of households who do not have toilet

Indicators Definition
8. Proportion of households with poor drinking water source
Proportion of households who drink water from Public well, river water/rainfall water orunprotected well
9. Proportion of Households with poor access to formal financial institution
Proportion of households who borrow money from informal institution or do not have savings account in formal institution
10. Proportion of households with poor financial Proportion of households who sell assets to pay heavy debt
11. Proportion of households with low educated household head
Proportion of households with household head who never attended school, did not finish primary schoolor finish primary school
List of Poverty Indicators

Proportion of Households with Poor Eating Habits, Kota Pekalongan, 2008-2009
Source: CBMS Census, 2008-2009

Proportion of Households who Consume Meat at least Once a Week, Kota Pekalongan,
2008-2009
Source: CBMS Census, 2008-2009
Source: CBMS Census, 2008-2009
Proportion of Households who Consume Fish at least Once a Week, Kota
Pekalongan, 2008-2009

Source: CBMS Census, 2008-2009
Proportion of Households who Consume Milk at least Once a Week, Kota
Pekalongan, 2008-2009

Source: CBMS Census, 2008-2009
Proportion of Households who Consume Egg at least Once a Week, Kota Pekalongan,
2008-2009

Source: CBMS Census, 2008-2009
Proportion of Households who use Firewood for Cooking, Kota Pekalongan,
2008-2009

Proportion of Households who use Coal for Cooking, Kota Pekalongan, 2008-2009
Source: CBMS Census, 2008-2009

Proportion of Households who use Electricty for Cooking, Kota Pekalongan,
2008-2009
Source: CBMS Census, 2008-2009

Proportion of Households who use Kerosene for Cooking, Kota Pekalongan,
2008-2009
Source: CBMS Census, 2008-2009

Proportion of Households who use Gas or LPG for Cooking, Kota Pekalongan,
2008-2009
Source: CBMS Census, 2008-2009

Proportion of Households with Bamboo Floor, Kota Pekalongan, 2008-2009
Source: CBMS Census, 2008-2009

Proportion of Households with Dirt Floor, Kota Pekalongan, 2008-2009
Source: CBMS Census, 2008-2009
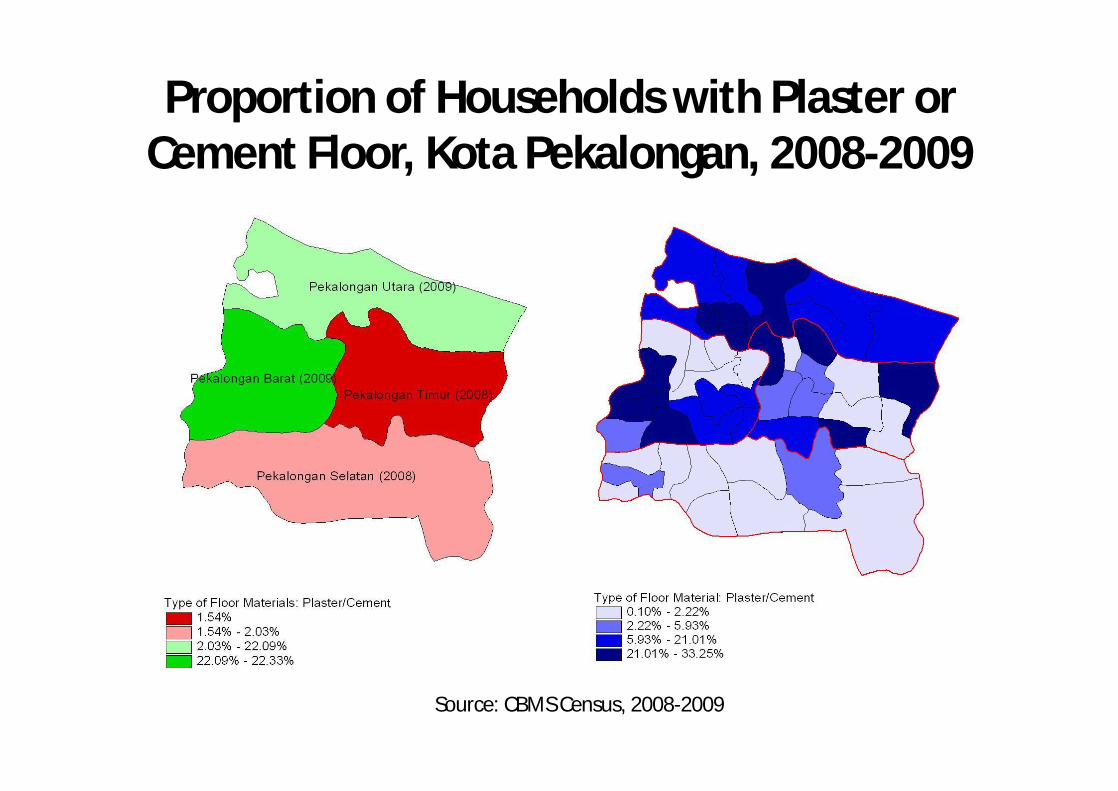
Proportion of Households with Plaster or Cement Floor, Kota Pekalongan, 2008-2009
Source: CBMS Census, 2008-2009

Proportion of Households with Marbles/Ceramic/Terrazo Floor, Kota
Pekalongan, 2008-2009
Source: CBMS Census, 2008-2009

Proportion of Households with Tiled Floor, Kota Pekalongan, 2008-2009
Source: CBMS Census, 2008-2009

Proportion of Households with Wooden Floor, Kota Pekalongan, 2008-2009
Source: CBMS Census, 2008-2009

Source: CBMS Census, 2008-2009
Proportion of Households living Relative’s House, Kota Pekalongan,
2008-2009

Proportion of Households living in Government Housing, Kota Pekalongan,
2008-2009
Source: CBMS Census, 2008-2009

Source: CBMS Census, 2008-2009
Proportion of Households living in Inherited Land not yet Divided in, Kota
Pekalongan, 2008-2009

Proportion of Households living in Own House, Kota Pekalongan, 2008-2009
Source: CBMS Census, 2008-2009

Proportion of Households living in Rented House, Kota Pekalongan, 2008-2009
Source: CBMS Census, 2008-2009

Proportion of Households Living with Another Family in the House, Kota
Pekalongan, 2008-2009
Source: CBMS Census, 2008-2009

Proportion of Households who use Generator Set as Source of Light, Kota
Pekalongan, 2008-2009
Source: CBMS Census, 2008-2009

Proportion of Households who use Wall or Oil Lamp as Source of Light, Kota
Pekalongan, 2008-2009
Source: CBMS Census, 2008-2009

Proportion of Households who use Kerosene Lamp as Source of Light, Kota Pekalongan,
2008-2009
Source: CBMS Census, 2008-2009

Proportion of Households who use PLN as Source of Light, Kota Pekalongan,
2008-2009
Source: CBMS Census, 2008-2009

Proportion of Households who use Another Family’s Toilet, Kota Pekalongan, 2008-2009
Source: CBMS Census, 2008-2009

Proportion of Households who have Own Toilets, Kota Pekalongan, 2008-2009
Source: CBMS Census, 2008-2009

Proportion of Households who use Public Toilets, Kota Pekalongan, 2008-2009
Source: CBMS Census, 2008-2009

Proportion of Households who Drink Water from River, Kota Pekalongan, 2008-2009
Source: CBMS Census, 2008-2009

Source: CBMS Census, 2008-2009
Proportion of Households who Drink Refilled Bottle, Kota Pekalongan,
2008-2009

Source: CBMS Census, 2008-2009
Proportion of Households who Drink Packaged Bottled Drinking Water, Kota
Pekalongan, 2008-2009

Proportion of Households who Drink Tap Water, Kota Pekalongan, 2008-2009
Source: CBMS Census, 2008-2009

Proportion of Households who Drink Water from Well, Kota Pekalongan, 2008-2009
Source: CBMS Census, 2008-2009

Proportion of Households who Drink Rainwater, Kota Pekalongan, 2008-2009
Source: CBMS Census, 2008-2009

Proportion of Households who Drink Water from Unprotected Well, Kota Pekalongan,
2008-2009
Source: CBMS Census, 2008-2009

Proportion of Households who Drink Water from Protected Well, Kota Pekalongan,
2008-2009
Source: CBMS Census, 2008-2009

Source: CBMS Census, 2008-2009
Proportion of Households with Access to Formal Financial Institutions, Kota
Pekalongan, 2008-2009

Source: CBMS Census, 2008-2009
Proportion of Households who Sold their Assets to Pay Heavy Debt, Kota
Pekalongan, 2008-2009

Source: CBMS Census, 2008-2009
Proportion of Households with Household Heads Never Attended School, Kota
Pekalongan, 2008-2009

Source: CBMS Census, 2008-2009
Proportion of Households with Household Heads who did not Finish Primary School,
Kota Pekalongan, 2008-2009

Source: CBMS Census, 2008-2009
Proportion of Households with Household Heads who Finished Primary School, Kota
Pekalongan, 2008-2009

Proportion of Households with Household Heads who Finished Junior High School,
Kota Pekalongan, 2008-2009
Source: CBMS Census, 2008-2009

Proportion of Households with Household Heads who Finished Senior High School and
Higher Education, Kota Pekalongan, 2008-2009
Source: CBMS Census, 2008-2009

Location Map of Pasirsari in Pekalongan Barat
Kecamatan(Subdistrict): Pekalongan BaratKelurahan(Village): PasirsariRw: 006Rt: 03
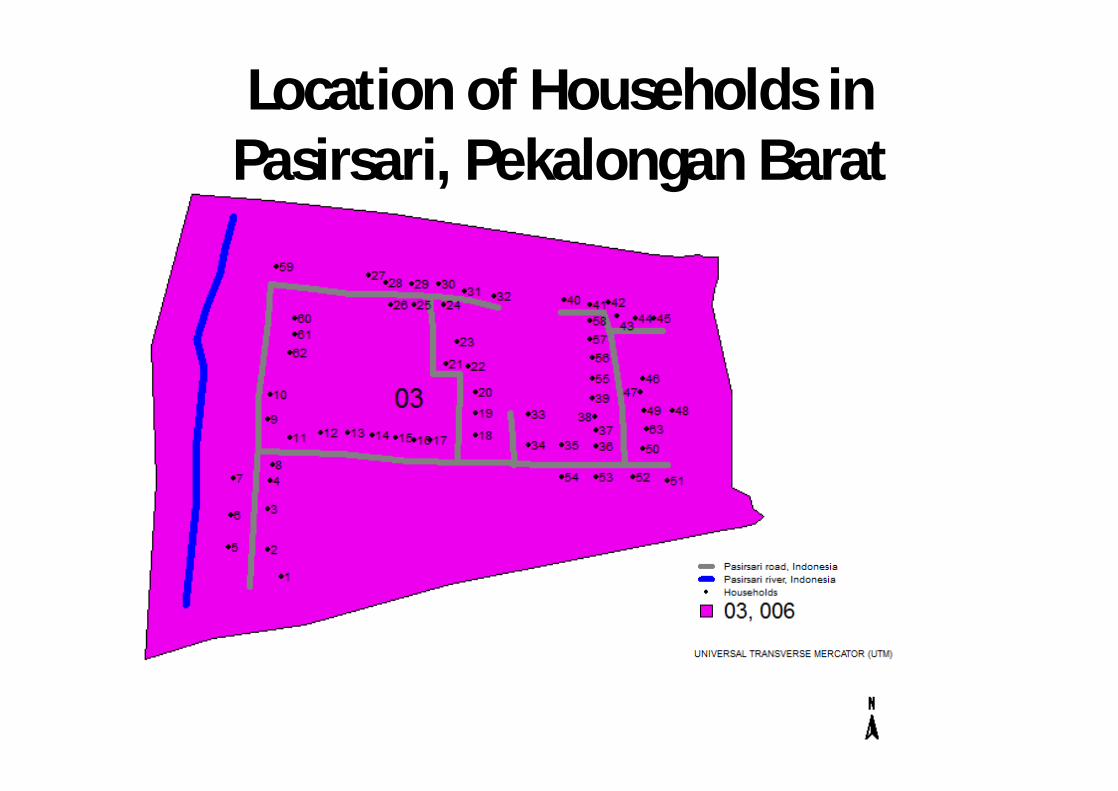
Location of Households in Pasirsari, Pekalongan Barat

Location of Households with Poor Eating Habit in Kota Pekalongan, 2008-2009
Source: CBMS Census, 2008-2009

Location of Households with Poor Dietary Intake, Kota Pekalongan, 2008-2009
Source: CBMS Census, 2008-2009

Location of Households with Poor Cooking Fuel, Kota Pekalongan, 2008-2009
Source: CBMS Census, 2008-2009

Location of Households with Poor Floor Types, Kota Pekalongan, 2008-2009
Source: CBMS Census, 2008-2009

Location of Households without Own House, Kota Pekalongan, 2008-2009
Source: CBMS Census, 2008-2009

Location of Households with Poor Lighting Source , Kota Pekalongan, 2008-2009
Source: CBMS Census, 2008-2009

Location of Household without Own Toilet, Kota Pekalongan, 2008-2009
Source: CBMS Census, 2008-2009

Location of Households with Poor Drinking Water Source , Kota Pekalongan, 2008-2009
Source: CBMS Census, 2008-2009

Location of Households with Poor Access to Formal Financial Institution, Kota
Pekalongan, 2008-2009
Source: CBMS Census, 2008-2009

Location of Households who sell assets to pay Heavy Debt, Kota Pekalongan,
2008-2009
Source: CBMS Census, 2008-2009

Location of Households with Low Educated Household Head, Kota Pekalongan,
2008-2009
Source: CBMS Census, 2008-2009


