18
2
2015 PBMAS:
Important Dates
• Masked (confidential reports):
– Posted to TEASE August 7, 2015
• Unmasked (public reports):
– Projected to be posted to TEA website
September 18, 2015
• Staging and LEA Determinations
(confidential):
– Projected to be posted to ISAM
September 18, 2015
ESC-20 PBMAS Training
• Texas Accountability Intervention System
(TAIS) Training for PBMAS
– Anticipated dates:
• October 14, 2015
– Workshop #: CP151014-H01
– Cost: Free
• October 22, 2015
– Workshop #: CP151022-H01
– Cost: Free
• These sessions will be repeats.
3
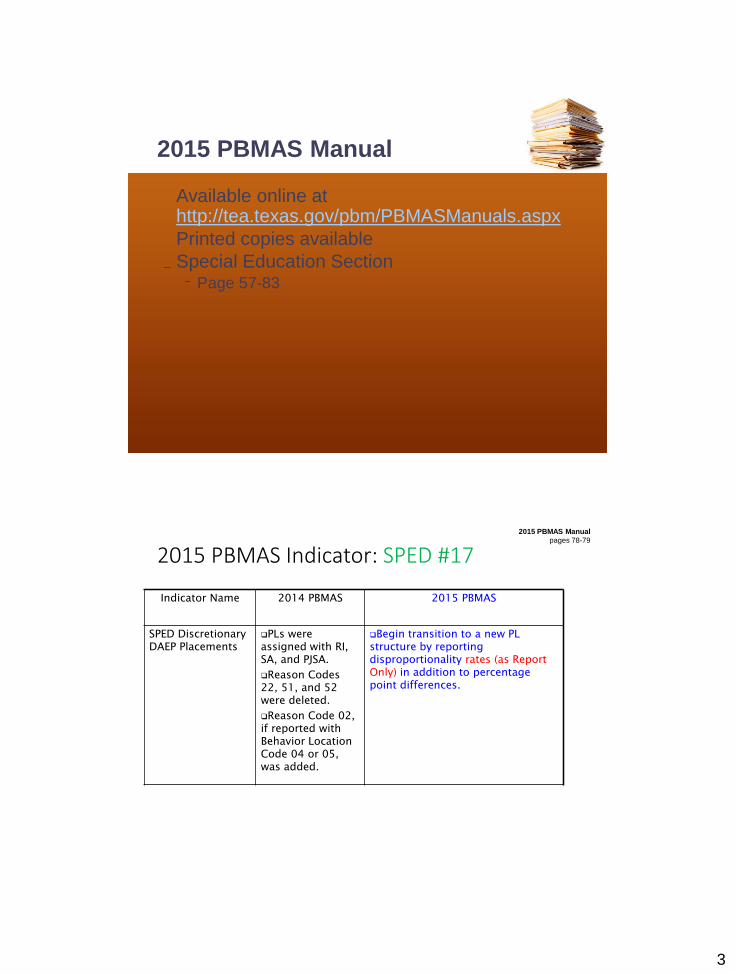
Available online at http://tea.texas.gov/pbm/PBMASManuals.aspx
Printed copies available
Special Education SectionPage 57-83
2015 PBMAS Manual
2015 PBMAS Indicator: SPED #17
Indicator Name 2014 PBMAS 2015 PBMAS
SPED Discretionary DAEP Placements
PLs were assigned with RI, SA, and PJSA.
Reason Codes 22, 51, and 52 were deleted.
Reason Code 02, if reported with Behavior Location Code 04 or 05, was added.
Begin transition to a new PL structure by reporting disproportionality rates (as Report Only) in addition to percentage point differences.
2015 PBMAS Manual
pages 78-79

4
2015 PBMAS Indicator Preview: SPED #18-19Indicator Name 2014 PBMAS 2015 PBMAS
SPED Discretionary ISS Placements
PLs were assigned with RI, SA, and PJSA.
Begin transition to a new PL structure by reporting disproportionality rates (as Report Only) in addition to percentage point differences.
SPED Discretionary OSS Placements
PLs were assigned with RI, SA, and PJSA.
Begin transition to a new PL structure by reporting disproportionality rates (as Report Only) in addition to percentage point differences.
2015 PBMAS Manual
ISS - pages 80-81
OSS - pages 82-83
• The original expectation was that focusing on
percentage point differences (DIFF) would encourage
districts, regardless of PL assignment, to address issues
of disproportionality, but this has not typically been the
case.
• Focusing on percentage point differences may have
given some districts the impression they do not have
disproportionate discipline placements, when they
actually do.
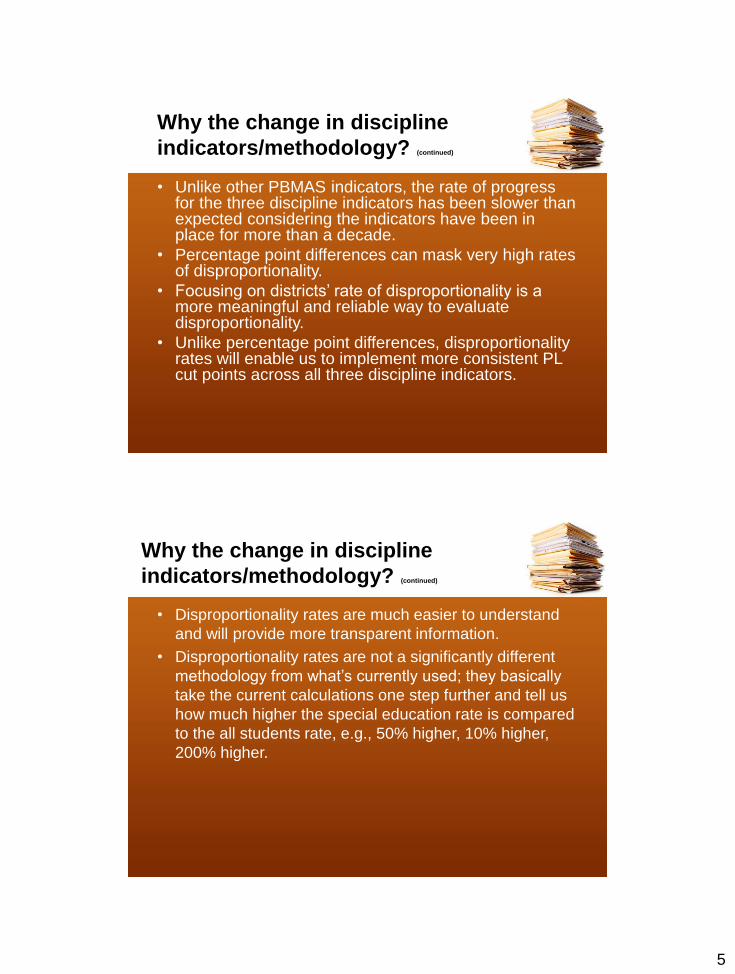
Why the change in discipline
indicators/calculations?
5
• Unlike other PBMAS indicators, the rate of progress for the three discipline indicators has been slower than expected considering the indicators have been in place for more than a decade.
• Percentage point differences can mask very high rates of disproportionality.
• Focusing on districts’ rate of disproportionality is a more meaningful and reliable way to evaluate disproportionality.
• Unlike percentage point differences, disproportionality rates will enable us to implement more consistent PL cut points across all three discipline indicators.
Why the change in discipline
indicators/methodology? (continued)
• Disproportionality rates are much easier to understand
and will provide more transparent information.
• Disproportionality rates are not a significantly different
methodology from what’s currently used; they basically
take the current calculations one step further and tell us
how much higher the special education rate is compared
to the all students rate, e.g., 50% higher, 10% higher,
200% higher.
Why the change in discipline
indicators/methodology? (continued)

6
• This will, however, be a significant change for some districts who
may not have undertaken a detailed enough data analysis to
understand what their percentage point differences were actually
telling them about the extent of disproportionality in their
discipline placements.
• The new PL structure is scheduled to be implemented with the
2017 PBMAS.
Why the change in discipline
indicators/methodology? (continued)
⚫Sample District Report – page 7
2015 PBMAS
Sample District Report
Difference Rate (“Original” Methodology &
Current Staging)
Disproportionality Rate (“New” Methodology &
Future (2017) Staging – Currently Report Only)
7
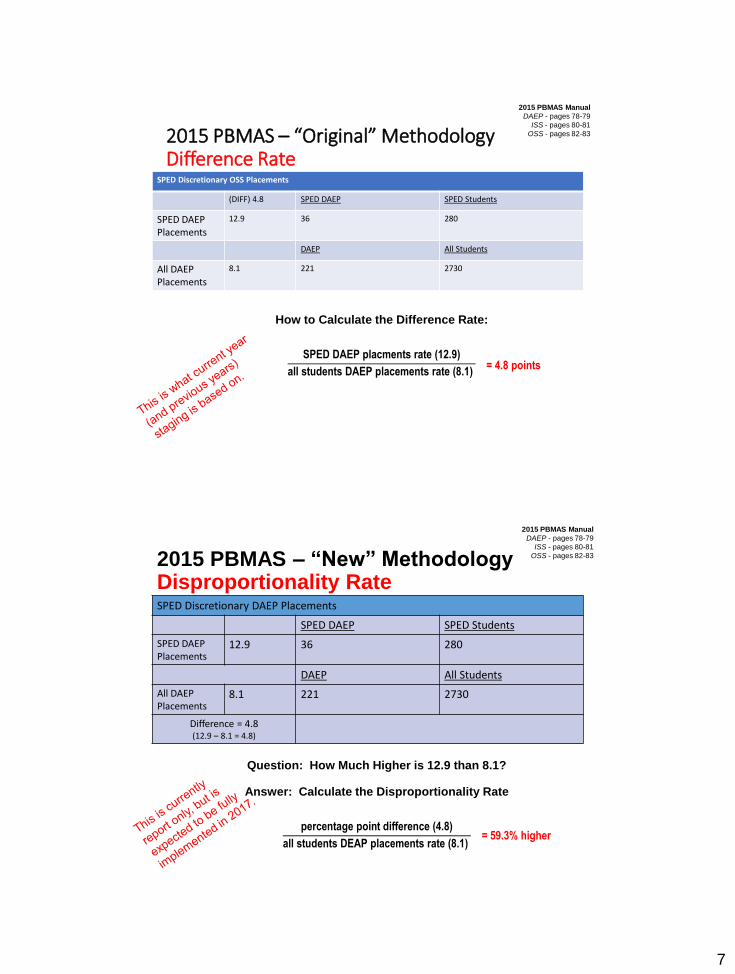
2015 PBMAS – “Original” MethodologyDifference Rate
SPED Discretionary OSS Placements
(DIFF) 4.8 SPED DAEP SPED Students
SPED DAEP Placements
12.9 36 280
DAEP All Students
All DAEPPlacements
8.1 221 2730
= 4.8 points
2015 PBMAS Manual
DAEP - pages 78-79
ISS - pages 80-81
OSS - pages 82-83
How to Calculate the Difference Rate:
SPED DAEP placments rate (12.9)
all students DAEP placements rate (8.1)
2015 PBMAS – “New” MethodologyDisproportionality RateSPED Discretionary DAEP Placements
SPED DAEP SPED Students
SPED DAEP Placements
12.9 36 280
DAEP All Students
All DAEP Placements
8.1 221 2730
Difference = 4.8(12.9 – 8.1 = 4.8)
= 59.3% higher
2015 PBMAS Manual
DAEP - pages 78-79
ISS - pages 80-81
OSS - pages 82-83
Question: How Much Higher is 12.9 than 8.1?
Answer: Calculate the Disproportionality Rate
percentage point difference (4.8)
all students DEAP placements rate (8.1)
8
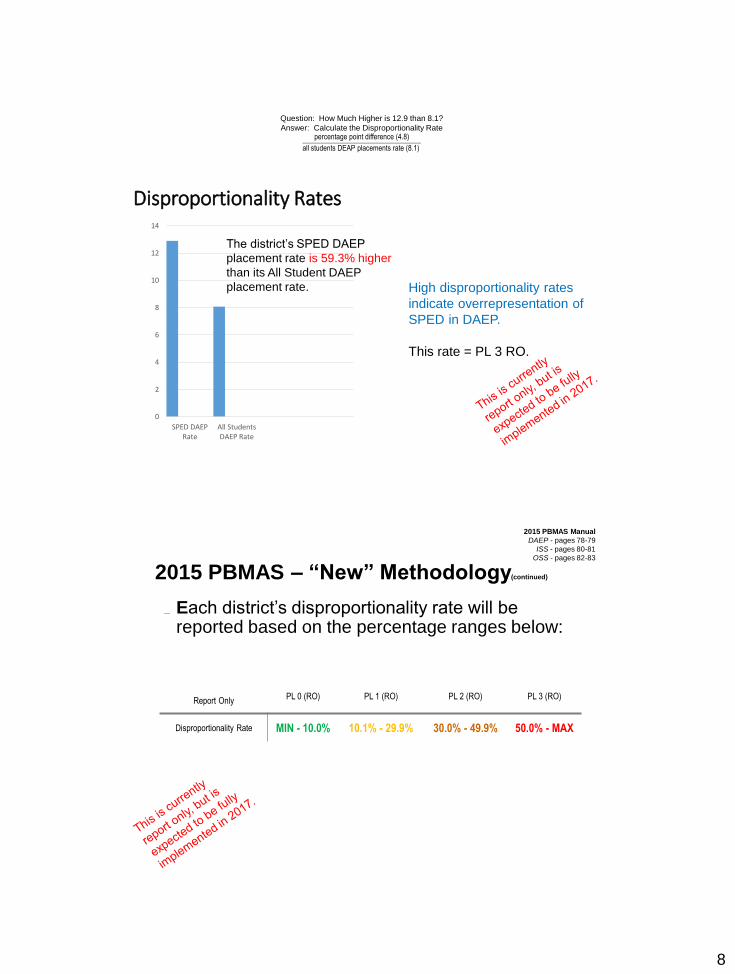
Disproportionality Rates
0
2
4
6
8
10
12
14
SPED DAEPRate
All StudentsDAEP Rate
High disproportionality rates
indicate overrepresentation of
SPED in DAEP.
This rate = PL 3 RO.
The district’s SPED DAEP
placement rate is 59.3% higher
than its All Student DAEP
placement rate.
Question: How Much Higher is 12.9 than 8.1?
Answer: Calculate the Disproportionality Ratepercentage point difference (4.8)
all students DEAP placements rate (8.1)
2015 PBMAS – “New” Methodology(continued)
Each district’s disproportionality rate will be reported based on the percentage ranges below:
Report OnlyPL 0 (RO) PL 1 (RO) PL 2 (RO) PL 3 (RO)
Disproportionality Rate MIN - 10.0% 10.1% - 29.9% 30.0% - 49.9% 50.0% - MAX
2015 PBMAS Manual
DAEP - pages 78-79
ISS - pages 80-81
OSS - pages 82-83
9
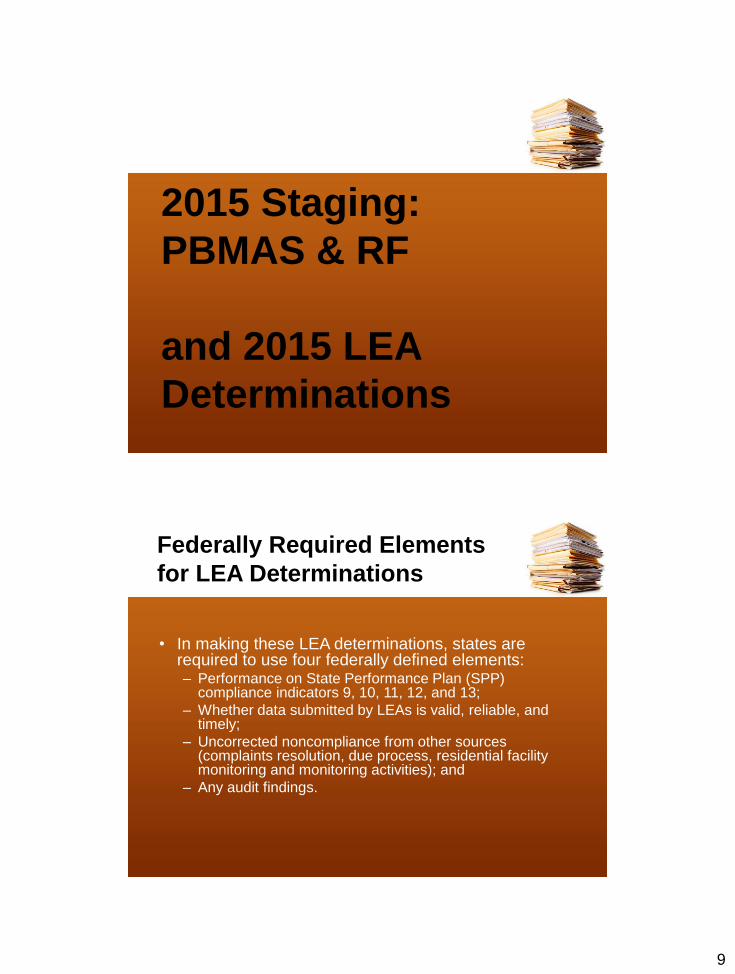
2015 Staging:
PBMAS & RF
and 2015 LEA
Determinations
Federally Required Elements
for LEA Determinations
• In making these LEA determinations, states are required to use four federally defined elements:– Performance on State Performance Plan (SPP)
compliance indicators 9, 10, 11, 12, and 13;
– Whether data submitted by LEAs is valid, reliable, and timely;
– Uncorrected noncompliance from other sources (complaints resolution, due process, residential facility monitoring and monitoring activities); and
– Any audit findings.
10
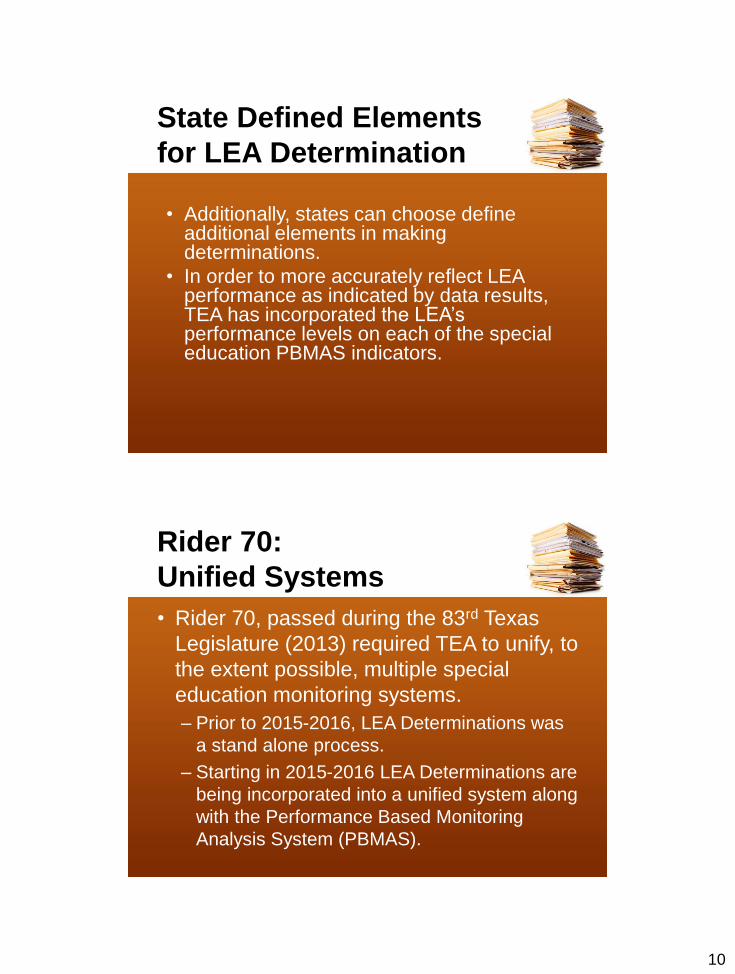
State Defined Elements
for LEA Determination
• Additionally, states can choose define additional elements in making determinations.
• In order to more accurately reflect LEA performance as indicated by data results, TEA has incorporated the LEA’s performance levels on each of the special education PBMAS indicators.
Rider 70:
Unified Systems
• Rider 70, passed during the 83rd Texas
Legislature (2013) required TEA to unify, to
the extent possible, multiple special
education monitoring systems.
– Prior to 2015-2016, LEA Determinations was
a stand alone process.
– Starting in 2015-2016 LEA Determinations are
being incorporated into a unified system along
with the Performance Based Monitoring
Analysis System (PBMAS).

11
Unified Staging
• New in 2015-2016
– Single Staging for:
• LEA Determination
• SPED PBMAS
– No separate staging for RF Monitoring/RF
Tracker
• PBMAS Staging will determine which, if any,
activities an LEA needs to complete for RF
Monitoring
Methodology
• In addition to the performance levels
assigned to each special education
PBMAS indicator, the four federally
required elements will also be assigned
a performance level of 0, 1, 2, or 3.
• The next two slides show the
methodology for assigning performance
levels to the four federally required
elements.

12
LEA Determination PLs
Note: Noncompliance with SPP 11,
12, 13 will also result in a CAP
Failure to certify SPP Data
within timelines (for any SPP Indicator
7,11,12, 13, 14)
LEA Determination PLs (continued)
Note: This includes uncorrected
noncompliance on SPP 11, 12, 13

13
Methodology
• To determine both the PBMAS staging for special education and the LEA determination, TEA will look at the performance levels of the four federal elements and the performance levels of each of the special education PBMAS indicators.
• RF Tracker will NOT have separate indicators or staging.
• TEA will use a matrix that considers the number of high performance levels (typically 2, 3, or 4) assigned to the LEA (on PBMAS indicators and federally required Elements).
• This will result in a single PBMAS staging/LEA determination level, as shown on the following slide.
PBMAS Staging
RF Staging
LEA Determination…Unified Systems
Performance levels on indicators from PBMAS report
+Performance on federally required indicators report
=
SPED Stage of Intervention (PBMAS) and
LEA Determination
No separate RF Staging in 2015
14
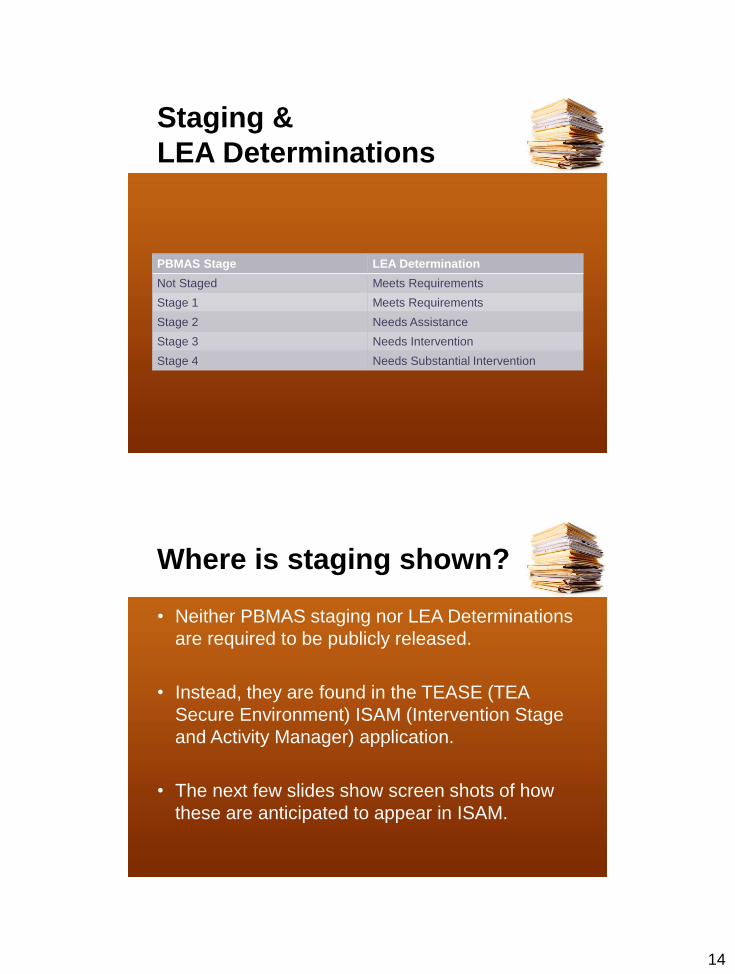
Staging &
LEA Determinations
PBMAS Stage LEA Determination
Not Staged Meets Requirements
Stage 1 Meets Requirements
Stage 2 Needs Assistance
Stage 3 Needs Intervention
Stage 4 Needs Substantial Intervention
Where is staging shown?
• Neither PBMAS staging nor LEA Determinations
are required to be publicly released.
• Instead, they are found in the TEASE (TEA
Secure Environment) ISAM (Intervention Stage
and Activity Manager) application.
• The next few slides show screen shots of how
these are anticipated to appear in ISAM.
15
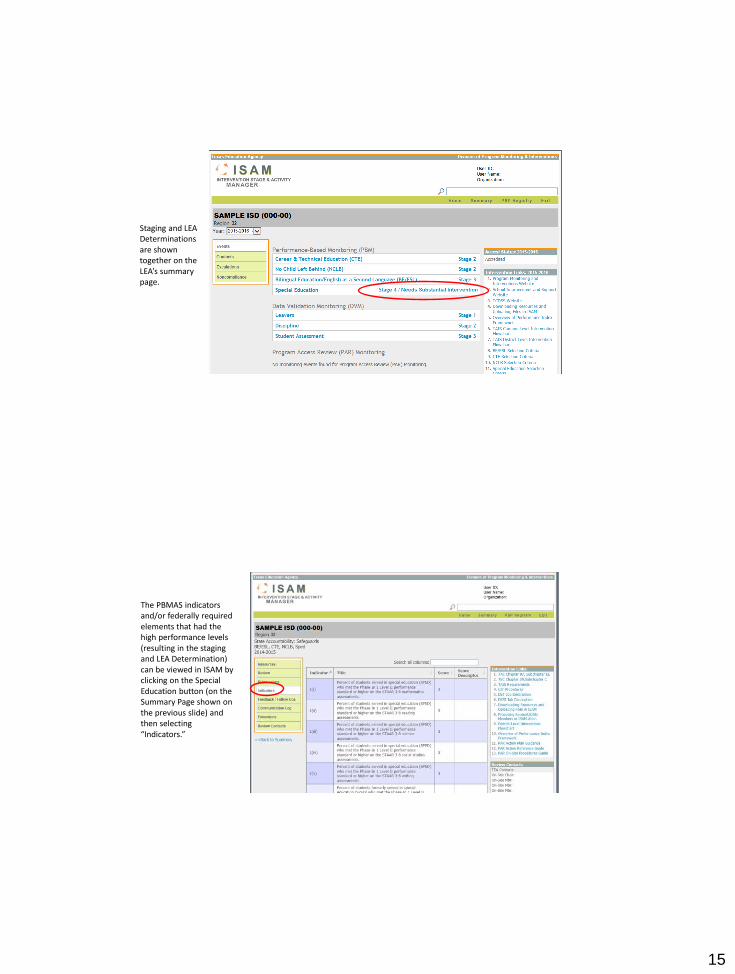
Staging and LEA Determinations are shown together on the LEA’s summary page.
The PBMAS indicators and/or federally required elements that had the high performance levels (resulting in the staging and LEA Determination) can be viewed in ISAM by clicking on the Special Education button (on the Summary Page shown on the previous slide) and then selecting “Indicators.”
16
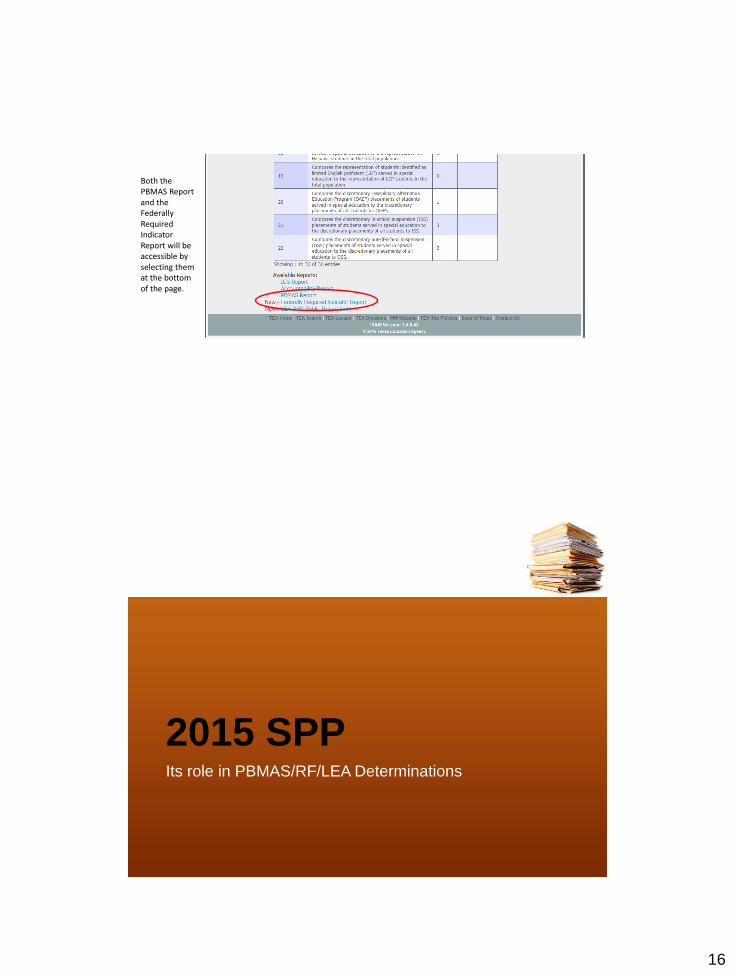
Both the PBMAS Report and the Federally Required Indicator Report will be accessible by selecting them at the bottom of the page.
2015 SPPIts role in PBMAS/RF/LEA Determinations

17
SPP – Noncompliance
Reported
• SPP 11, 12, 13
• SPP Data noncompliance will result in the LEA being given a higher
performance level on LEA Determination federally required element
#1.
• Reminder: This performance level is now used for PBMAS
staging, LEA determination, and in determining any
required RF monitoring activities/submissions.
SPP – Uncorrected
Noncompliance
• Noncompliance lasting longer than one year is considered
uncorrected noncompliance (also called continuing noncompliance).
• This includes (but is not limited to) SPP noncompliance.
• Uncorrected noncompliance will result in the LEA being given a
higher performance level on LEA Determination federally required
element #3.
• Reminder: This performance level is now used for PBMAS staging, LEA
determination, and in determining any required RF monitoring
activities/submissions.
18
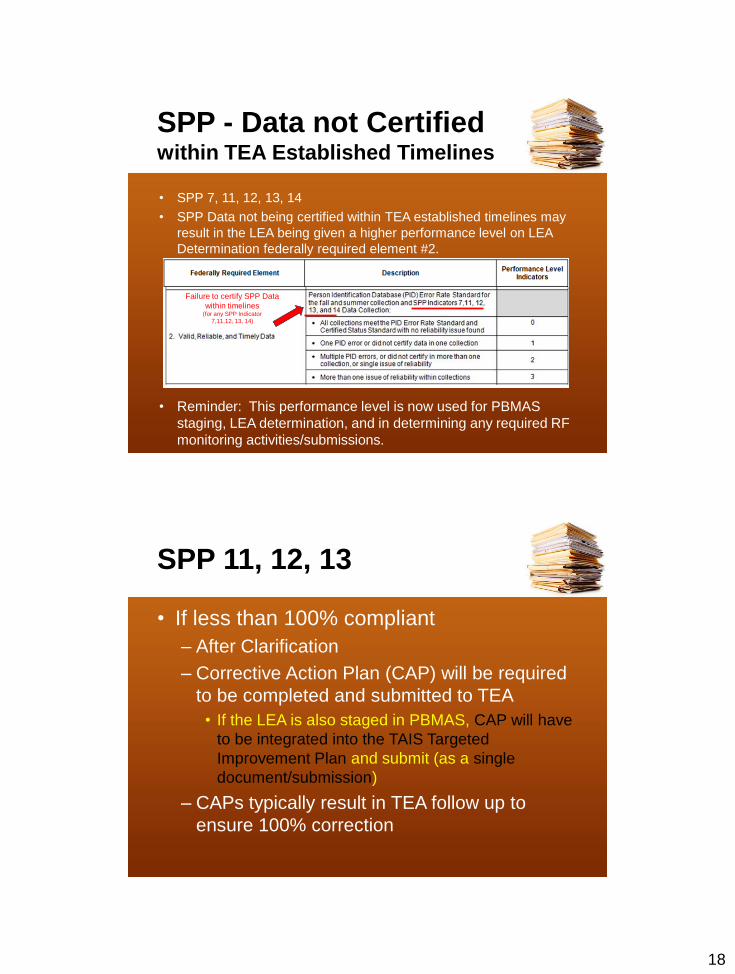
SPP - Data not Certified within TEA Established Timelines
• SPP 7, 11, 12, 13, 14
• SPP Data not being certified within TEA established timelines may
result in the LEA being given a higher performance level on LEA
Determination federally required element #2.
• Reminder: This performance level is now used for PBMAS
staging, LEA determination, and in determining any required RF
monitoring activities/submissions.
Failure to certify SPP Data
within timelines (for any SPP Indicator
7,11,12, 13, 14)
SPP 11, 12, 13
• If less than 100% compliant
– After Clarification
– Corrective Action Plan (CAP) will be required
to be completed and submitted to TEA
• If the LEA is also staged in PBMAS, CAP will have
to be integrated into the TAIS Targeted
Improvement Plan and submit (as a single
document/submission)
– CAPs typically result in TEA follow up to
ensure 100% correction