38


UNIVERSITY OF INDONESIASTUDENT RESEARCH
52 Week Price Range (IDR) Avg. Daily Vol. (Shares)BetaDividend Yield (Est.)Num. of Shares (M Shares)Free FloatMarket Cap. (B IDR)Institutional HoldingsBook Value/Share (IDR)Debt to Total Capital
source: Bloomberg.
840-1,56079,418M
0.861.67%
50,780.0740.03%
69,060.9052.28%146.650.00%
This report is published for educational purposes only by students competing in the
CFA Institute Research Challenge.
Yoseph Eric Santoso
Ruliff Demsy Samuel James Nahusuly
Tegar Iman Susila Victoria Tanjung
just the right dose to takeoff
MARKET PROFILE
source: Bloomberg
PRICE PERFORMANCE
BUY
RATING
ANALYSTS
Price (29/10/13, IDR)12M Target Price (IDR)Upside
1,3301,60020%
[Pharmaceuticals, Consumer Goods]USD/IDR: Rp 11,500
HighlightsThe sovereign drug company in growing industry. Kalbe Farma is the largest listed pharmaceutical company in Southeast Asia. With its well-diversified business portfolios, unmatched distribution network, and market leading brands, we are positive that Kalbe could rise with several growth drivers as follow: 1) The best player in capitalizing on the implementation of USD 2 bn National Healthcare Insurance (NHI) starting 2014, 2) Aggressive business strategy: opening new factory, developing new Regional Distribution Center (RDC), increasing store and product penetration that translate to 15.4% CAGR in total sales until 2018, 3) Increasing mix of higher margin businesses amounting to uptick increase of 1% by total average.
Solid financial standing: no debt, large cash position, high margins. Net cash position amounting to 20% of total assets and gross margin standing at 50%, enable Kalbe to pursue high capital expenditure only from internal financing. Kalbe is also a consistent dividend-paying firm with 50% payout ratio. We estimate Kalbe can still operate under healthy financial condition during forecasted period with no significant concerns in such regard.
We initiate coverage of Kalbe with a Buy recommendation. We assure Kalbe can offer long-term upside potentials and are confirmed with our valuation of DCF technique and Multiples Analysis that arrives at 12M target price of IDR 1,600 (PER at 30x, 18x EV/EBITDA), suggesting 20% potential upside.
Main risks to our target price are: 1) Changes in regulatory landscape that currently work in favor of domestic players, 2) Fluctuation in USD/IDR exchange rate as 90% of raw materials is imported with currently no specific hedging strategy, 3) Failure or below expectation result of NHI implementation.
PT Kalbe Farma Tbk.(KLBF.JK/KLBF.IJ)
October 30th 2013Asia Pacific/Indonesia
Source: Company data, UISR estimates
-1.48%
12.71%
-9.52%
4.72%
41.49%
27.88%
Source: RTI Finance.
Source: Datastream, UISR estimates
Closing Price
12M Target Price
20% UpsidePotential
IDR 1,600
IDR 1,330
Kalbe’s Daily Stock Price
[Indonesia Stock Exchange]

CFA Institute Research Challenge
Business Description
2UNIVERSITY OF INDONESIA STUDENT RESEARCH -‐ KLBF.JK
Distribu(on+&+Logis(cs,+
35%+
Prescrip(on+Drugs,+25%+
Consumer+Health,+16%+
Nutri(onals,+24%+
Figure 1. Revenue Breakdown Q3 2013
Figure 3. Shareholders Structure
30 Oct 2013
Source: Company data
96%$
4%$
Domes+c$ Export$
Figure 2. Geographical Sales Q3 2013
Source: Company data
Source: Company data
PT Kalbe Farma, Tbk, founded in 1966 and listed on Indonesia Stock Exchange in 1991, is a pharmaceutical and health equipment company headquartered in Jakarta. With operations in Indonesia, Singapore, Vietnam, Malaysia, Myanmar, Cambodia, the Philippines, Thailand, Sri Lanka, South Africa, and Nigeria, Kalbe functions 11 GMP facilities complying with international standards and captured a market capitalization of IDR 52.8 tn by the end of 2012, making it the biggest drug maker in South East Asia.
Started in a garage and first run by six siblings, the used-to-be only a pharmaceutical company has also reaped success venturing to other areas related to health, such as producing vitamins and supplements that are giants in Indonesia market. Therefore, we identify the strength of Kalbe to be its well diversified, wide array portfolio in addition to successful mergers and acquisitions since its establishment. Amongst popular brands are Promag (together with Neo Entrostop and Waisan secures 43% market share for digestive remedies) and Extra Joss (#2 in energy drinks).
Spread across 22 subsidiaries, the operation is grouped into four business segments:
• Prescription pharmaceuticals division (contributes 25% to YTD 2013 sales): unbranded generic drugs, branded generics, licensed drugs
• Consumer health division (16%): over-the-counter drugs with therapeutic benefits, consumer products with health benefits such as supplements and other preventive products, energy drinks, and healthy ready-to-drink products following the acquisition PT Hale International in July 2012
• Nutritional division (24%): powdered milk nutrition for all stage in consumer’s lives and for consumers with special needs
• Distribution & logistics division (35%): 2 RDC and 66 branches in 48 cities that reach more than 1 million outlets all over Indonesia.
All practices amounted to the total sales of IDR 7,421 bn in the first half of 2013.
Employing more than 10k personnels in 2012, Kalbe has managed to constantly preserve its ever-expanding coverage in Indonesia to over 70% of general practitioners, 90% of specialists, 100% of hospitals, 100% of pharmacies for the prescription pharmaceuticals market, and 80% for the consumer health and nutritional markets. Maintaining its status quo in the industry for 47 years, product quality and availability are two of the company’s key concerns in securing its leadership in the burgeoning domestic market (96% of sales).
This company with considerable public ownership now has a new business unit by founding 54 integrated healthcare clinics under the trademark of “Mitrasana” in Jakarta and its Greater Area. Each branch offers a service with 4-in-1 concept, providing family doctor, pharmacy, laboratory, and convenient store. Attached to the ongoing penetrating process is a target of having 500 clinics regionally within the five years to come.
A breakthrough of developing an oncology drug site is being undergone as roughly 40% of its capital expenditure was spent in the first half of 2013 to complete the 3,800 square meter plant with total investment of IDR 200 bn. We are positive that this investment binge will boost Kalbe’s productivity and earnings starting from next year hence stronger position in the market.
Dr.$Boenjamin$Se.awan$&$Family,$52.28%$
Treasury$Shares,$7.69%$
Public,$40.03%$
Figure 4. Forecasted GDP per capita (USD)
Source: IMF
Industry Overview and Competitive AnalysisWe are sanguine that Indonesia’s under-penetrated healthcare market is poised to a rapid growth mode during the forecasted period, suggesting lofty upside potentials for industry players. We base our upbeat analysis on some catalysts as follow:
Macroeconomic outlook: remains prime for positive upsidesExpecting the light at the end of the tunnel. Despite experiencing a bumpy ride in Q2 2013 when current account deficit was at its worst level, amounting to USD 9.8 bn or equivalent to 4.4% of GDP, causing IDR to slide ~15% to USD/IDR Rp 11,500+ levels in August, as a consequence of that bloating 8.8% inflation yoy in August 2013, we believe that Indonesia economy is still prime for positive surprises. In our view, prior turbulences contributed by slow market recovery from spike in prices, namely the increasing minimum wage (18.32% on average) and oil subsidies cutting (22% for petrols and 44% for diesels) are only temporary. Oil subsidies cutting will lower the burden of fiscal budget which eventually will leave room for more productive spending that can help accelerate the economy in the long run. We are convinced that by the beginning of 2014, the economy will fare better and therefore, continue the resilient growth trend for the following years. According to IMF forecast, Indonesia still can manage to reach USD 4,554 GDP per capita in 2018, implying 5.41% CAGR 13-18. Higher affordability will surely become a booster in increasing healthcare spending.
With largely 85-90% of raw materials imported in this industry, pharmaceutical is highly exposed to the volatility of IDR, thus a direct threat to unit prices. We give a stable IDR outlook for the next 12 months at 11,500 IDR/USD. We estimate that recent IDR has reached bottom level and is left with only limited downside possibility before being dragged back to normal due to several key aspects as follow:
3,499%%
4,554%%
10A 11A 12A 13F 14F 15F 16F 17F 18F

3UNIVERSITY OF INDONESIA STUDENT RESEARCH -‐ KLBF.JK
Figure 6. Healthcare spending as a portion of GDP (%) 2011
Figure 5. Indonesia’s “Pharmerging” Market
CFA Institute Research Challenge 30 Oct 2013
Source: Company, IMS Health
9.3$9.3$
5.2$4.6$4.2$4.2$3.9$3.6$
2.7$
UK$Japan$China$Spore$Phil$Thai$India$Msia$Indo$
Source: WHO, World Bank
Figure 7. Milk consumption per capita (Kg)
21#
15#
14#
13#
10#
2.1#
2.1#
0# 5# 10# 15# 20# 25#
Japan#
Spore#
Msia#
China#
India#
Phil#
Indo#
Source: Euromonitor
5.3$ 5.7$6.7$
7.7$9$
10.4$
0$
2$
4$
6$
8$
10$
12$
12A$ 13F$ 14F$ 15F$ 16F$ 17F$
USD$bn$
15% CAGR
Figure 8. Indonesia’s demographic profile (Age)
27%$
17.10%$
42.20%$
7.20%$
6.40%$
0*14$
15*24$
25*54$
55*64$
>65$
Source: World Bank
(1) oil import reaching stable level after the spike in demand because of Ramadhan and Lebaran, (2) the rise of BI rate to 7.25% (from 5.25%) which will slow down CAD, (3) the delay of QE tapering by The Fed, (4) establishment of IDR 12 bn Bilateral Swap Agreement (BSA) with Japan posing as a safety net for foreign reserve, and (5) the issuance of USD term deposits by BI to entice capital inflows. Provided by those key points, we expect that pharmaceuticals companies will manage their foreign currency denominated expenses without significant hurdles. Under-penetrated healthcare market suggests substantial growth potentials We expect Indonesia’s woefully low healthcare expenditure, which currently stands at 2.7% GDP will increase as many more Indonesians are to join middle class consumers, owing to the fact of increasing GDP per capita. Frost & Sullivan, a reputable research firm, estimates that Indonesia can manage to reach 4.4% of GDP for healthcare spending by 2018. We think that estimate is justified since government is committed to increase it at 5% of GDP level. We believe that the increase in healthcare spending as portion of GDP that coupled by escalated GDP per capita will create a positive spillover effect for the industry.
According to IMS Health, Indonesia is in the “Pharmerging market” list, meaning that Indonesia is amongst countries with potentially high degree of accelerated growth, estimated at 15% CAGR 12-18. Apart from the economic advancement, the growth is primarily driven by government’s mission to provide better healthcare provision and companies’ eagerness to capitalize on that healthcare initiatives. Prescription pharmaceutical now stands at market value of USD 6.25 bn where the industry has been growing at 11% CAGR 09-12 and we estimate it to maintain the growth at 12% CAGR 12-18 as NHI is commenced with gradual implementation beginning from 2014 until the expected completion in 2019.
We also take Indonesia’s low milk consumption per capita as a sign that it leaves ample room for major upsides for the next five years. With current consumption only at 2 kg per capita, we expect Indonesia to keep up and raise this rate as the middle class consumers will keep on expanding and narrow the gap between the country and its regional peers, namely India at 10 kg, Thailand at 12 kg, and the Asian average of 15kg.
Riding up the momentum of structural change in healthcare sectorIn our view, Indonesia low healthcare spending could be highly contributed by the absence of universal health coverage scheme, as large portion of Indonesia population is of low income, thus paying in full to seek doctor’s advice would be a major drawback. But, it is no longer the case going forward as we foresee the USD 20 bn NHI to be a game changer with ambitious goal to cover all citizens by 2019. Unbranded generic would be the highlight of this scheme since it is relatively cheap and government recommends doctors to be always prescribing unbranded generic products when possible to avoid unnecessary high cost. We estimate NHI to double the market size of unbranded generics with incremental of IDR 287 bn (assuming 30% of NHI budgeted spending), making this low margin sub-segment become highly attractive in terms of volume.
The second driver for structural change is government’s affirmative commitment to provide universal access to basic health services whilst improving the quality of healthcare treatment. Government grants a dramatic 37% increase on national healthcare spending for 2014 budget, and we estimate the growth to remain above 20% level over the next five years since aiming to reach healthcare spending 5% of GDP is still far from grasp (now at 2.7%). This spending binge expectedly will boost revenue streams for pharmaceuticals, medical devices, distribution & logistics, and related business.
Young demographic profile favors consumer and nutritionals playFor the next ten years, Indonesia will enjoy what we refer to as demographic dividend, which is the condition where the dependency ratio between the older ones to the younger ones is at its lowest. More than 44% Indonesia population are below 24 and WHO recorded there are 19 babies born for every 1,000 Indonesians in 2012, a rate that is only second to India’s. We take this demographic profile as an ideal market for powdered milk for pregnant women, toddlers, and teens; and also as an attractive market for consumer health segment.
Negative investment list for pharmaceuticals poses direct benefitsIndonesian government puts pharmaceuticals in protective regulatory barriers, as foreign companies who wish to enter is capped maximum at 75% percent ownership, owing the remaining 25% to form joint venture with domestic companies. Moreover, foreign companies are not allowed to distribute their products unless they have production facility in Indonesia. This regulation puts domestic companies on the rise since foreign ones would be highly dependent on them.
The industry is recognized with tight competitionDespite facing many opportunities ahead presented by supportive economic outlook and expansionary healthcare scheme, the biggest challenge faced by industry players is indeed competition. With more than 200 players, the industry is highly competitive and extremely fragmented. It is not an easy job to secure market share under cut throat environment from both domestics and foreigns, privates and state owned enterprises (SOEs), big and small players. Big players such as Kalbe has been managing to increase its dominance in recent years, but the same can not be said to other big players such as Dexa and Sanbe. We also estimate it would be extremely difficult for foreign players as they will have to face strong competition from local players in low-cost unbranded generics, since many local players have been aggressively gearing up their production capacity. However, the competitiveness still favors big players as they achieve scale efficiency, enabling them to enjoy lower distribution costs and fare better when it comes to price war.
4UNIVERSITY OF INDONESIA STUDENT RESEARCH -‐ KLBF.JK
Figure 10. Pharmaceuticals market share
CFA Institute Research Challenge 30 Oct 2013
12%$ 5%$
10%$
5%$
3%$
4%$
4%$
4%$
0%$
5%$
10%$
15%$
20%$
25%$
30%$
35%$
40%$
2005$ 2012$
Kalbe$ Dexa$Sanbe$ Sanofi$Aven6s$Pfizer$
9%12%
Figure 11. Kalbe #1 market share in OTC Drugs
Source: Company data, Euromonitor
10%$ 10%$
8%$
0%$
2%$
4%$
6%$
8%$
10%$
12%$
Kalbe$ Tempo$ Soho$
Provided by those key opportunities in industry wide, we believe Kalbe would be the main beneficiary, making it the most preferred consumer play in Indonesia. Here are several key points on why we think Kalbe can come out as a winner in this crowded industry:
Multi-focused business impressiveness By 2013 Q3, Kalbe’s revenue is generated by prescription drugs at 25%, consumer health at 16%, nutritionals at 24%, and distributions and logistics at 35%, which proves the company’s stable growth equally amongst the businesses in its portfolio. We are in favor of Kalbe’s strategy in continuously improving all four business segments for such stance is promising to guarantee Kalbe’s position in Indonesia pharmaceutical industry because there is no component that is majorly superior to the other ones, minimizing Kalbe’s overdependence towards a particular market. Given the fact that the four business segments are not related one another, the equally strong performances enable Kalbe to exploit the industry’s every potential. Even more, decline in one segment is coverable by three other segments, limiting Kalbe’s potential to fall.
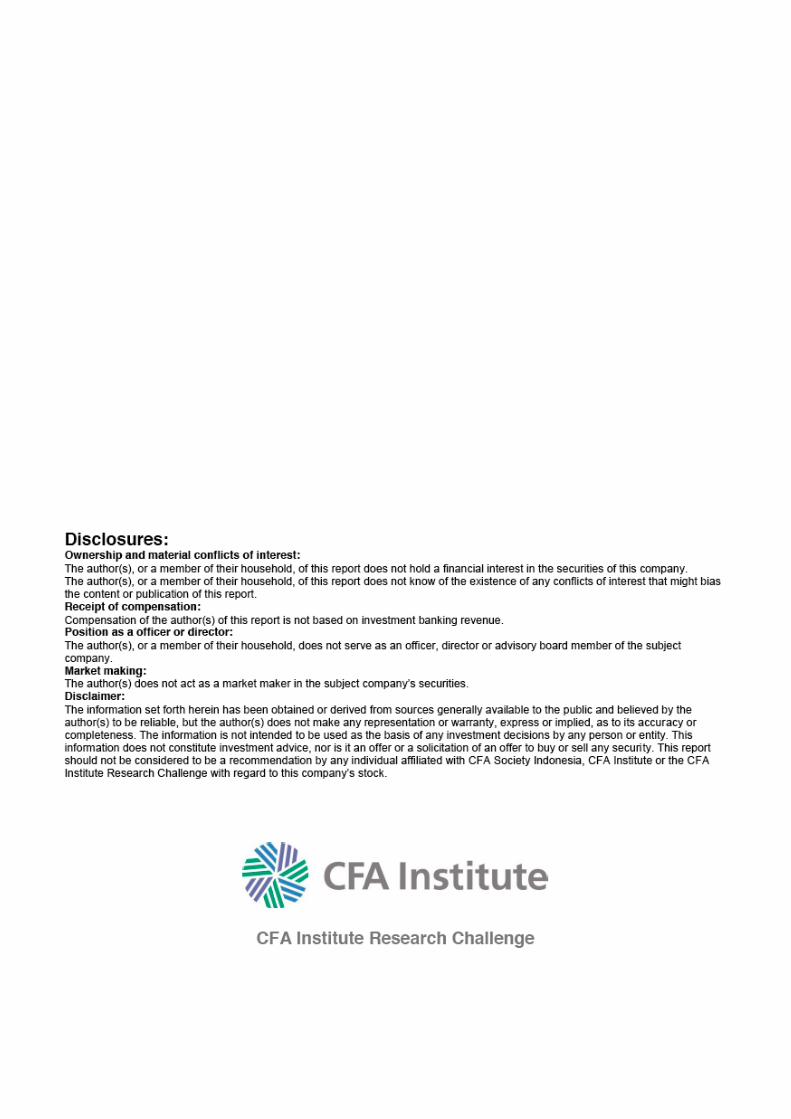
Dominating market shareAccording to the company’s Q3 in 2013 report, Kalbe acquires not less than 12% of market share in the very competitive prescription drugs, leaving the closest competitor with only a half of its share. This is strengthen by the largest medical team in the country with about 2,300 representatives, thus still highly likely to maintain such domination. Another segment that is successfully led by Kalbe is consumer health, especially in OTC drugs (10% of market share as #1 player) and energy drink (23.4%, #2). In nutritionals, Kalbe manages to take the 5th position by captivating 10% of market share for powdered milk. These dominating positions in every segment further confirm that Kalbe can better capitalize industry’s upside potentials compared to its competitors.
Top-of-mind, market leading brandsStaying in the market for long period of time, Kalbe’s products are linked to a specific sub-market, which causes consumer to directly think of its brands and associate them with the solutions it provides, regardless of the market share in that sub-market. Amongst the brands are Promag and Neo Entrostop for digestive remedies (altogether 42% of the sub-market), Mixagrip, Woods, and Komix for cough-relieving drugs (14.2%), Puyer and Neuralgin for analgesics (10.5%), and Extra Joss for energy-power drink (23.4%).
Nutritionals’ growth as aligned to demographic bonusPosing as the second contributor for the company’s revenue in the year of 2012, nutritional market is calculated to experience massive growth in the years to come, even to become Kalbe’s primary revenue generator, thanks to Indonesia’s highlighted demographic dividend as elaborated in Industry Overview. Coupled by its already-infamous brands for various sub-markets such as Diabetasol as a formula for diabetic consumers (88.1% of the sub-market), Milna for toddlers (76.5%), and Prenagen for expecting mothers (55.6%), we deem Kalbe’s prospect in captivating more market shares from the expanding market sizes formidable for competitors, hence higher growth in this segment.
Boosted by the most extensive distribution network By successfully penetrating various drug markets and captivating an impressive number of market share, Kalbe is strongly supported by its effective distribution chain that over the years has proven to be benefiting the company’s drug selling by its ability to reach for 100% hospitals nationwide. In 2012 alone, distribution contributed to 35% of Kalbe’s total revenue for its growth of 34.4% in the same year. Kalbe has more than 2300 employees to support its distribution channels or twice the size that its competitors have. Number of third-party companies who use Kalbe’s distribution channels and its contribution are other indicators of the efficiency of this segment.
Suitability with Indonesia’s physical conditionIndonesia’s geography which consists of scattered, archipelagic islands as a home to 240 million people is seen as an obstacle for pharmaceutical industry players in terms of distributing its product, but not to Kalbe, whose distribution system guarantees its products’ reach to all over Indonesia. This ability is a sought-after characteristic that can be considered as Kalbe’s competitive advantage for the easiness to distribute its products is an excellence its competitors find hard to imitate.
Almost perfect standings on BCG MatrixPerforming exceptionally well in all four business segments that have been experiencing major growths, Kalbe is looking very appealing and has a lot of potential when is analyzed using BCG Matrix. By captivating high market shares in prescription pharmaceutical, consumer health, and distributions and logistics industries, we easily rate these three segments to be “high relative market share”, followed by nutritionals (in which Kalbe is the 5th biggest player) to be “low relative market share.”
While relative market share is the x-axis in the matrix, the y-axis is industry growth rate in sales. This rate describes one segment’s performance compared to the other segments within one company, should it have various businesses like Kalbe. Referring to the fact that the four segments have been growing in double digit, we label Kalbe’s four segments to be “high in industry growth.”
Combining its market shares and industry growth, prescription pharmaceutical, consumer health, and distributions and logistics are all labeled as “Stars” in BCG Matrix (the top condition), whereas nutritionals is trailing behind with “Question Mark.” This is a near-perfect standing for Kalbe as a company penetrating in four different markets which solidifies its existence as Indonesia’s most leading pharmaceutical company.
Source: Company data, Euromonitor
Pharmacies 15,806 Hospitals 1,676 General Retail 162,185 Medical Stores 4,485 F&B Stores 15,009 Supermarkets 4,340 Wholesalers 2,263 Others 11,532 Total Outlets 217,296
Figure 12. Extensive distribution channels
Source: Company data
45#58#
66# 69#
1960# 1980# 2000# 2011#
Figure 9. Indonesia’s Life Expectancy
Source: WHO

We initiate coverage on Kalbe Farma (Kalbe), Southeast Asian largest pharmaceuticals and consumer health player, with a Buy recommendation and a price target of IDR 1,600 (30x PER, 18x EV/EBITDA), implying 20% upside potentials. We like Kalbe for its wide coverage, balanced business portfolios with leading market presence, combined with extensive distribution network, healthy balance sheet, and strong net cash position, ready to exploit underlying industry’s opportunities.
A timely industry entry pointWe predict a structural change will take place in Indonesian healthcare market mainly driven by (1) The implementation of USD 2 bn NHI at the beginning of 2014 with completion target of covering all citizens in phases by 2019. (2) Affirmative government commitment to increase health care spending as a portion of GDP to 5% (currently stands at 2.7%). Government grants a compelling 37% increase on 2014 healthcare budget, and is most likely to remain growing at such level until 5% target is within reach. (3) BCG estimates that Indonesia middle class will double from 74 million in 2013 to 140 million in 2020, coupled with young demographic with high birth rate, and longer life span. These should boost healthcare spending even further. All those points constitute a good entry point into the industry.
Kalbe is a sovereign drug company: well-diversified portfolio with leading market brandsKalbe has wide array and well-diversified business portfolio, enable it to captivate most opportunities provided by the industry. In Prescription Pharmaceuticals, kalbe has in total 383 products. It also has a full range of brands covering 6 therapeutic classes in OTC drugs, as well as energy and health drink. Not only that, Kalbe also has a full spectrum of Nutritionals products, covering all demographic segments. Moreover, Kalbe also owns a distribution network to capture opportunities presented in healthcare supply chains and logistics. Not only having a full range of business portfolios, Kalbe is also thriving with market leading brands. It secures #1 position in Prescription Pharmaceuticals, with 13% market share, leaving the next largest competitors trailing behind with half of its size. Kalbe also manage to secure to be #1 in OTC drug and #2 in Energy drink under the brand of Extra Joss. Kalbe also manages to captivate 10% market share in Nutritionals, making it the #4 biggest player. Those dominant attributes clearly put Kalbe as main beneficiary in exploiting expanding health market opportunities.
Unrivaled, farthest reaching distribution networkWe view that Kalbe’s ability to secure its leading position is mainly backed up by its extensive distribution network. Giving indonesia’s challenging nature, owning the farthest reaching distribution network in the country is vital in enabling Kalbe to better intensify its product penetration than its competitors. Provided by such advantage, we are optimistic that Kalbe can execute acquisition strategy smoothly. It is a common strategy in consumer goods that bigger companies such as Unilever acquire smaller brands and then make then magnify their market share by intensifying its marketing effort and widely distributing them. We are in favor that Kalbe can do the same. Moreover, foreign players can not distribute their products without having their own manufacturing facility, as such they have to rely on Kalbe, giving Kalbe another big opportunity to exploit.
Strong financial position: net cash, healthy balance sheet, improving margins, and high dividendWe expect strong financial performance from Kalbe in the next five years. Sales grows at 15.5% CAGR (please refer to Appendix 12), led by Nutritionals segment which grows at a significant rate, 21% CAGR, backed by product development, low milk consumption penetration, and higher disposable income of Indonesians. As the highest gross margin segment, the growth in Nutritionals also changes Kalbe sales mix into higher margin products, resulting in an increase in gross profit margin from 50% to 51% in 5 years. With no debt and net cash position standing at IDR 1.810 tn, Kalbe could manage to fulfill capex requirements to expand production capacity and distribution reach, while maintaining a high dividend payout ratio at 50%.
Pursuing aggressive strategy to keep on expandingStrong financial standing allows Kalbe to pursue aggressive strategy. Previously, Kalbe imported several kinds of cancer drugs, but with newly established oncology factory, Kalbe is now able to produce them on its own and saving 30% in cost. Kalbe also plans to expanding its existing factories and build a new ones. It also has begun to develop new Regional Distribution Center (RDC) in Central Java and Sumatera Island. These plans not only will increase Kalbe’s production capacity but also magnify its product penetration.
Favorable regulatory setting puts Kalbe on topWe deem negative investment list that government sets on Pharmaceuticals Industry will keep foreign competitors at distance, thus as industry leader, it is highly unlikely that Kalbe will face significant competition from outside. We expect that Kalbe is able to maintain its dominating position in the market as long as negative investment list stays.
ValuationOur buy rating is reaffirmed by our valuation method which combines both DCF technique and comparable peers pricing using multiples. We weighted them in 70:30 proportions. We believe the proportion is justified as we put in a rigorous manner in setting our valuation. Moreover, our target price is proved to be appropriate through the sanity checking against the consensus estimates we applied to. This part is explained further in valuation section.
Possible investment riskThe most significant risks to our target price are regulatory risk, sensitivity to IDR, and reputation. Further analysis on this is explained in Risk Analysis section later in this report and Appendix 14.
5UNIVERSITY OF INDONESIA STUDENT RESEARCH -‐ KLBF.JK
CFA Institute Research Challenge 30 Oct 2013
Investment Summary

6UNIVERSITY OF INDONESIA STUDENT RESEARCH -‐ KLBF.JK
CFA Institute Research Challenge 30 Oct 2013
Cost of EquityCost of EquityCost of Equity10-year Risk Free Rate 6.9%Market Risk Premium 5.0%Beta 0.86 Cost of Equity 11.20%
Figure 15. Cost of equity
Source: IBPA, UISR estimates
Price&
Min&22.1x&
-1SD&25.3x&
avg&30.7x&
+1SD&36.1x&
Max&42.4x&
600&
700&
800&
900&
1000&
1100&
1200&
1300&
1400&
1500&
1600&
Jul-1
2&
Sep-12&
Nov-12&
Jan-13&
Mar-13&
May-13&
IDR$
ValuationTwo standard approaches are applied in seeking the fair value of Kalbe: Discounted Cash Flow (DCF) model and Multiple Analysis. The former is used to reveal the intrinsic value, while the latter is used to incorporate market sentiment towards the company. Both techniques are weighted to reflect long term fundamental investors’ and short term minor shareholders’ concerns.
DCF ValuationWe believe this method is the most reliable in forecasting medium-term growth story of Kalbe due to its numerous business portfolios and substantially different margin figures and profitability among business segments. With 11.2% in cost of equity, we expect the 12M target price of IDR 1,680 per share.
Sales ForecastThe five-year projected cash flow is driven by revenue growth of each business segment the company is engaged in. The implementation of NHI in 2014 will tap the potential market for pharmaceutical industry and grant Kalbe good opportunity to boost its revenue until 2019. To anticipate this, Kalbe is committed to intensifying marketing efforts through intensive medical representatives deployment for branded products and by strengthening its distribution and partnering with public hospitals for unbranded generic products. The impact will amplify the prescription pharmaceutical segment albeit nutritional products are still expected to contribute the highest proportion of total earning. As a result, we calculate the company to have its consolidated sales growing at rate of 15.4% CAGR over the next five years.
Cost of sales and gross profit marginIn spite of the deteriorated economy, Kalbe has successfully maintained its cost of sales at half of its net revenue. It is even expected to slightly decline in the upcoming years due to supply chain improvement performed by the company. Compared to its peers, Kalbe also gains better gross profit margin and possesses better inventories and cash reserves as buffer to stand against current IDR depreciation.
Terminal growth rateIn order to value perpetuity growth of the company, we base our assumptions on national real GDP growth rate impact on healthcare long-term growth rate. McKinsey Global Institute expects consumer spending on health care to grow at 6.2% CAGR 2010-2030. Taking into account of the fragmented industry the Company is dealing with, a conservative estimate of 5.5% long-term growth rate is considered.
Cost of equityThe cost of equity is calculated by applying CAPM using 10-year government bond as a risk-free rate of 6.9%, market risk premium of 5% selected as common industry practice, and beta of 0.86 calculated by regressing daily return of Kalbe against daily return of JCI for the last five years, resulting the cost of equity at the rate of 11.20%.
Figure 14. P/E Band
Source: UISR estimates
Figure 13. Kalbe’s share price and news flow since January 2008
Source: Datastream, Company data
7UNIVERSITY OF INDONESIA STUDENT RESEARCH -‐ KLBF.JK
CFA Institute Research Challenge 30 Oct 2013
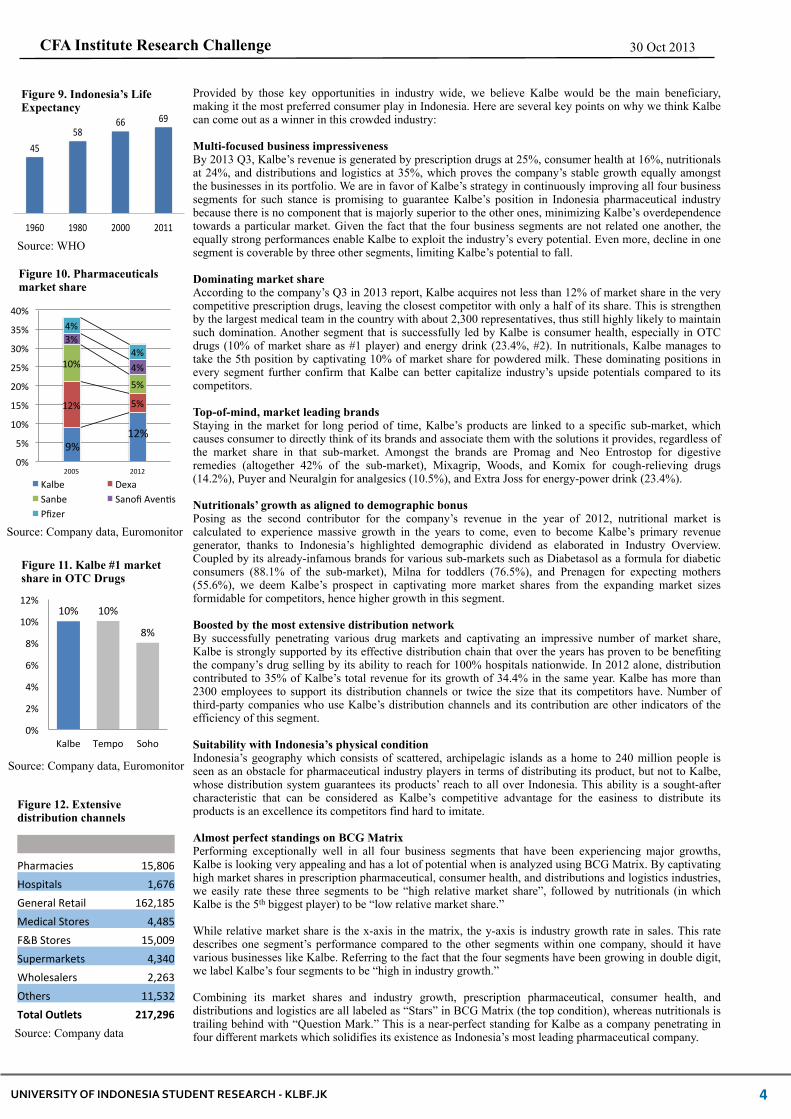
Multiples Valuation Asian Emerging Pharmaceuticals Asian Emerging Pharmaceuticals Asian Emerging Pharmaceuticals Median P/E 27.5 EPS 2014E 50.0 Price 50% 1,376 Indonesian Consumer Goods Indonesian Consumer Goods Median P/E 29.8 EPS 2014E 50.0 Price 50% 1,491Price using multiples 1,430
DCF Valuation 5-Year Projected FCF 14,206 Terminal Value 62,386 Enterprise Value 76,592 Add Excess Cash 2,163 Equity Value 78,755 Shares Outstanding (Million shares)Shares Outstanding (Million shares) 46.875 Target Price using DCFTarget Price using DCF 1,680
Weighting DCF Approach: FCFE 70% 1,176Multiple Analysis: PER 30% 429Target Price/share 1,605Target Price/share (rounded)Target Price/share (rounded) 1,600
Current Price/Share 1330Potential Upside Gain 20%
Figure 16. Absolute valuation
Source: UISR estimates
Figure 17. Relative valuation
Source: UISR estimates
Figure 18. Target price
Source: UISR estimates
Source: Company, UISR estimates
!
24% 25% 26%
Capital expenditureTo expand its business and effectively capture the incremental market size due to NHI implementation momentum, we expect the company to allocate plenty of capital expenditure in 2013 - 2014. The company has spent 40% of Capex allowance of IDR 1.5 tn in the first half of 2013 to build oncology production site and open new branches to strengthen its distribution. The remaining allowance will be spent to add more branches and machine acquisition to increase production capacity for NHI. The next year’s Capex target is relatively lower than preceding month, costing IDR 1 tn as most of the investments are completed by the end of this year. The company expects to put to use only 80% of Capex allowance in 2013E and 2014E. As of 2014, we deem Capex to be proportionate to the annual sales target.
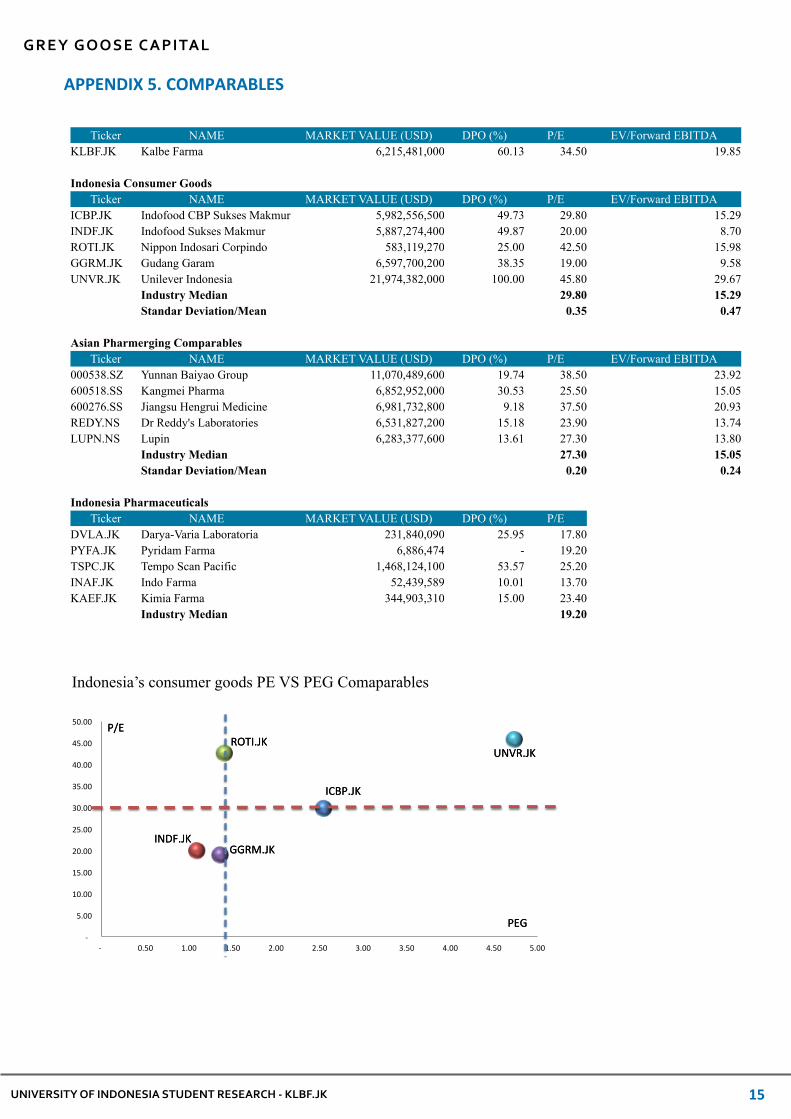
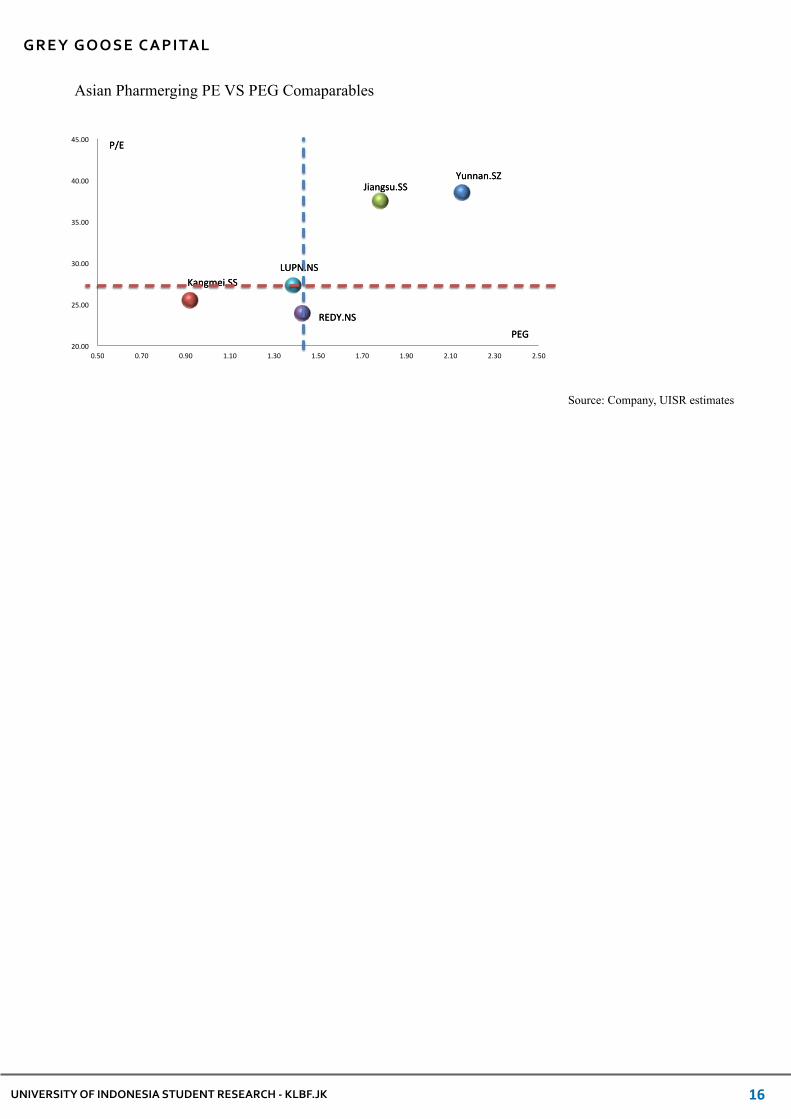
Comparable Peers PricingWe classify Kalbe’s peers into 2 categories: Asian Pharmerging (China and India) to picture long-term global investors’ investment trade-off and Indonesian consumer goods to provide alternatives for domestic investors.
We prefer comparing Kalbe to Asian Pharmerging companies from China and India to its ASEAN peers due to similar market characteristics and market capitalization. Besides, Kalbe is the largest pharmaceuticals player in the ASEAN region in terms of market capitalization; Therefore, Kalbe is incomparable to other ASEAN players. On the other hand, Kalbe can be domestically compared to consumer goods companies rather than its domestics pharmaceuticals peers due to large gap in market capitalization. Please refer to our comparable table on Appendix 5.
Multiples SelectionWe consider two multiples to calculate our target price: P/E and EV/forward EBITDA. We apply the median multiples to both peers category to measure the most appropriate multiple for each category. Based on our calculation, we found that P/E has lower standard deviation per mean than EV/forward EBITDA. Thus, we assign P/E multiple to both Indonesian consumer goods and Asian Pharmerging. By applying equal weighting for both median P/E, we eventually arrive at target price of IDR 1,430.
Weighting of the modelsWe put lower weight to our multiples valuation because we find difficulties in finding direct comparisons to Kalbe Farma. Consequently, we come up with the ratio of 70:30 for DCF to Multiples.
Concluding valuationBy combining DCF and Multiples, we value Kalbe with the fair price of IDR 1,600. Referring to the current price of IDR 1,330 per share, there is a clear potential upside gain of 20% by the end of year 2014.
Sanity Check: Implied P/EHistorical P/E Band approach is used to check whether our implied P/E on the target date falls within the range of our historical P/E. Over the past year (Q2 2012 – Q2 2013), Kalbe was traded between 22x to 42x with average P/E of 30.7x. Our valuation of IDR 1,600, divided by estimated EPS of 54, implies a P/E ratio of 30.0x and 32.0x by using consensus’ estimate EPS of 50.7. Thus, both P/E still fall within 1 standard deviation of historical P/E and confirm our target price.
Risk to target pricingValuation using DCF is sensitive to the change occurring in assumed terminal growth rate and cost of equity. Target price may deviate significantly should there be any distortion on one of the variables. To see the price sensitivity to the variables, please refer to our Sensitivity Analysis in Appendix 14.
Financial AnalysisEARNINGS
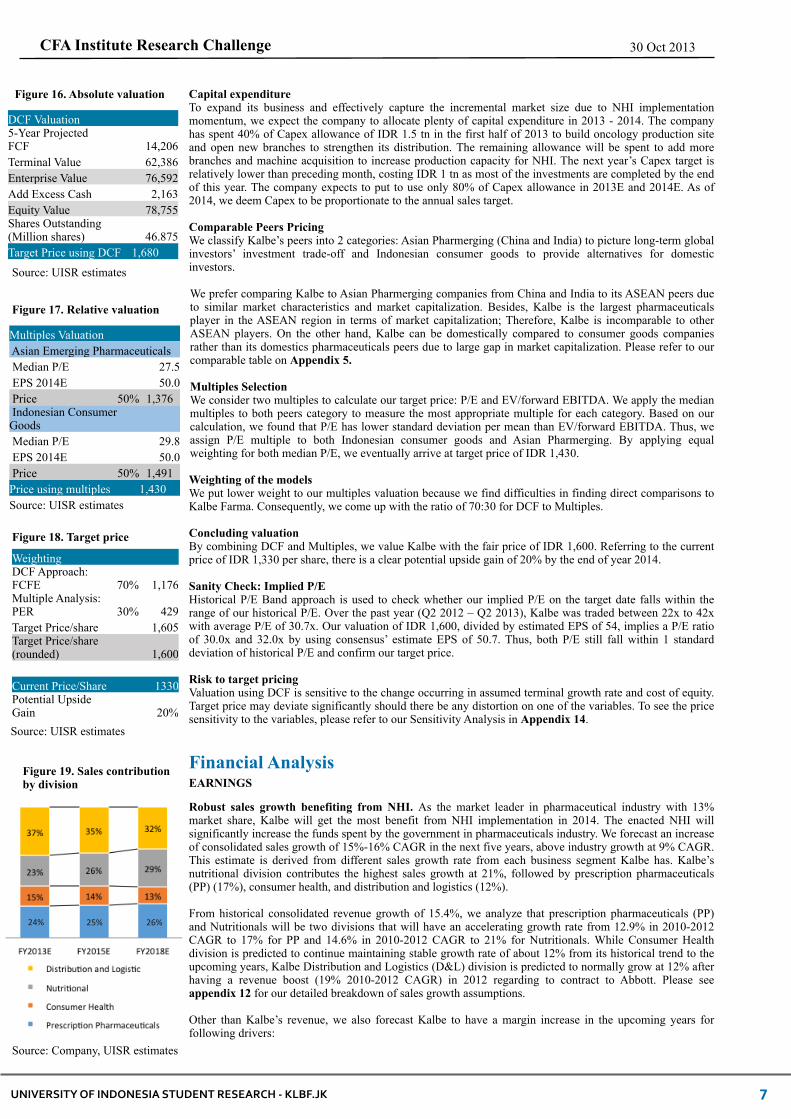
Robust sales growth benefiting from NHI. As the market leader in pharmaceutical industry with 13% market share, Kalbe will get the most benefit from NHI implementation in 2014. The enacted NHI will significantly increase the funds spent by the government in pharmaceuticals industry. We forecast an increase of consolidated sales growth of 15%-16% CAGR in the next five years, above industry growth at 9% CAGR. This estimate is derived from different sales growth rate from each business segment Kalbe has. Kalbe’s nutritional division contributes the highest sales growth at 21%, followed by prescription pharmaceuticals (PP) (17%), consumer health, and distribution and logistics (12%).
From historical consolidated revenue growth of 15.4%, we analyze that prescription pharmaceuticals (PP) and Nutritionals will be two divisions that will have an accelerating growth rate from 12.9% in 2010-2012 CAGR to 17% for PP and 14.6% in 2010-2012 CAGR to 21% for Nutritionals. While Consumer Health division is predicted to continue maintaining stable growth rate of about 12% from its historical trend to the upcoming years, Kalbe Distribution and Logistics (D&L) division is predicted to normally grow at 12% after having a revenue boost (19% 2010-2012 CAGR) in 2012 regarding to contract to Abbott. Please see appendix 12 for our detailed breakdown of sales growth assumptions.
Other than Kalbe’s revenue, we also forecast Kalbe to have a margin increase in the upcoming years for following drivers:
Figure 19. Sales contribution by division

8UNIVERSITY OF INDONESIA STUDENT RESEARCH -‐ KLBF.JK
CFA Institute Research Challenge 30 Oct 2013
Additional Upside TriggersNew contracts to increase net sales. Even though all segments proved to generate a solid Net Sales growth of 25% to the company throughout 2012 (net income increase of 17%), the addition of PT Abbott Indonesia as Kalbe’s third party principal in the distribution and logistics division was a contract worth mentioning for it provided a significant contribution up to 6% to total company’s sales. New contracts may be eventful as it does not happen on a regular basis. However, if these come in big thus large contribution to net sales and/or and net income, new contracts are without doubt a subject to additional upside.
Possible, profitable mergers and acquisitions. As written on the company’s annual report 2012, one of four main strategies of Kalbe is strengthening its business portfolio, especially through innovation in product development, new business models, and mergers and acquisition. Sound financial condition indicated by strong balance sheet will ease Kalbe’s move to perform acquisitions towards smaller companies with less extensive distribution capabilities hence multiply the sales of its products.
Figure 23. Net gearing ratio and DPO
Source: Company, UISR estimates
!40%%!30%%!20%%!10%%0%%10%%20%%30%%40%%50%%60%%
FY2010%
FY2011%
FY2012%
FY2013E%
FY2014E%
FY2015E%
FY2016E%
FY2017E%
FY2018E%
Net%Gearing%Ra:o%
Dividend%Payout%Ra:o%
Figure 21. Top and Bottom breakdown
Source: Company, UISR estimates
!
Nutritionals: highest margin segment with highest growth potential. As the highest margin segment of Kalbe portfolio with 63%-64% gross profit margin, nutritionals also enjoys highest growth prospect. We forecast nutritionals to help raising Kalbe’s consolidated gross profit margin to 52.8% in 2018 and to be the highest contributor of Kalbe gross profit in 2018 with 35% contribution.
Expansion of Distribution and Logistics network. Kalbe plans to aggressively expand its Distribution and Logistics segment as a part of its strategy. Starting with 70 clinics to operate by the end of 2013 Mitrasana, is set to run 400 clinics by the end of 2018. With a four-in-one concept, Mitrasana is expected to deliver higher gross margin and capture its competitor clinics market. In addition to this, Mitrasana clinics also serve as an infrastructure to escalate drugs distribution network. Together with the inception of new RDC in Sumatera, expansion of Mitrasana clinics will also strengthen Kalbe supply chain, creating opportunities for other business segments. Thus, we forecast Kalbe’s Distribution and Logistics to improve its margin due to economies of scale and enable Kalbe to possess better overall business margin in the upcoming years.
Passing on cost increase to raise gross margin. Due to more than 90% of raw materials is imported and non-hedging policy, recent IDR slide shows potential to hurt GPM. Yet, in reference to late 2008, Kalbe’s gross margin only suffered for two quarters before enjoying a slight rise in 2009 gross margin. Our survey in the market confirms that Kalbe regularly adjusts selling price, about 4%-5% annually. We believe this will enable Kalbe to pass on the cost increase to consumer without hurting sales volume thanks to customer’s price insensitivity toward its products.
Preferred consumer play with superior earnings. We ran DuPont analysis to trace the change in ROE, which we forecast will increase from 24.1% in 2012 to 28.8% in 2018. This increase is attributed to the increase in net profit margin from 13.0% to 15.9%, and increase in asset turnover from 1.54x to 1.59x.resulting in increased ROA from 18.9% to 23.5%. Meanwhile, financial leverage is decreasing from 1.28 to 1.23 because we expect Kalbe is not raising any new debts in the next five years because of strong cash position.
BALANCE SHEET AND FINANCING
Strong balance sheet enabling aggressive growth. For the past 5 years, Kalbe has successfully maintained net cash position. 3Q2013 results are also in line, with net gearing ratio amounting to -11.5%. Additionally, 36.5% of Kalbe’s cash reserves is denominated in USD, providing natural hedging to its necessities to imported raw materials.
CASH FLOW
Decreasing operating cycle. In line with its end-to-end supply chain management, Kalbe keeps decreasing its net operating cycle, mostly due to better inventory management which leads to a reduced inventory period from 142 days in 2008 to 107 days in 2012. This improved operating cycle provides a lower net working capital hence a more advantageous financial position for Kalbe. We predict Kalbe to exhibit higher inventory turnover, up to 11% in 2013-2018 that contributes shorter operating cycle in the upcoming years after capitalizing a slight increase in its inventory growth due to the implementation of National Healthcare Insurance. In addition, forecasting the receivables and payables turnover to remain constant assuming there is no changes in terms of payment and collection.
Dividend payout maintained at high level. Management has mentioned a minimum rate of dividend payout ratio of 50% next year onwards. This policy proves management’s confidence in future cash flows of the firm, despite of high capital expenditure in 2013 and 2014. However, Kalbe cash reserves as a percent of sales keeps increasing, indicating a potential to grow its dividend payout in the coming years.
Heavy investment kicking in. In 2013-2014, Kalbe plans to invest heavily in preparing for NHI. Kalbe’s cash flow and cash reserves are more than enough to finance the capex spike. Our team predicts capex to poise back to normal in 2015, making up to 4% of sales. The oncology factory built is expected to be operational by 2015, shifting ethical drugs product mix back into higher margin as Kalbe does not need to pay for license for drugs.
Source: Company, UISR estimates
Figure 20. Gross margins per division
31% 31% 31%
Source: Company, UISR estimates
Figure 22. DuPont Analysis
9UNIVERSITY OF INDONESIA STUDENT RESEARCH -‐ KLBF.JK
CFA Institute Research Challenge 30 Oct 2013
Joint ventures to expand portfolio’s range. Used to participate only in powdered-milk market via the nutritionals division, in 2012 Kalbe formed an alliance to establish a joint venture, PT Kalbe Milko Indonesia, that produces milk-based beverages in liquid format. Given the fact that the nutritionals market is still underpenetrated, we value Kalbe’s action to enter liquid nutritionals products as a bold move proving the company’s seriousness in capturing as much market share as possible and beat the four major milk producers that to date are still performing better than the company in the nutritionals segment.
Corporate Social Responsibility & Corporate Governance
MACRO RISK:
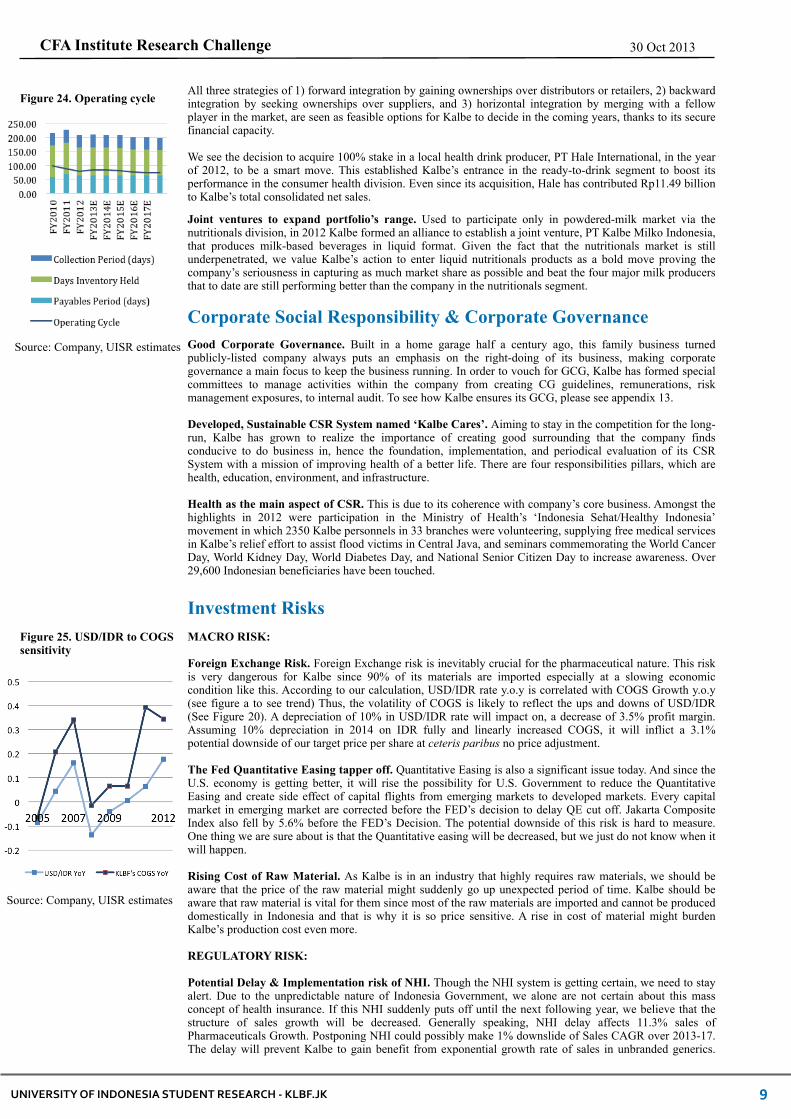
Foreign Exchange Risk. Foreign Exchange risk is inevitably crucial for the pharmaceutical nature. This risk is very dangerous for Kalbe since 90% of its materials are imported especially at a slowing economic condition like this. According to our calculation, USD/IDR rate y.o.y is correlated with COGS Growth y.o.y (see figure a to see trend) Thus, the volatility of COGS is likely to reflect the ups and downs of USD/IDR (See Figure 20). A depreciation of 10% in USD/IDR rate will impact on, a decrease of 3.5% profit margin. Assuming 10% depreciation in 2014 on IDR fully and linearly increased COGS, it will inflict a 3.1% potential downside of our target price per share at ceteris paribus no price adjustment.
The Fed Quantitative Easing tapper off. Quantitative Easing is also a significant issue today. And since the U.S. economy is getting better, it will rise the possibility for U.S. Government to reduce the Quantitative Easing and create side effect of capital flights from emerging markets to developed markets. Every capital market in emerging market are corrected before the FED’s decision to delay QE cut off. Jakarta Composite Index also fell by 5.6% before the FED’s Decision. The potential downside of this risk is hard to measure. One thing we are sure about is that the Quantitative easing will be decreased, but we just do not know when it will happen.
Rising Cost of Raw Material. As Kalbe is in an industry that highly requires raw materials, we should be aware that the price of the raw material might suddenly go up unexpected period of time. Kalbe should be aware that raw material is vital for them since most of the raw materials are imported and cannot be produced domestically in Indonesia and that is why it is so price sensitive. A rise in cost of material might burden Kalbe’s production cost even more.
REGULATORY RISK:
Potential Delay & Implementation risk of NHI. Though the NHI system is getting certain, we need to stay alert. Due to the unpredictable nature of Indonesia Government, we alone are not certain about this mass concept of health insurance. If this NHI suddenly puts off until the next following year, we believe that the structure of sales growth will be decreased. Generally speaking, NHI delay affects 11.3% sales of Pharmaceuticals Growth. Postponing NHI could possibly make 1% downslide of Sales CAGR over 2013-17. The delay will prevent Kalbe to gain benefit from exponential growth rate of sales in unbranded generics.
Source: Company, UISR estimates
Figure 25. USD/IDR to COGS sensitivity
Source: Company, UISR estimates
Figure 24. Operating cycleAll three strategies of 1) forward integration by gaining ownerships over distributors or retailers, 2) backward integration by seeking ownerships over suppliers, and 3) horizontal integration by merging with a fellow player in the market, are seen as feasible options for Kalbe to decide in the coming years, thanks to its secure financial capacity.
We see the decision to acquire 100% stake in a local health drink producer, PT Hale International, in the year of 2012, to be a smart move. This established Kalbe’s entrance in the ready-to-drink segment to boost its performance in the consumer health division. Even since its acquisition, Hale has contributed Rp11.49 billion to Kalbe’s total consolidated net sales.
Good Corporate Governance. Built in a home garage half a century ago, this family business turned publicly-listed company always puts an emphasis on the right-doing of its business, making corporate governance a main focus to keep the business running. In order to vouch for GCG, Kalbe has formed special committees to manage activities within the company from creating CG guidelines, remunerations, risk management exposures, to internal audit. To see how Kalbe ensures its GCG, please see appendix 13.
Developed, Sustainable CSR System named ‘Kalbe Cares’. Aiming to stay in the competition for the long-run, Kalbe has grown to realize the importance of creating good surrounding that the company finds conducive to do business in, hence the foundation, implementation, and periodical evaluation of its CSR System with a mission of improving health of a better life. There are four responsibilities pillars, which are health, education, environment, and infrastructure.
Health as the main aspect of CSR. This is due to its coherence with company’s core business. Amongst the highlights in 2012 were participation in the Ministry of Health’s ‘Indonesia Sehat/Healthy Indonesia’ movement in which 2350 Kalbe personnels in 33 branches were volunteering, supplying free medical services in Kalbe’s relief effort to assist flood victims in Central Java, and seminars commemorating the World Cancer Day, World Kidney Day, World Diabetes Day, and National Senior Citizen Day to increase awareness. Over 29,600 Indonesian beneficiaries have been touched.
Investment Risks
10UNIVERSITY OF INDONESIA STUDENT RESEARCH -‐ KLBF.JK
CFA Institute Research Challenge 30 Oct 2013
Increase in Minimum Wage. A Labor Strike recently occurred in one of Kalbe’s factories and more than 500 labors from the same industrial complained about their minimum wage as they urged to increase theirs. Kalbe, in response to the labor strike, stated that the company has reduced the outsourcing contract. We expect that an annual 10% increase in labor expense could potentially decrease 4% of Kalbe’s Net Income per year, decreasing 5% of our target price. But, our calculation shows that historical salaries per worker in Kalbe outgrew the growth of minimum wage. In 2012, Kalbe salaries grew 13.49% per worker. Therefore, our team is certain that this potential up-heave in incremental wages is not a big issue for Kalbe as it has always been setting the salaries higher than minimum requirement. Thus, the damage is reasonably low.
BUSINESS SPECIFIC RISK:
License & Patent Expiration. Kalbe benefits a lot from purchasing licenses or patents. A clumsy move in dealing with license expiration will cause a big damage to the company’s profitability. Kalbe’s pharmaceutical segment consists of 26.3% licensed product. There is a considered around 6.6% sales downslide due to this licensed risk exposure because Kalbe’s licensed products accounts for small portion of sales, but the inexistency of licensed products will inadequate this segment to capture the potential growth. This patent risk is unlikely to happen due to the discipline management within the firm.
Drug Counterfeiting. As a drug maker and drug-selling company, Kalbe should be aware of the fake drugs that are in the markets right now. This is important since counterfeiting drugs might reduce company’s revenue and slow down sales turnover. Counterfeiting activities happens quite often and Kalbe should also take part in eliminating these fake drugs from the market. On top of that, we deeply realized that consumer’s health is at stake if these fake drugs are still on the market. According to BPOM, there are at least 0.5% fake drugs are on the market.
Reputational Risk. In a business that is built and based on trust between the consumers and the company, a pharmaceutical company really needs high concern in this risk. Reputation is vital for Kalbe as a pharmaceutical company, since reputation itself will increase repeat purchase. A bad reputation might impact Kalbe’s future sales. Moreover, a reputational issue is very sensitive and in circles with other issue and that is why this risk needs to be considered.
Competing against State Owned Enterprise. Though Kalbe has stood tall for a long time in this industry among 200 players, new entrants and the competition especially from the SOE will crowd the competition even more. This kind of consumer goods industry is a very price sensitive and that is why that it is very easy to change product over time. The situation gets harder when private company is facing State Owned Enterprise in a price sensitive market. An irrational pricing from SOE will hurt Kalbe’s profitability, especially during NHI implementation. Furthermore, Kalbe will still have their shares during NHI because there are 3 SOE’s in this pharmaceuticals market and only account for 45% of Market share, which means that they still cannot fulfill the whole market, and they still need Kalbe performance which accounts for 16% market share. Another scenario will happen when the markets are overflowed with pharmaceuticals companies. The government will encourage a M&A process to save Government’s Pharmaceutical company. This type of risk is highly associated with regulatory changes.
Disruption of supply chain and distribution. Relying on the raw materials, Kalbe is exposed to risks that may incur in each purchase they make, mostly involving late delivery. In Indonesia, this cause is highly correlated with holidays, which is not favorable since in such times, high demands are not met with according supplies. Luckily, Kalbe has a very high strong Cash Ratio of 18% in 2013. With no debt, Kalbe in a safe position above the risk. Learning how the availability of drugs increases drug sales, making distribution a very important key, Kalbe has equipped itself with its own retail store. Kalbe already has more than 60 branches in 48 cities and still expanding. However, Kalbe only has 2 RDC’s to date. This will deploy risks of over dependence on these only two distribution centers and will indirectly deprive the margin of distribution from its inefficiency. Kalbe’s retail & distribution is still in growing phase, but as distribution gets more mature over time, inefficiency will be evitable.
IT system failure. IT and communication system are crucial to the efficient operation at Kalbe. The whole system includes managing inventory, supply chain, and managing distribution. It is critical that Kalbe handles and calculates order and delivery time that minimum costs. A crash in IT systems will cause a systemic damage. But, luckily this risk is being managed and reviewed periodically. At this moment, Kalbe has been using High-Tech Citrix & Oracle Software to manage their business.
Other Risk. There are several other risk that lie in the activity and the nature of this business, such as production failure rate that may produce additional cost. Furthermore another surprise M&A action from other competitor will affect Kalbe marketshare as well as sales thus affecting our target price.
Despite the small impact towards Kalbe’s Sales Growth, the likelihood of this put off is small due to several political interest to win the next Presidential. Furthermore, we are also aware that the implementation might take time and cause a bit problem during the implementation.
Loosening Limitation on Foreign Company. As we have said about how strict our government has made it for foreign companies, it is dangerous if government is suddenly being lenient towards foreign players by changing the regulation. If this risk happen, all of local player including Kalbe. Losing its market share and thus reducing sales and adding challenges posed by the change of regulation might reduce pharmaceutical business prospect in Indonesia , or even reducing our valuation towards Kalbe.

APPENDIX 1. INCOME STATEMENT
Income Statement (in Billion IDR) FY2010 FY2011 FY2012 FY2013E FY2014E FY2015E FY2016E FY2017E FY2018ENet Sales 10,228 10,911 13,637 15,709 18,114 20,910 24,163 27,951 32,369COGS -4,977 -5,276 -7,010 -8,019 -9,221 -10,331 -11,844 -13,500 -15,407Gross Profit 5,251 5,635 6,627 7,690 8,893 10,579 12,319 14,452 16,962SGA Expense -3,168 -3,380 -4,102 -4,725 -5,449 -6,290 -7,268 -8,408 -9,737R&D Expense -91 -87 -86 -99 -114 -132 -152 -176 -204EBITDA 1,992 2,168 2,439 2,866 3,330 4,157 4,898 5,867 7,021Depreciation -197 -197 -219 -279 -322 -372 -430 -497 -576Others income (expense) -37 -63 33 18 21 25 30 36 36EBIT 1,758 1,908 2,253 2,604 3,029 3,810 4,499 5,407 6,481Int Income (Expense) 34 84 56 44 91 115 135 163 195EBT 1,792 1,992 2,309 2,648 3,121 3,925 4,634 5,569 6,677Tax -429 -464 -533 -611 -720 -906 -1,070 -1,286 -1,541Net Income 1,363 1,528 1,776 2,037 2,400 3,019 3,564 4,284 5,135Profit to Non-Controlling Interest -57 -41 -41 -47 -55 -70 -82 -99 -119Profit to Shareholder 1,306 1,487 1,735 1,990 2,345 2,949 3,482 4,185 5,017EPS (Adjusted to Stock Split) 28 32 37 42 50 63 74 89 107
UNIVERSITY OF INDONESIA STUDENT RESEARCH -‐ KLBF.JK
GREY GOOSE CAPITAL
11
Source: Company, UISR estimates

APPENDIX 2. BALANCE SHEET
Statement of Financial Position (in Billion IDR)Statement of Financial Position (in Billion IDR) FY2010 FY2011 FY2012 FY2013E FY2014E FY2015E FY2016E FY2017E FY2018EAssets Cash and Cash Equivalents 1,902 2,291 1,860 1,805 2,163 2,850 3,754 4,907 6,187Accounts Receivables 1,263 1,530 1,805 2,079 2,398 2,768 3,198 3,700 4,284Inventories 1,551 1,705 2,115 2,430 2,748 2,924 3,281 3,645 4,206Prepaid Expenses 69 96 128 75 87 97 111 127 145Other Current Assets 246 370 534 562 595 632 674 721 773Total Current Assets 5,031 5,992 6,442 6,951 7,990 9,271 11,018 13,099 15,595Long Term Investment 48 53 49 49 49 49 49 49 49Net PPE 1,605 1,860 2,255 3,176 3,653 4,034 4,474 4,983 5,572Other Non-Current Assets 348 368 672 672 672 672 672 672 672Total Non-Current Assets 2,001 2,281 2,976 3,897 4,374 4,755 5,195 5,704 6,293
Total Assets 7,032 8,273 9,418 10,848 12,365 14,026 16,213 18,803 21,889 Liabilities and Shareholder Equity Notes Payable 25 140 205 350 350 200 200 200 200Accounts Payable 822 1,226 1,324 1,515 1,742 1,951 2,237 2,550 2,910Accrued Expenses 297 263 362 414 476 534 612 697 796Total Short Term Liabilities 1,144 1,629 1,891 2,279 2,568 2,685 3,049 3,447 3,906Deferred Tax 8 10 11 11 11 11 11 11 11Long Term Debt 1 0 0 0 0 0 0 0 0Other Non-Current Liabilities 106 118 144 144 144 144 144 144 144Total Non-Current Liabilities 115 128 155 155 155 155 155 155 155Total Liabilities 1,259 1,757 2,046 2,433 2,722 2,840 3,203 3,602 4,060Common Stock 476 476 476 476 476 476 476 476 476Retained Earnings 5,581 6,407 7,251 7,606 8,834 10,378 12,202 14,393 17,020Treasury Stock -687 -687 -687 0 0 0 0 0 0Other Components of Equity 403 320 332 332 332 332 332 332 332Total Equity 5,773 6,516 7,372 8,414 9,642 11,186 13,010 15,201 17,828
Total Liabilities & Equities 7,032 8,273 9,418 10,847 12,364 14,026 16,213 18,803 21,888
UNIVERSITY OF INDONESIA STUDENT RESEARCH -‐ KLBF.JK
GREY GOOSE CAPITAL
12
Source: Company, UISR estimates

APPENDIX 3. STATEMENT OF CASH FLOW
Cash Flow Statement (in Billion IDR) FY2013E FY2014E FY2015E FY2016E FY2017E FY2018ECash Flow From Operation Net Income 2,037 2,400 3,019 3,564 4,284 5,135Depreciation and Amortization 279 322 372 430 497 576Change in NWC -177 -392 -476 -479 -530 -758Total CFFO 2,140 2,331 2,915 3,515 4,251 4,953Cash Flow From Investing Capex -1,200 -800 -753 -870 -1,006 -1,165Short Term Investment 0 0 0 0 0 0Long Term Investment 0 0 0 0 0 0Total CFFI -1,200 -800 -753 -870 -1,006 -1,165Cash Flow From Financing
UNIVERSITY OF INDONESIA STUDENT RESEARCH -‐ KLBF.JK
GREY GOOSE CAPITAL
13
Source: Company, UISR estimates

APPENDIX 4. KEY RATIOS
Key Financial Ratio FY2013E FY2014E FY2015E FY2016E FY2017E FY2018ELiquidity Ratio Current Ratio 3.05 3.11 3.45 3.61 3.80 3.99Quick Ratio 2.77 2.85 3.18 3.36 3.55 3.76Cash Ratio 0.79 0.84 1.06 1.23 1.42 1.58Operating Ratio Total Asset Turnover 1.55 1.56 1.58 1.60 1.60 1.59Fixed Asset Turnover 4.57 4.38 4.58 4.86 5.13 5.40A/R Turnover 8.09 8.09 8.10 8.10 8.10 8.11Collection Period (days) 44.51 44.49 44.46 44.44 44.42 44.40Inventory Turnover 3.53 3.56 3.64 3.82 3.90 3.92Days Inventory Held 102.02 101.07 98.81 94.29 92.34 91.72Payables Turnover 5.65 5.66 5.60 5.66 5.64 5.64Payables Period (days) 63.72 63.56 64.34 63.65 63.82 63.79Operating Cycle 82.81 81.99 78.94 75.08 72.94 72.34Profitability Ratio Gross Profit Margin 49.0% 49.1% 50.6% 51.0% 51.7% 52.4%EBIT Margin 16.6% 16.7% 18.2% 18.6% 19.3% 20.0%Net Profit Margin 13.0% 13.3% 14.4% 14.8% 15.3% 15.9%ROA 18.8% 19.4% 21.5% 22.0% 22.8% 23.5%ROE 24.2% 24.9% 27.0% 27.4% 28.2% 28.8%SGA/Sales 30.1% 30.1% 30.1% 30.1% 30.1% 30.1%Solvency Ratio Debt Ratio 22.4% 22.0% 20.2% 19.8% 19.2% 18.6%Debt to Equity Ratio 0.29 0.28 0.25 0.25 0.24 0.23Equity Multiple 1.29 1.28 1.25 1.25 1.24 1.23Long Term Debt Ratio 0.01 0.01 0.01 0.01 0.01 0.01Interest Coverage Ratio -59.19 -33.21 -33.21 -33.21 -33.21 -33.21Net Gearing Ratio -17% -17% -20% -23% -26% -28%
UNIVERSITY OF INDONESIA STUDENT RESEARCH -‐ KLBF.JK
GREY GOOSE CAPITAL
14
Source: Company, UISR estimates
APPENDIX 5. COMPARABLES
Ticker NAME MARKET VALUE (USD) DPO (%) P/E EV/Forward EBITDAKLBF.JK Kalbe Farma 6,215,481,000 60.13 34.50 19.85 Indonesia Consumer GoodsIndonesia Consumer Goods
Ticker NAME MARKET VALUE (USD) DPO (%) P/E EV/Forward EBITDAICBP.JK Indofood CBP Sukses MakmurIndofood CBP Sukses Makmur 5,982,556,500 49.73 29.80 15.29 INDF.JK Indofood Sukses MakmurIndofood Sukses Makmur 5,887,274,400 49.87 20.00 8.70 ROTI.JK Nippon Indosari CorpindoNippon Indosari Corpindo 583,119,270 25.00 42.50 15.98 GGRM.JK Gudang Garam 6,597,700,200 38.35 19.00 9.58 UNVR.JK Unilever Indonesia 21,974,382,000 100.00 45.80 29.67 Industry Median 29.80 15.29 Standar Deviation/MeanStandar Deviation/MeanStandar Deviation/Mean 0.35 0.47 Asian Pharmerging ComparablesAsian Pharmerging ComparablesAsian Pharmerging Comparables
Ticker NAME MARKET VALUE (USD) DPO (%) P/E EV/Forward EBITDA000538.SZ Yunnan Baiyao GroupYunnan Baiyao Group 11,070,489,600 19.74 38.50 23.92 600518.SS Kangmei Pharma 6,852,952,000 30.53 25.50 15.05 600276.SS Jiangsu Hengrui MedicineJiangsu Hengrui Medicine 6,981,732,800 9.18 37.50 20.93 REDY.NS Dr Reddy's LaboratoriesDr Reddy's Laboratories 6,531,827,200 15.18 23.90 13.74 LUPN.NS Lupin 6,283,377,600 13.61 27.30 13.80 Industry Median 27.30 15.05 Standar Deviation/MeanStandar Deviation/MeanStandar Deviation/Mean 0.20 0.24 Indonesia PharmaceuticalsIndonesia Pharmaceuticals
Ticker NAME MARKET VALUE (USD) DPO (%) P/E DVLA.JK Darya-Varia LaboratoriaDarya-Varia Laboratoria 231,840,090 25.95 17.80 PYFA.JK Pyridam Farma 6,886,474 - 19.20 TSPC.JK Tempo Scan Pacific 1,468,124,100 53.57 25.20 INAF.JK Indo Farma 52,439,589 10.01 13.70 KAEF.JK Kimia Farma 344,903,310 15.00 23.40 Industry Median 19.20
!"!!!!
!5.00!!
!10.00!!
!15.00!!
!20.00!!
!25.00!!
!30.00!!
!35.00!!
!40.00!!
!45.00!!
!50.00!!
!"!!!! !0.50!! !1.00!! !1.50!! !2.00!! !2.50!! !3.00!! !3.50!! !4.00!! !4.50!! !5.00!!
ICBP.JK!
ROTI.JK!UNVR.JK!
GGRM.JK!INDF.JK!
P/E!
PEG!
ICBP.JK!
ROTI.JK!UNVR.JK!
GGRM.JK!INDF.JK!
P/E!
PEG!
UNIVERSITY OF INDONESIA STUDENT RESEARCH -‐ KLBF.JK
GREY GOOSE CAPITAL
15
Indonesia’s consumer goods PE VS PEG Comaparables
!20.00!!
!25.00!!
!30.00!!
!35.00!!
!40.00!!
!45.00!!
!0.50!! !0.70!! !0.90!! !1.10!! !1.30!! !1.50!! !1.70!! !1.90!! !2.10!! !2.30!! !2.50!!
Kangmei.SS!LUPN.NS!
REDY.NS!
Jiangsu.SS!Yunnan.SZ!
P/E!
PEG!
Kangmei.SS!LUPN.NS!
REDY.NS!
Jiangsu.SS!Yunnan.SZ!
P/E!
PEG!
UNIVERSITY OF INDONESIA STUDENT RESEARCH -‐ KLBF.JK
GREY GOOSE CAPITAL
16
Asian Pharmerging PE VS PEG Comaparables
Source: Company, UISR estimates

APPENDIX 6. COMMON SIZE BALANCE SHEET, INCOME STATEMENT, AND STATEMENT OF CASH FLOW
1. Common Size Income Statement
Income Statement (in Billion IDR)Income Statement (in Billion IDR) FY2010 FY2011 FY2012 FY2013E FY2014E FY2015E FY2016E FY2017E FY2018ENet Sales 100.00% 100.00% 100.00% 100.00% 100.00% 100.00% 100.00% 100.00% 100.00%COGS -48.66% -48.35% -51.40% -51.05% -50.90% -49.41% -49.02% -48.30% -47.60%Gross Profit 51.34% 51.65% 48.60% 48.95% 49.10% 50.59% 50.98% 51.70% 52.40% Prescription Pharmaceuticals Prescription Pharmaceuticals Net Sales 25.22% 25.45% 24.11% 24.49% 24.85% 25.18% 25.50% 25.79% 26.06%COGS -8.16% -8.54% -9.09% -9.55% -9.94% -9.32% -9.43% -9.54% -9.64%Gross Profit 17.06% 16.91% 15.02% 14.94% 14.91% 15.87% 16.06% 16.25% 16.42% Consumer Health Consumer Health Net Sales 16.63% 16.87% 15.76% 15.32% 14.88% 14.44% 13.99% 13.55% 13.10%COGS -6.93% -7.24% -6.96% -6.77% -6.57% -6.38% -6.18% -5.98% -5.79%Gross Profit 9.70% 9.63% 8.80% 8.56% 8.31% 8.06% 7.81% 7.57% 7.32% Nutritional Net Sales 22.42% 22.18% 22.09% 23.20% 24.34% 25.52% 26.72% 27.95% 29.20%COGS -8.61% -8.36% -8.12% -8.47% -8.89% -9.31% -9.75% -10.20% -10.66%Gross Profit 13.81% 13.82% 13.96% 14.73% 15.46% 16.20% 16.97% 17.75% 18.54% Distribution and Logistic Distribution and Logistic Net Sales 35.73% 35.50% 38.04% 36.99% 35.93% 34.86% 33.79% 32.71% 31.64%COGS -24.95% -24.21% -27.23% -26.26% -25.51% -24.40% -23.65% -22.57% -21.51%Gross Profit 10.77% 11.28% 10.82% 10.73% 10.42% 10.46% 10.14% 10.14% 10.12%SGA Expense -30.97% -30.98% -30.08% -30.08% -30.08% -30.08% -30.08% -30.08% -30.08%R&D Expense -0.89% -0.80% -0.63% -0.63% -0.63% -0.63% -0.63% -0.63% -0.63%EBITDA 19.48% 19.87% 17.89% 18.24% 18.39% 19.88% 20.27% 20.99% 21.69%Depreciation -1.93% -1.81% -1.61% -1.78% -1.78% -1.78% -1.78% -1.78% -1.78%Others income (expense)Others income (expense) -0.36% -0.58% 0.24% 0.11% 0.12% 0.12% 0.13% 0.13% 0.11%EBIT 17.19% 17.49% 16.52% 16.58% 16.72% 18.22% 18.62% 19.34% 20.02%Int Income (Expense)Int Income (Expense) 0.33% 0.77% 0.41% 0.28% 0.50% 0.55% 0.56% 0.58% 0.60%EBT 17.52% 18.26% 16.93% 16.86% 17.23% 18.77% 19.18% 19.93% 20.63%Tax -4.19% -4.25% -3.91% -3.89% -3.98% -4.33% -4.43% -4.60% -4.76%Net Income 13.33% 14.00% 13.02% 12.97% 13.25% 14.44% 14.75% 15.33% 15.87%Profit to Non-Controlling InterestProfit to Non-Controlling Interest -0.56% -0.38% -0.30% -0.30% -0.31% -0.33% -0.34% -0.35% -0.37%Profit to ShareholderProfit to Shareholder 12.77% 13.63% 12.72% 12.67% 12.94% 14.10% 14.41% 14.97% 15.50%EPS (Adjusted to Stock Split)EPS (Adjusted to Stock Split) 0.27% 0.29% 0.27% 0.27% 0.28% 0.30% 0.31% 0.32% 0.33%
UNIVERSITY OF INDONESIA STUDENT RESEARCH -‐ KLBF.JK
GREY GOOSE CAPITAL
17
Source: Company, UISR estimates

2. Common Size Balance Sheet
Statement of Financial Position (in Billion IDR)Statement of Financial Position (in Billion IDR) FY2010 FY2011 FY2012 FY2013E FY2014E FY2015E FY2016E FY2017E FY2018EAssets Cash and Cash EquivalentsCash and Cash Equivalents 27.05% 27.69% 19.75% 16.64% 17.49% 20.32% 23.16% 26.10% 28.26%Accounts ReceivablesAccounts Receivables 17.96% 18.49% 19.17% 19.17% 19.39% 19.73% 19.73% 19.68% 19.57%Inventories 22.06% 20.61% 22.46% 22.40% 22.22% 20.85% 20.24% 19.39% 19.22%Prepaid Expenses 0.98% 1.16% 1.36% 0.69% 0.70% 0.69% 0.69% 0.67% 0.66%Other Current AssetsOther Current Assets 3.50% 4.47% 5.67% 5.18% 4.81% 4.51% 4.16% 3.83% 3.53%Total Current AssetsTotal Current Assets 71.54% 72.43% 68.40% 64.08% 64.62% 66.10% 67.96% 69.66% 71.25%Long Term InvestmentLong Term Investment 0.68% 0.64% 0.52% 0.45% 0.40% 0.35% 0.30% 0.26% 0.22%Net PPE 22.82% 22.48% 23.94% 29.27% 29.55% 28.76% 27.59% 26.50% 25.46%Other Non-Current AssetsOther Non-Current Assets 4.95% 4.45% 7.14% 6.19% 5.43% 4.79% 4.14% 3.57% 3.07%Total Non-Current AssetsTotal Non-Current Assets 28.46% 27.57% 31.60% 35.92% 35.38% 33.90% 32.04% 30.34% 28.75%
Total Assets 100.00% 100.00% 100.00% 100.00% 100.00% 100.00% 100.00% 100.00% 100.00%Liabilities and Shareholder EquityLiabilities and Shareholder Equity Notes Payable 0.36% 1.69% 2.18% 3.23% 2.83% 1.43% 1.23% 1.06% 0.91%Accounts Payable 11.69% 14.82% 14.06% 13.96% 14.09% 13.91% 13.80% 13.56% 13.29%Accrued Expenses 4.22% 3.18% 3.84% 3.82% 3.85% 3.80% 3.77% 3.71% 3.63%Total Short Term LiabilitiesTotal Short Term Liabilities 16.27% 19.69% 20.08% 21.01% 20.77% 19.14% 18.80% 18.33% 17.84%Deferred Tax 0.11% 0.12% 0.12% 0.10% 0.09% 0.08% 0.07% 0.06% 0.05%Long Term Debt 0.01% 0.00% 0.00% 0.00% 0.00% 0.00% 0.00% 0.00% 0.00%Other Non-Current LiabilitiesOther Non-Current Liabilities 1.51% 1.43% 1.53% 1.32% 1.16% 1.02% 0.89% 0.76% 0.66%Total Non-Current LiabilitiesTotal Non-Current Liabilities 1.64% 1.55% 1.64% 1.43% 1.25% 1.10% 0.95% 0.82% 0.71%Total Liabilities 17.90% 21.24% 21.72% 22.43% 22.02% 20.24% 19.76% 19.15% 18.55%Common Stock 6.77% 5.75% 5.05% 4.39% 3.85% 3.39% 2.94% 2.53% 2.17%Retained EarningsRetained Earnings 79.37% 77.44% 76.99% 70.12% 71.44% 73.99% 75.26% 76.55% 77.76%Treasury Stock -9.77% -8.30% -7.29% 0.00% 0.00% 0.00% 0.00% 0.00% 0.00%Other Components of EquityOther Components of Equity 5.73% 3.87% 3.53% 3.06% 2.69% 2.37% 2.05% 1.77% 1.52%Total Equity 82.10% 78.76% 78.28% 77.56% 77.98% 79.75% 80.24% 80.84% 81.45%
Total Liabilities & Equities Total Liabilities & Equities 100.00% 100.00% 100.00% 100.00% 100.00% 100.00% 100.00% 100.00% 100.00%
UNIVERSITY OF INDONESIA STUDENT RESEARCH -‐ KLBF.JK
GREY GOOSE CAPITAL
18
Source: Company, UISR estimates

3. Common Size Statement of Cash flow
Cash Flow Statement (in Billion IDR) Cash Flow Statement (in Billion IDR) FY2013E FY2014E FY2015E FY2016E FY2017E FY2018ECash Flow From OperationCash Flow From Operation Net Income 12.97% 13.25% 14.44% 14.75% 15.33% 15.87%Depreciation and AmortizationDepreciation and Amortization 1.78% 1.78% 1.78% 1.78% 1.78% 1.78%Change in NWC -1.12% -2.16% -2.28% -1.98% -1.89% -2.34%Total CFFO 13.62% 12.87% 13.94% 14.55% 15.21% 15.30%Cash Flow From InvestingCash Flow From Investing 0.00% 0.00% 0.00% 0.00% 0.00% 0.00%Capex -7.64% -4.42% -3.60% -3.60% -3.60% -3.60%Short Term InvestmentShort Term Investment 0.00% 0.00% 0.00% 0.00% 0.00% 0.00%Long Term InvestmentLong Term Investment 0.00% 0.00% 0.00% 0.00% 0.00% 0.00%Total CFFI -7.64% -4.42% -3.60% -3.60% -3.60% -3.60%Cash Flow From FinancingCash Flow From Financing 0.00% 0.00% 0.00% 0.00% 0.00% 0.00%Dividend Paid -6.33% -6.47% -7.05% -7.21% -7.49% -7.75%Total CFFF -6.33% -6.47% -7.05% -7.21% -7.49% -7.75%Net change in cashNet change in cash -0.35% 1.98% 3.29% 3.74% 4.12% 3.95%Beginning Cash 11.84% 9.96% 10.34% 11.80% 13.43% 15.16%Ending Cash 11.49% 11.94% 13.63% 15.54% 17.56% 19.11%
UNIVERSITY OF INDONESIA STUDENT RESEARCH -‐ KLBF.JK
GREY GOOSE CAPITAL
19
Source: Company, UISR estimates

APPENDIX 7. DCF ASSUMPTIONS
Free Cash Flow (in Billion IDR) FY2010 FY2013E FY2014E FY2015E FY2016E FY2017E FY2018EEBIT 2,604 3,029 3,810 4,499 5,407 6,481Less: Operating Taxes -601 -699 -880 -1,038 -1,248 -1,496NOPLAT 2,003 2,330 2,931 3,460 4,159 4,985Add back: Depreciation 279 322 372 430 497 576Less: Change in Net Working Capital 177 392 476 479 530 758Gross Investment -1,200 -800 -753 -870 -1,006 -1,165Cash Flow 1,259 2,244 3,026 3,500 4,179 5,154Terminal Value 5.50% 95,391 Free Cash Flow 1,259 2,244 3,026 3,500 4,179 100,544
Risk Free Rate 10-year Indonesian Government Bond (6.9%)
Beta0.86 calculated by regressing 5-year historical daily return to historical JCI daily return with t-stat of 20.78. We are using JCI because 96% of Kalbe's market is in Indonesia
Market Risk Premium 5%; common industry practice
Beta calculation
SUMMARY OUTPUTSUMMARY OUTPUT
Regression StatisticsRegression Statistics
Multiple R 0.488125123
R Square 0.238266136
Adjusted R Square 0.237714555
Standard Error 0.024591902
Observations 1383
ANOVA
df SS MS F Significance F
Regression 1 0.261238369 0.261238369 431.9691554 1.0651E-‐83
Residual 1381 0.835175807 0.000604762
Total 1382 1.096414177
CoefficientsStandard Error t Stat P-‐value Lower 95% Upper 95% Lower 95.0% Upper 95.0%
Intercept 0.00137202 0.000661593 2.073810751 0.038281865 7.41828E-‐05 0.002669856 7.41828E-‐05 0.002669856
X Variable 1 0.854057373 0.041092322 20.78386767 1.0651E-‐83 0.773447254 0.934667492 0.773447254 0.934667492
UNIVERSITY OF INDONESIA STUDENT RESEARCH -‐ KLBF.JK
GREY GOOSE CAPITAL
20
Source: Company, UISR estimates

APPENDIX 8. NATIONAL HEALTHCARE INSURANCE SCHEME
National Healthcare Insurance (NHI)
A new healthcare reform by Government of Indonesia plans to cover all the medical check-up, drugs or anything that is suggested by doctors. This Program is called National Healthcare Insurance and aimed to have all citizens insured by 2019 that counts up to 250 million citizens. We can see from the regulation (see appendices) that this NHI Implementation is an interplay between BPJS Kesehatan, Clients of Jamkesmas, and Healthcare Facility and Government.
But, implementing this NHI scheme is not that easy because the clients of Healthcare insurance are divided into several Government Insurance Institutions such as Jamsostek, Askes, Jamkesmas and Asabri. As of 2012, only 63% of the population has healthcare insurance. Among that 63%, the low income people have been covered by Jamkesmas, civil employee have been covered by Askes and the private employee are covered by Jamsostek. NHI needs to amalgamate all the clients from all these government insurance companies. Therefore, the first step is to shift the existing member of Askes, Jamkesmas and Jamsostek membership into NHI.
For 2014, Which will be the first year of implementation, Government estimates that there will be a 112 out of 250 million people who will join NHI membership program. This program sounds so promising and it will be also a significant increase in National Healthcare spending from the government to cover this soon-to-be-true NHI plan.
Due to this National Scale plan, NHI needs to apply open tender application for company who will be drug supplier during NHI. Tenders will be classified per medicine volume quota treatment. See the Tender process below. The winner of this process tender will be most likely granted and allowed to sell 60% of of the drugs that being sold during NHI (most likely unbranded generics).
In order for the people can be insured by government, they have to meet the premium requirement. According to Government Budget Plan 2014 (RAPBN 2014), each people will have to pay Rp 19,225/month. Government will then have allocation in amount of this premium to take care of 86.4 million poor people. Each people have different premium basically diversed by their economic class. For those who works, The premium for employed people are around 5-6% of income so that it will boost the growth in the market. This premium of this insurance will not always be used for all unbranded generic market, but some of this premium will be used to pay the doctor. Of course, there is also an insurance firm who will take profit from this insurance system.
In terms of funding and developing this system into a greater efficient system, Government has set that 0.5% of premium payment will be used for the development of this NHI and improving infrastructure. Government also believed that investor will automatically come to improve NHI. Unfortunately, they predict that these investors are most likely non-private investor, Thus, it will make NHI depends on Government support.
Despite of their strategy, NHI Committees are committed to improve the quality of medical services and non medical service. Government also conduct a quality control system that will be regularly checked and customer satisfaction for every 6 months
NHI Coverage Plan
UNIVERSITY OF INDONESIA STUDENT RESEARCH -‐ KLBF.JK
GREY GOOSE CAPITAL
21

Projection for clients in 2014
Projection for Social Security receivers, 2014 National Health Insurance (m ppl) % of population Previous CoverageSubsidy Receivers (national) 86 34 JamkesmasCivil Servants, retires, veterans 17 7 AskesPrivate and public employees 6 2 JamsostekMilitary and police family 3 1 Ministry of HealthTotal 112 49 Non NHI 40 16 Summary Total NHI 2014 112 49 Total non-‐NHI 2014 40 12 Total non-‐insured 99 39 Total Population in 2014 250 100 Source : Roadmap to NHI 2012-‐2019
A Roadmap to NHI Implementation
UNIVERSITY OF INDONESIA STUDENT RESEARCH -‐ KLBF.JK
GREY GOOSE CAPITAL
22

UNIVERSITY OF INDONESIA STUDENT RESEARCH -‐ KLBF.JK
GREY GOOSE CAPITAL
23
Tender Process & NHI Scheme
National Healthcare Insurance; High Boost in Low Margin Market
The NHI scheme is getting crystal clear, it is getting more certain that it will be held by January 2014. Our President himself launch a ceremony on October 21st 2013 to formalize this NHI Scheme. According to the latest published Government Budget Plan for 2014 (RAPBN 2014), Government allocates their budget to cover 86.4 millions of unfortunate people, covering a premium payment of Rp 19,225/person for the whole 12 months in 2014. This Additional market size of Rp 19.932 Trillion will increase the overall ethical pharmaceutical market. Hopefully Kalbe will able to capture at maximum additional of Rp 287 billion in unbranded generics sectors by maintaining its market share. This additional upside, will be even more surprising if Kalbe can win the government tender of NHI Scheme to supply and produce drugs in larger quantity. There is an open tender process in NHI Scheme The winner of this process tender will be most likely granted and allowed to sell 60% of of the drugs that being sold during NHI. Even if this 60% sales goes to the Pharmaceutical SOE, there is still a room for Kalbe to take an advantage. Technically Kalbe still has chance to have around 15% of the sales, since the sum of market share of 3 Pharmaceutical SOE only equals to 45%. That is why pharmaceutical will still benefit from NHI tender process. Moreover, in Government budget Plan for 2014 (RAPBN 2014), Ministry of Defense also has its own healthcare allocation for Army of Republic Indonesia to support this NHI Scheme. This NHI is a super booster if it is effectively implemented and will impose an exponential growth in unbranded generics sales till the next 5 years.

APPENDIX 9. KALBE’S ORGANIZATIONAL STRUCTURE
UNIVERSITY OF INDONESIA STUDENT RESEARCH -‐ KLBF.JK
GREY GOOSE CAPITAL
24
Source: Company

APPENDIX 10. KALBE’S OWNERSHIP STRUCTURE
UNIVERSITY OF INDONESIA STUDENT RESEARCH -‐ KLBF.JK
GREY GOOSE CAPITAL
25
Source: Company
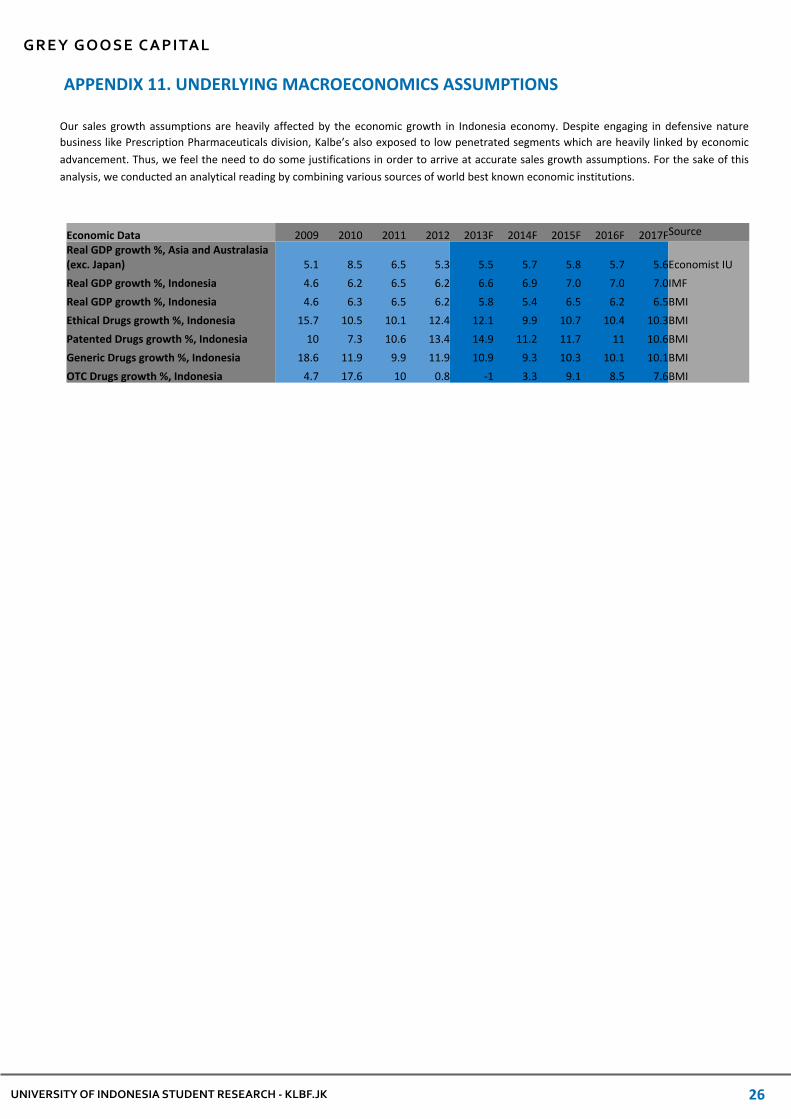
APPENDIX 11. UNDERLYING MACROECONOMICS ASSUMPTIONS
UNIVERSITY OF INDONESIA STUDENT RESEARCH -‐ KLBF.JK
GREY GOOSE CAPITAL
26
Our sales growth assumptions are heavily affected by the economic growth in Indonesia economy. Despite engaging in defensive nature business like Prescription Pharmaceuticals division, Kalbe’s also exposed to low penetrated segments which are heavily linked by economic advancement. Thus, we feel the need to do some justifications in order to arrive at accurate sales growth assumptions. For the sake of this analysis, we conducted an analytical reading by combining various sources of world best known economic institutions.
Economic Data 2009 2010 2011 2012 2013F 2014F 2015F 2016F 2017FSourceReal GDP growth %, Asia and Australasia (exc. Japan) 5.1 8.5 6.5 5.3 5.5 5.7 5.8 5.7 5.6Economist IUReal GDP growth %, Indonesia 4.6 6.2 6.5 6.2 6.6 6.9 7.0 7.0 7.0IMFReal GDP growth %, Indonesia 4.6 6.3 6.5 6.2 5.8 5.4 6.5 6.2 6.5BMIEthical Drugs growth %, Indonesia 15.7 10.5 10.1 12.4 12.1 9.9 10.7 10.4 10.3BMIPatented Drugs growth %, Indonesia 10 7.3 10.6 13.4 14.9 11.2 11.7 11 10.6BMIGeneric Drugs growth %, Indonesia 18.6 11.9 9.9 11.9 10.9 9.3 10.3 10.1 10.1BMIOTC Drugs growth %, Indonesia 4.7 17.6 10 0.8 -‐1 3.3 9.1 8.5 7.6BMI

APPENDIX 12. SALES GROWTH ANALYSIS BY SEGMENT
1. Prescription Pharmaceuticals
UNIVERSITY OF INDONESIA STUDENT RESEARCH -‐ KLBF.JK
GREY GOOSE CAPITAL
27
This division covers three product classes, manages about 383 products as of 2012 which will keep expanding. PP contributes 25% of 1H 2013 consolidated sales.
Licensed Drug. Kalbe has wide portfolio of licenced drugs covering 16 therapeutic classes. It has added six new products in 2012, in total amounting to 89 products, more than doubled its portfolio compare to only 42 products in 2005. Kalbe’s main licensing partners are Baxter, Astellas, Samyang, Daiichi-‐Sankyo, Sinclair, Orio, Smith & Nephew, BioGaia, Boryung, Cymbiotics, Helsin and Winclove.
Branded Generics. Kalbe has 254 branded generic products covering anti-‐infectives, CVS, alimentary tract and metabolism drugs. Kalbe adopts first mover strategy by being the first manufacturer in the market to produce branded generics upon drugs have reached expiration.
Unbranded Generics. This the smallest subsegment in PP with currently 40 products, yet the fastest growing especially with government’s plan to implement NHI at the beginning of 2014. Kalbe has prepared by adding another manufacturing facility in Cikarang, West Java with production capacity of 87 million tablets per month.
Growth Drivers• Wide product portfolio should deliver above average growth result. Kalbe has the largest market share in this segment, securing 13%, winning over in this crowded industry with 200+ players (Euromonitor 2013).
• Kalbe also has the largest medical representatives across the industry with 2300+, leaving its competitors far behind with almost half and a third of its size.
• Strong distribution channels with coverage as wide as 70% of general practitioners, 90% of specialists, and 100% of hospitals in Indonesia are a clear advantage to accelerate growth.
• The implementation of NHI should especially boost unbranded generic subsegment. We expect current 16.6% market will grow as huge opportunities presented ahead.
Taking consideration of Kalbe’s strong execution track record, combined with strong fundamentals ahead. We estimate this segment to grow at 15% CAGR for five years.
14.0%&
10.5%&10.1%& 12.4%& 12.1%&
17.5%& 16.5%&
7.7%&
18.4%& 18.0%&
2009& 2010& 2011& 2012& 2013E&
Industry& Kalbe&
Unbranded generics market share Q3 2013
Kalbe’s PP has managed to grow faster above industry
4%
0%#
5%#
10%#
15%#
20%#
25%#
30%#
35%#
40%#
2005# 2012#
Pfizer#
Sanofi#Aven4s#
Sanbe##
Dexa#
Kalbe#
5%
5%
4%
4%
9%
12%
10%
3%
13%
4%
Kalbe’s PP market leading position
Kalbe’s PP sales breakdown
0%#
20%#
40%#
60%#
80%#
100%#
120%#
2005# 2012#
Unbranded#generics#
Branded#generics#
Licensed#drugs#
32%
58%
10%
29%
60%
11%
Source: Company data, Euromonitor, BMI, UISR estimates
17%$
26%$
13%$
44%$
Kalbe$ Biofarma$ Indofarma$ Other$

2. Consumer Health
UNIVERSITY OF INDONESIA STUDENT RESEARCH -‐ KLBF.JK
GREY GOOSE CAPITAL
28
Consumer health comprised of two product classes, OTC drugs and Energy and Health drinks. This division contributes 16% of Kalbe’s consolidated sales.
OTC drugs. Kalbe’s OTC drugs consist of products with therapeutic benefits, consumer products with health benefits, including supplements and other preventive products. These products cover 6 different therapeutical classes with strong brand equity that have dominated the market over a long period of time. Indonesia OTC market is the largest in Southeast Asia, thanks to its large population. According to BMI its twice the size of philippines.
Energy drinks. Kalbe has been struggling in facing the competitive landscape of energy drink. ExtraJoss, its leading brand for energy drink, has been losing market share, down 700 bps to 24% in 2012 but still manage to be #2. Competition mainly driven by the shifting of consumer preference towards liquid energy drink (ExtraJoss is energy drink powder).
Kalbe’s Consumer Health products market share (vol.)
Kalbe’s #1 position in CH crowded industry
10%$ 10%$
8%$
0%$
2%$
4%$
6%$
8%$
10%$
12%$
Kalbe$ Tempo$ Soho$Kalbe’s Cosumer Health products, among them are Top-of-Mind in Indonesian market
like Komix (cough syrup)
We estimate Consumer Health to grow at 17% CAGR 12-‐18. We base our estimation by several key points as follow:-‐ Local OTC drugs are still preferred for as domestic player usually set prices far below foreign ones. Our survey to local stores identified that Panadol (cough and cold) by Bayer is far more expensive, selling IDR 7.700 (10 tablets), compare to Mixagrip by Kalbe at only IDR 1.600 (4 tablets). Due to large portion of population are of low income, lower products will still play an important determinant.
-‐ Kalbe’s CH division covers more than 200.000 outlets nationwide, reaching 80% of Consumers Health market. It also employs more than 1000 personnels of sales force, making sure that Kalbe’s CH products will be available to consumers.
!11.20%'
17%'
!2%'
8%'
17%'
0'
500'
1000'
1500'
2000'
2500'
!15.00%'
!10.00%'
!5.00%'
0.00%'
5.00%'
10.00%'
15.00%'
20.00%'
2008' 2009' 2010' 2011' 2012'
Sales'
Growth'
Kalbe’s Cosumer Health sales
Source: Company data, UISR estimates
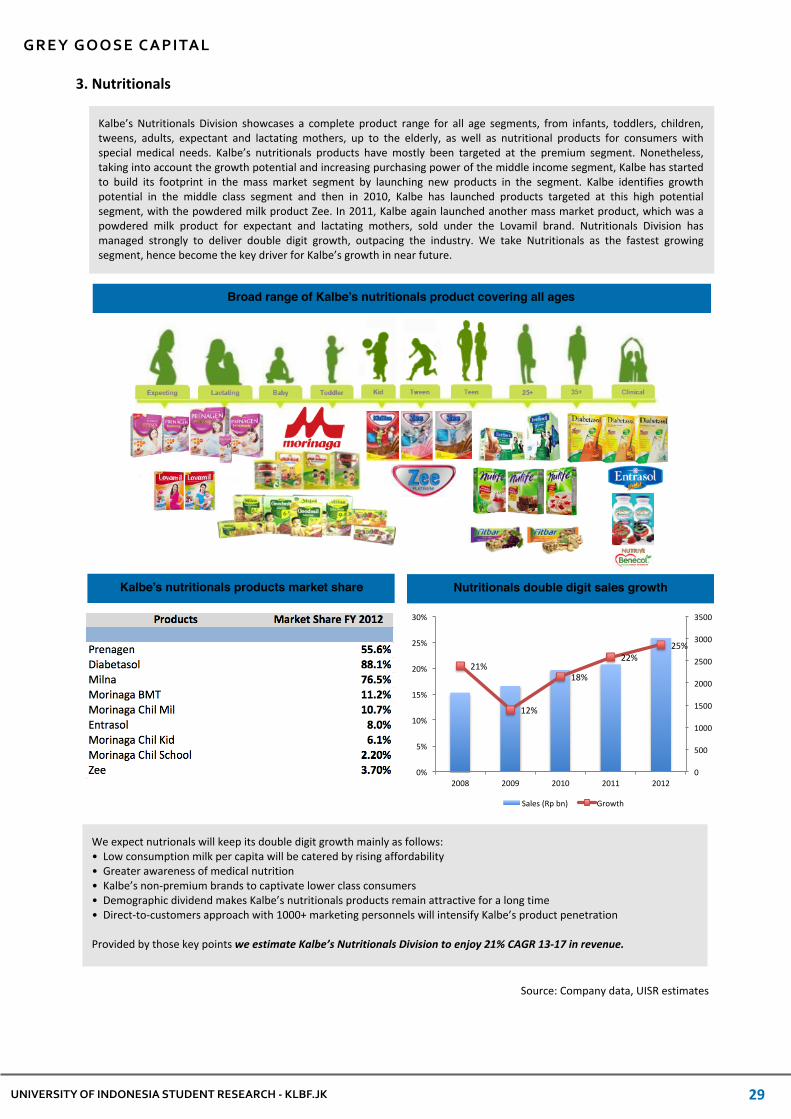
3. Nutritionals
UNIVERSITY OF INDONESIA STUDENT RESEARCH -‐ KLBF.JK
GREY GOOSE CAPITAL
29
Kalbe’s Nutritionals Division showcases a complete product range for all age segments, from infants, toddlers, children, tweens, adults, expectant and lactating mothers, up to the elderly, as well as nutritional products for consumers with special medical needs. Kalbe’s nutritionals products have mostly been targeted at the premium segment. Nonetheless, taking into account the growth potential and increasing purchasing power of the middle income segment, Kalbe has started to build its footprint in the mass market segment by launching new products in the segment. Kalbe identifies growth potential in the middle class segment and then in 2010, Kalbe has launched products targeted at this high potential segment, with the powdered milk product Zee. In 2011, Kalbe again launched another mass market product, which was a powdered milk product for expectant and lactating mothers, sold under the Lovamil brand. Nutritionals Division has managed strongly to deliver double digit growth, outpacing the industry. We take Nutritionals as the fastest growing segment, hence become the key driver for Kalbe’s growth in near future.
Broad range of Kalbe’s nutritionals product covering all ages
Kalbe’s nutritionals products market share Nutritionals double digit sales growth
21%$
12%$
18%$
22%$25%$
0$
500$
1000$
1500$
2000$
2500$
3000$
3500$
0%$
5%$
10%$
15%$
20%$
25%$
30%$
2008$ 2009$ 2010$ 2011$ 2012$
Sales$(Rp$bn)$ Growth$
We expect nutrionals will keep its double digit growth mainly as follows:• Low consumption milk per capita will be catered by rising affordability• Greater awareness of medical nutrition• Kalbe’s non-‐premium brands to captivate lower class consumers• Demographic dividend makes Kalbe’s nutritionals products remain attractive for a long time• Direct-‐to-‐customers approach with 1000+ marketing personnels will intensify Kalbe’s product penetration
Provided by those key points we estimate Kalbe’s Nutritionals Division to enjoy 21% CAGR 13-‐17 in revenue.
Source: Company data, UISR estimates

4. Distribution & Logistics
UNIVERSITY OF INDONESIA STUDENT RESEARCH -‐ KLBF.JK
GREY GOOSE CAPITAL
30
The Company’s distributing activities, run by its subsidiary, PT Enseval Putera Megatrading Tbk (91.75% stake by Kalbe), constitute the largest network in Indonesia for pharmaceutical products. The availability of products in all regions of Indonesia is one of the keys to success in securing market domination and maintaining a leadership position. In addition to distributing Kalbe products, the Distribution and Logistics Division also provides distribution services for third-‐party principals as well as marketing medical equipment, raw materials for pharmaceuticals and health clinics. Distribution and Logistics Division provides complete logistic infrastructure with an integrated information technology at 65 branches in 47 cities across Indonesia.
Key third party partners Kalbe’s D&L sales growth
Source: Company data, UISR estimates
21.0%&
24.5%&
15.1%&13.8%&
6.0%&
34.1%&
0.0&
1000.0&
2000.0&
3000.0&
4000.0&
5000.0&
6000.0&
0.0%&
5.0%&
10.0%&
15.0%&
20.0%&
25.0%&
30.0%&
35.0%&
40.0%&
2007& 2008& 2009& 2010& 2011& 2012&
Sales&(Rp&bn)& Growth&
We expect the sales from Distribution and Logistic will be normalized to above 10% percent levels. The 34.4% spike in revenue was driven by contract with Abbot Indonesia. However, we identify several drivers that in our view will keep Distribution and Logistic segment remains buoyant, among others (1) establishment of front-‐end clinics Mitrasana for low-‐end consumers, (2) Kalbe’s aggressive strategy, (3) Kalbe’s plan to build another RDC in Sumatera island, (4) Increase in sales contribution from third party partners. Thus, we estimate Distribution and Logistic segment will grow at 12% CAGR 13-‐18. Another upside potentials might manifest if Kalbe could manage to arrange another contract like it did with Abbot Indonesia.
45%$
24%$
16%$
8%$7%$0%$0%$
Consumer$Products$
Prescrip9on$Medicines$
Non$Prescrip9on$Medicines$
Medical$Devices$
Raw$Materials$
Veterinary$
Health$Care$Services$
EPMT revenue split FY 2012
Kalbe’s extensive distribution channels
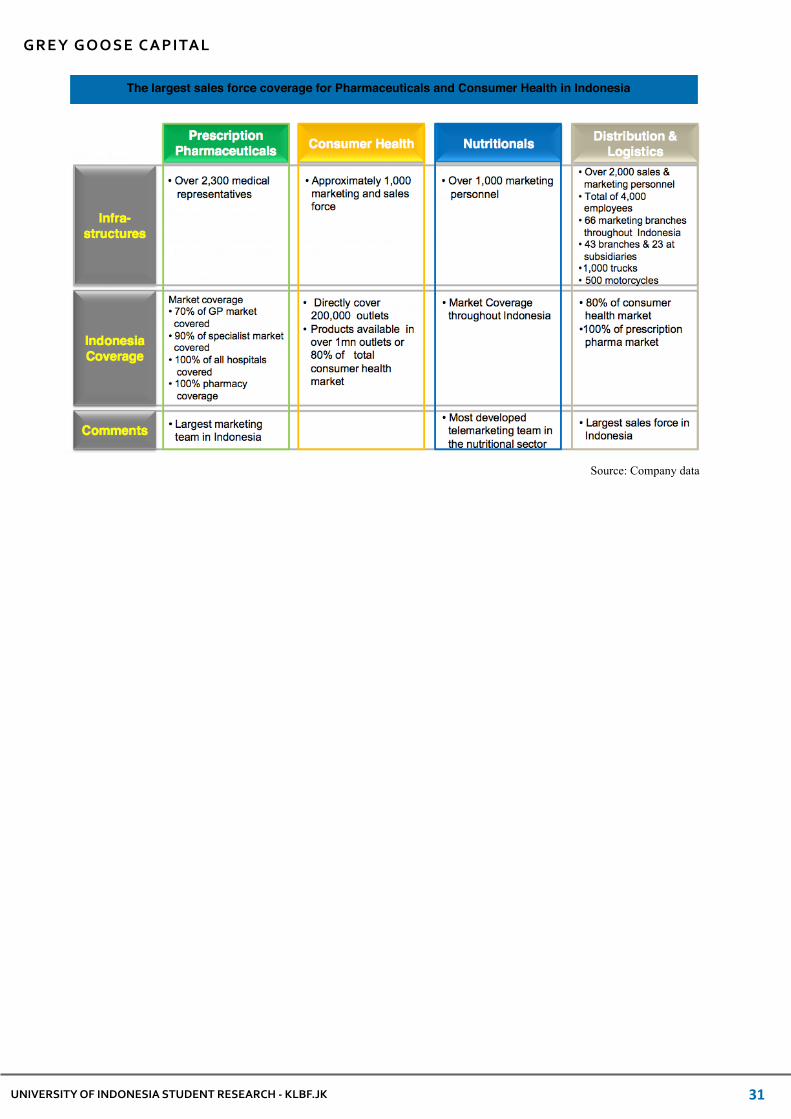
UNIVERSITY OF INDONESIA STUDENT RESEARCH -‐ KLBF.JK
GREY GOOSE CAPITAL
31
Source: Company data
The largest sales force coverage for Pharmaceuticals and Consumer Health in Indonesia

OECD Scoring Criteria Weight Score Weighted Score
Right of Shareholders 10% 82 8.2
Equitable Treatment 15% 76 11.4
Role of Stakeholders 10% 72 7.2
Disclosure & Transparency 25% 93 23.3
Responsibilities of the Board 40% 81 32.4
Total 100% 82.5
Evaluated by using ASEAN CG Scorecard based on OECD framework, Kalbe managed to reach a total score of 82.5 in Corporate Governance which is can be classified as World Class (>80). The score is obtained by judging the Corporate Governance aspects as can be seen at above table. Each aspect is assigned with specific weight according to its importance.
Kalbe is also recognized to be included in Top 30 Publicly Listed Companies (PLCs) list with highest Corporate Governance score in Indonesia according to Indonesian Institute for Corporate Directorship. This further confirms that Kalbe Farma has excellent Corporate Governance implementation.
UNIVERSITY OF INDONESIA STUDENT RESEARCH -‐ KLBF.JK
GREY GOOSE CAPITAL
32
APPENDIX 13. KALBE’S CORPORATE GOVERNANCE ASSESSMENT
Source: Company data, UISR
Source: Company data, OECD, UISR
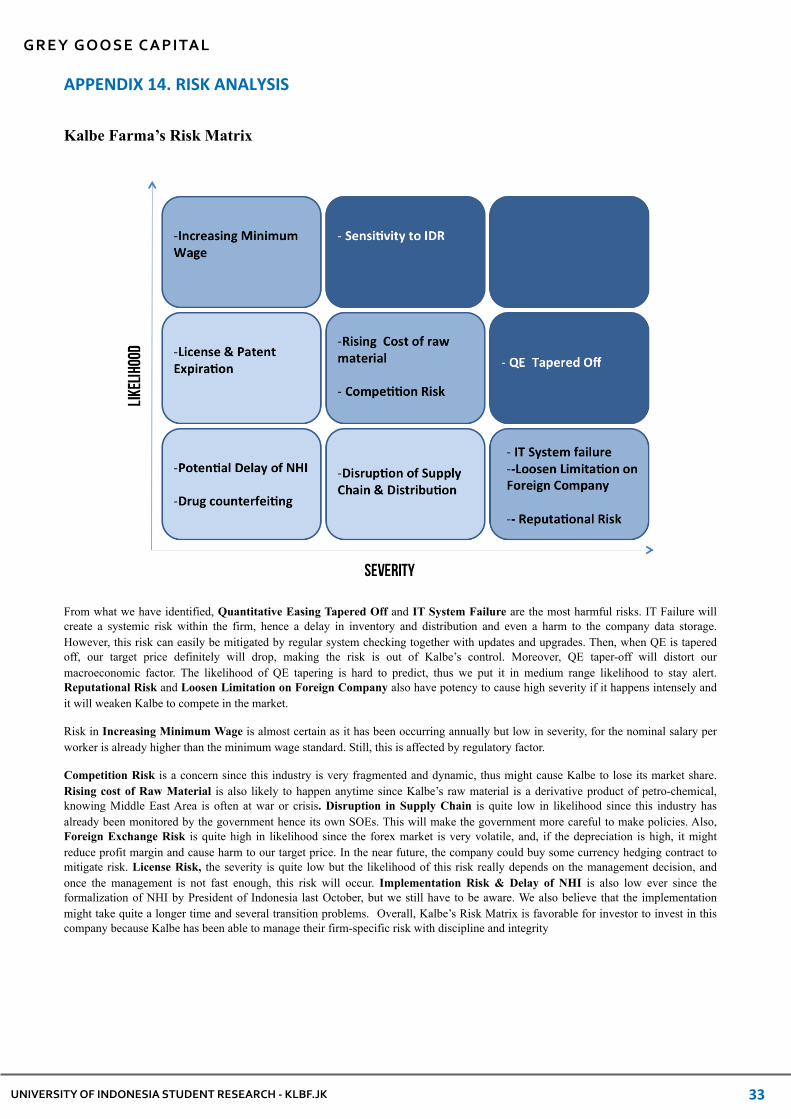
UNIVERSITY OF INDONESIA STUDENT RESEARCH -‐ KLBF.JK
GREY GOOSE CAPITAL
33
APPENDIX 14. RISK ANALYSIS
Kalbe Farma’s Risk Matrix
From what we have identified, Quantitative Easing Tapered Off and IT System Failure are the most harmful risks. IT Failure will create a systemic risk within the firm, hence a delay in inventory and distribution and even a harm to the company data storage. However, this risk can easily be mitigated by regular system checking together with updates and upgrades. Then, when QE is tapered off, our target price definitely will drop, making the risk is out of Kalbe’s control. Moreover, QE taper-off will distort our macroeconomic factor. The likelihood of QE tapering is hard to predict, thus we put it in medium range likelihood to stay alert. Reputational Risk and Loosen Limitation on Foreign Company also have potency to cause high severity if it happens intensely and it will weaken Kalbe to compete in the market.
Risk in Increasing Minimum Wage is almost certain as it has been occurring annually but low in severity, for the nominal salary per worker is already higher than the minimum wage standard. Still, this is affected by regulatory factor.
Competition Risk is a concern since this industry is very fragmented and dynamic, thus might cause Kalbe to lose its market share. Rising cost of Raw Material is also likely to happen anytime since Kalbe’s raw material is a derivative product of petro-chemical, knowing Middle East Area is often at war or crisis. Disruption in Supply Chain is quite low in likelihood since this industry has already been monitored by the government hence its own SOEs. This will make the government more careful to make policies. Also, Foreign Exchange Risk is quite high in likelihood since the forex market is very volatile, and, if the depreciation is high, it might reduce profit margin and cause harm to our target price. In the near future, the company could buy some currency hedging contract to mitigate risk. License Risk, the severity is quite low but the likelihood of this risk really depends on the management decision, and once the management is not fast enough, this risk will occur. Implementation Risk & Delay of NHI is also low ever since the formalization of NHI by President of Indonesia last October, but we still have to be aware. We also believe that the implementation might take quite a longer time and several transition problems. Overall, Kalbe’s Risk Matrix is favorable for investor to invest in this company because Kalbe has been able to manage their firm-specific risk with discipline and integrity

UNIVERSITY OF INDONESIA STUDENT RESEARCH -‐ KLBF.JK
GREY GOOSE CAPITAL
34
Kalbe Farma’s sensitivity analysis
Cost of EquityCost of EquityCost of EquityCost of EquityCost of Equity
10.20% 10.70% 11.20% 11.70% 12.20%
Perpetual Growth Rate
5.00% 1730 1610 1520 1440 1370
Perpetual Growth Rate
5.25% 1780 1660 1560 1470 1400Perpetual
Growth Rate 5.50% 1840 1710 1600 1500 1430Perpetual Growth Rate
5.75% 1910 1760 1640 1540 1460
Perpetual Growth Rate
6.00% 1990 1820 1690 1580 1490

APPENDIX 15. MONTE CARLO ANALYSIS
0"
0.01"
0.02"
0.03"
0.04"
0.05"
0.06"
0.07"
1150" 1474" 1798" 2122" 2446" 2770" 3094" 3418"
Sell" Hold" Buy" Target"Price"
As an addition to our Sensitivity Analysis, we performed a Monte Carlo Simulation in order to check how changes in cost of capital and terminal growth rate (two most sensitive variables) may affect our target price. Our base assumptions use 11.2% and 2% as mean and standard deviation of Cost of Capital, respectively. For Terminal Growth Rate, we use 5.5% mean and 1% standard deviation.
Base Assumptions Cost of Capital Terminal Growth RateMean 11.2% 5.5%St Dev 2% 1%
As the graph shows, our simulation suggests 13% Sell, 18% Hold, and 69% Buy with Mean of 1,723 and Median of 1,591, which is very close to our target price.
UNIVERSITY OF INDONESIA STUDENT RESEARCH -‐ KLBF.JK
GREY GOOSE CAPITAL
35

APPENDIX 16. PORTER’S FIVE FORCES
0"
1"
2"
3"
4"New"Entrants"
Compe44on"
Supplier"Consumer"
Subs4tutes"
An Edge in the Fierce Competition. The growing market size provides room for more players. Therefore, the market share one player can captivate is getting smaller as the number of competitors in each segment is high. Low switching cost for consumer to stop using Kalbe’s product and start using other player’s product is also challenging in our opinion. Nevertheless, being an incumbent in the market for almost 50 years is a major strength to be planted on top of customer’s mind, helping Kalbe to remain being a preference in the market. Competitive Rivalry: 4
Hard Shell to Break. In pharmaceutical industry where products are the company’s most valuable assets, there is a high barrier for entrants to join the competition, considering the high cost for R$D and patents. Even when an entrant has a product to sell, the advertising cost to raise popularity and promotional efforts to make a certain brand stand a chance of being used are relatively high.Threat of Entrants: 2.
Logical Solution for Incurred Problems. In terms of getting recovery and improving daily performance, medicines and health products are still sought after, compared to alternatives such as shaman services and herbal pills the booming multi-level marketing companies are offering.Threat of Substitute Products: 2.
Obedient, Price-Insensitive Customers. Limited knowledge of similar brands a customer possesses and the loyalty towards Kalbe over the years have diminished price sensitivity to its products.Bargaining Power of Consumer: 2.
Not Irreplaceable Suppliers. Engaged in four lucrative segments in which it is posing as a major player, Kalbe does partnerships with many suppliers to fulfill the need for its production level, proved by no significant transaction made to a sole supplier (more than 10% of its sales). Petrochemical companies that are a dime a dozen and Indonesia’s abundance labor strongly benefit Kalbe in signing contracts with only suppliers who are the most beneficial for the company, hence low bargaining power. However, suppliers are not to be taken lightly as raw material is the key of good quality products and employees’ hike endangers the performance in the business.Bargaining Power of Supplier: 2.
The final, average score for the environment is 2.4, proving Kalbe’s sophistication to stay posing as the market leader for a long time.
UNIVERSITY OF INDONESIA STUDENT RESEARCH -‐ KLBF.JK
GREY GOOSE CAPITAL
36