80
RESEARCH REPORT Microsimulation Analysis of Financing Options for Long-Term Services and Supports Melissa M. Favreault Richard W. Johnson November 2015 PROGRAM ON RETIRMENT POLICY

RESEARCH REPORT
Microsimulation Analysis of
Financing Options for
Long-Term Services and Supports
Melissa M. Favreault Richard W. Johnson
November 2015
P R O G R A M O N R E T I R M E N T P O L I C Y

ABOUT THE URBAN INSTITUTE The nonprofit Urban Institute is dedicated to elevating the debate on social and economic policy. For nearly five
decades, Urban scholars have conducted research and offered evidence-based solutions that improve lives and
strengthen communities across a rapidly urbanizing world. Their objective research helps expand opportunities for
all, reduce hardship among the most vulnerable, and strengthen the effectiveness of the public sector.
The Urban Institute is a nonprofit policy research organization. It has been incorporated and is operated as a public
charity. It has received official IRS recognition of its tax-exempt status under sections 501(c)(3) and 509(a)(2) of the
Internal Revenue Code. The Institute’s federal ID number is 52-0880375. Donations will be tax deductible and may
be disclosed to the IRS and the public, unless given anonymously. We are committed to transparent accounting of
the resources we receive. In addition to required tax filings, a copy of the Urban Institute’s audited financial
statement is available to anyone who requests it.
Copyright © November 2015. Urban Institute. Permission is granted for reproduction of this file, with attribution to
the Urban Institute. Cover image by Tim Meko.
Contents
Acknowledgments iv
Acronyms v
Microsimulation Analysis of Financing Options for Long-Term Services and Supports 1
Financing Policy Options 6
Data and Methods 8
Results 21
Conclusions 27
References 29
Tables 35
Appendix Tables 61
Appendix: Data from Private Insurance Industry Experience 69
About the Authors 72

I V A C K N O W L E D G M E N T S
Acknowledgments The SCAN Foundation, AARP, and LeadingAge provided financial support for this report. The funders
do not endorse any of the specific policy options discussed in the report. The authors thank Chris Giese
and Al Schmitz of Milliman, Inc., Anne Tumlinson of Anne Tumlinson Innovations LLC, Gretchen Alkema
and Megan Juring of the SCAN Foundation, Harriet Komisar of AARP, Joshua Wiener of RTI
International, and members of the project’s technical advisory panel for their guidance and valuable
comments. Chris Giese and Al Schmitz of Milliman, Inc. prepared the appendix on private insurance
industry experience.
This report is one component of a larger initiative assessing alternative financing options for long-
term services and supports in collaboration with Milliman, Inc. All reports associated with the initiative
can be found at http://www.thescanfoundation.org/ltc-financing-initiative.
Urban strives for the highest standards of integrity and quality in its research, analyses, and policy
recommendations. Urban scholars believe that independence, rigor, and transparency are essential to
upholding those standards. Funders do not determine research findings or influence scholars’
conclusions. As an organization, the Urban Institute does not take positions on issues. Urban scholars
and experts are independent and empowered to share their evidence-based views and
recommendations shaped by research.
The views expressed are those of the authors and should not be attributed to the Urban Institute,
its trustees, or its funders.
F I N A N C I N G O P T I O N S A C R O N Y M S V
Acronyms AALTCI American Association for Long-Term Care Insurance
ADL Activities of Daily Living
ATRA American Tax Relief Act of 2012
CBO Congressional Budget Office
CFR Code of Federal Regulations
CI Cognitive Impairment
CPI Consumer Price Index
DYNASIM Dynamic Simulation of Income Model
FMAP Federal Medical Assistance Percentage(s)
GDP Gross Domestic Product
HCBS Home and Community Based Services
HIPAA Health Insurance Portability and Accountability Act
HMO Health Maintenance Organization
HRS Health and Retirement Study
IADL Instrumental Activities of Daily Living
LTSS Long-Term Services and Supports
MCBS Medicare Current Beneficiary Study
MDS Long Term Care Minimum Data Set
MSIS Medicaid Statistical Information System
MSP Medicare Savings Program
NHATS National Health and Aging Trends Survey
NLTCS National Long Term Care Survey
OASDI Old-Age Survivors and Disability Insurance
OOP Out of Pocket
PDV Present Discounted Value
QI Qualified Individuals
QMB Qualified Medicaid Beneficiary
SIPP Survey of Income and Program Participation
SLMB Specified Low-Income Beneficiary
SOI Statistics of Income
SPMSQ Short Portable Mental Status Questionnaire
SSI Supplemental Security Income
TICS Telephone Interview for Cognitive Status

F I N A N C I N G O P T I O N S F I N A N C I N G O P T I O N S F O R L O N G - T E R M S E R V I C E S A N D S U P P O R T S 1
Microsimulation Analysis of
Financing Options for Long-Term
Services and Supports Older adults face a significant risk of developing chronic health problems and becoming unable to
perform basic tasks on their own. In 2011, 7.7 million adults ages 65 and older received help with
activities of daily living (ADLs) (Freedman and Spillman 2014), which include such tasks as bathing,
dressing, eating, using the toilet, and getting out of bed. About 6 million adults in the same age group—
nearly one-sixth of the population ages 65 and older—have more severe needs, requiring help with at
least two ADLs for 90 or more days or having severe cognitive impairment.1
Most of this assistance, known as long-term services and supports (LTSS), is provided informally at
home by unpaid family caregivers. According to unpublished Urban Institute analysis of data from the
2004 National Long-Term Care Survey, only 9 percent of adults age 65 or older with severe cognitive
impairment or two or more ADL limitations received any nursing home care over 12 months, excluding
care in a skilled nursing facility, nearly a quarter (23 percent) received help from paid home care
providers About half (53 percent) of aged adults with severe LTSS needs received unpaid care from
family members or friends. Unpaid caregivers often experience physical, emotional, and financial strains
(e.g., Pinquart and Sorensen 2003, 2007; Roth et al. 2009). For example, 22 percent of caregivers say
their care activities made their health worse (National Alliance for Caregiving and AARP Public Policy
Institute 2015). About half of working age adults who provide care to their frail parents work full time
(Johnson and Wiener 2006), and some evidence suggests that caregivers must reduce their work hours
to accommodate their care responsibilities (Butrica and Karamcheva 2014; Johnson and Lo Sasso 2006;
Van Houtven, Coe, and Skira 2013).2
Paid LTSS is most commonly provided at home by paraprofessional caregivers and in nursing homes
or other residential care settings. Although less common than care provided by family members, paid
1 This estimate is based on unpublished tabulations by Brenda Spillman at the Urban Institute of 2011 data from
the National Health and Aging Trends Study.
2 Recent surveys, however, reveal that only a minority of caregivers report significant burdens (National Alliance
for Caregiving and AARP Public Policy Institute 2015; Spillman et al. 2014). In fact, two-thirds of caregivers in the
2011 NHATS report positive aspects of the caregiving experience, including gaining confidence about their own
abilities, learning that they could deal with difficult situations, bringing them closer to the care recipient, and
gaining satisfaction from the quality care provided to the recipient (Spillman et al. 2014).

2 F I N A N C I N G O P T I O N S F O R L O N G - T E R M S E R V I C E S A N D S U P P O R T S
LTSS is costly, especially when measured over a lifetime. In 2015, the median cost of home health aide
services is $20 per hour and the median cost of nursing home care is $80,000 per year (Genworth
2015), although costs vary widely across the country. Urban Institute projections indicate that the
average American turning 65 today will incur about $138,000 in expenses for severe LTSS needs over
the rest of their lives (Favreault and Dey 2015).3 These future costs could be financed by investing
$69,500 at age 65, under the assumption that the investment earns average returns. However, lifetime
costs vary widely. Forty-eight percent of adults turning 65 today will likely never experience severe
LTSS needs and another 10 percent will incur some expenses but less than $25,000 worth, while 21
percent will incur more than $150,000 in lifetime expenses and 15 percent will incur more than
$250,000.
Because high LTSS expenses are rare but some people experience catastrophic costs, this risk
seems insurable, either by government or the private sector, yet the US has not yet developed a
national policy for LTSS financing. Medicare does not provide extended coverage for LTSS needs.4
Standard health insurance and Medigap policies do not cover LTSS, and relatively few people purchase
private long-term care insurance because of high premiums, the potential crowd-out of demand by
Medicaid, and adverse selection—which limits the size of the market and drives up premiums (Brown
and Finkelstein 2007). Sales of private long-term care policies and certificates have declined from
528,000 in 2005 to 395,000 in 2012 (Cohen 2014).
As a result, many families needing long-term care rely first on unpaid family members before
turning to paid services when more intensive care becomes necessary, paying out of pocket until their
financial resources run out and then enrolling in Medicaid. However, because people with LTSS needs
may qualify for Medicaid after they deplete most of their resources, Urban Institute projections indicate
that Medicaid will pay for about one-third of lifetime costs associated with severe LTSS needs for
people turning 65 today, while about half of their costs will be paid out of pocket by families (Favreault
and Dey 2015). (Estimates of the proportions of costs that various payers cover are quite sensitive to
analytic choices, for example hoe one treats the room and board component of residential care
expenses.) The potentially catastrophic consequences of becoming disabled and needing long-term care
is arguably the gravest financial risk that older adults face.
3 These estimates cover only those costs associated with severe LTSS needs and exclude the often substantial sums
spent coping with less severe disabilities.
4 When individuals have both medical (for example, for postacute care) and LTSS needs, Medicare may provide
services in skilled nursing facilities or at home to beneficiaries who otherwise would have received LTSS alone.
F I N A N C I N G O P T I O N S F I N A N C I N G O P T I O N S F O R L O N G - T E R M S E R V I C E S A N D S U P P O R T S 3
People who lack the resources for LTSS can receive poor or inappropriate care (Komisar, Feder, and
Kasper 2005). This care gap can not only harm those who need assistance but also increase costs for
Medicare, which pays for the hospitalizations and other medical treatments that often result from acute
episodes caused by inadequate assistance (Komisar and Feder 2011).
The lack of an adequate policy for LTSS financing also creates risks for public programs. LTSS needs
will grow over time as the population ages. Urban Institute projections indicate that between 2015 and
2055, the number of older Americans with severe LTSS needs will increase 140 percent, reaching 15.1
million (Favreault and Dey 2015). Over the same period, the US population ages 65 and older will
increase 80 percent and the population ages 85 and older will increase 190 percent (US Census Bureau
2014). As the demand for LTSS rises, more older adults are likely to turn to state Medicaid programs—
financed partly by the federal government—to cover part of their costs. Rising Medicaid spending may
strain government budgets at both at the federal and state levels. Because individuals do not qualify for
Medicaid until they have exhausted nearly all of their financial resources, the reliance on the program to
cover long-term care expenses may also reduce individual savings incentives, another reason to develop
more comprehensive long-term care policies.
Policymakers, advocates, and researchers have tried unsuccessfully for decades to create
alternative LTSS financing mechanisms. In 1990, for example, the US Bipartisan Commission on
Comprehensive Health Care—also known as the Pepper Commission after its first chairman, Rep.
Claude Pepper (D-FL)—proposed social insurance for home and community-based care and for the first
three months of nursing home care for all Americans, regardless of income (US Bipartisan Commission
on Comprehensive Health Care 1990). The Clinton administration’s unsuccessful 1993 health reform
plan included a new state-run home care program for people with severe disabilities, with no
restrictions on eligibility based on age or financial resources (Wiener, Estes, Goldenson, and Goldberg
2001).
In the most recent attempt, Congress passed the Community Living Assistance Services and
Supports (CLASS) Act as part of the Affordable Care Act in 2010, creating a national program of
voluntary long-term care insurance. However, the law was never implemented by Obama
administration and was repealed by Congress in 2013. That same year Congress created the
Commission on Long-Term Care, which articulated a framework for considering future financing
proposals (Commission on Long-Term Care 2013). However the 100-day process was challenged by
many factors, including the lack of available statistical modeling to evaluate various policy proposals.
4 F I N A N C I N G O P T I O N S F O R L O N G - T E R M S E R V I C E S A N D S U P P O R T S
To better understand how policy changes could expand the role of insurance in the financing of
LTSS, the Urban Institute and Milliman examined several alternative programmatic options and
estimated their potential impact on families’ out-of-pocket expenses and LTSS spending by other
payers. This report describes Urban’s simulations of three new insurance programs, including a front-
end-only benefit that provides coverage relatively early in the period of disability but caps benefits, a
back-end benefit with no lifetime limit, and a combined comprehensive benefit. Key aspects of these
analyses are described in a recent Health Affairs article (Favreault, Gleckman, and Johnson 2015).
Milliman examined the potential impact of reforming the private long-term care insurance market, and
those results are available in Giese and Schmitz (2015). Additional analyses of the potential impact of
Medicaid reforms and expanded retirement savings options on LTSS financing are described in
Favreault, Haaga, Johnson, and Johnson (2015).
We used dynamic microsimulation techniques to compare likely outcomes under each new
insurance program to expected outcomes under current policies. These programs could be operated by
the government or private carriers. Our simulations projected overall costs and benefits and examined
how they varied by multiple characteristics of the older population, including sex, income, birth cohort,
and years of LTSS needs.
Data limitations restricted our analysis to adults ages 65 or older, although we recognize that as
many as half of the people with LTSS needs are younger than 65 (Kaye, Harrington, and LaPlante 2010).
Additionally, we considered only those expenses associated with severe LTSS needs, defined as having
limitations with two or more ADLs for at least 90 days or severe cognitive impairment. This is the level
of need that triggers benefits from private long-term care insurance under the Health Insurance
Portability and Accountability Act (HIPAA) of 1996.
Our efforts represent the first look at some simplified options and highlight both the capabilities of
our microsimulation model and its potential to inform the policy debate. One advantage of using
dynamic microsimulation to model detailed LTSS needs and program participation is the ability to ask a
wide range of “what if?” questions about policy changes. For example, we can consider how new
insurance programs could shift cost burdens for LTSS. We can ask what would happen if Medicaid asset
test rules were tightened or loosened or if the trend toward greater provision of home-based services
were to continue. We can also model the effects of future changes in other model functions. For
example, we can examine how our projections would change if longevity were to increase more rapidly
F I N A N C I N G O P T I O N S F I N A N C I N G O P T I O N S F O R L O N G - T E R M S E R V I C E S A N D S U P P O R T S 5
than currently anticipated, if ADL disability rates were to increase or decrease relative to our
assumptions, or if effective treatments for dementia were to emerge.5
An important advantage of dynamic microsimulation models is their ability to capture how life
circumstances, including health outcomes, differ by socioeconomic status. These models allow analysts
to look at the full distribution of outcomes, not just averages, for the overall population and for various
subgroups.
There is a great deal of uncertainty surrounding our projections, of course, and they require making
many assumptions, many of which affect the outcomes. Each of the programs we modeled is very
simplified and thus excludes many details, but we specified enough provisions so that the programs can
be compared across key dimensions. Additional model runs will be necessary to refine the plan
specifications before policy recommendations can be made. The contribution of this report is not to
identify a detailed program that most efficiently and equitably finances LTSS. Rather, this report
highlights the value of microsimulation in identifying the strengths and weaknesses of broad program
types and the tradeoffs that policymakers must consider when weighing different approaches to
financing LTSS.
Previous Analyses
Our research builds on several earlier studies that have modeled lifetime LTSS needs and the effects of
alternative financing policies. One important analysis of the distribution of lifetime LTSS needs was
Kemper, Komisar, and Alecxih (2005/2006), which projects LTSS needs and costs after age 65 for adults
reaching that milestone in 2005. Other studies examine LTSS needs at a point in time, including
Congressional Budget Office (2013), Kaye, Harrington, and LaPlante (2010), and O’Shaughnessy
(2014). Another branch of this literature examines specific components of disability, such as expected
duration of cognitive impairment (Lièvre, Alley, and Crimmins 2008; Murtaugh, Spillman, and Wang
2011; Suthers, Kim, and Crimmins 2003). Stallard (2011) examines disability and LTSS experiences of
individuals a few decades ago, using 1984-1994 data from the National Long-Term Care Survey. Other
recent studies include Friedberg, Sun, Webb, Hou, and Li (2014) and Hurd, Michaud, and Rohwedder
(2014).
5
Improving treatment options for Alzheimer’s disease is a priority area for the federal government (US
Department of Health and Human Services 2014).
6 F I N A N C I N G O P T I O N S F O R L O N G - T E R M S E R V I C E S A N D S U P P O R T S
Several policy groups and commissions have highlighted challenges associated with financing LTSS
and proposed various solutions (Bipartisan Policy Center 201;, Commission on Long-Term Care 2013;
Leading Age Pathways 2013; Long-Term Care Financing Collaborative 2015; O’Leary 2014).
An influential study that simulated alternative LTSS financing options is Wiener, Illston, and Hanley
(1994), published more than 20 years ago. The authors developed a baseline projection of LTSS needs
and payers and simulated a range of LTSS financing alternatives, including an expanded package of
Medicaid benefits, the introduction of social insurance, and public subsidies for private insurance.
Within each of these alternatives, the authors examined the impact of key parameters, varying, for
example, the extent to which proposals covered front-end versus back-end costs or focused on
institutional care versus home and community based services (HCBS). Rivlin and Wiener (1988)
examined a similar range of policy options but also considered some alternatives, such as home equity
conversions.6 Tumlinson, Hammelman, Stair, and Wiener (2013) conducted a more recent study using a
somewhat less elaborate model (described in Broyles, Hammelman, Tumlinson, and Weier 2010) and
juxtaposed the effects of mandatory and voluntary LTSS financing approaches, with a focus on premium
prices and potential Medicaid savings.
Financing Policy Options
We analyzed the following three new broad insurance options: a program with a front-end benefit that
begins after a 90-day waiting period and covers a maximum of two years of need, a catastrophic-only or
back-end program that begins after a waiting period of two years but provides a lifetime benefit
thereafter, and a comprehensive program that begins after a 90-day waiting period and provides a
lifetime benefit. Each option was modeled as voluntary insurance and as a universal mandatory program
for workers. For the voluntary options, we included subsidized and unsubsidized versions. Appendix
table 1 summarizes the parameters of each plan.
6
Another study from around this same time period, less detailed in its description of projection methods, is Cohen,
Kumar, McGuire, and Wallack (1992). Crown, Burwell, and Alecxih (1994) also examine a specific subset of LTSS
financing changes, increases in Medicaid asset tests for nursing homes. Kemper, Spillman, and Murtaugh (1991)
similarly focus on nursing home policies.
F I N A N C I N G O P T I O N S F I N A N C I N G O P T I O N S F O R L O N G - T E R M S E R V I C E S A N D S U P P O R T S 7
Benefits
The three new insurance options have a common benefit structure. Each would provide a daily cash
benefit of $100 in 2015 that would increase 3 percent per year. Cash benefits could be used for both
traditional services (such as paying providers in care settings) and nontraditional services (such as
paying family caregivers, purchasing transportation, or modifying a home). Enrollees would qualify for
benefits once they developed severe LTSS needs—that is, requiring help with at least two ADLs for 90
or more days or having severe cognitive impairment. This is the same high level of need that currently
triggers private long-term care insurance benefits. The programs differ, however, by when benefits
begin and how long they last.
Premiums
Enrollee premiums would fund the voluntary programs, and a payroll tax would fund the mandatory
programs. Like the current Medicare payroll tax (but unlike the Social Security tax), the LTSS tax would
not be subject to a wage cap. Only employees—not employers—would be subject to the payroll tax.
The levels of premiums and payroll tax would be set to cover all program costs (including
administrative expenses). However, the subsidies available to low-income enrollees in the voluntary
programs would be financed by general tax revenues collected outside the LTSS program. The
subsidized voluntary insurance programs would fully subsidize people who meet Social Security insured
status requirements and who have incomes below 150 percent of the federal poverty level.7 This
assistance would be gradually phased out and end when income reached 200 percent of poverty. In the
mandatory programs, the uncapped payroll tax would subsidize premiums for people with low incomes.
The mandatory programs would levy administrative costs equal to 2.5 percent of taxes and 3.75
percent of benefits paid. We assumed that the voluntary programs would require 50 percent higher
administrative costs than mandatory programs.8
7
In 2015 this threshold was set at $17,655 for a single individual and $23,895 for a couple.
8 We also assumed that enrollees would additionally pay premium taxes of 2.5 percent but would not pay any sales
commissions.
8 F I N A N C I N G O P T I O N S F O R L O N G - T E R M S E R V I C E S A N D S U P P O R T S
Eligibility
Adults younger than age 70 in 2018 (so born in 1948 or later) would be eligible to enroll in the new
programs, but no enrollees would be eligible for benefits until age 65. Participants would not be subject
to underwriting, unlike people who have private insurance. However, to help limit the number of
enrollees in the voluntary programs who had preexisting disabilities and who would drive up costs,
enrollees in these programs would not qualify for benefits until they had paid premiums for at least five
years. Similarly, participants in the mandatory programs would need to have 40 quarters of
employment covered by Social Security (about10 years of work) to qualify for benefits, but these
quarters could have been earned before the LTSS programs began. (The amount of earnings required
for a quarter of coverage in 2016 is $1,260.) Unlike Medicare or Social Security, the mandatory LTSS
insurance programs we modeled do not cover workers’ spouses. Payments into the programs would
begin in 2016, with benefits commencing in 2018 for the mandatory programs and 2021 for the
voluntary programs (when the vesting requirement is first met). The new insurance programs would be
the primary LTSS payer, with Medicaid the secondary payer.
Data and Methods
We simulated the impact of each policy option using DYNASIM3, the Urban Institute’s dynamic
microsimulation model designed to analyze the long-run distributional consequences of retirement and
aging issues. Starting with a representative sample of individuals and families, the model “ages” the data
year by year, simulating such demographic events as births, deaths, marriages and divorces, and such
economic and health events as labor force participation, earnings, hours of work, disability onset and
recovery, retirement, and use and costs of long-term services and supports. As the model ages the
population, it calibrates many key demographic and economic outcomes to the intermediate
assumptions of the Old-Age Survivors and Disability Insurance (OASDI) and Medicare Trustees’
Reports (Board of Trustees, Federal Old-Age and Survivors Insurance and Disability Insurance Trust
Funds 2014; Boards of Trustees of the Federal Hospital Insurance and Federal Supplementary Medical
Insurance Trust Funds 2014).9 The model projects outcomes through 2087, generating lifetime
projections for some cohorts and projections covering much of the life course for others.10
9
We calibrate fertility, mortality, net immigration, covered employment rates, and the prevalence of Social Security
Disability Insurance benefit receipt by age and sex. Economy-wide wage and price growth, as well as all the Social
Security parameters that are based on them, follow the Trustees’ intermediate series, as does the share of total
F I N A N C I N G O P T I O N S F I N A N C I N G O P T I O N S F O R L O N G - T E R M S E R V I C E S A N D S U P P O R T S 9
DYNASIM3’s starting population is a sample from the pooled 1990-1993 panels of the Survey of
Income and Program Participation (SIPP). To age the population, we estimate transition and other
equations using an array of high-quality longitudinal data sources. DYNASIM’s LTSS projections draw
information from a wide range of cross-sectional and longitudinal sources, including the Health and
Retirement Study (HRS), Medicare Current Beneficiary Study (MCBS), and National Health and Aging
Trends Survey (NHATS). Because DYNASIM’s underlying population is nationally representative, its
weighted projections yield national totals for various population groups and for program costs. As a
result, it can also be used to determine relative costs of various interventions, although the model’s
focus is distributional.
Appendix Tables 2 through 5 provide summary information on the specification of our LTSS models,
with a focus on our health and disability measures (Appendix Table 2), presence and quantity of LTSS
use (Appendix Table 3), LTSS payer attribution (Appendix Table 4), and Medicare and Medicaid
assignments (Appendix Table 5). The appendix tables describe each model’s functional form, predictors,
and estimation data source and sample. Detail on other functions, like earnings, pensions, and wealth,
are available in Favreault, Smith, and Johnson (2015).
As the tables indicate, the HRS underlies the models of health, disability status (including limitations
with ADLs and instrumental activities of daily living (IADLs) and cognitive impairment), LTSS use, and
private long-term care insurance coverage.11
These models are highly interdependent. For example,
earnings that falls below the annual cap on earnings subject to Social Security taxes (known as the taxable share).
This share reflects earnings dispersion, in that earnings are more likely to exceed the taxable cap as the skewness of
the earnings distribution rises. We also calibrate DYNASIM to Medicare projections, particularly by matching the
Medicare Trustees’ assumptions on excess cost growth—the amount by which Medicare spending outpaces GDP
growth. This is important because the Trustees expect Medicare costs to grow significantly under current law.
Because many older adults qualify for Medicaid through the system’s medically needy programs, medical cost
growth affects the likelihood and prevalence of Medicaid eligibility.
10 Nearer-term projections are more reliable than the less certain longer-term projections. Nonetheless, future
DYNASIM releases will extend the simulation horizon to 2090, the end of the 75-year forecasting horizon for many
government programs. Even though such distant projections are highly speculative, they help capture lifetime
experience, which improves our understanding of the nature of LTSS financing risks. 11
Our measure of cognitive impairment is based on scores from the Telephone Interview for Cognitive Status
(TICS) in the HRS (Ofstedal, Fisher and Herzog 2005). This is a fairly standardized battery of questions to assess
memory and cognitive status. The survey asks self-respondents to rate their memory and any changes in their
memory since the previous interview, and then administers a cognitive test. The test asks respondents to repeat a
list of 10 nouns immediately and again five minutes later; subtract 7 from 100 and then subtract 7 from the result
successively another four times; and count backwards from 20. Respondents are also asked to identify the date and
day of the week, the current U.S. president and vice president, and two common objects (“cactus” and “scissors”)
based on the interviewer’s description. We use these responses to create a cognitive index score by awarding one
point for each correct answer (or component of an answer), for a maximum total of 35 points. We classify
1 0 F I N A N C I N G O P T I O N S F O R L O N G - T E R M S E R V I C E S A N D S U P P O R T S
earlier processes predict subsequent processes, and we model some processes jointly, such as use of
nursing home, home care, and residential care. We typically employ complex econometric specifications
in our models to best capture patterns over time. Most equations incorporate many predictor variables,
including age, education, income, marital status and spouse disability, nativity, race and ethnicity,
presence of children, and other attributes.
One challenge is how to capture trends in LTSS outcomes. When there is a clear trend, such as the
decline in mortality, we follow the Social Security Trustees’ assumptions. Otherwise, we typically
assume that the underlying propensity to develop LTSS needs or use LTSS continues at current levels,
but that the aggregate rates observed change as the composition of the population shifts. For example,
as the population becomes better educated, more people in the population will experience the rates for
more highly educated adults, but the rate for an adult with a certain level of education will not change.
Modeling choices become difficult, however, when there is no scientific consensus about long-term
trends, such as with disability.12
In the case of ADL and IADL disability, we resolve the issue by basing
projections on relative age—years of remaining life expectancy—and assuming that disability rates
remain constant across cohorts for adults at the same relative age.13
All else equal, projected disability
rates will fall over time when measured at years since birth—standard age—because longevity is
increasing. However, changes in risk factors could offset these changes.
To model LTSS payments, we estimate various parameters from MCBS data and develop various
algorithms to simulate eligibility for public insurance programs. DYNASIM assigns personal income and
payroll taxes and eligibility for means-tested public programs using appropriate rules and laws; the
model mimics tax forms and the application and eligibility verification processes for various public
respondents as having severe cognitive impairment if they score 7 or fewer points and mild cognitive impairment if
they score between 8 and 13 points.
12 Different measures of disability yield significantly different estimates of disability prevalence (for example,
Freedman and Spillman 2014b). One recent comprehensive study of multiple datasets concludes that trends in old-
age disability may vary by age (Freedman, Spillman, Andreski, et al. 2013).
13 We define relative age based on life expectancy in 2002, the midpoint of our HRS estimation sample. We assume
that healthy life expectancy increases a half year for every full-year increase in total life expectancy. In one recent
cross-country study, Salomon et al. (2012) estimate that the ratio of health life expectancy gain to total life
expectancy gain falls with age. They find that one year of life expectancy gain leads to about 0.85 years of healthy
life expectancy at birth, but only about 0.75 years at age 50, suggesting our estimate of half at age 65 is reasonable
in a comparative framework. Looking at older ages and focusing on the U.S. population, Manton, Gu, and Lowrimore
(2008) estimate a more favorable situation, with gains in healthy life expectancy (relative to total life expectancy)
of 73 to 80 percent at age 75 and 71 to 79 percent at age 85. This suggests that a somewhat more aggressive
assumption may be appropriate, but we maintain the more conservative approach to limit the chance of
underpricing products that cover LTSS expenses.
F I N A N C I N G O P T I O N S F I N A N C I N G O P T I O N S F O R L O N G - T E R M S E R V I C E S A N D S U P P O R T S 1 1
programs.14
For application-based public programs like Supplemental Security Income (SSI) and
Medicaid, some individuals choose not to apply for benefits for which they are eligible (i.e., take-up rates
generally fall well below 100 percent). We draw from the literature to assign SSI and Medicaid take-up
levels using algorithms and equations that account for need, as the literature generally shows that take-
up is higher for those with lower income and assets.15
We calibrate participation parameters so that
DYNASIM Medicaid projection results track Medicaid Statistical Information System (MSIS) data over
the period for which historical information is available (currently 2011). Likewise, when we model
private long-term care insurance payments for LTSS, we use a rule-based approach and account for
features of the simulated plans—including elimination periods, lifetime and daily benefit maxima,
inflation protection—and premiums that are consistent with the plan features and issue age.
We set current and past LTSS prices equal to average or median prices reported in the literature by
state of residence, setting (home care, residential care, nursing home), and whether Medicaid is the
payer (Genworth 2014, 2015; Eljay 2014; Fossett and Burke 2010; Grabowski, Feng, Intrator, and Mor
2004; Mollica 2009; Ng et al. 2014). Prices vary markedly across states. Within states, Medicaid prices
tend to be substantially lower than overall prices, and much lower than Medicare prices for similar
services.16
For those receiving Medicare-covered services that overlap with LTSS, DYNASIM assigns
higher prices. For those paying out of pocket, DYNASIM varies LTSS prices somewhat based on income,
14
The tax calculator uses annual projected tax unit income and assets from the SIPP panels matched to a Statistics
of Income (SOI) data file that includes itemized deductions and other variables needed to calculate personal income
taxes. The tax calculator uses current law federal income tax rules, including provisions of the American Tax Relief
Act of 2012 (ATRA). Tax provisions affecting the treatment of Social Security benefits have not changed since
1993, but the share of Social Security benefits included in taxable income is continually increasing under current
law partly because the threshold levels for including benefits in taxable income are not indexed for inflation. The
tax calculator requires information about future tax law. With the exception of the Social Security thresholds,
which are assumed to remain constant over time, DYNASIM inflates thresholds in the tax calculations—such as
those used to set progressive tax rates—by projected changes in the Consumer Price Index (CPI) through 2024 and
by wage growth thereafter.
15For example, Ettner (1997), Gardner and Gilleskie (2012), Haber, Adamache, Walsh, Hoover, and Bir (2003),
Pezzin and Kasper (2002), Rupp and Sears (2000), Sears (2001/2002), and U.S. Government Accountability Office
(2012) examine take-up of Medicaid and Medicare Savings Programs (MSP). It is often difficult to measure Medicaid eligibility in survey data because datasets that effectively measure disability and service use do not
always measure income and assets well. DYNASIM’s take-up parameters tend to fall on the high side of those
reported in the literature. They are consistent with those studies that rely on survey data matched to
administrative records (e.g., Sears 2001/2002), which are likely to be more reliable than studies based on survey
data alone.
16To give a few concrete examples of populous states, Eljay (2014) reports 2013 Medicaid nursing home rates of
$179 and $221 for New York and California, respectively. For that same year, Genworth reports median prices of
$230 and $332 for semi-private rooms in these states, and for the preceding year Metlife (2013) reports mean
prices of $249 and $356.
1 2 F I N A N C I N G O P T I O N S F O R L O N G - T E R M S E R V I C E S A N D S U P P O R T S
so that some lower-income families use lower-cost providers—especially for home care. DYNASIM also
assumes that some higher-income families—especially those covered by private long-term care
insurance—use higher-cost providers.17
We do not currently apply higher prices for dementia care than
standard care.18
After the last year of historical price data, prices for nursing homes and residential care
grow at the same rate as the average national wage, based on the OASDI Trustees’ intermediate
assumptions, because the provision of LTSS tends to be labor intensive. For home care, prices grow
somewhat more slowly, at the average of wage and price growth, again based on the OASDI Trustees’
intermediate assumptions, reflecting recent trends in lower-wage workers’ compensation and other
aspects of the LTSS workforce in private homes.19
Although this appendix focuses on how we simulate
the status quo, it bears noting that the price differential between Medicaid and other payers poses
challenges when simulating changes to current LTSS financing arrangements.20
Because each data source that we use to develop DYNASIM’s LTSS capacities has different
strengths and weaknesses, we compare our projection results with a range of other data sources. For
example, although we use HRS to project residential care, we calibrate these projections to data from
NHATS (Freedman and Spillman 2014a) and NCHS (for example, Caffrey, Harris-Kojetin, Rome,
Sengupta 2014). Similarly, the HRS self-reports of time in nursing homes do not distinguish between
17
We assign these differential rates probabilistically based on income relative to the federal poverty level. We
prefer this measure because it accounts for the lower living expenses associated with shared living arrangements.
Specifically, we assume that a fraction of those with income less than five times the poverty level who are not
covered by Medicaid pay between two-thirds and 95 percent of the median rate in the state in which they live.
(Rates vary by hours of service used and income range). For those with higher income and who are covered by
private long term care insurance, a select percent pay rates of up to 10 percent higher than the median for their
state. Most people not covered by Medicaid do pay the state-specific market rate. No one pays less than two-thirds
or more than 110 percent of the market rate as reported by Genworth.
18 The 2013 MetLife study reported that about 80 percent of nursing homes providing care for dementia or
Alzheimer’s disease charge the same rate for patients with dementia as for other patients. The average rate for the
remaining 20 percent of nursing homes (that charge higher rates for dementia patients) slightly exceeded the
national average. Karon, Wiener, Greene, Khatutsky, and Johnson (2014) consider how residential care prices vary.
They find that facilities with specialized services for people with dementia (and that will not discharge patients due
to cognitive impairment) charge higher rates (on average roughly $1,000 per month more in 2010). Also, patients
needing care with a higher number of ADL limitations tend to pay higher rates. Future iterations of DYNASIM will
incorporate these findings.
19 Martin, Lowell, Gozdiziak, Bump, and Breeding (2009), for example, find that the work force providing home care
is disproportionately foreign born and that many foreign-born direct care workers are unauthorized. Government
statistics also reveal that this work force is disproportionately female, African-American, Hispanic, and less
educated relative to the overall work force.
20 For example, fewer workers may enter care occupations if wages fall because many patients face lower prices
under new policy options, and providers may be less willing to offer services. As one recent press account describes
(Thomas 2015), policies on acute care, post-acute care, and custodial care are likely to interact in important ways.
F I N A N C I N G O P T I O N S F I N A N C I N G O P T I O N S F O R L O N G - T E R M S E R V I C E S A N D S U P P O R T S 1 3
long-term stays for custodial care and short-term stays for strictly post-acute care, so we use NLTCS
data matched to administrative records and the MCBS to understand how nursing home care is
distributed across these two service types.21
To improve our projections of private long-term care
insurance, we have worked with data from several partners as well as published studies by the Society
of Actuaries (2011) and private industry groups. We look carefully at the literature, including those
studies that have produced similar long-range projections and studies that focus on historical patterns.
One challenge for dynamic microsimulation is producing aggregate totals and distributional
estimates that both line up with historical data. This is especially difficult when outcomes are highly
skewed, as with earnings and wealth, where the top fraction of one percent of the distribution holds an
extraordinary share of the total. For modeling LTSS, a large part of the challenge is obtaining aggregate
data that provide such detail on the distribution and allow disaggregation of the complex constellation
of services that constitutes LTSS (see, for example, Technical Appendix in Bipartisan Policy Center
2014). We address the challenge by combining data from as many sources as possible and relying on a
panel of expert advisors to help assign future parameters that require discretion.
Outcome measures
Because DYNASIM ages its population year by year, focusing on calendar years, projections can be
displayed in various ways. For example, we can examine key outcomes year by year, comparing the
prevalence of LTSS needs or average costs in 2015, 2025, and 2035, say. Or, we can compare them
longitudinally, examining cumulative LTSS experience from age 65 to death).22
When calculating either
type of measure, we generally prorate needs, expenditures, and cost shares in the year of death. 23
21
We generally assume, for example, that post-acute services in a skilled nursing facility that occur within weeks of
admission to (or discharge from) a nursing home are LTSS, but that short-term post-acute spells when an individual
does not meet HIPAA disability standards are not. To compute these levels, we examined several alternative
definitions of Medicare-covered services that might reasonably be considered LTSS.
22 We use the terms “longitudinal” and “lifetime” interchangeably for ease of presentation, but recognize that many
of our longitudinal measures are better classified as old-age measures because we only consider service use at ages
65 and older.
23 More broadly, an individual’s health and disability status, and thus program eligibility, may vary over the course
of a year. Our disability concepts (ADL and IADL limitations and cognitive impairment) are best interpreted as
averages over a year. However, we forecast nursing home use and residential care in days and formal home care
use in hours. We adjust service use projections and prorate “years disabled” when an individual dies during the
course of a year.
1 4 F I N A N C I N G O P T I O N S F O R L O N G - T E R M S E R V I C E S A N D S U P P O R T S
Many of our longitudinal analyses closely mirror those from the earlier study by Kemper, Komisar,
and Alecxih (2005/2006), which projected LTSS needs for individuals turning 65 in 2005 (or born in
1940) using another empirically based microsimulation model.
When describing patterns of LTSS need and formal/paid LTSS use, we focus on usage at the level
specified in HIPAA: a need for assistance with at least two ADLs24
that is expected to last at least 90
days or need for substantial supervision for health and safety threats due to severe cognitive
impairment. This measure is highly sensitive to how we classify time needing services. For example,
LTSS needs of 100 days in each of three successive years can be classified as either three years of needs
or less than one year of need, because 300 service days is less than the 365 days that span a year.
Because of its relevance to cost projections, we focus on estimating the number of service days, but we
recognize that understanding the amount of calendar time over which needs endure is also useful,
policy-relevant information that can help individuals plan for their future LTSS needs.
For individuals who use nursing homes, we presume a HIPAA level of need with at least one ADL
limitation (rather than two in the community). Many assisted living spells and home care spells occur
prior to reaching the HIPAA level.25
However, we generally report only help and costs that reflect
HIPAA levels because of their special policy relevance and because most paid services are provided to
older adults with that level of need.26
One of our key outcome measures is the present discounted value (PDV) of lifetime LTSS costs
after age 65. Our PDV measure totals these counts, discounting them by the OASDI Trustees’ ultimate
real interest rate of 2.9 percent for every year that they are incurred past age 65. Because the Trustees
assume long-range price growth averages 2.7 percent, this amounts to a nominal discount rate of about
5.6 percent in the long run. We present all lifetime cost projections in constant 2015 dollars. The PDV
can be interpreted as the lump sum that one must set aside at age 65 to finance the expected stream of
LTSS payments until death. Our assumed interest rate implies that $1,000 of LTSS costs incurred at age
85 are worth $565 in PDV terms (in constant 2015 dollars). We examine both this value’s mean and its
distribution, including how costs are distributed across payers and population subgroups. We typically
round dollar amounts to the nearest $10 or $100 depending on the statistic, reflecting the inherent
imprecision of our projections.
24
The ADLs enumerated in the statute are eating, toileting, transferring, bathing, dressing, and continence.
25 See, for example, our earlier discussion of Stallard (2011). Murtaugh and Spillman (2012) estimate average
disability durations of 2.4 years pre-HIPAA eligibility and 1.7 years at the HIPAA level.
26 Cohen, Gordon, and Miller (2011) describe how private insurance companies implement benefit triggers.
F I N A N C I N G O P T I O N S F I N A N C I N G O P T I O N S F O R L O N G - T E R M S E R V I C E S A N D S U P P O R T S 1 5
We make a number of assumptions to allocate LTSS costs to payers. We focus on point-of-service
LTSS costs in these assignments. This approach likely leads us to understate family out-of-pocket costs
for LTSS; after all, everyone who has ever paid personal income tax to federal or state governments has
in essence contributed to Medicaid LTSS, but we ignore these contributions to be consistent with the
prior literature.27
When describing Medicaid outlays in the paper and in this document, we refer
specifically to Medicaid LTSS outlays, not a broader conception of Medicaid spending.
Cost shares for Medicaid, which we compute by following program eligibility rules, are considered
out-of-pocket expenses (for a discussion of Medicaid cost shares, see for example chapter 2 in O’Keeffe
et al. 2010). When individuals receive reduced SSI benefits because they are residing in an institution
that Medicaid pays for, we assume that the reduction in SSI is not an out-of-pocket expense per se,
consistent with the law that the their full benefit is not payable (see for example Program Operations
Manual System, Section 00520.011, Social Security Act, Section 1611(e)(1)(B); 20 Code of Federal
Regulations [CFR] 416.212, 416.414).28
We produce detailed projections of Medicare cost shares
including premiums and out-of-pocket payments for both LTSS and non-LTSS service using MCBS data,
but include here only explicit LTSS cost shares (for example, days 21 through 100 in a Skilled Nursing
Facility, which currently require a daily copayment of $157.50), not premiums or the payroll taxes
individuals paid earlier in life to finance this coverage. In allocating costs to Medicare, we compute
program eligibility and then assign LTSS spells based on their duration (i.e., shorter spells are more likely
to be classified as Medicare spells than longer ones).29
Similarly, we do not include private LTCI
premiums, either for those who eventually go on claim or those who do not, to the family contributions
at ages 65 and older again to stay consistent with a focus on out-of-pocket at the point of service, rather
than total costs. We follow private plan rules carefully to be sure that elimination periods have been
fulfilled, that program maxima are not exceeded, and so forth when paying benefits to those who claim
them.30
For other public expenditures, we use a simple regression for those—mostly men—receiving
27
We have produced DYNASIM calculations elsewhere that reflect such contributions. For example, we have
examined the relationship between Social Security taxes (both payroll taxes and personal income taxes paid on
benefits) and Social Security benefits. Similarly, we have compared Medicare benefits to Medicare payroll taxes,
premiums, contributions to the Medicare Trust Fund from taxation of Social Security benefits, and surtaxes on
higher-income beneficiaries.
28 If we assume that SSI payments are an out-of-pocket cost, then total expenditures by payer would exceed the
overall totals, because SSI payments would be included in both the out-of-pocket totals and the Medicaid totals.
(SSI does not transfer funds to state or federal Medicaid programs).
29 Friedberg, Sun, Webb, Hou, and Li (2014) provide a useful discussion of Medicare’s role in LTSS. See also
Jacobson, Neuman, and Damico (2010) and Tumlinson (2015).
30 We make the conservative assumption that those with coverage whose disabilities reach qualifying levels collect
benefits as soon as possible. This assumption is somewhat inconsistent with some experience studies that report a
1 6 F I N A N C I N G O P T I O N S F O R L O N G - T E R M S E R V I C E S A N D S U P P O R T S
institutional care from the Veterans Administration, based on MCBS data. We assign participation in
programs, most notably personal care services, authorized under the Older Americans Act (OAA) based
on intensity of home care (U.S. Department of Health and Human Services, Administration on Aging,
Administration for Community Living).
Population and classification variables
In many of these tables, we focus on individuals turning age 65 in certain years, for example
between 2015 and 2019, or born in certain years, like 1976 to 1980 for our fully phased in analyses.31
We focus on the population age 65 and older due in part to limitations in the HRS data.32
In future work,
we hope to extend the LTSS components of the model to include the population younger than 65,
perhaps in stages (ages 51 to 64 and then those less than age 51).
We cross-tabulate outcomes by various characteristics including gender, health and marital status
at age 65, non-housing wealth quintile at age 65, and household-size-adjusted income quintile at age
65.33
DYNASIM’s income projections include earnings, pensions, Social Security, SSI, and asset income
(defined as the annuitized value of financial assets using a multivariate annuity function) for both
oneself and, if married, one’s spouse.
Simulation assumptions
Participation in voluntary programs: Our assumptions about the mix of participants in any voluntary
program that we model, especially how they vary between those with high and low likelihoods of using
small share of eligible prospective claimants delay collecting benefits after notifying their insurance company that
they are disabled (Miller, Shi, and Cohen 2008).
31 For these longitudinal analyses, we need to observe cohorts through the age at which an overwhelming share of
them have died. We thus typically limit our longitudinal analyses to individuals born through 1980.
32Although the survey includes people ages 51 and older, LTSS prevalence is much lower prior to age 65 and usage
patterns differ, making it challenging to model LTSS use by younger people reliably. Also, HRS does not measure
cognitive status comprehensively until age 65.
33 We divide income by the federal poverty level to adjust for family size; this adjustment recognizes that two or
more people can live together more cheaply than they could if each maintained a separate household. We have
produced alternative metrics, such as per capita income (which does not adjust for family size). Similarly, metrics
that include imputed rental income are also available. We use quintiles based on the population ages 65 and older.
We can use cohort-specific percentiles (to capture one’s position relative to one’s peers more directly).
F I N A N C I N G O P T I O N S F I N A N C I N G O P T I O N S F O R L O N G - T E R M S E R V I C E S A N D S U P P O R T S 1 7
services, influence the pricing and distributional effects of a simulation. Prices will need to be higher if
those with high likelihood of using services enroll disproportionately. Conversely, if healthier
individuals with lower likelihood of using services enroll at high rates, then prices can be lower.
However, because these LTSS financing options do not yet exist, there are no reliable data on how
many people would likely participate in them. Consequently, we based our participation rates on
judgment based on theory and experience surrounding adverse selection and affordability of premiums.
In setting participation rates, we focused on how the mix of enrollees would change with program
features, particularly those features that would affect adverse selection. We generally assume that
those with high probabilities of using services will enroll in voluntary programs at much higher rates
than others. We use five factors to assign probabilities of enrolling: wealth percentile, income
percentile, self-reported health status, number of ADL limitations, and cognitive status (no impairment,
mild impairment, severe impairment).
Because premiums would account for a high share of income for many enrollees, we assumed that
no one would enroll in the voluntary front-end or back-end programs unless his or her household
income was in the top 40 percent nationally, and that no one would enroll in the comprehensive
program unless his or her household income was in the top 20 percent. We assumed that those wealthy
adults who had higher probabilities of using services and surviving the benefit waiting periods would be
more likely to purchase coverage.
After accounting for adverse selection, we make small adjustments to participation probabilities in
voluntary programs to account for observed differences in participation in private insurance under
current market conditions. For example, people without children are more likely to participate than
people with children, and women are more likely to participate than men. We assume that individuals
with a taste for private insurance, as evidenced by their choice to purchase private insurance under
baseline conditions, are marginally more likely to enroll in the new programs. This results in some
individuals who otherwise would have been covered switching to the new programs.
For illustrative purposes, we assumed comparable participation in the voluntary front-end and
back-end programs. We acknowledge, however, that financially sophisticated consumers might be more
likely to purchase back-end coverage at the prices in our model, given their greater ability to self-insure
against front-end risk. A sophisticated approach to modeling demand would significantly improve our
understanding of the likely impact of new insurance programs. However, the exercise here was focused
on developing the illustrative effects of each financing option under plausible scenarios to get a sense of
the trade-offs involved in, and the relative benefits of, each alternative.
1 8 F I N A N C I N G O P T I O N S F O R L O N G - T E R M S E R V I C E S A N D S U P P O R T S
Participation in mandatory programs: In our simulation analyses of mandatory programs that are
financed with a payroll tax, we assume that the tax is levied on employees, not employers. As a
consequence, we assume no wage offset.34
We implicitly assume that workers react to the payroll tax
solely by consuming less each year. We further assume no changes in employment and hours worked.
Future analyses should test sensitivity to these assumptions.35
They are more likely to be problematic
the larger the size of the payroll tax.
Pricing: Program premiums and tax rates were set iteratively to cover program benefits and
administrative costs, given assumed participation rates and the health mix of enrollees. For the
voluntary front- and back-end programs with and without subsidies, we use premium prices developed
by Giese and Schmitz (2015) for starting values.36
We then modestly adjust these premium estimates to
increase consistency with the DYNASIM projections, which necessarily differ because of different
assumptions about the distribution of the risk of developing LTSS needs LTSS, transaction costs, reserve
requirements, and other factors. For developing premiums for the comprehensive programs and payroll
tax rates for the mandatory programs, we use DYNASIM alone. We ensured that the revenues collected
by the mandatory programs, including interest earned on each program’s trust fund balance, would be
sufficient to cover expected payouts over the 75-year projection period. However, the mandatory plans
are not necessarily solvent indefinitely, and could run out of money after the 75-year projection period.
Components of distributional effects: Two of the primary outcomes that we examine are the effects of
the proposals on Medicaid LTSS enrollment and expenditures. When considering Medicaid interactions,
we account for the fact that some individuals are required to contribute significant shares of their
income toward their care. So when we show effects on Medicaid, we show net effects. That is, we
34
If the payroll tax were levied on employers, it is conventional to assume that employers would compensate in
some way so that the tax would not raise payroll costs much. One way to achieve this would be, for example, to
reduce the annual salary increases that they would otherwise have provided to their employees. We make no such
assumptions in the current estimates, but sensitivity analyses surrounding this assumption could be helpful for
future simulations.
35Sensitivity analyses allowing employment effects to vary with earnings could be informative. Higher-wage
workers, who would pay larger income amounts under an uncapped payroll tax, might be particularly likely to
respond, shifting their compensation into fringe benefits that would not be subject to the payroll tax. (High-wage
workers are generally thought to have more ability to shift their income into different types of compensation.)
36 These estimates were based on assumed participation levels and health and LTSS need status output from
DYNASIM and on the 2014 Milliman Long-Term Care Guidelines. The database supporting the 2014 Milliman Long-
Term Care Guidelines reflects the private insurance market’s experience of more than twenty-nine million life-years
of exposure, including more than $25 billion in incurred claims for approximately 475,000 claimants. Milliman’s
premium estimates incorporated assumed participation levels that varied by health and LTSS need status and
reflected the resulting morbidity levels based on those participation levels.
F I N A N C I N G O P T I O N S F I N A N C I N G O P T I O N S F O R L O N G - T E R M S E R V I C E S A N D S U P P O R T S 1 9
account for the reduction in Medicaid outlays while also accounting for changes in cost shares (i.e.,
people no longer receiving Medicaid no longer need to contribute to their Medicaid costs).
At this stage, our representation of the distributional effects of these policies is incomplete.
Although we account for many potential spillovers and interactions, we do not account, for example, for
change in income tax liability due to changes to the income tax deductions of individuals with high
medical expenses who itemize these deductions. We hope to account for this interaction in future work.
Historical data can help give some perspective on the potential size of the effect resulting from this
omission.37
Importance of simulated program features: Because we are simulating a cash benefit, rather than
service reimbursement, we assume nearly universal take-up of the benefit at the maximum daily benefit
amount. In the mandatory program, we assume that 90 percent of all people who are simulated to be
eligible claim the benefit. For the voluntary (given added salience of the premium payment), we assume
that 100 percent claim the benefit.
Simulation timing and censoring of projections
When interpreting longitudinal results, it is important to keep in mind that people in different
generations (or “birth cohorts”) will experience different shares of their life—including different shares
of their prime working years—under the simulated programs as they phase in. For some, experiences
with the programs may continue after our last projection year (2085 for our LTSS analyses), so we have
not completely projected their lifetime experience with the program. (In technical terms, their
experiences are “censored”). We focus in several analyses on the 1976 to 1980 birth cohorts because
people in this cohort have most of their relevant lifetimes reflected in the projections. The youngest
members of the cohort would have reached age 105 by our last projection year and the oldest would
have reached age 109, so we capture nearly all of their LTSS spending.38
These people would be ages 36
37
One recent Congressional Research Service report estimated that in 2011, just under one third (32 percent) of
filers itemized their deductions on their tax returns, with the share itemizing increasing steadily by income (Lowry
2014). Among itemizers, between 1 and 12 percent deduct medical expenses, again depending on income, with
those in the $50,000-100,000 having the highest shares with such deductions. For those taking medical expense
deductions, average deductions range from $7,200 (for those in the $20,000 to $50,000) to over $100,000 (for
those with over $1 million). LTSS users may be disproportionately represented among those itemizing large
amounts of medical expenses.
38 According to cohort life tables from the Social Security Administration, less than 0.5 percent of men’s and less
than one percent of women’s lives lived in these cohorts would have been completed through age 107, the rough
midpoint of the interval.
2 0 F I N A N C I N G O P T I O N S F O R L O N G - T E R M S E R V I C E S A N D S U P P O R T S
to 40 when premiums payments started. They are thus part way into their careers when payroll taxes
for mandatory programs would begin and below the starting simulation age for paying the premiums for
the voluntary programs. Given their age at program commencement, their estimated lifetime payroll
tax payments under the mandatory program would be lower than those of their counterparts who are
younger and will begin paying payroll tax closer to the point when they enter the labor force. To
consider the payroll tax effects of the fully phased-in program, it is thus helpful to look at cohorts who
are 15 or even 20 years younger.
Caveats and comparability notes
We have combined data from a wide array of data sources to project our best guess of LTSS needs
and use in coming decades under both current law and a series of policy options. This representation is
nonetheless quite stylized. Data on financing LTSS are quite limited in many respects, especially for
analysts wishing to examine outcomes longitudinally. Standard measurement challenges for survey
research are amplified in a dynamic microsimulation context, in which multiple data sources are being
combined through the starting samples, aging parameters, and alignment.
Readers should be cognizant of the challenges inherent in measuring concepts like LTSS need.
Modest differences in question wording or measurement of function can lead to markedly different
estimates of disability prevalence. As a consequence, we strongly advise against focusing solely on any
single cross-sectional or lifetime estimate of LTSS needs. Nuance is essential for understanding
disability patterns given the measurement challenges. Similarly, it is important to bear in mind that the
line between services that are post-acute and LTSS may be ambiguous. Even our rule-based
assignments for public programs like Medicaid need to include eligibility algorithms, and we must
develop these based on findings from an inconclusive literature.
When comparing DYNASIM projections to other data sources, it is important to distinguish
measures that reflect service at any time during the year from measures that look at a single point in
time (e.g., a survey date). For example, calculations from the NLTCS 2004 survey data linked to the Long
Term Care Minimum Data Set (MDS) suggest that roughly twice as many people will spend time in a
nursing home over the course of a year than are observed in a nursing home at a single point in time, an
estimate that increases to 2.8 times as many if stays in skilled nursing facilities are included.39
Likewise,
given the important role institutional settings play in providing LTSS, any estimates that reflect the
39
Similarly, Hurd, Michaud, and Rohwedder (2014) report that about three times as many people receive nursing home care over a two-year period than at a point in time.
F I N A N C I N G O P T I O N S F I N A N C I N G O P T I O N S F O R L O N G - T E R M S E R V I C E S A N D S U P P O R T S 2 1
disability characteristics of the noninstitutional population will differ substantially from our projections,
which attempt to replicate the total population.
A final caveat is that projecting lifetime outcomes for several decades is inherently challenging and
uncertain. Our model contains many underlying assumptions about processes for which leading experts
are sharply divided, including disability, mortality, relative attractiveness and availability of LTSS
service types, the future of the private long-term care insurance market, and growth in costs for health
services more broadly. We draw heavily from the assumptions of lead government forecasting groups
and rely on expert reviewers and advisors, but will continue to review assumptions as new data and
research become available. As better information becomes available, we will update these projections
to improve their reliability and validity.
These results represent a preliminary attempt to advise policymakers and the public about the risk
of needing LTSS. As discussions of financing policies for LTSS evolve, it will be important to check the
robustness of these and other estimates and to update regularly as new data become available.
Administrative data that were not available for this study could prove particularly helpful given
limitations in the public-use data on which our model overwhelmingly relies.
Results
Prices
The premiums and payroll tax rate required to finance the new insurance programs would vary widely.
Premiums for voluntary programs would depend on the age at which participants enrolled, with
younger enrollees paying less than participants who enroll at older ages because younger enrollees
would, on average, pay premiums longer. For those who enrolled at age 45, annual 2016 premiums for
the unsubsidized voluntary programs would range from $1,210 for the front-end program to $1,900 for
the back-end program to $2,400 for the comprehensive program (table 1). Annual premiums would be
about three times as high for participants who wait until age 65 to enroll. Premiums are lower in the
subsidized plans for those who enroll at age 65 or later because the subsidies reduce adverse selection
in the enrollee pool. For the mandatory programs, we estimate that the payroll tax rate would range
from about 0.60 percent of earnings for the plan offering the front-end benefit to about 0.75 percent
for the plan offering the back end benefit and 1.35 percent for the plan offering comprehensive
benefits.
2 2 F I N A N C I N G O P T I O N S F O R L O N G - T E R M S E R V I C E S A N D S U P P O R T S
Half of workers contributing to the voluntary plans would pay no more than 3 or 4 percent of their
earnings to the plan each year. Table 2 reports the median ratio of annual enrollee contributions to
annual earnings, for enrollees with at least one Social Security-covered quarter of earnings who
contribute to a plan. (Fully subsidized participants are not included in the table.) The estimates are
restricted to workers ages 65 and younger, because many older workers are employed part-time and
thus have unusually low earnings. In the unsubsidized plans, the median share of enrollees’ earnings
going to premiums is 2.7 percent for the front-end plan, 3.6 percent for the back-end plan, and 4.3
percent for the comprehensive plan. Low earners pay a higher percentage, and high earners pay a lower
percentage. Women devote a larger share of earnings to premiums than men, because they generally
earn less.40
In the mandatory plans, all workers contribute a flat percentage of their pay, regardless of
earnings.
Table 3 shows the average and median present discounted value of lifetime contributions by
enrollees, for different five-year birth cohorts. The present values are evaluated at age 65. As the
programs phase in, early cohorts contribute much less to the mandatory programs than later cohorts,
because members of early cohorts could not contribute to the plans at relatively young ages, before the
plans existed. Early birth cohorts do not receive favorable treatment in the voluntary programs,
because these programs vary annual premiums by enrollment age so that expected contributions
approximate expected payouts. Lifetime contributions are lower in the mandatory plans than the
voluntary plans because we assumed lower administrative costs in the mandatory plans and adverse
selection raises premiums in the voluntary programs. In addition, lifetime contributions are lower in the
subsidized plans than the unsubsidized plans because subsidies reduce or eliminate contributions for
some enrollees, and the relatively high participation rates in the subsidized plans limit adverse selection
and thus lower premiums.
Although lifetime contributions to the new insurance programs are substantial, they consume only
a small share of lifetime earnings (table 4). Among program enrollees born between 1976 and 1980 with
at least 40 Social Security-covered quarters of earnings who contribute to a plan, half contribute no
more than 0.4 percent of lifetime earnings in the front-end mandatory program, no more than 1.3
percent in the back-end unsubsidized voluntary program, and no more than 1.6 percent in the
comprehensive subsidized voluntary program.
40
If we were to compare premiums to family or household earnings rather than individual earnings, men’s and women’s costs would appear more similar.
F I N A N C I N G O P T I O N S F I N A N C I N G O P T I O N S F O R L O N G - T E R M S E R V I C E S A N D S U P P O R T S 2 3
Coverage
Coverage rates vary widely across the new insurance programs. We estimate that 8.6 percent of 65-
year-olds born between 1976 and 1980 would have private long-term care insurance coverage under
current policies—the baseline (table 5). Only a slightly higher percentage would have coverage through
private insurance or a new insurance program if one of the unsubsidized voluntary options were
available. We assume that overall coverage rates would be about 2 percentage points lower under the
unsubsidized voluntary comprehensive plan than the unsubsidized voluntary front-end and back-end
benefit programs, because premiums would be substantially higher under the comprehensive program.
Overall coverage rates would be about twice as high if one of the subsidized voluntary options were
offered instead of the unsubsidized options. For example, we assume that about 20 percent of 65-year-
olds born between 1976 and 1980 would be enrolled in the subsidized voluntary front-end benefit
program. By contrast, about 96 percent of cohort members would be enrolled in the mandatory
programs.
Coverage rates also vary widely by family income. Baseline coverage rates for private long-term
care insurance increase sharply with income, rising from 6 percent for those in the third income decile
to 9 percent for those in the seventh decile and 20 percent for those in the top decile. Coverage
patterns by income are similar under the new unsubsidized voluntary insurance options. Subsidized
voluntary options would, however, significantly boost coverage rates for low-income adults. For
example, about four-fifths of those in the bottom income decile and two-fifths of those in the second
decile would be covered, because their premiums would be fully or partly subsidized. The mandatory
programs would exclude 11 percent of adults in the bottom decile of family income and 3 to 4 percent of
adults with slightly more income because they would not have worked the required 10 years to quality
or they may not meet the legal status requirements.
Our projections also show that adults in excellent health would enroll in the unsubsidized voluntary
programs at about twice the rate as adults in fair or poor health (table 6). By contrast, adults in fair or
poor health would be more likely to enroll in the subsidized voluntary programs than those in excellent
health. The mandatory programs’ work requirement means that adults in excellent health would be
more likely to enroll in those programs than those with health problems, but the differences would be
relatively small.
Overall, mandatory programs would cover about five times as many older adults in 2050 as the
voluntary subsidized programs, and about nine times as many older adults as the voluntary
unsubsidized programs. The share of adults ages 65 and older covered through existing insurance or
2 4 F I N A N C I N G O P T I O N S F O R L O N G - T E R M S E R V I C E S A N D S U P P O R T S
new voluntary plans would decline over time, as the existing private insurance market shrinks (table 7).
By contrast, coverage rates under the mandatory programs would increase over time as the programs
become more fully phased in and fewer workers are excluded for failing to meet the work requirements.
Benefit Receipt
Many more older adults would receive benefits from the mandatory programs than the voluntary
programs, and the subsidized voluntary programs would provide benefits to more older adults than the
unsubsidized ones (table 8). Benefit receipt rates under all programs, however, would grow rapidly over
time. By 2060, the back-end benefit programs would provide benefits in 2060 to 396,000 adults if
voluntary and unsubsidized, 1.1 million adults if voluntary and subsidized, and 5.7 million adults if
mandatory.
Relatively few older adults would ever receive benefits through the voluntary programs, especially
if they were not subsidized. For example, only about 2 percent of adults born between 1976 and 1980
would ever receive benefits through the unsubsidized voluntary front-end and back-end benefit plans
and less than 1 percent would receive benefits through the unsubsidized voluntary comprehensive plan
(table 9). More people would ever receive benefits through the subsidized voluntary plans, but no more
than about 6 percent. By contrast, about a third of adults would receive benefits through the mandatory
programs at some point during their lives. Overall benefit receipt rates vary by about 10 percentage
points among enrollees across plans, for example, with between 32 and 42 percent of enrollees born
after 1960 ever receiving benefits.
Benefit receipt rates are higher among high-income adults than low-income adults for the
unsubsidized voluntary plans, but lower for high-income adults than low-income adults for the
subsidized voluntary plans (table 10). These patterns reflect differences in enrollment. High-income
adults dominate enrollment in the unsubsidized plans, and thus they are more likely than others to
receive benefits. However, many low-income adults participate in the subsidized plans, and thus are
relatively likely to receive benefits through those programs. Benefit receipt rates do not vary as much
by income when we consider only those enrolled in the programs (table 11).
F I N A N C I N G O P T I O N S F I N A N C I N G O P T I O N S F O R L O N G - T E R M S E R V I C E S A N D S U P P O R T S 2 5
Program Spending
The new insurance programs would grow rapidly over time. Between 2040 and 2060, spending by the
unsubsidized voluntary back-end benefit program would increase from $8.1 billion to $43.8 billion, the
subsidized voluntary back-end benefit program would increase from $34.1 billion to $132.9 billion, and
the mandatory back-end benefit program would increase from $159.9 billion to $660.1 billion (table
12). In 2060, benefits paid per enrollee ages 65 or older would range from $4,100 to $4,500 in the
front-end programs, from $7,400 to $9,800 in back-end benefit programs, and from $9,900 to $13,600
in the comprehensive programs. Benefits paid per aged enrollee receiving benefits would be much
higher, of course, reaching $129,400 in the mandatory comprehensive program in 2060.
Table 13 reports the average sum of lifetime benefits received by enrollees born between 1976 and
1980 who ever receive benefits from each new insurance program. The back-end benefit programs
would provide nearly twice as much lifetime benefits as the front-end benefit programs, and the
comprehensive programs would pay even more. Under the mandatory programs, for example, average
lifetime benefits among those who ever collect would be $80,700 in front-end benefit program,
$153,300 in the back-end benefit program, and $194,600 in the comprehensive program. (Average
present discounted values of lifetime benefits received by users, discounted to age 65 and reported in
table 14, would be only about half as large as the average sum of expenditures.) Lifetime benefits would
be substantially higher among those who live survive to very old ages and those with multiple years of
cognitive impairment and severe LTSS needs. Under the mandatory comprehensive plan, for example,
average lifetime spending would reach $273,000 for users who survive to age 95, compared with just
$62,700 for users who die before age 75. Users with severe cognitive impairments for two or more
years would average $276,300 in lifetime benefits from the mandatory comprehensive program,
compared with just $143,600 for users with less than a year of severe cognitive impairment.
Relative to other payers of LTSS, the new voluntary insurance programs would be fairly small. In
2060, for example, the subsidized voluntary back-end benefit plan would pay $170.2 billion for LTSS for
enrollees with severe needs, compared with $737.2 billion paid by Medicaid for aged LTSS and $1,183.7
billion paid out of pocket by families (table 15). The subsidized voluntary back-end benefit, then, would
cover only 8 percent of total LTSS costs incurred by older adults with severe LTSS needs.
The mandatory comprehensive plans would have much larger impacts on LTSS spending. In 2060,
the front-end benefit plan would cover 19 percent of total LTSS costs incurred by older adults with
severe LTSS needs, the back-end benefit plan would cover 31 percent, and the comprehensive plan
would cover 39 percent.
2 6 F I N A N C I N G O P T I O N S F O R L O N G - T E R M S E R V I C E S A N D S U P P O R T S
Tabulations of average lifetime benefits received under each program by members of different
birth cohorts reveal similar patterns. Under the mandatory back-end benefit program, members of the
1976 to 1980 birth cohort would collect lifetime benefits worth $59,900 when summed over their
lifetime (table 16), or $30,000 in present discounted value (table 17). Under both measures, the
mandatory back-end benefit program would cover about 30 percent of total LTSS spending.
Each dollar spent by the new insurance programs can be used to offset spending by Medicaid or
private insurance, offset out-of-pocket spending by families, or fund services that would otherwise not
be provided or would be provided by unpaid family caregivers. Table 18 reports the percentage of
program spending that is applied to each of these alternatives. Spending by the unsubsidized voluntary
programs would generally mostly reduce out-of-pocket spending. Each dollar spent in 2060 by the
back-end benefit program, for example, would reduce out-of-pocket spending by 46 cents. The
unsubsidized voluntary programs would not reduce LTSS Medicaid spending much because most
enrollees would have relatively high incomes and would not receive Medicaid benefits if the program
were not available. Much of the spending by the subsidized voluntary back-end plans and
comprehensive plans would offset Medicaid spending, because many low-income people would be
covered by the subsidized plans, and a lower share of spending would reduce out-of-pocket spending
than in the unsubsidized plans. The spending by the mandatory back-end benefits and comprehensive
plans would be fairly evenly split between reducing Medicaid spending, reducing out-of-pocket
spending, and financing new services.
Table 19 displays the average sum of lifetime out-of-pocket LTSS spending from age 65 to death for
adults born between 1976 and 1980 who ever have severe LTSS needs after age 65, shows how it
would change under each new insurance program, and shows how patterns vary by personal
characteristics. (Table 20 repeats the analysis using the present discounted value of lifetime out-of-
pocket spending.)
The mandatory back-end benefit plan and comprehensive plan would modestly reduce the number
of older adults receiving LTSS Medicaid benefits over time (table 21). In 2060, for example, the
mandatory comprehensive plan would reduce the number of LTSS Medicaid beneficiaries from 4.1
million to 3.4 million, or 17 percent. The voluntary plans and mandatory front-end benefit plan would
have much more modest effects.
The unsubsidized voluntary plans would have relatively little impact on out-of-pocket spending or
LTSS Medicaid spending, because enrollment would be quite low (table 22). The subsidized voluntary
back-end benefit and comprehensive plans would modestly reduce LTSS Medicaid spending, because
F I N A N C I N G O P T I O N S F I N A N C I N G O P T I O N S F O R L O N G - T E R M S E R V I C E S A N D S U P P O R T S 2 7
they enroll significant numbers of low-income adults. The mandatory back-end benefit and
comprehensive programs would substantially reduce Medicaid spending. In 2060, for example,
Medicaid LTSS spending would be 31 percent below baseline levels under the mandatory back-end
benefit plan and 35 percent below baseline under the mandatory comprehensive plan. All the
mandatory plans would significantly reduce out-of-pocket spending. In 2060, for example, out of-
pocket spending would fall 13.9 percent under the front-end benefit plan, 16.8 percent under the back-
end benefit plan, and 24.1 percent under the comprehensive plan.
Conclusions
Our simulations highlight trade-offs that policymakers must confront when designing new LTSS
insurance programs. One of the most important choices is whether to create a voluntary program or a
mandatory one. Any successful voluntary program must overcome several challenges, including price,
perceived value, adverse selection (when those who purchase coverage have a disproportionate risk of
claiming benefits), and moral hazard (when insured consumers may demand more care than those
paying completely out of pocket). In general, people who are in fair or poor health, have functional
limitations, or are experiencing cognitive decline are much more likely to purchase voluntary insurance
than people who are healthier. This problem is exacerbated in the absence of medical underwriting,
which is standard in private insurance but which would be replaced with vesting in the new programs
we modeled. Typically, as adverse selection increases, premiums rise and further discourage low- or
average-risk consumers from buying. Any purely voluntary program that fails to control adverse
selection is at risk of not being financially sustainable in the long term. To cover those most at risk of
needing LTSS, voluntary programs would have to provide subsidies for low-income people.
The drawback of a mandatory program, of course, is that it requires nearly everyone to participate,
even those who have legitimate reasons to opt out. Additionally, as the mandatory programs we
modeled phase in they provide large windfalls to older cohorts, who would contribute to the programs
for less time than younger cohorts but who would qualify for the same level of coverage. These cross-
generational transfers do not exist in the voluntary programs, which charge premiums that are designed
to cover expected benefits received by each cohort.
Other important considerations involve the size of the daily benefit provided, financing
mechanisms, the level of subsidies, and the timing of benefits. For example, will the program make
benefits available early in a spell of LTSS needs but for only a limited time, or will they be provided for a
2 8 F I N A N C I N G O P T I O N S F O R L O N G - T E R M S E R V I C E S A N D S U P P O R T S
longer period but restricted to people who have already experienced significant LTSS costs? The
programs we modeled that offered back-end or catastrophic benefits offset Medicaid spending more
than programs that offered front-end benefits, but programs with front-end benefits devoted a larger
share of program resources to reducing family out-of-pocket spending or financing services that
enrollees would not otherwise receive or would receive only from unpaid family caregivers.
Ultimately, the most appropriate insurance program will depend on policymakers’ objectives. Is the
principal goal to reduce Medicaid spending? Is it to improve later-life financial security for middle-
income people by reducing family out-of-pocket spending? Or is it to provide services to older adults
with unmet needs or to reduce burdens on family caregivers? Our simulations can help policymakers
weigh these trade-offs.
F I N A N C I N G O P T I O N S R E F E R E N C E S 2 9
References Bipartisan Policy Center. 2014. America’s Long-Term Care Crisis: Challenges in Financing and Delivery.
Washington, DC: Bipartisan Policy Center. http://bipartisanpolicy.org/wp-
content/uploads/sites/default/files/BPC%20Long-Term%20Care%20Initiative.pdf.
Board of Trustees, Federal Old-Age and Survivors Insurance and Disability Insurance Trust Funds. 2014.
2014 Annual Report of the Board of Trustees of the Federal Old-Age and Survivors Insurance and Disability
Insurance Trust Funds. Washington, DC: Author. http://www.ssa.gov/OACT/TR/2014/tr2014.pdf.
Boards of Trustees of the Federal Hospital Insurance and Federal Supplementary Medical Insurance Trust
Funds. 2014. 2014 Annual Report of the Boards of Trustees of the Federal Hospital Insurance and Federal
Supplementary Medical Insurance Trust Funds. Washington, DC: Author.
Brown, Jeffrey R., and Amy Finkelstein. 2007. “Why Is the Market for Long-Term Care Insurance So Small?”
Journal of Public Economics 91(10): 1967–91.
Broyles, Ila, Eric Hammelman, Anne Tumlinson, and Scott Weier. 2010. “Technical Assumptions Informing
an Interactive, Web-based Model of Public Long-Term Care Insurance Programs.” Washington, DC:
Avalere Health LLC. http://ltcpolicysimulator.org/LTC-Policy-Simulator-Technical-Paper.pdf
Butrica, Barbara, and Nadia Karamcheva. 2014. The Impact of Informal Caregiving on Older Adults’ Labor
Supply and Economic Resources: Final Report. Washington, DC: Urban Institute.
http://www.dol.gov/ebsa/pdf/impactofinformalcaregivingonolderadults.pdf.
Caffrey, Christine, Lauren Harris-Kojetin, Vincent Rome, and Manisha Sengupta. 2014. “Characteristics of
Residents Living in Residential Care Communities, by Community Bed Size: United States, 2012.” NCHS
Data Brief no. 171. Hyattsville, MD: National Center for Health Statistics.
Cohen, Marc A. 2014. “The Current State of the Long-Term Care Insurance Market.” Paper presented at the
14th Annual Intercompany Long-Term Care Insurance Conference, Orlando.
http://iltciconf.org/2014/index_htm_files/44-Cohen.pdf.
Cohen, Marc A., Jocelyn Gordon, and Jessica Miller. 2011. “Understanding How Long-Term Care Benefit
Triggers Are Implemented in the Private Insurance Setting.” CLASS Technical Assistance Brief Series,
No. 3. Long Beach, CA: The SCAN Foundation.
http://www.thescanfoundation.org/sites/thescanfoundation.org/files/TSF_CLASS_TA_No2_History_Be
nefit_Eligibility_FINAL.pdf.
Cohen, Marc A., Nanda Kumar, Thomas McGuire, and Stanley S. Wallack. 1992. “Financing Long-Term Care:
A Practical Mix of Public and Private.” Journal of Health Politics, Policy and Law, 17(3): 403–23.
Commission on Long-Term Care. 2013. Report to the Congress. Washington, DC: Commission on Long-Term
Care. http://ltccommission.lmp01.lucidus.net/wp-content/uploads/2013/12/Commission-on-Long-
Term-Care-Final-Report-9-26-13.pdf.
Congressional Budget Office.2013. Rising Demand for Long-Term Services and Supports for Elderly People.
Washington, DC: Congressional BudgetOffice. http://www.cbo.gov/sites/default/files/44363-LTC.pdf.
Crown, William H., Brian O. Burwell, and Lisa Alecxih. 1994. “An Analysis of Asset Testing for Nursing Home
Benefits.” Washington, DC: AARP Public Policy Institute.
3 0 R E F E R E N C E S
Eljay, LLC. 2014. A Report on Shortfalls in Medicaid Funding for Nursing Center Care. Report prepared for the
American Health Care Association. Louisville, KY: Eljay, LLC.
http://www.ahcancal.org/research_data/funding/Documents/FINAL%202013%20Medicaid%20Under
funding%20for%20Nursing%20Center%20Care.pdf.
Ettner, Susan L. 1997. “Medicaid Participation among the Eligible Elderly.” Journal of Policy Analysis and
Management 16(2): 237-255.
Favreault, Melissa, and Judith Dey. 2015. Long-Term Services and Supports for Older Americans: Risks and
Financing Research Brief. Washington, DC: Department of Health and Human Services, Office of the
Assistant Secretary for Planning and Evaluation. http://aspe.hhs.gov/basic-report/long-term-services-
and-supports-older-americans-risks-and-financing-research-brief.
Favreault, Melissa M Howard Gleckman, and Richard W. Johnson. 2015. “Financing Long-Term Services
And Supports: Options Reflect Trade-Offs For Older Americans And Federal Spending.” Health Affairs.
Webfirst November 17.
Favreault, Melissa M., Owen Haaga, Paul Johnson, and Richard W. Johnson. 2015. “The Potential Effects of
Medicaid Reforms and Expanded Retirement Savings Options on the Financing of Long-Term Services
and Supports.” Washington, DC: Urban Institute.
Favreault, Melissa M., Karen E. Smith, Richard W. Johnson. 2015. The Dynamic Simulation of Income Model
(DYNASIM): An Overview. Washington, DC: Urban Institute.
http://www.urban.org/sites/default/files/alfresco/publication-pdfs/2000391-The-Dynamic-
Simulation-of-Income-Model-DYNASIM-%20An-Overview.pdf.
Fossett, James W. and Courtney E. Burke. 2010. “Medicaid Policy and Long-Term Care Spending: An
Interactive View.” Albany, NY: The Nelson A. Rockefeller Institute of Government.
http://www.rockinst.org/pdf/health_care/2010-08-Medicaid_Policy.pdf.
Freedman, Vicki A., and Brenda C. Spillman BC. 2014. “Disability and Care Needs among Older Americans.”
Milbank Quarterly 92(3): 509–41.
Freedman, Vicki A., and Brenda C. Spillman. 2014a. “The residential continuum from home to nursing home:
size, characteristics and unmet needs of older adults.” Journals of Gerontology, Series B: Psychological
Sciences and Social Sciences 69(7): S42–S50.
Freedman, Vicki A., and Brenda C. Spillman. 2014b. “Disability and Care Needs among Older Americans.”
Milbank Quarterly 92(3): 509–41.
Freedman, Vicki A., Brenda C. Spillman, Patti M. Andreski, Jennifer C. Cornman, Eileen M. Crimmins, Ellen
Kramarow, James Lubitz, Linda G. Martin, Sharon S. Merkin, Robert F. Schoeni, Teresa E. Seeman, and
Timothy A. Waidmann. 2013. “Trends in Late-Life Activity Limitations in the United States: An Update
from Five National Surveys.” Demography 50(2): 661–71.
Friedberg, Leora, Wei Sun, Anthony Webb, Wenliang Hou, and Zhenyu Li. 2014. “New Evidence on the Risk
of Requiring Long-Term Care.” Working paper No. 2014-12. Chestnut Hill, MA: Center for Retirement
Research at Boston College.
Gardner, Kara and Donna B. Gilleskie. 2012. “The Effects of State Medicaid Policies on the Dynamic Savings
Patterns and Medicaid Enrollment of the Elderly.” Journal of Human Resources 47(4): 1082–1127.
F I N A N C I N G O P T I O N S R E F E R E N C E S 3 1
Genworth. 2014. Genworth 2014 Cost of Care Survey: Home Care Providers, Adult Day Health Care Facilities,
Assisted Living Facilities and Nursing Homes. Richmond, VA: Genworth.
https://www.genworth.com/dam/Americas/US/PDFs/Consumer/corporate/130568_032514_CostofC
are_FINAL_nonsecure.pdf.
Genworth. 2015. Genworth 2015 Cost of Care Survey: Home Care Providers, Adult Day Health Care Facilities,
Assisted Living Facilities and Nursing Homes. Richmond, VA: Genworth.
https://www.genworth.com/dam/Americas/US/PDFs/Consumer/corporate/130568_040115_gnw.pdf.
Giese, Christopher J. and Allen J. Schmitz. 2015. Premium Estimates for Policy Options to Finance Long-Term
Services and Supports. Brookfield, WI: Milliman, Inc. http://www.thescanfoundation.org/ltc-financing-
initiative.
Grabowski, David C., Zhanlian Feng, Orna Intrator, and Vincent Mor. 2004. “Recent Trends In State Nursing
Home Payment Policies.” Health Affairs (web exclusive): W4-363–W4-373.
Haber, Susan, Walter Adamache, Edith G. Walsh, Sonja Hoover, and Anupa Bir. 2003. Evaluation of Qualified
Medicare Beneficiary and Specified Low-Income Medicare Beneficiary Programs. Final Report to the Centers
for Medicare and Medicaid Services. Research Triangle Park, N.C.: Research Triangle Institute
International. https://www.cms.gov/Research-Statistics-Data-and-Systems/Statistics-Trends-and-
Reports/Reports/Downloads/HaberVol1.pdf; https://www.cms.gov/Research-Statistics-Data-and-
Systems/Statistics-Trends-and-Reports/Reports/Downloads/HaberVol2.pdf.
Hurd, Michael, Pierre-Carl Michaud, and Susann Rohwedder. 2014. “The Lifetime Risk of Nursing Home
Use.” In David A. Wise, ed., Discoveries in the Economics of Aging. Chicago: University of Chicago Press.
Jacobson, Gretchen, Tricia Neuman, and Anthony Damico. 2010. Medicare Spending and Use of Medical
Services for Beneficiaries in Nursing Homes and Other Long-Term Care Facilities: A Potential for Achieving
Medicare Savings and Improving the Quality of Care. Menlo Park, CA: Henry J. Kaiser Family Foundation.
http://kff.org/health-costs/report/medicare-spending-and-use-of-medical-services.
Johnson, Richard W., and Anthony T. Lo Sasso. 2006. “The Impact of Elder Care on Women’s Labor Supply at
Midlife.” Inquiry 43(3): 195–210.
Johnson, Richard W., and Joshua M. Wiener. 2006. A Profile of Frail Older Americans and Their Caregivers.
Washington, DC: The Urban Institute.
Karon, Sarita L., Joshua M. Wiener, Angela M. Greene, Galina Khatutsky, and Ruby Johnson. 2014. What
Factors Affect Residential Care Facility Charges? Washington, D.C.: Office of the Assistant Secretary for
Planning and Evaluation, U.S. Department of Health .and Human Services.
http://aspe.hhs.gov/daltcp/reports/2014/RCFcharge.pdf.
Kaye, H. Stephen, Charlene Harrington, and Mitchell P. LaPlante. 2010. “Long-Term Care: Who Gets It, Who
Provides It, Who Pays, and How Much?” Health Affairs 29(1): 11–21.
Kemper, Peter, Brenda C. Spillman, and Christopher M. Murtaugh. 1991. “A Lifetime Perspective on
Proposals for Financing Nursing Home Care.” Inquiry 28: 333–44.
Kemper, Peter, Harriet L. Komisar, and Lisa Alecxih. 2005/2006. “Long-Term Care over an Uncertain
Future: What Can Current Retirees Expect?” Inquiry 42: 335-350.
3 2 R E F E R E N C E S
Komisar, Harriet, and Judy Feder. 2011. Transforming Care for Medicare Beneficiaries with Chronic Conditions
and Long-Term Care Needs: Coordinating Care across All Services. Washington, DC: Georgetown University.
http://www.thescanfoundation.org/sites/default/files/Georgetown_Trnsfrming_Care.pdf.
Komisar, Harriet L., Judy Feder, and Judith D. Kasper. 2005. “Unmet Long-Term Care Needs: An Analysis of
Medicare-Medicaid Dual Eligibles.” Inquiry 42(2): 171–82.
LeadingAge Pathways. 2013. A Framework for Addressing Americans’ Financial Risk for Long-Term Services and
Supports.
Lièvre, Agnès, Dawn Alley, and Eileen M. Crimmins. 2008. “Educational Differentials in Life Expectancy with
Cognitive Impairment among the Elderly in the United States.” Journal of Aging and Health 20(4): 456–
77.
Long-Term Care Financing Collaborative. 2015. “Principle for Improving Financing and Delivery of Long-
Term Services and Supports.” http://www.convergencepolicy.org/wp-
content/uploads/2015/07/LTCFC-Foundational-Principles-Final-070215.pdf.
Lowry, Sean. 2014. Itemized Tax Deductions for Individuals: Data Analysis. R43012. Washington, DC:
Congressional Research Service.
Manton, Kenneth G., XiLiang Gu, and Gene R. Lowrimore. 2008. “Cohort Changes in Active Life Expectancy
in the U.S. Elderly Population: Experience from the 1982–2004 National Long-Term Care Survey.”
Journal of Gerontology: Social Sciences 63B(5): S269–S281.
Martin, Susan B., Lindsay Lowell, Elzbieta M. Gozdiziak, Micah Bump, and Mary E. Breeding. 2009. The Role
of Migrant Care Workers in Aging Societies: Report on Research Findings in the United States. Washington,
DC: Institute for the Study of International Migration.
MetLife Mature Market Institute. 2011. The MetLife Study of Caregiving Costs to Working Caregivers: Double
Jeopardy for Baby Boomers Caring for their Parents. Westport, CT: MetLife Mature Market Institute.
http://www.caregiving.org/wp-content/uploads/2011/06/mmi-caregiving-costs-working-
caregivers.pdf.
MetLife. 2013. Market Survey of Long-Term Care Costs: The 2013 MetLife Market Survey of Nursing Home,
Assisted Living, Adult Day Services, and Home Care Costs. New York: MetLife Mature Market Institute.
Miller, Jessica S., Xiaomei Shi, and Marc A. Cohen. 2008. Private Long-Term Care Insurance: Following an
Admission Cohort over 28 Months to Track Claim Experience, Service Use and Transitions. Washington, DC:
Department of Health and Human Services, Office of the Assistant Secretary for Planning and
Evaluation. http://aspe.hhs.gov/daltcp/reports/2008/coht28mo.pdf
Milliman. 2014. Milliman Long-Term Care Guidelines. Brookfield, WI: Milliman, Inc.
Mollica, Robert L. 2009. State Medicaid Reimbursement Policies and Practices in Assisted Living. Washington,
DC: National Center for Assisted Living, American Health Care Association.
http://www.ahcancal.org/ncal/resources/documents/medicaidassistedlivingreport.pdf.
Murtaugh, Christopher M. and Brenda C. Spillman. 2012. “Lifetime Risk of Chronic Disease, Disability and
Long Term Care.” Presentation at the 12th
Annual Intercompany Long-Term Care Insurance
Conference.
F I N A N C I N G O P T I O N S R E F E R E N C E S 3 3
Murtaugh, Christopher M., Brenda C. Spillman, and Xing (Doreen) Wang. 2010. “Lifetime Risk and Duration
of Chronic Disease and Disability.” Journal of Aging and Health 23(3): 554–77.
National Alliance for Caregiving and AARP Public Policy Institute. 2015. Caregiving in the U.S.: 2015 Report.
Washington, DC: The National Alliance for Caregiving and AARP Public Policy Institute.
http://www.aarp.org/content/dam/aarp/ppi/2015/caregiving-in-the-united-states-2015-report-
revised.pdf.
Ng, Terence, Charlene Harrington, MaryBeth Musumeci, and Erica L. Reaves. 2014. “Medicaid Home and
Community-Based Services Programs: 2010 Data Update.” Menlo Park, CA: Kaiser Commission on
Medicaid and the Uninsured.
O’Keeffe Janet, Paul Saucier, Beth Jackson, Robin Cooper, Earnest McKenney, Suzanne Crisp, and Charles
Moseley. 2010. Understanding Medicaid Home and Community Services: A Primer. Washington, DC:
Department of Health and Human Services, Office of the Assistant Secretary for Planning and
Evaluation. http://aspe.hhs.gov/understanding-medicaid-home-and-community-services-primer-2010-
edition.
O’Leary, John. 2014. “Land This Plane: A Delphi Research Study of Long-Term Care Financing Solutions.”
Sponsored by Society of Actuaries
O’Shaughnessy, Carol V. 2014. “National Spending for Long-Term Services and Supports (LTSS), 2012.”
National Health Policy Forum. Washington, DC: George Washington University.
Ofstedal, Mary Beth, Gwenith G. Fisher and A. Regula Herzog. 2005. Documentation of Cognitive Functioning
Measures in the Health and Retirement Study. HRS Documentation Report DR-006.
Pezzin, Liliana E. and Judith D. Kasper. 2002. “Medicaid Enrollment among Elderly Medicare Beneficiaries:
Individual Determinants, Effects of State Policy, and Impact on Service Use.” Health Services Research
37(4): 827-847.
Pinquart, Martin, and Silvia Sorensen. 2007. “Correlates of Physical Health of Informal Caregivers: A Meta-
Analysis.” Journal of Gerontology 62B: P126-37.
Rivlin, Alice M., Joshua M. Wiener, Raymond J. Hanley, and Denise A. Spence. 1988. Caring for the Disabled
Elderly: Who Will Pay? Washington, DC: Brookings Institution Press.
Roth, David L., Martinique Perkins, Virginia G. Wadley, Ella M. Temple, William E. Haley. 2009. “Family
caregiving and emotional strain: Associations with quality of life in a large national sample of middle-
aged and older adults.” Quality of Life Research 18(6): 679-88.
Rupp, Kalman and James Sears. 2000. “Eligibility for the Medicare Buy in Programs, Based on a Survey of
Income and Program Participation Simulation.” Social Security Bulletin 63(3): 13-25.
Salomon, Joshua A., Haidong Wang, Michael K. Freeman, Theo Vos, Abraham D. Flaxman, Alan D. Lopez, and
Christopher J. L. Murray. 2012. “Healthy life expectancy for 187 countries, 1990–2010: A systematic
analysis for the Global Burden Disease Study 2010.” The Lancet 380: 2144–62.
Sears, James. 2001/2002. “Comparing Beneficiaries of the Medicare Savings Programs with Eligible
Nonparticipants.” Social Security Bulletin 64(3): 76-80.
3 4 R E F E R E N C E S
Society of Actuaries. 2011. Long-Term Care Experience Committee Intercompany Study Report 6: 1984 –
2007. Schaumburg, IL: Society of Actuaries. https://www.soa.org/research/experience-
study/ltc/research-ltc-study-1984-report.aspx.
Spillman, Brenda C., Jennifer Wolff, Vicki A. Freedman, and Judith D. Kaspar. 2014. Informal Caregiving for
Older Americans: An Analysis of the 2011 National Study of Caregiving. Washington, DC: Department of
Health and Human Services, Office of the Assistant Secretary for Planning and Evaluation.
http://aspe.hhs.gov/sites/default/files/pdf/77146/NHATS-IC.pdf.
Stallard, Eric. 2011. “Estimates of the Incidence, Prevalence, Duration, Intensity and Cost of Chronic
Disability among the U.S. Elderly.” North American Actuarial Journal 15(1): 32–58.
Suthers, Kristen, Jung Ki Kim, and Eileen Crimmins. 2003. “Life Expectancy with Cognitive Impairment in the
Older Population of the United States.” Journal of Gerontology: Social Sciences 58B(3): S179–S186.
Thomas, Katie. 2015. “In Race for Medicare Dollars, Nursing Home Care May Lag.” New York Times. April 14.
Tumlinson, Anne, Eric Hammelman, Elana Stair, and Joshua M. Wiener. 2013. Insuring Americans for Long-
Term Care: Challenges And Limitations of Voluntary Insurance. Washington, DC: Avalere Health LLC.
http://www.thescanfoundation.org/sites/default/files/avalere_challenges-limitations-voluntary-
insurance_3-20-13.pdf.
Tumlinson, Anne. 2015. “The 3 Surprising Medicare Benefits You MUST Know About.” Blog post dated June
3. http://www.daughterhood.org/the-3-surprising-medicare-benefits-you-must-know-about/.
US Census Bureau. 2014. “2012 National Population Projections: Summary Tables.” Washington, DC:
Census Bureau.
http://www.census.gov/population/projections/data/national/2012/summarytables.html.
US Department of Health and Human Services. 2014. “National Plan to Address Alzheimer’s Disease: 2014
Update.” http://aspe.hhs.gov/daltcp/napa/NatlPlan2014.pdf.
US Government Accountability Office. 2012. “Medicare Savings Programs: Implementation of
Requirements Aimed at Increasing Enrollment.” GAO 12-871. Washington, DC: US Government
Accountability Office.
Van Houtven, Courtney H., Norma B. Coe, and Meghan Skira. 2013. “The Effect of Informal Care on Work
and Wages.” Journal of Health Economics 32(1): 240–52.
Wiener, Joshua A., Carroll L. Estes, Susan M. Goldenson, and Sheryl C. Goldberg. 2001. “What Happened to
Long-Term Care in the Health Reform Debate of 1993–1994? Lessons for the Future.” Milbank Quarterly
79(2): 207–52.
Wiener, Joshua A., Laurel Hixon Illston, and Raymond J. Hanley. 1994. Sharing the Burden: Strategies for Public
and Private Long-Term Care Insurance. Washington, DC: Brookings Institution Press.
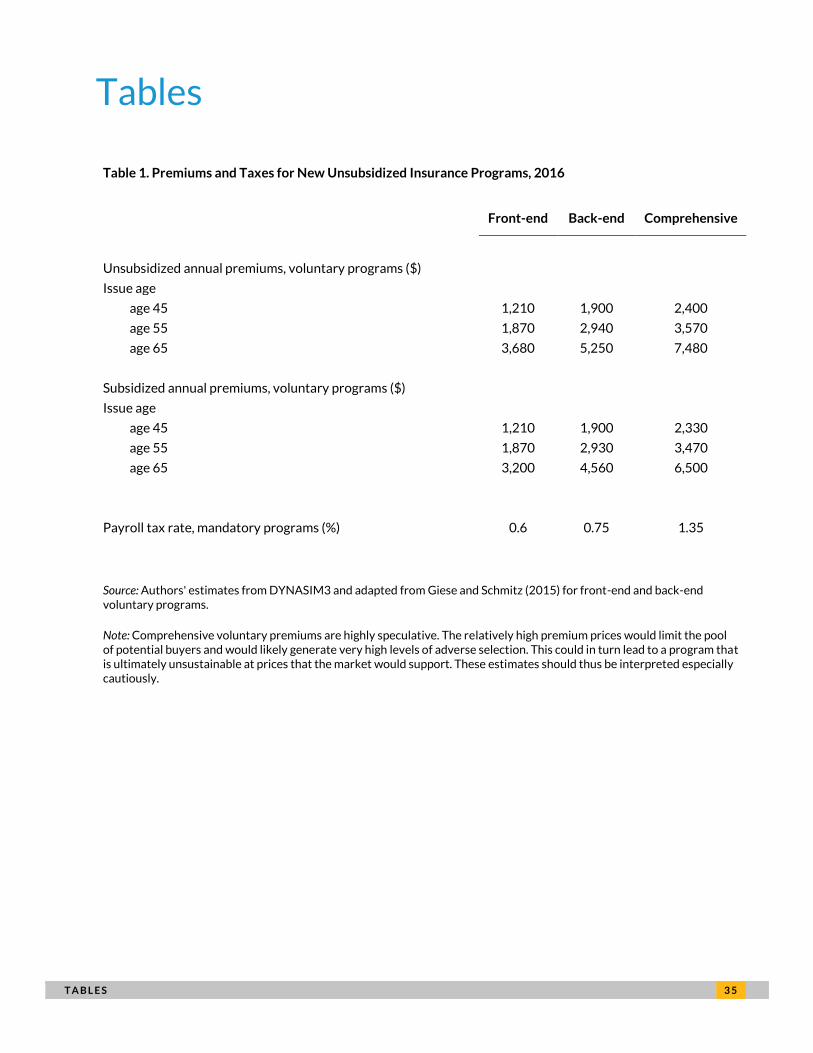
T A B L E S 3 5
Tables
Table 1. Premiums and Taxes for New Unsubsidized Insurance Programs, 2016
Front-end Back-end Comprehensive
Unsubsidized annual premiums, voluntary programs ($) Issue age age 45 1,210 1,900 2,400
age 55 1,870 2,940 3,570
age 65 3,680 5,250 7,480
Subsidized annual premiums, voluntary programs ($) Issue age age 45 1,210 1,900 2,330
age 55 1,870 2,930 3,470
age 65 3,200 4,560 6,500
Payroll tax rate, mandatory programs (%) 0.6 0.75 1.35
Source: Authors' estimates from DYNASIM3 and adapted from Giese and Schmitz (2015) for front-end and back-end voluntary programs.
Note: Comprehensive voluntary premiums are highly speculative. The relatively high premium prices would limit the pool of potential buyers and would likely generate very high levels of adverse selection. This could in turn lead to a program that is ultimately unsustainable at prices that the market would support. These estimates should thus be interpreted especially cautiously.
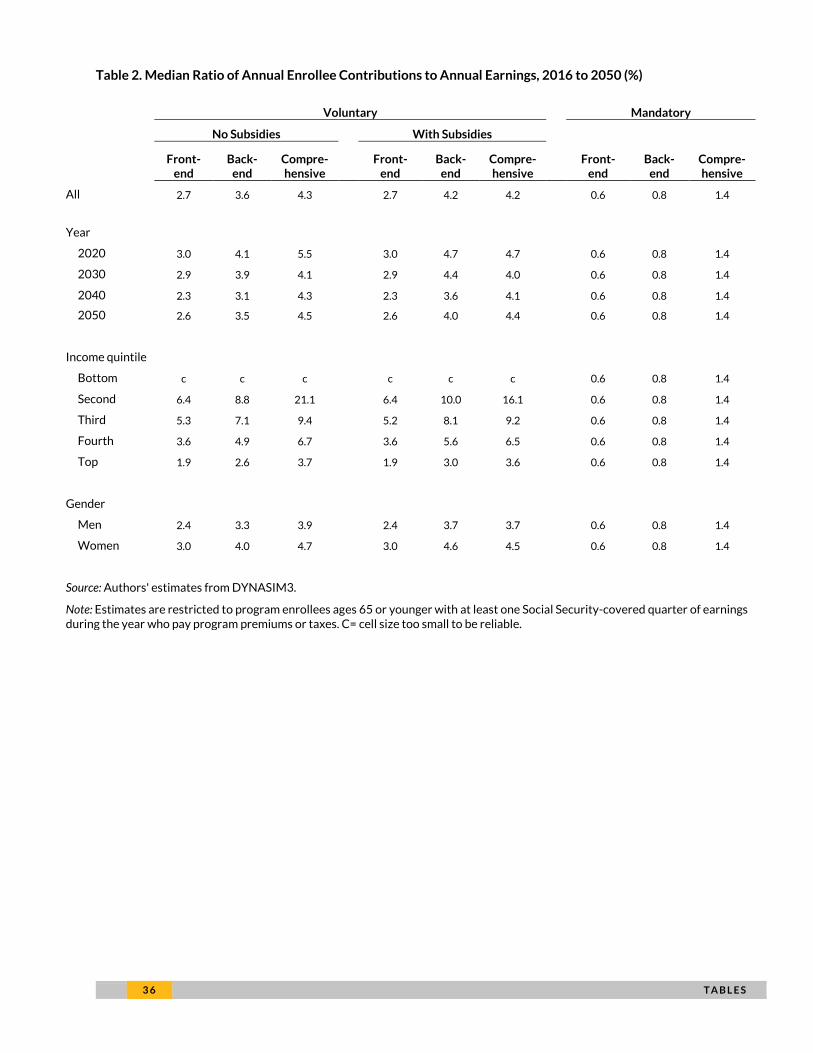
3 6 T A B L E S
Table 2. Median Ratio of Annual Enrollee Contributions to Annual Earnings, 2016 to 2050 (%)
Voluntary
Mandatory
No Subsidies
With Subsidies
Front-end
Back-end
Compre-hensive
Front-end
Back-end
Compre-hensive
Front-end
Back-end
Compre-hensive
All 2.7 3.6 4.3
2.7 4.2 4.2
0.6 0.8 1.4
Year
2020 3.0 4.1 5.5
3.0 4.7 4.7
0.6 0.8 1.4
2030 2.9 3.9 4.1
2.9 4.4 4.0
0.6 0.8 1.4
2040 2.3 3.1 4.3
2.3 3.6 4.1
0.6 0.8 1.4
2050 2.6 3.5 4.5
2.6 4.0 4.4
0.6 0.8 1.4
Income quintile
Bottom c c c
c c c
0.6 0.8 1.4
Second 6.4 8.8 21.1
6.4 10.0 16.1
0.6 0.8 1.4
Third 5.3 7.1 9.4
5.2 8.1 9.2
0.6 0.8 1.4
Fourth 3.6 4.9 6.7
3.6 5.6 6.5
0.6 0.8 1.4
Top 1.9 2.6 3.7
1.9 3.0 3.6
0.6 0.8 1.4
Gender
Men 2.4 3.3 3.9
2.4 3.7 3.7
0.6 0.8 1.4
Women 3.0 4.0 4.7
3.0 4.6 4.5
0.6 0.8 1.4
Source: Authors' estimates from DYNASIM3.
Note: Estimates are restricted to program enrollees ages 65 or younger with at least one Social Security-covered quarter of earnings during the year who pay program premiums or taxes. C= cell size too small to be reliable.
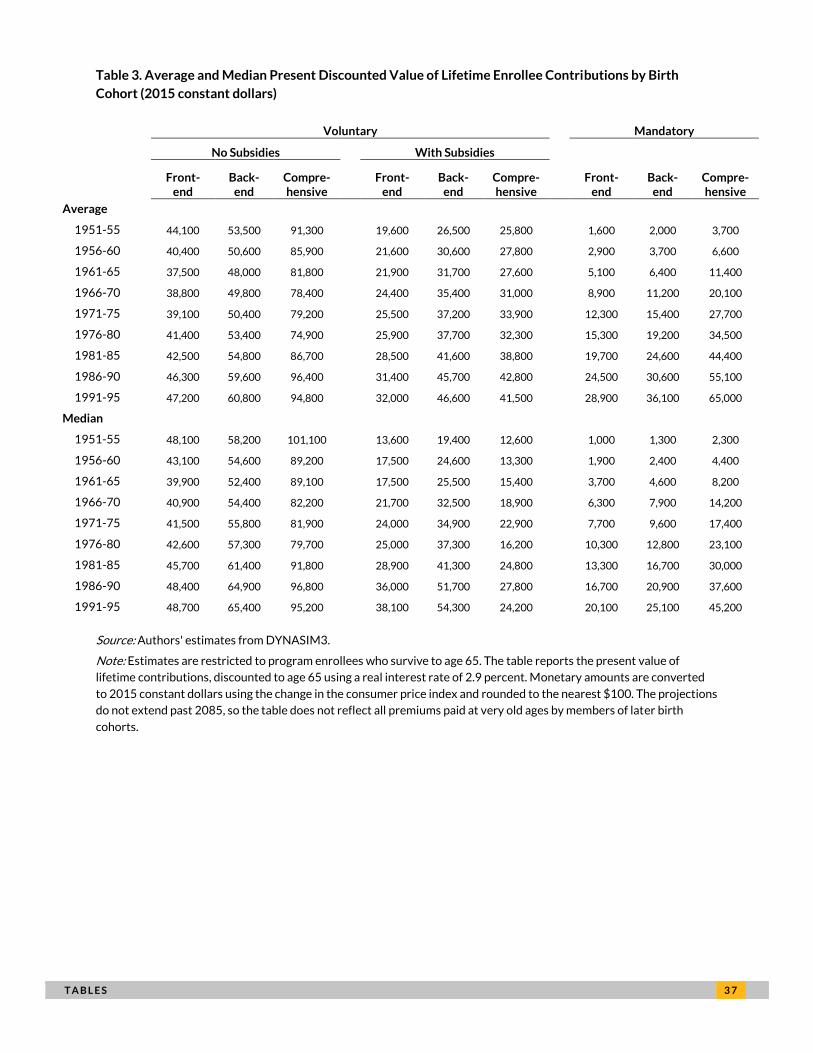
T A B L E S 3 7
Table 3. Average and Median Present Discounted Value of Lifetime Enrollee Contributions by Birth
Cohort (2015 constant dollars)
Voluntary
Mandatory
No Subsidies
With Subsidies
Front-end
Back-end
Compre-hensive
Front-end
Back-end
Compre-hensive
Front-end
Back-end
Compre-hensive
Average
1951-55 44,100 53,500 91,300
19,600 26,500 25,800
1,600 2,000 3,700
1956-60 40,400 50,600 85,900
21,600 30,600 27,800
2,900 3,700 6,600
1961-65 37,500 48,000 81,800
21,900 31,700 27,600
5,100 6,400 11,400
1966-70 38,800 49,800 78,400
24,400 35,400 31,000
8,900 11,200 20,100
1971-75 39,100 50,400 79,200
25,500 37,200 33,900
12,300 15,400 27,700
1976-80 41,400 53,400 74,900
25,900 37,700 32,300
15,300 19,200 34,500
1981-85 42,500 54,800 86,700
28,500 41,600 38,800
19,700 24,600 44,400
1986-90 46,300 59,600 96,400
31,400 45,700 42,800
24,500 30,600 55,100
1991-95 47,200 60,800 94,800
32,000 46,600 41,500
28,900 36,100 65,000
Median
1951-55 48,100 58,200 101,100
13,600 19,400 12,600
1,000 1,300 2,300
1956-60 43,100 54,600 89,200
17,500 24,600 13,300
1,900 2,400 4,400
1961-65 39,900 52,400 89,100
17,500 25,500 15,400
3,700 4,600 8,200
1966-70 40,900 54,400 82,200
21,700 32,500 18,900
6,300 7,900 14,200
1971-75 41,500 55,800 81,900
24,000 34,900 22,900
7,700 9,600 17,400
1976-80 42,600 57,300 79,700
25,000 37,300 16,200
10,300 12,800 23,100
1981-85 45,700 61,400 91,800
28,900 41,300 24,800
13,300 16,700 30,000
1986-90 48,400 64,900 96,800
36,000 51,700 27,800
16,700 20,900 37,600
1991-95 48,700 65,400 95,200
38,100 54,300 24,200
20,100 25,100 45,200
Source: Authors' estimates from DYNASIM3.
Note: Estimates are restricted to program enrollees who survive to age 65. The table reports the present value of
lifetime contributions, discounted to age 65 using a real interest rate of 2.9 percent. Monetary amounts are converted
to 2015 constant dollars using the change in the consumer price index and rounded to the nearest $100. The projections
do not extend past 2085, so the table does not reflect all premiums paid at very old ages by members of later birth
cohorts.
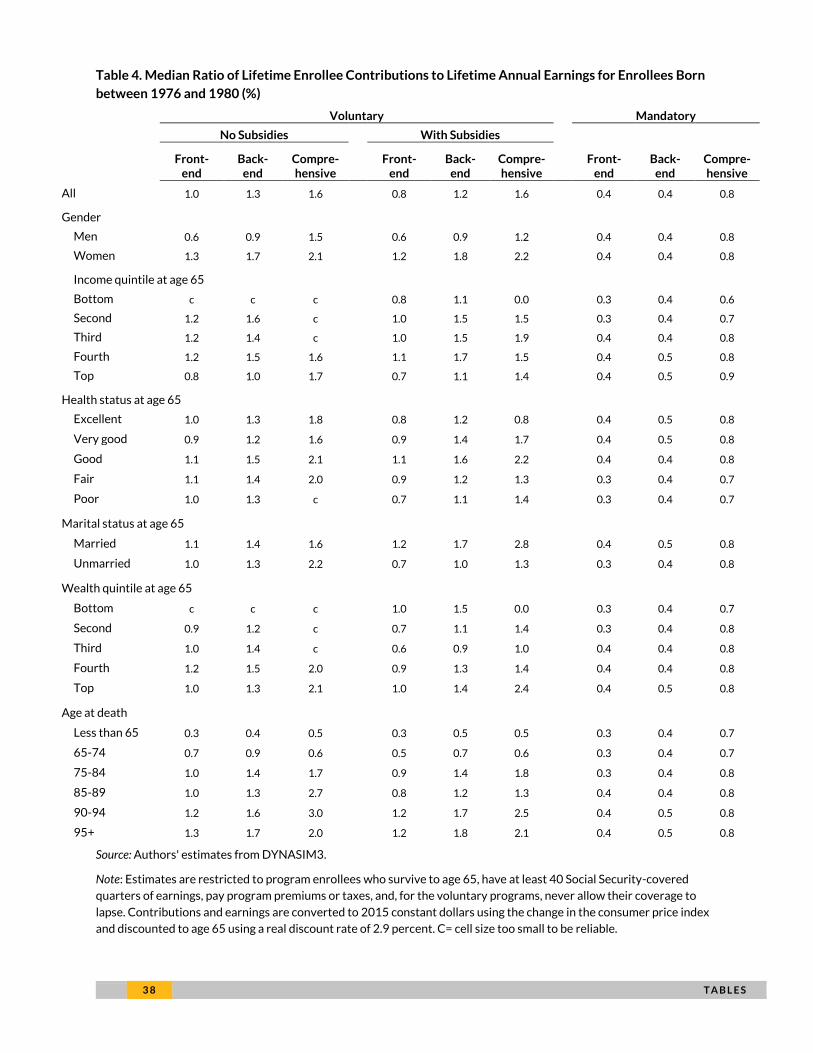
3 8 T A B L E S
Table 4. Median Ratio of Lifetime Enrollee Contributions to Lifetime Annual Earnings for Enrollees Born
between 1976 and 1980 (%)
Voluntary Mandatory
No Subsidies With Subsidies
Front-end
Back-end
Compre-hensive
Front-end
Back-end
Compre-hensive
Front-end
Back-end
Compre-hensive
All 1.0 1.3 1.6 0.8 1.2 1.6 0.4 0.4 0.8
Gender
Men 0.6 0.9 1.5 0.6 0.9 1.2 0.4 0.4 0.8
Women 1.3 1.7 2.1 1.2 1.8 2.2 0.4 0.4 0.8
Income quintile at age 65
Bottom c c c 0.8 1.1 0.0 0.3 0.4 0.6
Second 1.2 1.6 c 1.0 1.5 1.5 0.3 0.4 0.7
Third 1.2 1.4 c 1.0 1.5 1.9 0.4 0.4 0.8
Fourth 1.2 1.5 1.6 1.1 1.7 1.5 0.4 0.5 0.8
Top 0.8 1.0 1.7 0.7 1.1 1.4 0.4 0.5 0.9
Health status at age 65
Excellent 1.0 1.3 1.8 0.8 1.2 0.8 0.4 0.5 0.8
Very good 0.9 1.2 1.6 0.9 1.4 1.7 0.4 0.5 0.8
Good 1.1 1.5 2.1 1.1 1.6 2.2 0.4 0.4 0.8
Fair 1.1 1.4 2.0 0.9 1.2 1.3 0.3 0.4 0.7
Poor 1.0 1.3 c 0.7 1.1 1.4 0.3 0.4 0.7
Marital status at age 65
Married 1.1 1.4 1.6 1.2 1.7 2.8 0.4 0.5 0.8
Unmarried 1.0 1.3 2.2 0.7 1.0 1.3 0.3 0.4 0.8
Wealth quintile at age 65
Bottom c c c 1.0 1.5 0.0 0.3 0.4 0.7
Second 0.9 1.2 c 0.7 1.1 1.4 0.3 0.4 0.8
Third 1.0 1.4 c 0.6 0.9 1.0 0.4 0.4 0.8
Fourth 1.2 1.5 2.0 0.9 1.3 1.4 0.4 0.4 0.8
Top 1.0 1.3 2.1 1.0 1.4 2.4 0.4 0.5 0.8
Age at death Less than 65 0.3 0.4 0.5 0.3 0.5 0.5 0.3 0.4 0.7
65-74 0.7 0.9 0.6 0.5 0.7 0.6 0.3 0.4 0.7
75-84 1.0 1.4 1.7 0.9 1.4 1.8 0.3 0.4 0.8
85-89 1.0 1.3 2.7 0.8 1.2 1.3 0.4 0.4 0.8
90-94 1.2 1.6 3.0 1.2 1.7 2.5 0.4 0.5 0.8
95+ 1.3 1.7 2.0 1.2 1.8 2.1 0.4 0.5 0.8
Source: Authors' estimates from DYNASIM3.
Note: Estimates are restricted to program enrollees who survive to age 65, have at least 40 Social Security-covered
quarters of earnings, pay program premiums or taxes, and, for the voluntary programs, never allow their coverage to
lapse. Contributions and earnings are converted to 2015 constant dollars using the change in the consumer price index
and discounted to age 65 using a real discount rate of 2.9 percent. C= cell size too small to be reliable.
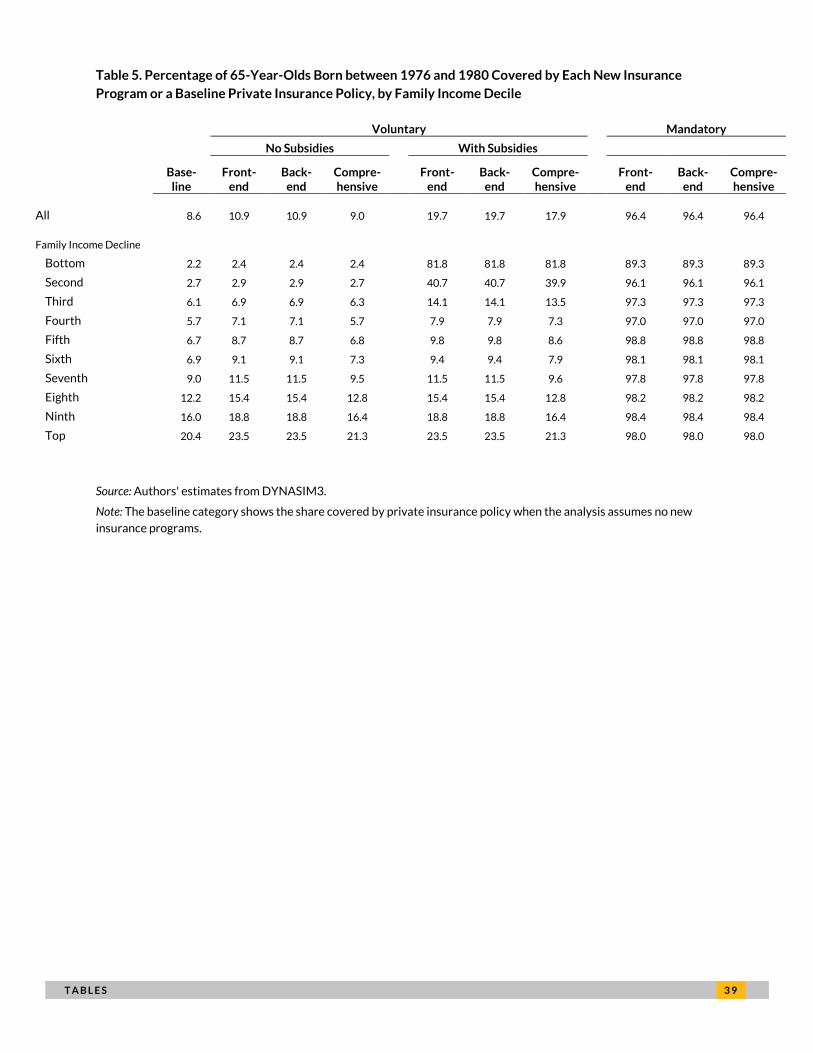
T A B L E S 3 9
Table 5. Percentage of 65-Year-Olds Born between 1976 and 1980 Covered by Each New Insurance
Program or a Baseline Private Insurance Policy, by Family Income Decile
Voluntary Mandatory
No Subsidies With Subsidies
Base-line
Front-end
Back-end
Compre-hensive
Front-end
Back-end
Compre-hensive
Front-end
Back-end
Compre-hensive
All 8.6 10.9 10.9 9.0 19.7 19.7 17.9 96.4 96.4 96.4
Family Income Decline
Bottom 2.2 2.4 2.4 2.4 81.8 81.8 81.8 89.3 89.3 89.3
Second 2.7 2.9 2.9 2.7 40.7 40.7 39.9 96.1 96.1 96.1
Third 6.1 6.9 6.9 6.3 14.1 14.1 13.5 97.3 97.3 97.3
Fourth 5.7 7.1 7.1 5.7 7.9 7.9 7.3 97.0 97.0 97.0
Fifth 6.7 8.7 8.7 6.8 9.8 9.8 8.6 98.8 98.8 98.8
Sixth 6.9 9.1 9.1 7.3 9.4 9.4 7.9 98.1 98.1 98.1
Seventh 9.0 11.5 11.5 9.5 11.5 11.5 9.6 97.8 97.8 97.8
Eighth 12.2 15.4 15.4 12.8 15.4 15.4 12.8 98.2 98.2 98.2
Ninth 16.0 18.8 18.8 16.4 18.8 18.8 16.4 98.4 98.4 98.4
Top 20.4 23.5 23.5 21.3 23.5 23.5 21.3 98.0 98.0 98.0
Source: Authors' estimates from DYNASIM3.
Note: The baseline category shows the share covered by private insurance policy when the analysis assumes no new
insurance programs.
4 0 T A B L E S
Table 6. Percentage of Adults Born between 1976 and 1980 Covered by Each New Insurance Program at
Age 65, by Personal Characteristics
Voluntary Mandatory
No Subsidies With Subsidies
Front-end
Back-end
Compre-hensive
Front-end
Back-end
Compre-hensive
Front-end
Back-end
Compre-hensive
All 5.1 5.1 0.6
14.2 14.2 9.8
95.3 95.1 96.5
Gender
Men 4.7 4.7 0.5
13.8 13.8 9.9
96.4 96.4 97.6
Women 5.5 5.5 0.7
14.6 14.6 9.6
94.1 93.9 95.3
Income quintile at age 65
Bottom c c c
60.8 60.8 60.4
92.4 92.4 92.5
Second 1.9 1.9 c
6.1 6.1 4.9
96.7 96.6 96.9
Third 3.9 3.9 c
4.7 4.7 1.6
98.0 97.7 98.4
Fourth 6.3 6.3 0.6
6.4 6.4 0.7
96.6 96.2 98.6
Top 10.6 10.6 1.4
10.7 10.7 1.4
95.2 95.2 97.8
Health status at age 65 Excellent 7.9 7.9 0.6
12.9 12.9 5.6
97.2 96.9 98.8
Very good 6.0 6.0 0.9
13.2 13.2 8.3
96.6 96.4 98.1
Good 4.6 4.6 0.6
15.4 15.4 11.6
96.1 96.1 97.3
Fair 3.9 3.9 0.5
17.2 17.2 13.6
94.2 94.1 95.1
Poor 3.3 3.3 c
22.5 22.5 19.2
94.2 94.0 94.9
Marital status at age 65 Married 4.9 4.9 0.4
10.0 10.0 5.6
95.9 95.8 97.4
Unmarried 5.7 5.7 0.9
23.8 23.8 19.2
95.9 95.7 96.7
Wealth quintile at age 65
Bottom c c c
24.5 24.5 23.9
93.4 93.4 93.5
Second 0.9 0.9 c
11.7 11.7 10.9
97.9 97.9 98.4
Third 2.7 2.7 c
12.8 12.8 10.2
97.4 97.1 98.0
Fourth 5.2 5.2 0.3
14.1 14.1 9.3
96.3 96.1 97.8
Top 14.4 14.4 2.2
15.6 15.6 3.8
94.1 93.9 97.1
Age at death Less than 65 4.9 4.9 0.6
4.9 4.9 0.6
91.9 91.9 92.9
65-74 6.6 6.6 0.6
19.1 19.1 13.2
96.4 96.1 97.8
75-84 5.2 5.2 0.6
16.3 16.3 11.9
95.1 95.0 96.3
85-89 5.3 5.3 0.4
15.9 15.9 11.0
96.0 96.0 97.1
90-94 5.2 5.2 0.7
15.2 15.2 10.6
96.4 96.3 97.6
95+ 4.2 4.2 0.7
11.8 11.8 8.4
96.2 96.0 97.8
Source: Authors' estimates from DYNASIM3.
Note: The baseline category shows the share covered by private insurance policy when the analysis assumes no new
insurance programs. Estimates are restricted to adults who survive to age 65. C= cell size too small to be reliable.
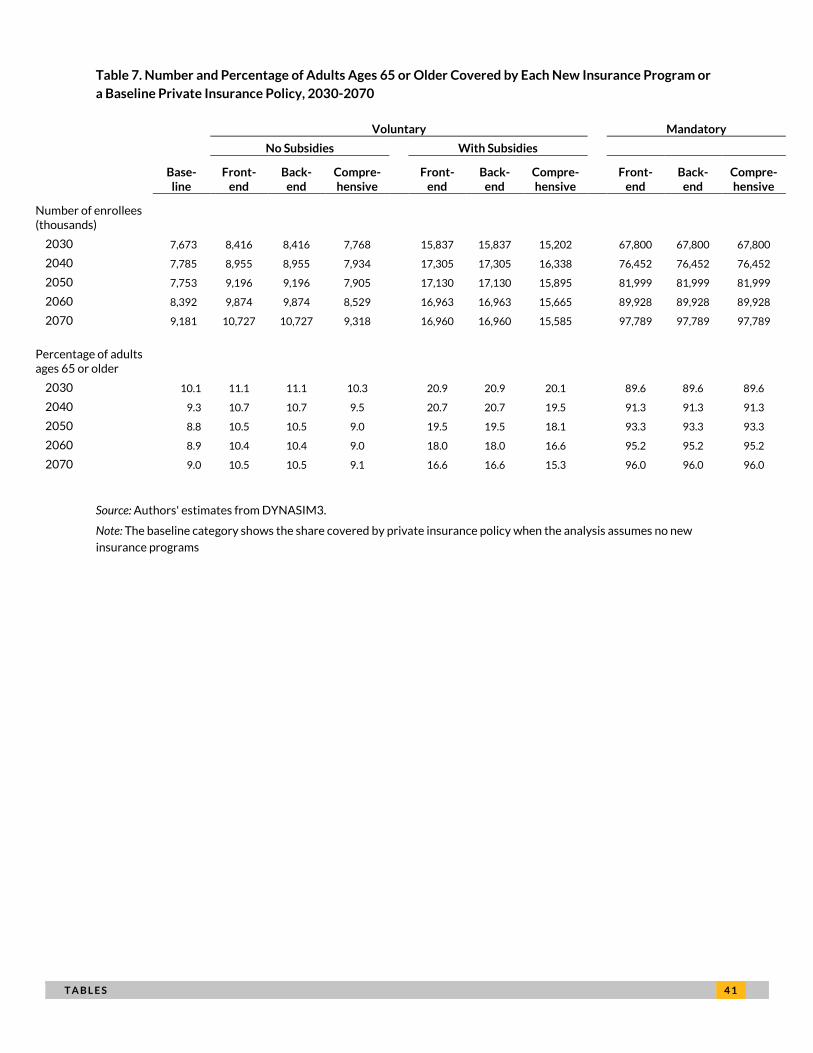
T A B L E S 4 1
Table 7. Number and Percentage of Adults Ages 65 or Older Covered by Each New Insurance Program or
a Baseline Private Insurance Policy, 2030-2070
Voluntary Mandatory
No Subsidies With Subsidies
Base-line
Front-end
Back-end
Compre-hensive
Front-end
Back-end
Compre-hensive
Front-end
Back-end
Compre-hensive
Number of enrollees (thousands)
2030 7,673 8,416 8,416 7,768 15,837 15,837 15,202 67,800 67,800 67,800
2040 7,785 8,955 8,955 7,934 17,305 17,305 16,338 76,452 76,452 76,452
2050 7,753 9,196 9,196 7,905 17,130 17,130 15,895 81,999 81,999 81,999
2060 8,392 9,874 9,874 8,529 16,963 16,963 15,665 89,928 89,928 89,928
2070 9,181 10,727 10,727 9,318 16,960 16,960 15,585 97,789 97,789 97,789
Percentage of adults ages 65 or older
2030 10.1 11.1 11.1 10.3 20.9 20.9 20.1 89.6 89.6 89.6
2040 9.3 10.7 10.7 9.5 20.7 20.7 19.5 91.3 91.3 91.3
2050 8.8 10.5 10.5 9.0 19.5 19.5 18.1 93.3 93.3 93.3
2060 8.9 10.4 10.4 9.0 18.0 18.0 16.6 95.2 95.2 95.2
2070 9.0 10.5 10.5 9.1 16.6 16.6 15.3 96.0 96.0 96.0
Source: Authors' estimates from DYNASIM3.
Note: The baseline category shows the share covered by private insurance policy when the analysis assumes no new
insurance programs
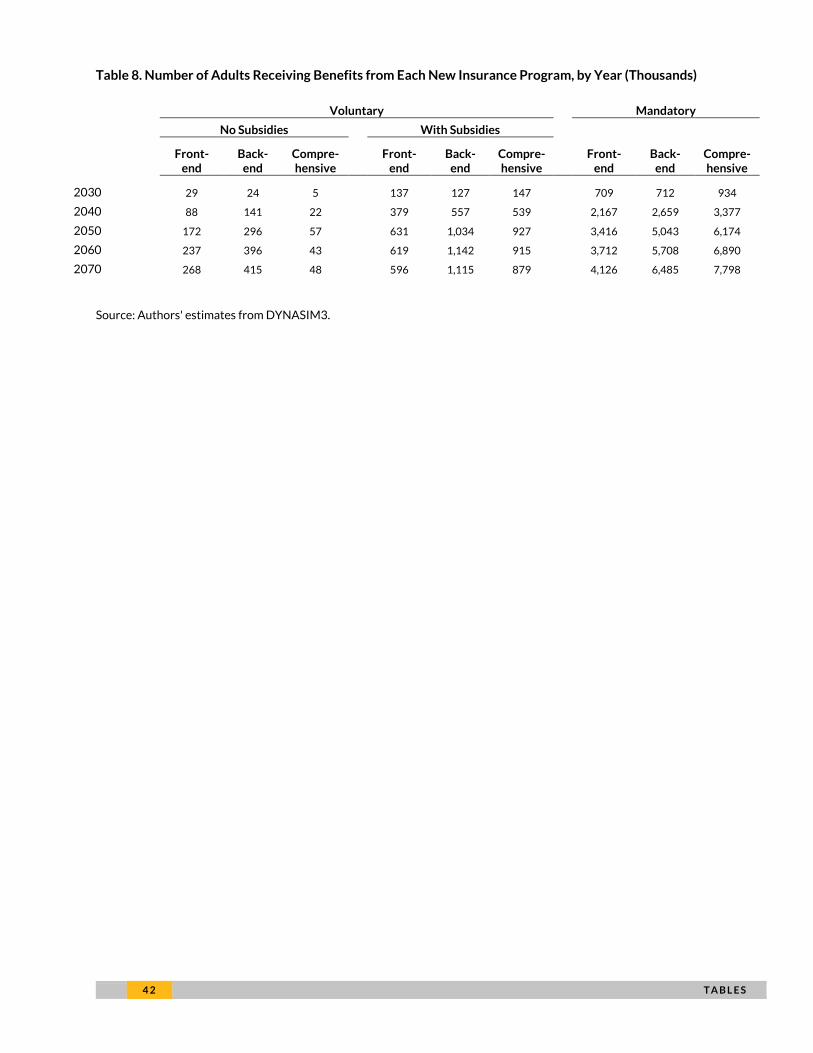
4 2 T A B L E S
Table 8. Number of Adults Receiving Benefits from Each New Insurance Program, by Year (Thousands)
Voluntary Mandatory
No Subsidies With Subsidies
Front-end
Back-end
Compre-hensive
Front-end
Back-end
Compre-hensive
Front-end
Back-end
Compre-hensive
2030 29 24 5 137 127 147 709 712 934
2040 88 141 22 379 557 539 2,167 2,659 3,377
2050 172 296 57 631 1,034 927 3,416 5,043 6,174
2060 237 396 43 619 1,142 915 3,712 5,708 6,890
2070 268 415 48 596 1,115 879 4,126 6,485 7,798
Source: Authors' estimates from DYNASIM3.
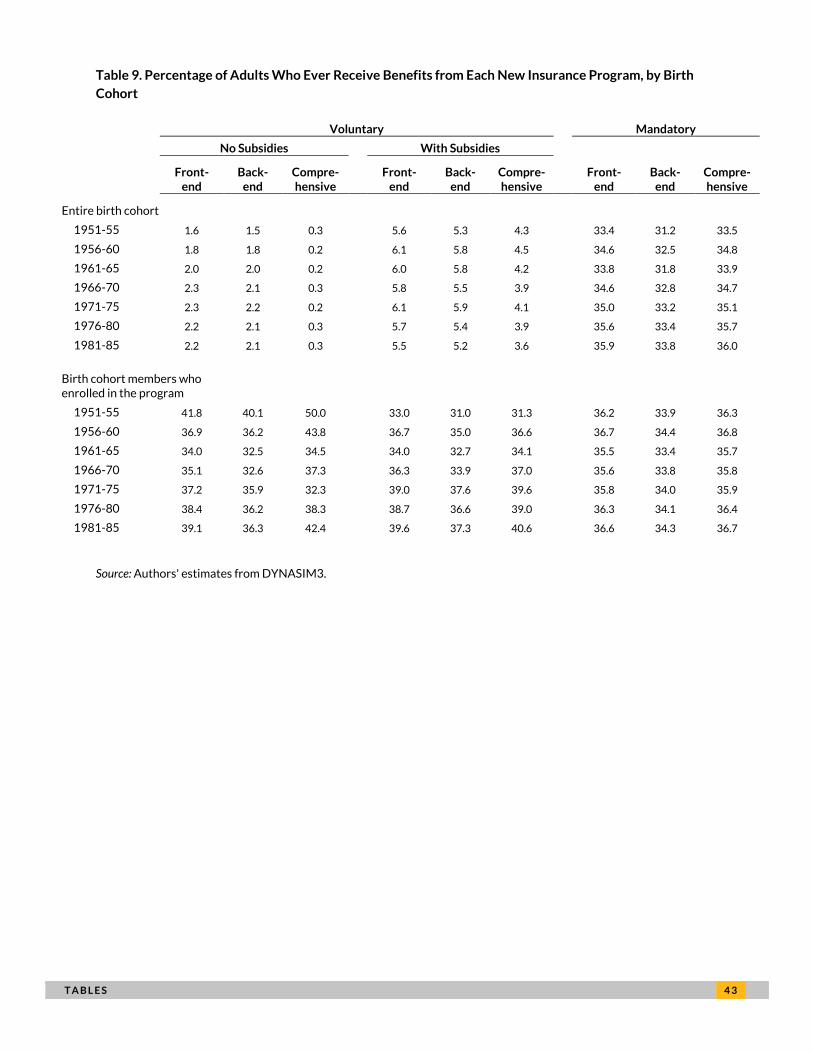
T A B L E S 4 3
Table 9. Percentage of Adults Who Ever Receive Benefits from Each New Insurance Program, by Birth
Cohort
Voluntary Mandatory
No Subsidies With Subsidies
Front-end
Back-end
Compre-hensive
Front-end
Back-end
Compre-hensive
Front-end
Back-end
Compre-hensive
Entire birth cohort
1951-55 1.6 1.5 0.3 5.6 5.3 4.3 33.4 31.2 33.5
1956-60 1.8 1.8 0.2 6.1 5.8 4.5 34.6 32.5 34.8
1961-65 2.0 2.0 0.2 6.0 5.8 4.2 33.8 31.8 33.9
1966-70 2.3 2.1 0.3 5.8 5.5 3.9 34.6 32.8 34.7
1971-75 2.3 2.2 0.2 6.1 5.9 4.1 35.0 33.2 35.1
1976-80 2.2 2.1 0.3 5.7 5.4 3.9 35.6 33.4 35.7
1981-85 2.2 2.1 0.3 5.5 5.2 3.6 35.9 33.8 36.0
Birth cohort members who enrolled in the program
1951-55 41.8 40.1 50.0 33.0 31.0 31.3 36.2 33.9 36.3
1956-60 36.9 36.2 43.8 36.7 35.0 36.6 36.7 34.4 36.8
1961-65 34.0 32.5 34.5 34.0 32.7 34.1 35.5 33.4 35.7
1966-70 35.1 32.6 37.3 36.3 33.9 37.0 35.6 33.8 35.8
1971-75 37.2 35.9 32.3 39.0 37.6 39.6 35.8 34.0 35.9
1976-80 38.4 36.2 38.3 38.7 36.6 39.0 36.3 34.1 36.4
1981-85 39.1 36.3 42.4 39.6 37.3 40.6 36.6 34.3 36.7
Source: Authors' estimates from DYNASIM3.
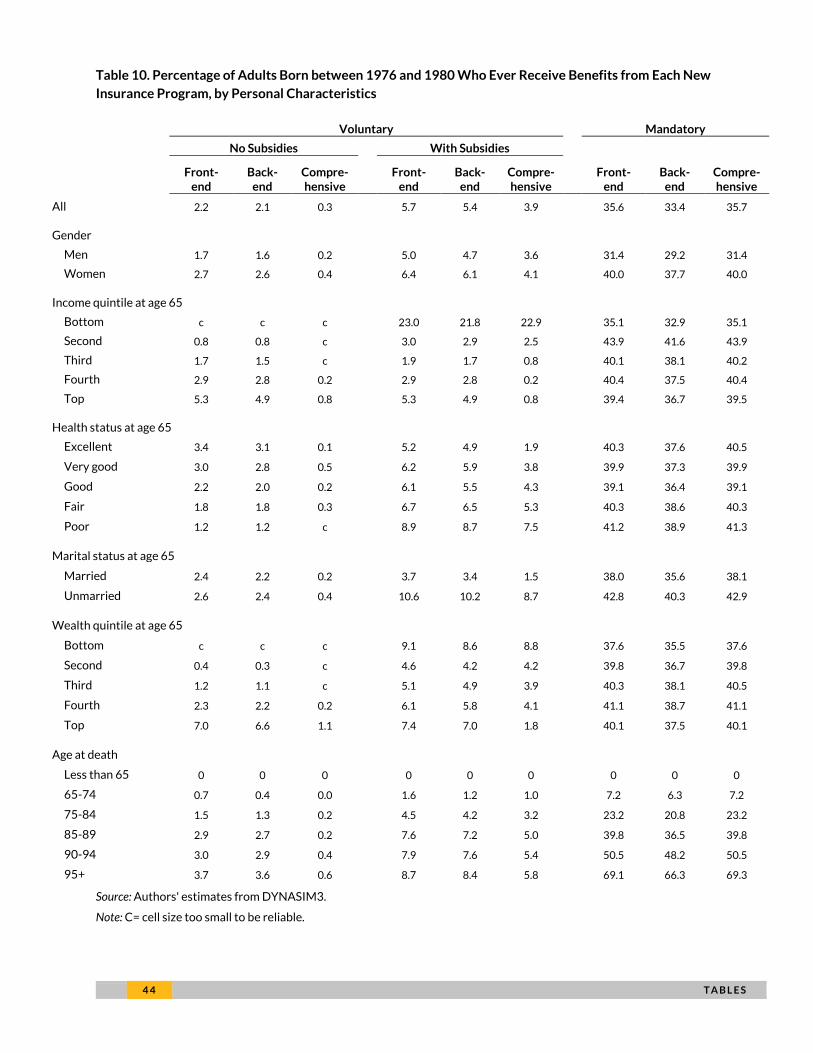
4 4 T A B L E S
Table 10. Percentage of Adults Born between 1976 and 1980 Who Ever Receive Benefits from Each New
Insurance Program, by Personal Characteristics
Voluntary Mandatory
No Subsidies With Subsidies
Front-end
Back-end
Compre-hensive
Front-end
Back-end
Compre-hensive
Front-end
Back-end
Compre-hensive
All 2.2 2.1 0.3 5.7 5.4 3.9 35.6 33.4 35.7
Gender
Men 1.7 1.6 0.2 5.0 4.7 3.6 31.4 29.2 31.4
Women 2.7 2.6 0.4 6.4 6.1 4.1 40.0 37.7 40.0
Income quintile at age 65
Bottom c c c 23.0 21.8 22.9 35.1 32.9 35.1
Second 0.8 0.8 c 3.0 2.9 2.5 43.9 41.6 43.9
Third 1.7 1.5 c 1.9 1.7 0.8 40.1 38.1 40.2
Fourth 2.9 2.8 0.2 2.9 2.8 0.2 40.4 37.5 40.4
Top 5.3 4.9 0.8 5.3 4.9 0.8 39.4 36.7 39.5
Health status at age 65
Excellent 3.4 3.1 0.1 5.2 4.9 1.9 40.3 37.6 40.5
Very good 3.0 2.8 0.5 6.2 5.9 3.8 39.9 37.3 39.9
Good 2.2 2.0 0.2 6.1 5.5 4.3 39.1 36.4 39.1
Fair 1.8 1.8 0.3 6.7 6.5 5.3 40.3 38.6 40.3
Poor 1.2 1.2 c 8.9 8.7 7.5 41.2 38.9 41.3
Marital status at age 65
Married 2.4 2.2 0.2 3.7 3.4 1.5 38.0 35.6 38.1
Unmarried 2.6 2.4 0.4 10.6 10.2 8.7 42.8 40.3 42.9
Wealth quintile at age 65
Bottom c c c 9.1 8.6 8.8 37.6 35.5 37.6
Second 0.4 0.3 c 4.6 4.2 4.2 39.8 36.7 39.8
Third 1.2 1.1 c 5.1 4.9 3.9 40.3 38.1 40.5
Fourth 2.3 2.2 0.2 6.1 5.8 4.1 41.1 38.7 41.1
Top 7.0 6.6 1.1 7.4 7.0 1.8 40.1 37.5 40.1
Age at death
Less than 65 0 0 0 0 0 0 0 0 0
65-74 0.7 0.4 0.0 1.6 1.2 1.0 7.2 6.3 7.2
75-84 1.5 1.3 0.2 4.5 4.2 3.2 23.2 20.8 23.2
85-89 2.9 2.7 0.2 7.6 7.2 5.0 39.8 36.5 39.8
90-94 3.0 2.9 0.4 7.9 7.6 5.4 50.5 48.2 50.5
95+ 3.7 3.6 0.6 8.7 8.4 5.8 69.1 66.3 69.3
Source: Authors' estimates from DYNASIM3.
Note: C= cell size too small to be reliable.
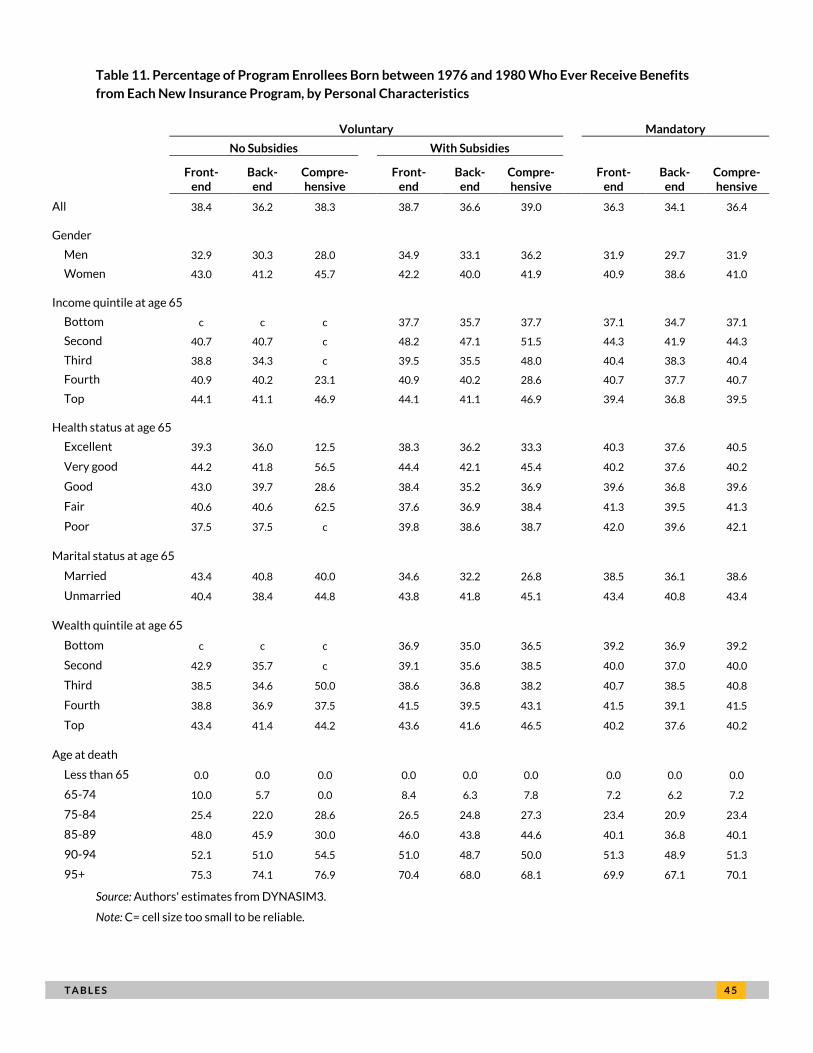
T A B L E S 4 5
Table 11. Percentage of Program Enrollees Born between 1976 and 1980 Who Ever Receive Benefits
from Each New Insurance Program, by Personal Characteristics
Voluntary Mandatory
No Subsidies With Subsidies
Front-end
Back-end
Compre-hensive
Front-end
Back-end
Compre-hensive
Front-end
Back-end
Compre-hensive
All 38.4 36.2 38.3 38.7 36.6 39.0 36.3 34.1 36.4
Gender
Men 32.9 30.3 28.0 34.9 33.1 36.2 31.9 29.7 31.9
Women 43.0 41.2 45.7 42.2 40.0 41.9 40.9 38.6 41.0
Income quintile at age 65
Bottom c c c 37.7 35.7 37.7 37.1 34.7 37.1
Second 40.7 40.7 c 48.2 47.1 51.5 44.3 41.9 44.3
Third 38.8 34.3 c 39.5 35.5 48.0 40.4 38.3 40.4
Fourth 40.9 40.2 23.1 40.9 40.2 28.6 40.7 37.7 40.7
Top 44.1 41.1 46.9 44.1 41.1 46.9 39.4 36.8 39.5
Health status at age 65
Excellent 39.3 36.0 12.5 38.3 36.2 33.3 40.3 37.6 40.5
Very good 44.2 41.8 56.5 44.4 42.1 45.4 40.2 37.6 40.2
Good 43.0 39.7 28.6 38.4 35.2 36.9 39.6 36.8 39.6
Fair 40.6 40.6 62.5 37.6 36.9 38.4 41.3 39.5 41.3
Poor 37.5 37.5 c 39.8 38.6 38.7 42.0 39.6 42.1
Marital status at age 65
Married 43.4 40.8 40.0 34.6 32.2 26.8 38.5 36.1 38.6
Unmarried 40.4 38.4 44.8 43.8 41.8 45.1 43.4 40.8 43.4
Wealth quintile at age 65
Bottom c c c 36.9 35.0 36.5 39.2 36.9 39.2
Second 42.9 35.7 c 39.1 35.6 38.5 40.0 37.0 40.0
Third 38.5 34.6 50.0 38.6 36.8 38.2 40.7 38.5 40.8
Fourth 38.8 36.9 37.5 41.5 39.5 43.1 41.5 39.1 41.5
Top 43.4 41.4 44.2 43.6 41.6 46.5 40.2 37.6 40.2
Age at death
Less than 65 0.0 0.0 0.0 0.0 0.0 0.0 0.0 0.0 0.0
65-74 10.0 5.7 0.0 8.4 6.3 7.8 7.2 6.2 7.2
75-84 25.4 22.0 28.6 26.5 24.8 27.3 23.4 20.9 23.4
85-89 48.0 45.9 30.0 46.0 43.8 44.6 40.1 36.8 40.1
90-94 52.1 51.0 54.5 51.0 48.7 50.0 51.3 48.9 51.3
95+ 75.3 74.1 76.9 70.4 68.0 68.1 69.9 67.1 70.1
Source: Authors' estimates from DYNASIM3.
Note: C= cell size too small to be reliable.
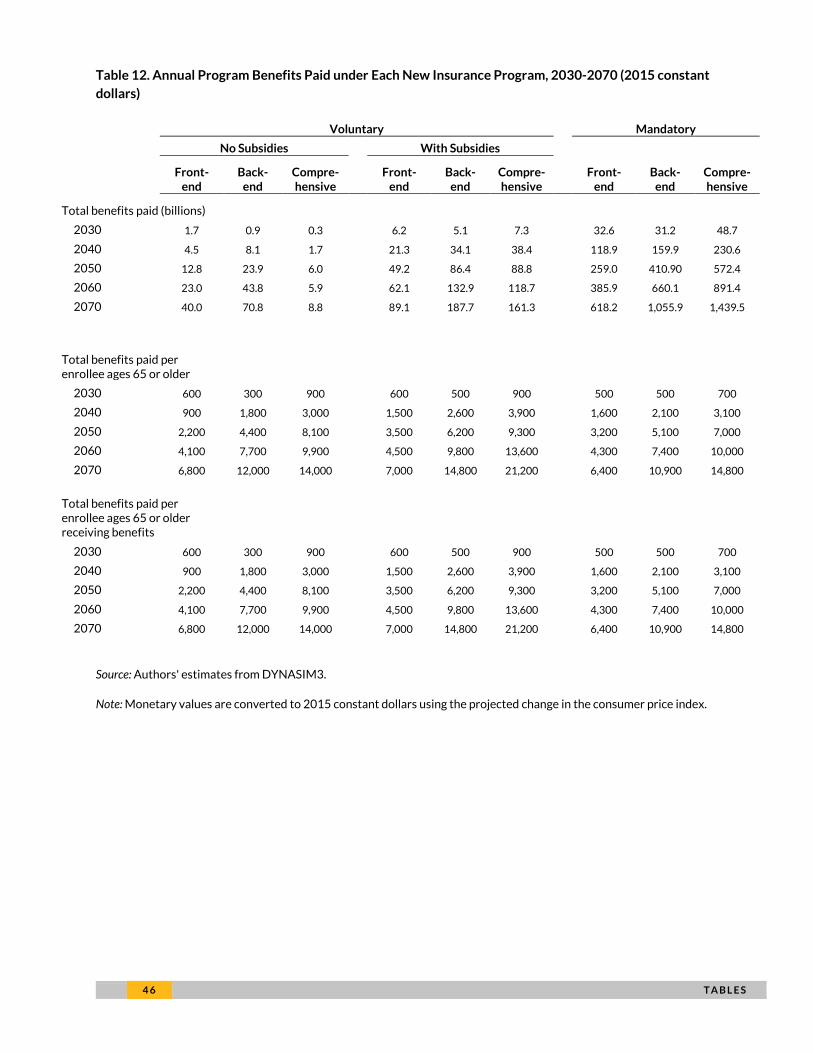
4 6 T A B L E S
Table 12. Annual Program Benefits Paid under Each New Insurance Program, 2030-2070 (2015 constant
dollars)
Voluntary Mandatory
No Subsidies With Subsidies
Front-end
Back-end
Compre-hensive
Front-end
Back-end
Compre-hensive
Front-end
Back-end
Compre-hensive
Total benefits paid (billions)
2030 1.7 0.9 0.3 6.2 5.1 7.3 32.6 31.2 48.7
2040 4.5 8.1 1.7 21.3 34.1 38.4 118.9 159.9 230.6
2050 12.8 23.9 6.0 49.2 86.4 88.8 259.0 410.90 572.4
2060 23.0 43.8 5.9 62.1 132.9 118.7 385.9 660.1 891.4
2070 40.0 70.8 8.8 89.1 187.7 161.3 618.2 1,055.9 1,439.5
Total benefits paid per enrollee ages 65 or older
2030 600 300 900 600 500 900 500 500 700
2040 900 1,800 3,000 1,500 2,600 3,900 1,600 2,100 3,100
2050 2,200 4,400 8,100 3,500 6,200 9,300 3,200 5,100 7,000
2060 4,100 7,700 9,900 4,500 9,800 13,600 4,300 7,400 10,000
2070 6,800 12,000 14,000 7,000 14,800 21,200 6,400 10,900 14,800
Total benefits paid per enrollee ages 65 or older receiving benefits
2030 600 300 900 600 500 900 500 500 700
2040 900 1,800 3,000 1,500 2,600 3,900 1,600 2,100 3,100
2050 2,200 4,400 8,100 3,500 6,200 9,300 3,200 5,100 7,000
2060 4,100 7,700 9,900 4,500 9,800 13,600 4,300 7,400 10,000
2070 6,800 12,000 14,000 7,000 14,800 21,200 6,400 10,900 14,800
Source: Authors' estimates from DYNASIM3.
Note: Monetary values are converted to 2015 constant dollars using the projected change in the consumer price index.
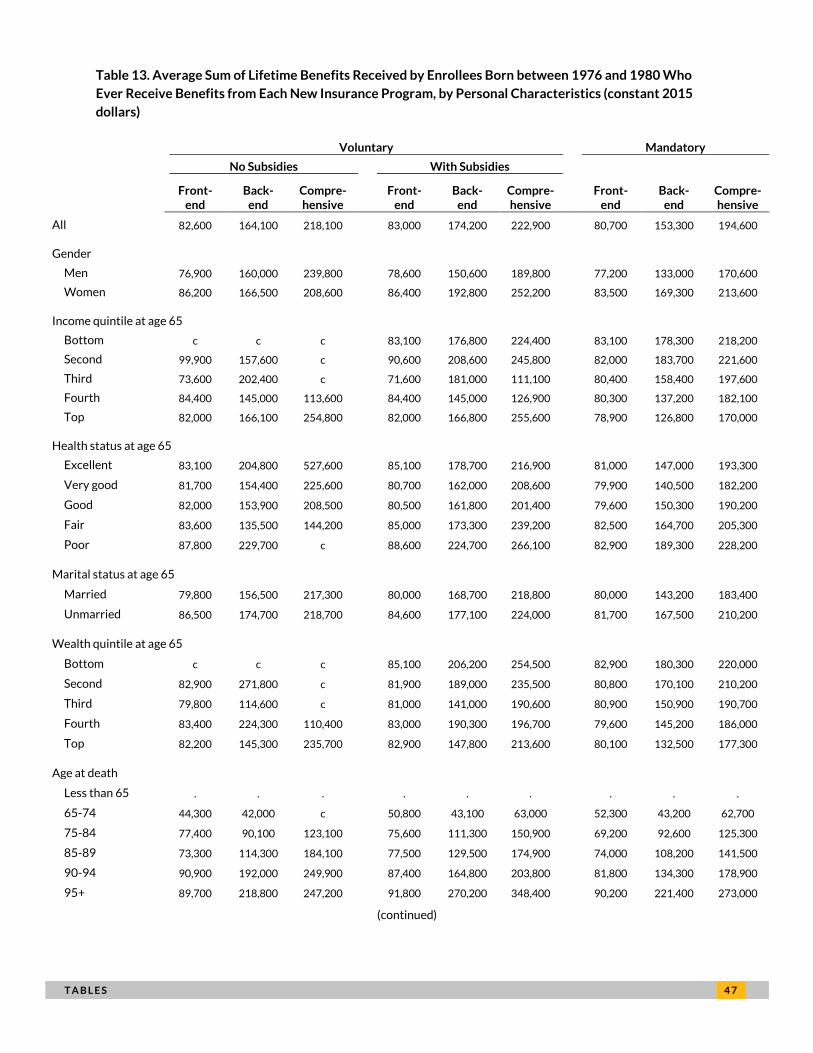
T A B L E S 4 7
Table 13. Average Sum of Lifetime Benefits Received by Enrollees Born between 1976 and 1980 Who
Ever Receive Benefits from Each New Insurance Program, by Personal Characteristics (constant 2015
dollars)
Voluntary Mandatory
No Subsidies With Subsidies
Front-end
Back-end
Compre-hensive
Front-end
Back-end
Compre-hensive
Front-end
Back-end
Compre-hensive
All 82,600 164,100 218,100 83,000 174,200 222,900 80,700 153,300 194,600
Gender
Men 76,900 160,000 239,800 78,600 150,600 189,800 77,200 133,000 170,600
Women 86,200 166,500 208,600 86,400 192,800 252,200 83,500 169,300 213,600
Income quintile at age 65
Bottom c c c 83,100 176,800 224,400 83,100 178,300 218,200
Second 99,900 157,600 c 90,600 208,600 245,800 82,000 183,700 221,600
Third 73,600 202,400 c 71,600 181,000 111,100 80,400 158,400 197,600
Fourth 84,400 145,000 113,600 84,400 145,000 126,900 80,300 137,200 182,100
Top 82,000 166,100 254,800 82,000 166,800 255,600 78,900 126,800 170,000
Health status at age 65
Excellent 83,100 204,800 527,600 85,100 178,700 216,900 81,000 147,000 193,300
Very good 81,700 154,400 225,600 80,700 162,000 208,600 79,900 140,500 182,200
Good 82,000 153,900 208,500 80,500 161,800 201,400 79,600 150,300 190,200
Fair 83,600 135,500 144,200 85,000 173,300 239,200 82,500 164,700 205,300
Poor 87,800 229,700 c 88,600 224,700 266,100 82,900 189,300 228,200
Marital status at age 65
Married 79,800 156,500 217,300 80,000 168,700 218,800 80,000 143,200 183,400
Unmarried 86,500 174,700 218,700 84,600 177,100 224,000 81,700 167,500 210,200
Wealth quintile at age 65
Bottom c c c 85,100 206,200 254,500 82,900 180,300 220,000
Second 82,900 271,800 c 81,900 189,000 235,500 80,800 170,100 210,200
Third 79,800 114,600 c 81,000 141,000 190,600 80,900 150,900 190,700
Fourth 83,400 224,300 110,400 83,000 190,300 196,700 79,600 145,200 186,000
Top 82,200 145,300 235,700 82,900 147,800 213,600 80,100 132,500 177,300
Age at death
Less than 65 . . . . . . . . .
65-74 44,300 42,000 c 50,800 43,100 63,000 52,300 43,200 62,700
75-84 77,400 90,100 123,100 75,600 111,300 150,900 69,200 92,600 125,300
85-89 73,300 114,300 184,100 77,500 129,500 174,900 74,000 108,200 141,500
90-94 90,900 192,000 249,900 87,400 164,800 203,800 81,800 134,300 178,900
95+ 89,700 218,800 247,200 91,800 270,200 348,400 90,200 221,400 273,000
(continued)

4 8 T A B L E S
Source: Authors' estimates from DYNASIM3.
Note: The table reports average total value of total LTSS expenditures, summed from age 65 until death. Expenditures
are not adjusted for time of receipt. Monetary values are converted to 2015 constant dollars using the projected change
in the consumer price index. c=cell size too small to be estimated reliably.
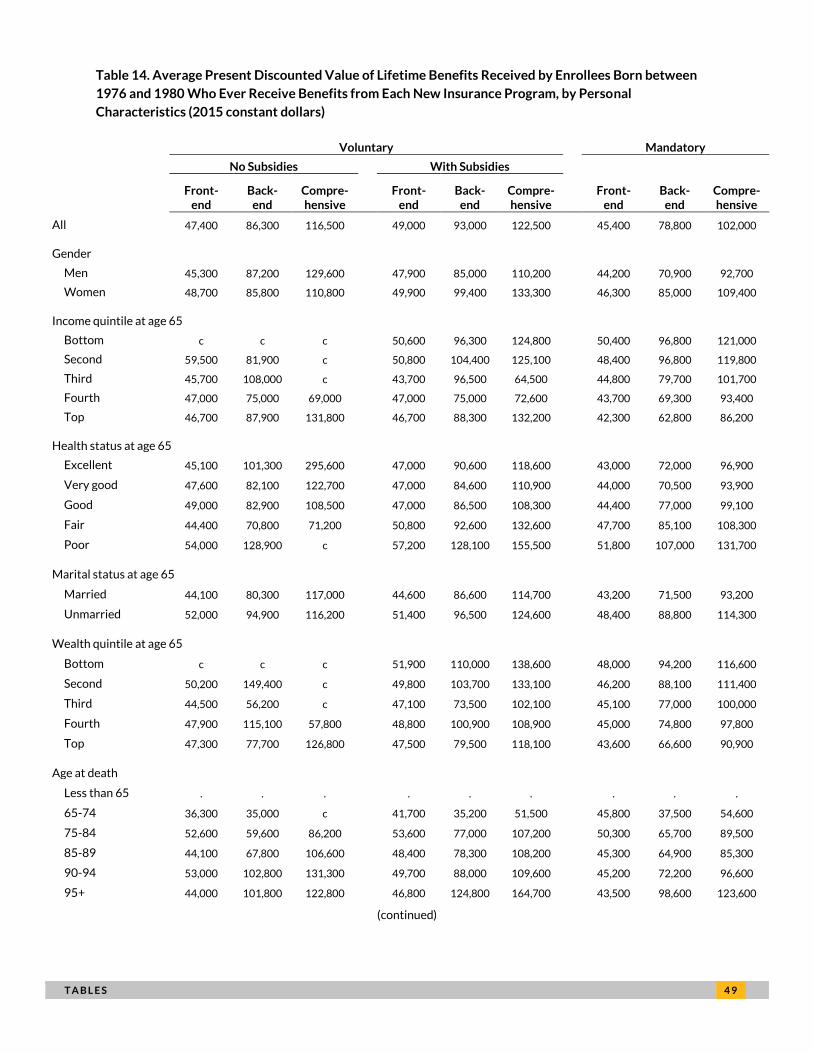
T A B L E S 4 9
Table 14. Average Present Discounted Value of Lifetime Benefits Received by Enrollees Born between
1976 and 1980 Who Ever Receive Benefits from Each New Insurance Program, by Personal
Characteristics (2015 constant dollars)
Voluntary Mandatory
No Subsidies With Subsidies
Front-end
Back-end
Compre-hensive
Front-end
Back-end
Compre-hensive
Front-end
Back-end
Compre-hensive
All 47,400 86,300 116,500 49,000 93,000 122,500 45,400 78,800 102,000
Gender
Men 45,300 87,200 129,600 47,900 85,000 110,200 44,200 70,900 92,700
Women 48,700 85,800 110,800 49,900 99,400 133,300 46,300 85,000 109,400
Income quintile at age 65
Bottom c c c 50,600 96,300 124,800 50,400 96,800 121,000
Second 59,500 81,900 c 50,800 104,400 125,100 48,400 96,800 119,800
Third 45,700 108,000 c 43,700 96,500 64,500 44,800 79,700 101,700
Fourth 47,000 75,000 69,000 47,000 75,000 72,600 43,700 69,300 93,400
Top 46,700 87,900 131,800 46,700 88,300 132,200 42,300 62,800 86,200
Health status at age 65
Excellent 45,100 101,300 295,600 47,000 90,600 118,600 43,000 72,000 96,900
Very good 47,600 82,100 122,700 47,000 84,600 110,900 44,000 70,500 93,900
Good 49,000 82,900 108,500 47,000 86,500 108,300 44,400 77,000 99,100
Fair 44,400 70,800 71,200 50,800 92,600 132,600 47,700 85,100 108,300
Poor 54,000 128,900 c 57,200 128,100 155,500 51,800 107,000 131,700
Marital status at age 65
Married 44,100 80,300 117,000 44,600 86,600 114,700 43,200 71,500 93,200
Unmarried 52,000 94,900 116,200 51,400 96,500 124,600 48,400 88,800 114,300
Wealth quintile at age 65
Bottom c c c 51,900 110,000 138,600 48,000 94,200 116,600
Second 50,200 149,400 c 49,800 103,700 133,100 46,200 88,100 111,400
Third 44,500 56,200 c 47,100 73,500 102,100 45,100 77,000 100,000
Fourth 47,900 115,100 57,800 48,800 100,900 108,900 45,000 74,800 97,800
Top 47,300 77,700 126,800 47,500 79,500 118,100 43,600 66,600 90,900
Age at death
Less than 65 . . . . . . . . .
65-74 36,300 35,000 c 41,700 35,200 51,500 45,800 37,500 54,600
75-84 52,600 59,600 86,200 53,600 77,000 107,200 50,300 65,700 89,500
85-89 44,100 67,800 106,600 48,400 78,300 108,200 45,300 64,900 85,300
90-94 53,000 102,800 131,300 49,700 88,000 109,600 45,200 72,200 96,600
95+ 44,000 101,800 122,800 46,800 124,800 164,700 43,500 98,600 123,600
(continued)

5 0 T A B L E S
Source: Authors' estimates from DYNASIM3.
Note: The table reports average total value of total LTSS expenditures from age 65 until death, discounted to age 65
using a real discount rate of 2.9 percent. Monetary values are converted to 2015 constant dollars using the projected
change in the consumer price index. c=cell size too small to be reliable.
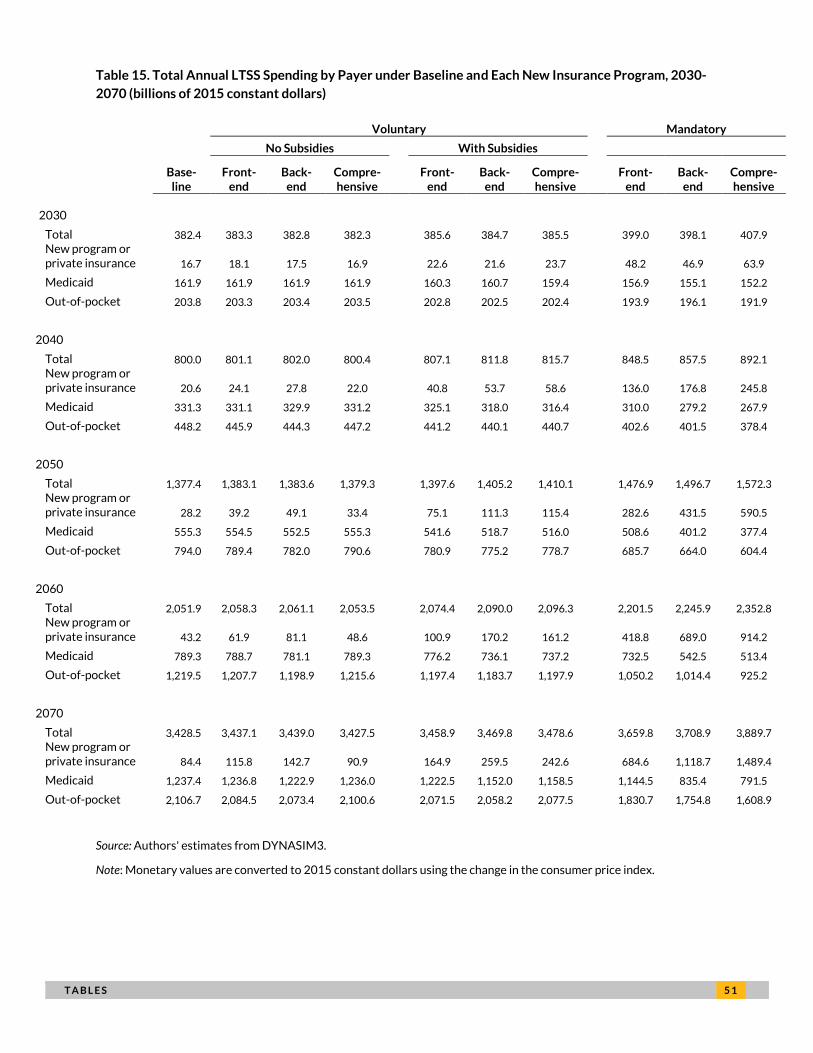
T A B L E S 5 1
Table 15. Total Annual LTSS Spending by Payer under Baseline and Each New Insurance Program, 2030-
2070 (billions of 2015 constant dollars)
Voluntary Mandatory
No Subsidies With Subsidies
Base-line
Front-end
Back-end
Compre-hensive
Front-end
Back-end
Compre-hensive
Front-end
Back-end
Compre-hensive
2030
Total 382.4 383.3 382.8 382.3 385.6 384.7 385.5 399.0 398.1 407.9 New program or private insurance 16.7 18.1 17.5 16.9 22.6 21.6 23.7 48.2 46.9 63.9
Medicaid 161.9 161.9 161.9 161.9 160.3 160.7 159.4 156.9 155.1 152.2
Out-of-pocket 203.8 203.3 203.4 203.5 202.8 202.5 202.4 193.9 196.1 191.9
2040
Total 800.0 801.1 802.0 800.4 807.1 811.8 815.7 848.5 857.5 892.1 New program or private insurance 20.6 24.1 27.8 22.0 40.8 53.7 58.6 136.0 176.8 245.8
Medicaid 331.3 331.1 329.9 331.2 325.1 318.0 316.4 310.0 279.2 267.9
Out-of-pocket 448.2 445.9 444.3 447.2 441.2 440.1 440.7 402.6 401.5 378.4
2050
Total 1,377.4 1,383.1 1,383.6 1,379.3 1,397.6 1,405.2 1,410.1 1,476.9 1,496.7 1,572.3 New program or private insurance 28.2 39.2 49.1 33.4 75.1 111.3 115.4 282.6 431.5 590.5
Medicaid 555.3 554.5 552.5 555.3 541.6 518.7 516.0 508.6 401.2 377.4
Out-of-pocket 794.0 789.4 782.0 790.6 780.9 775.2 778.7 685.7 664.0 604.4
2060
Total 2,051.9 2,058.3 2,061.1 2,053.5 2,074.4 2,090.0 2,096.3 2,201.5 2,245.9 2,352.8 New program or private insurance 43.2 61.9 81.1 48.6 100.9 170.2 161.2 418.8 689.0 914.2
Medicaid 789.3 788.7 781.1 789.3 776.2 736.1 737.2 732.5 542.5 513.4
Out-of-pocket 1,219.5 1,207.7 1,198.9 1,215.6 1,197.4 1,183.7 1,197.9 1,050.2 1,014.4 925.2
2070
Total 3,428.5 3,437.1 3,439.0 3,427.5 3,458.9 3,469.8 3,478.6 3,659.8 3,708.9 3,889.7 New program or private insurance 84.4 115.8 142.7 90.9 164.9 259.5 242.6 684.6 1,118.7 1,489.4
Medicaid 1,237.4 1,236.8 1,222.9 1,236.0 1,222.5 1,152.0 1,158.5 1,144.5 835.4 791.5
Out-of-pocket 2,106.7 2,084.5 2,073.4 2,100.6 2,071.5 2,058.2 2,077.5 1,830.7 1,754.8 1,608.9
Source: Authors' estimates from DYNASIM3.
Note: Monetary values are converted to 2015 constant dollars using the change in the consumer price index.
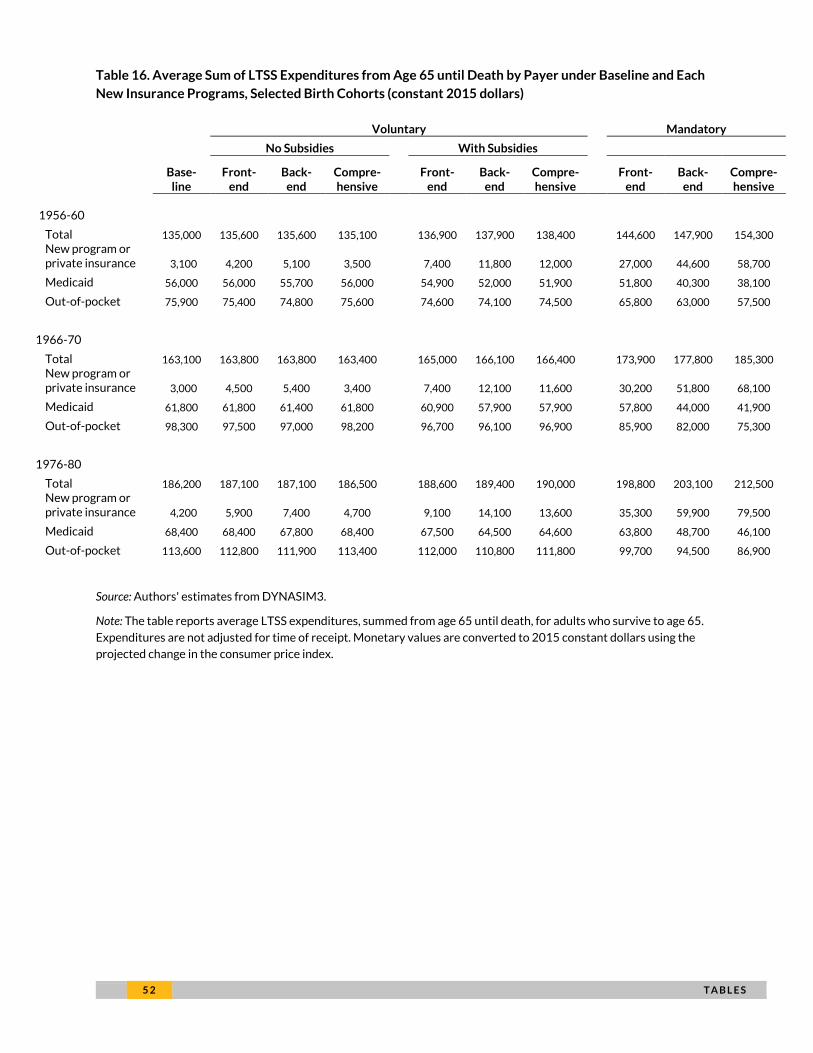
5 2 T A B L E S
Table 16. Average Sum of LTSS Expenditures from Age 65 until Death by Payer under Baseline and Each
New Insurance Programs, Selected Birth Cohorts (constant 2015 dollars)
Voluntary Mandatory
No Subsidies With Subsidies
Base-line
Front-end
Back-end
Compre-hensive
Front-end
Back-end
Compre-hensive
Front-end
Back-end
Compre-hensive
1956-60
Total 135,000 135,600 135,600 135,100 136,900 137,900 138,400 144,600 147,900 154,300 New program or private insurance 3,100 4,200 5,100 3,500 7,400 11,800 12,000 27,000 44,600 58,700
Medicaid 56,000 56,000 55,700 56,000 54,900 52,000 51,900 51,800 40,300 38,100
Out-of-pocket 75,900 75,400 74,800 75,600 74,600 74,100 74,500 65,800 63,000 57,500
1966-70
Total 163,100 163,800 163,800 163,400 165,000 166,100 166,400 173,900 177,800 185,300 New program or private insurance 3,000 4,500 5,400 3,400 7,400 12,100 11,600 30,200 51,800 68,100
Medicaid 61,800 61,800 61,400 61,800 60,900 57,900 57,900 57,800 44,000 41,900
Out-of-pocket 98,300 97,500 97,000 98,200 96,700 96,100 96,900 85,900 82,000 75,300
1976-80
Total 186,200 187,100 187,100 186,500 188,600 189,400 190,000 198,800 203,100 212,500 New program or private insurance 4,200 5,900 7,400 4,700 9,100 14,100 13,600 35,300 59,900 79,500
Medicaid 68,400 68,400 67,800 68,400 67,500 64,500 64,600 63,800 48,700 46,100
Out-of-pocket 113,600 112,800 111,900 113,400 112,000 110,800 111,800 99,700 94,500 86,900
Source: Authors' estimates from DYNASIM3.
Note: The table reports average LTSS expenditures, summed from age 65 until death, for adults who survive to age 65.
Expenditures are not adjusted for time of receipt. Monetary values are converted to 2015 constant dollars using the
projected change in the consumer price index.
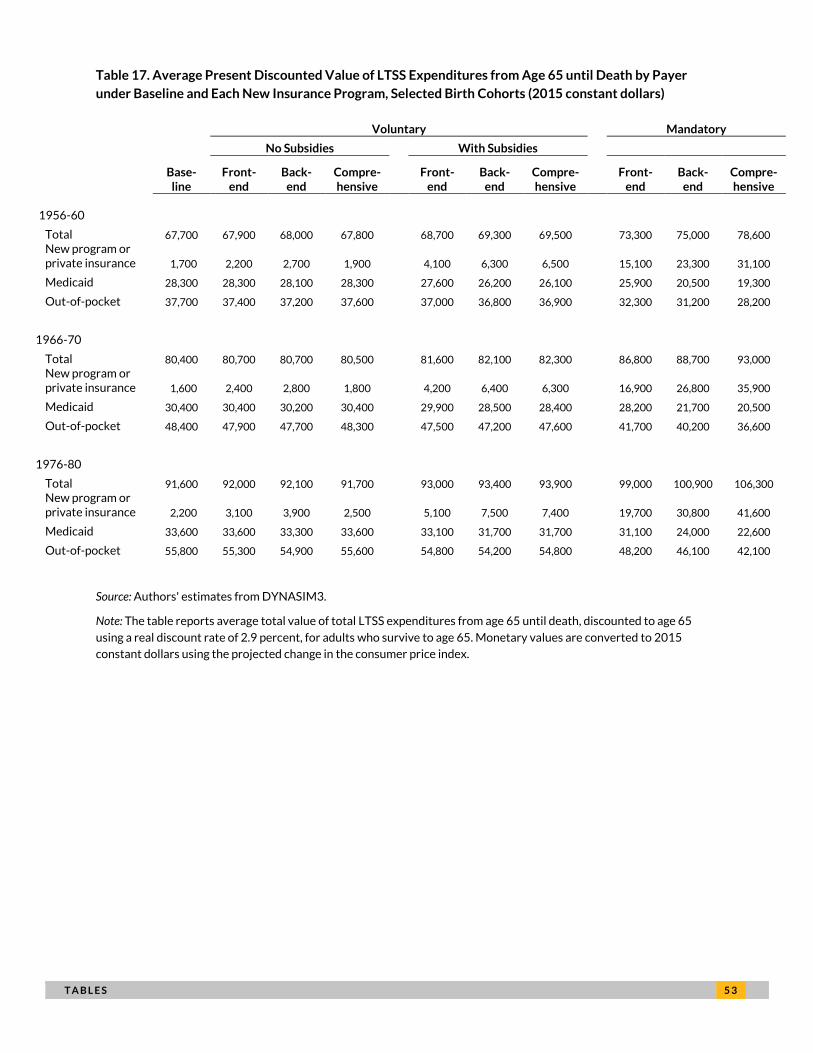
T A B L E S 5 3
Table 17. Average Present Discounted Value of LTSS Expenditures from Age 65 until Death by Payer
under Baseline and Each New Insurance Program, Selected Birth Cohorts (2015 constant dollars)
Voluntary Mandatory
No Subsidies With Subsidies
Base-line
Front-end
Back-end
Compre-hensive
Front-end
Back-end
Compre-hensive
Front-end
Back-end
Compre-hensive
1956-60
Total 67,700 67,900 68,000 67,800 68,700 69,300 69,500 73,300 75,000 78,600 New program or private insurance 1,700 2,200 2,700 1,900 4,100 6,300 6,500 15,100 23,300 31,100
Medicaid 28,300 28,300 28,100 28,300 27,600 26,200 26,100 25,900 20,500 19,300
Out-of-pocket 37,700 37,400 37,200 37,600 37,000 36,800 36,900 32,300 31,200 28,200
1966-70
Total 80,400 80,700 80,700 80,500 81,600 82,100 82,300 86,800 88,700 93,000 New program or private insurance 1,600 2,400 2,800 1,800 4,200 6,400 6,300 16,900 26,800 35,900
Medicaid 30,400 30,400 30,200 30,400 29,900 28,500 28,400 28,200 21,700 20,500
Out-of-pocket 48,400 47,900 47,700 48,300 47,500 47,200 47,600 41,700 40,200 36,600
1976-80
Total 91,600 92,000 92,100 91,700 93,000 93,400 93,900 99,000 100,900 106,300 New program or private insurance 2,200 3,100 3,900 2,500 5,100 7,500 7,400 19,700 30,800 41,600
Medicaid 33,600 33,600 33,300 33,600 33,100 31,700 31,700 31,100 24,000 22,600
Out-of-pocket 55,800 55,300 54,900 55,600 54,800 54,200 54,800 48,200 46,100 42,100
Source: Authors' estimates from DYNASIM3.
Note: The table reports average total value of total LTSS expenditures from age 65 until death, discounted to age 65
using a real discount rate of 2.9 percent, for adults who survive to age 65. Monetary values are converted to 2015
constant dollars using the projected change in the consumer price index.
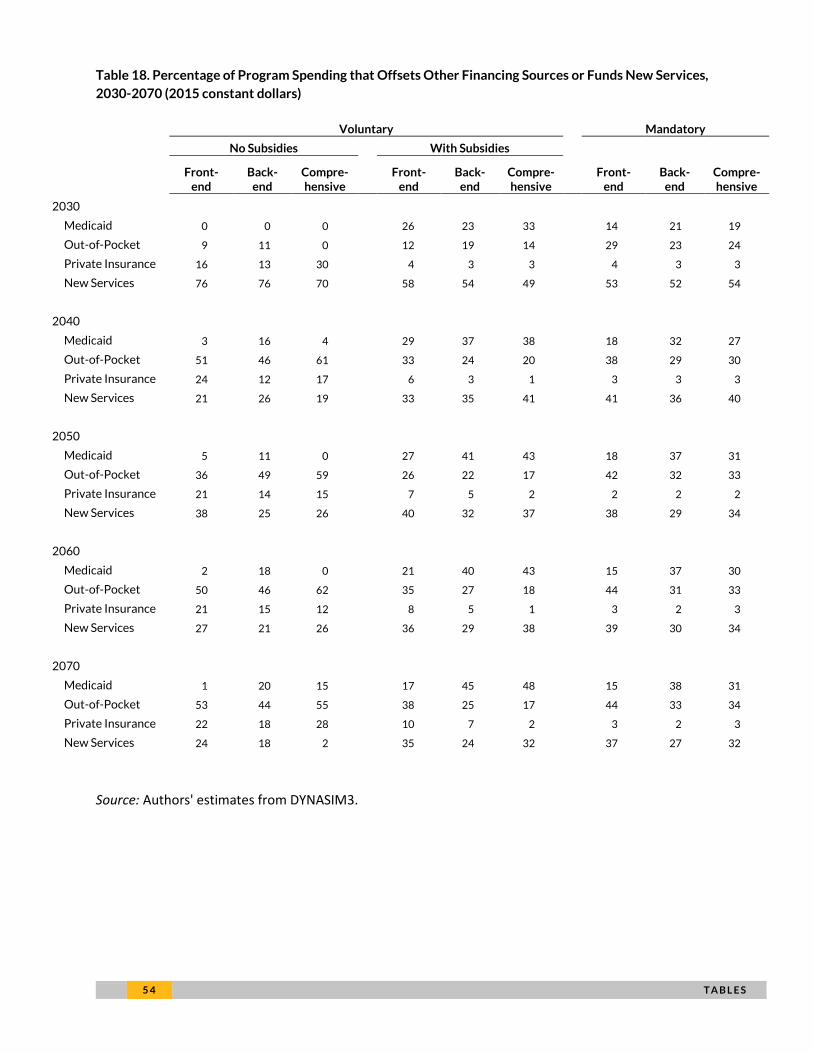
5 4 T A B L E S
Table 18. Percentage of Program Spending that Offsets Other Financing Sources or Funds New Services,
2030-2070 (2015 constant dollars)
Voluntary Mandatory
No Subsidies With Subsidies
Front-end
Back-end
Compre-hensive
Front-end
Back-end
Compre-hensive
Front-end
Back-end
Compre-hensive
2030
Medicaid 0 0 0 26 23 33 14 21 19
Out-of-Pocket 9 11 0 12 19 14 29 23 24
Private Insurance 16 13 30 4 3 3 4 3 3
New Services 76 76 70 58 54 49 53 52 54
2040
Medicaid 3 16 4 29 37 38 18 32 27
Out-of-Pocket 51 46 61 33 24 20 38 29 30
Private Insurance 24 12 17 6 3 1 3 3 3
New Services 21 26 19 33 35 41 41 36 40
2050
Medicaid 5 11 0 27 41 43 18 37 31
Out-of-Pocket 36 49 59 26 22 17 42 32 33
Private Insurance 21 14 15 7 5 2 2 2 2
New Services 38 25 26 40 32 37 38 29 34
2060
Medicaid 2 18 0 21 40 43 15 37 30
Out-of-Pocket 50 46 62 35 27 18 44 31 33
Private Insurance 21 15 12 8 5 1 3 2 3
New Services 27 21 26 36 29 38 39 30 34
2070
Medicaid 1 20 15 17 45 48 15 38 31
Out-of-Pocket 53 44 55 38 25 17 44 33 34
Private Insurance 22 18 28 10 7 2 3 2 3
New Services 24 18 2 35 24 32 37 27 32
Source: Authors' estimates from DYNASIM3.
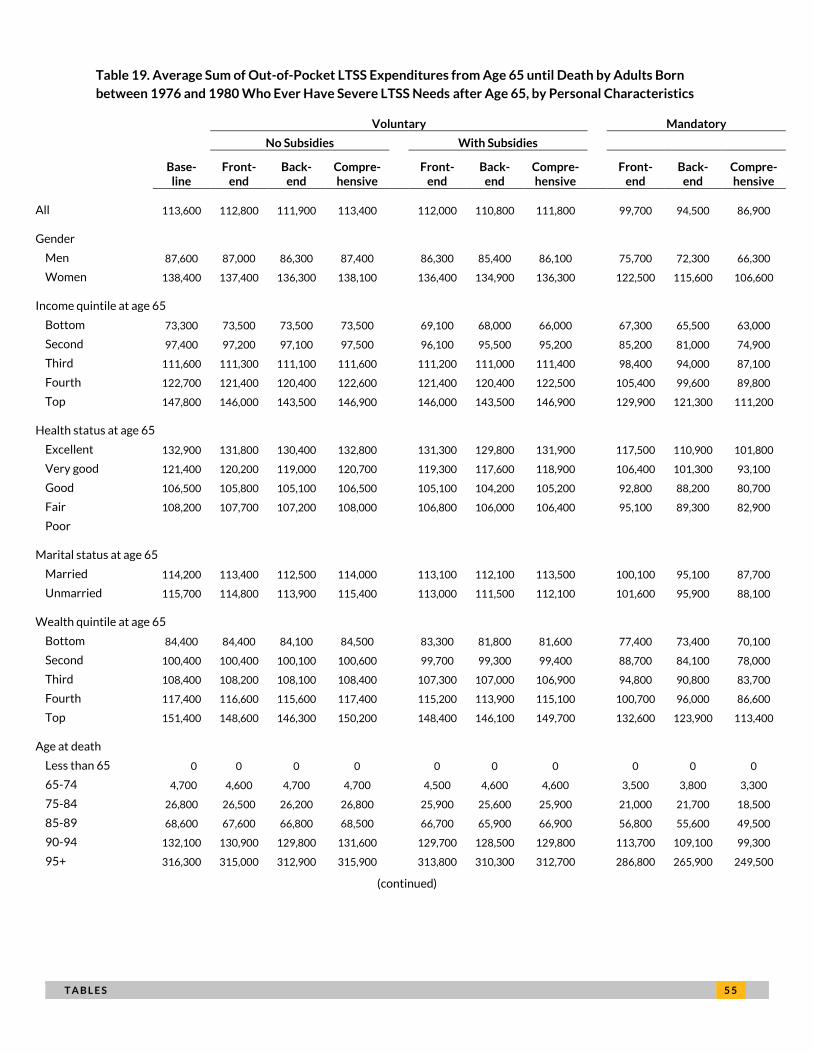
T A B L E S 5 5
Table 19. Average Sum of Out-of-Pocket LTSS Expenditures from Age 65 until Death by Adults Born
between 1976 and 1980 Who Ever Have Severe LTSS Needs after Age 65, by Personal Characteristics
Voluntary Mandatory
No Subsidies With Subsidies
Base-line
Front-end
Back-end
Compre-hensive
Front-end
Back-end
Compre-hensive
Front-end
Back-end
Compre-hensive
All 113,600 112,800 111,900 113,400 112,000 110,800 111,800 99,700 94,500 86,900 Gender
Men 87,600 87,000 86,300 87,400 86,300 85,400 86,100 75,700 72,300 66,300
Women 138,400 137,400 136,300 138,100 136,400 134,900 136,300 122,500 115,600 106,600 Income quintile at age 65
Bottom 73,300 73,500 73,500 73,500 69,100 68,000 66,000 67,300 65,500 63,000
Second 97,400 97,200 97,100 97,500 96,100 95,500 95,200 85,200 81,000 74,900
Third 111,600 111,300 111,100 111,600 111,200 111,000 111,400 98,400 94,000 87,100
Fourth 122,700 121,400 120,400 122,600 121,400 120,400 122,500 105,400 99,600 89,800
Top 147,800 146,000 143,500 146,900 146,000 143,500 146,900 129,900 121,300 111,200 Health status at age 65
Excellent 132,900 131,800 130,400 132,800 131,300 129,800 131,900 117,500 110,900 101,800
Very good 121,400 120,200 119,000 120,700 119,300 117,600 118,900 106,400 101,300 93,100
Good 106,500 105,800 105,100 106,500 105,100 104,200 105,200 92,800 88,200 80,700
Fair 108,200 107,700 107,200 108,000 106,800 106,000 106,400 95,100 89,300 82,900
Poor Marital status at age 65
Married 114,200 113,400 112,500 114,000 113,100 112,100 113,500 100,100 95,100 87,700
Unmarried 115,700 114,800 113,900 115,400 113,000 111,500 112,100 101,600 95,900 88,100 Wealth quintile at age 65
Bottom 84,400 84,400 84,100 84,500 83,300 81,800 81,600 77,400 73,400 70,100
Second 100,400 100,400 100,100 100,600 99,700 99,300 99,400 88,700 84,100 78,000
Third 108,400 108,200 108,100 108,400 107,300 107,000 106,900 94,800 90,800 83,700
Fourth 117,400 116,600 115,600 117,400 115,200 113,900 115,100 100,700 96,000 86,600
Top 151,400 148,600 146,300 150,200 148,400 146,100 149,700 132,600 123,900 113,400 Age at death
Less than 65 0 0 0 0 0 0 0 0 0 0
65-74 4,700 4,600 4,700 4,700 4,500 4,600 4,600 3,500 3,800 3,300
75-84 26,800 26,500 26,200 26,800 25,900 25,600 25,900 21,000 21,700 18,500
85-89 68,600 67,600 66,800 68,500 66,700 65,900 66,900 56,800 55,600 49,500
90-94 132,100 130,900 129,800 131,600 129,700 128,500 129,800 113,700 109,100 99,300
95+ 316,300 315,000 312,900 315,900 313,800 310,300 312,700 286,800 265,900 249,500
(continued)
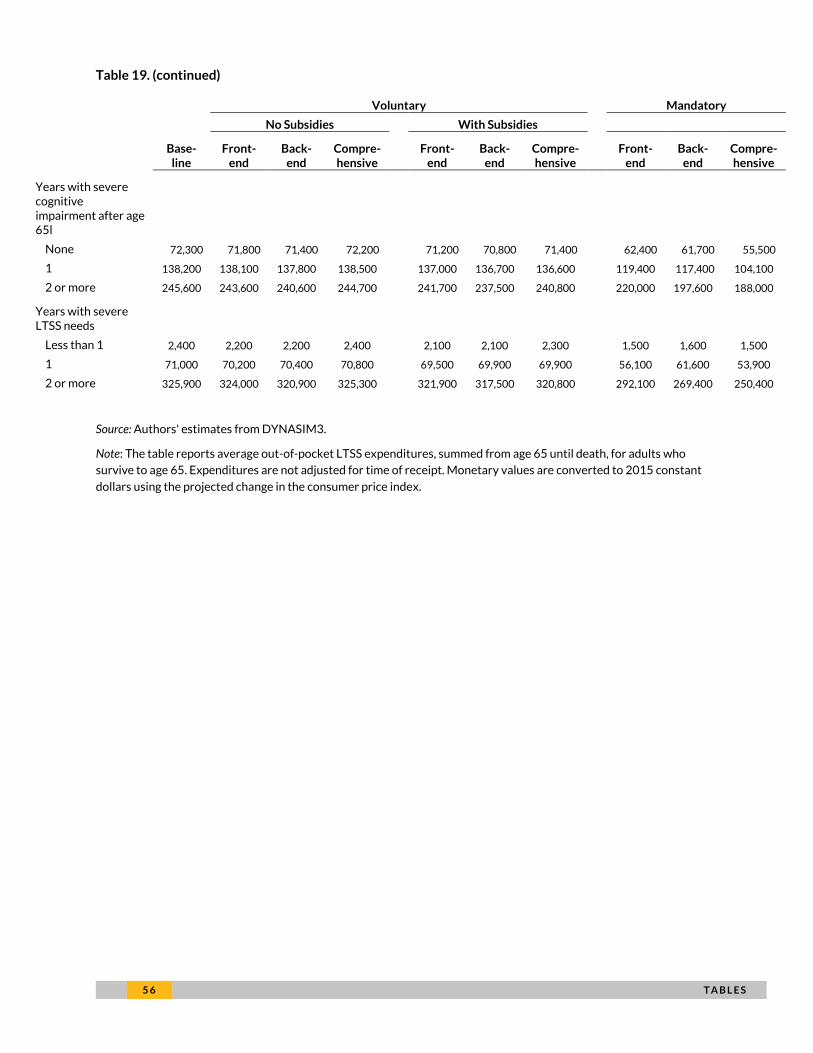
5 6 T A B L E S
Table 19. (continued)
Voluntary Mandatory
No Subsidies With Subsidies
Base-line
Front-end
Back-end
Compre-hensive
Front-end
Back-end
Compre-hensive
Front-end
Back-end
Compre-hensive
Years with severe cognitive impairment after age 65l
None 72,300 71,800 71,400 72,200 71,200 70,800 71,400 62,400 61,700 55,500
1 138,200 138,100 137,800 138,500 137,000 136,700 136,600 119,400 117,400 104,100
2 or more 245,600 243,600 240,600 244,700 241,700 237,500 240,800 220,000 197,600 188,000 Years with severe LTSS needs
Less than 1 2,400 2,200 2,200 2,400 2,100 2,100 2,300 1,500 1,600 1,500
1 71,000 70,200 70,400 70,800 69,500 69,900 69,900 56,100 61,600 53,900
2 or more 325,900 324,000 320,900 325,300 321,900 317,500 320,800 292,100 269,400 250,400
Source: Authors' estimates from DYNASIM3.
Note: The table reports average out-of-pocket LTSS expenditures, summed from age 65 until death, for adults who
survive to age 65. Expenditures are not adjusted for time of receipt. Monetary values are converted to 2015 constant
dollars using the projected change in the consumer price index.
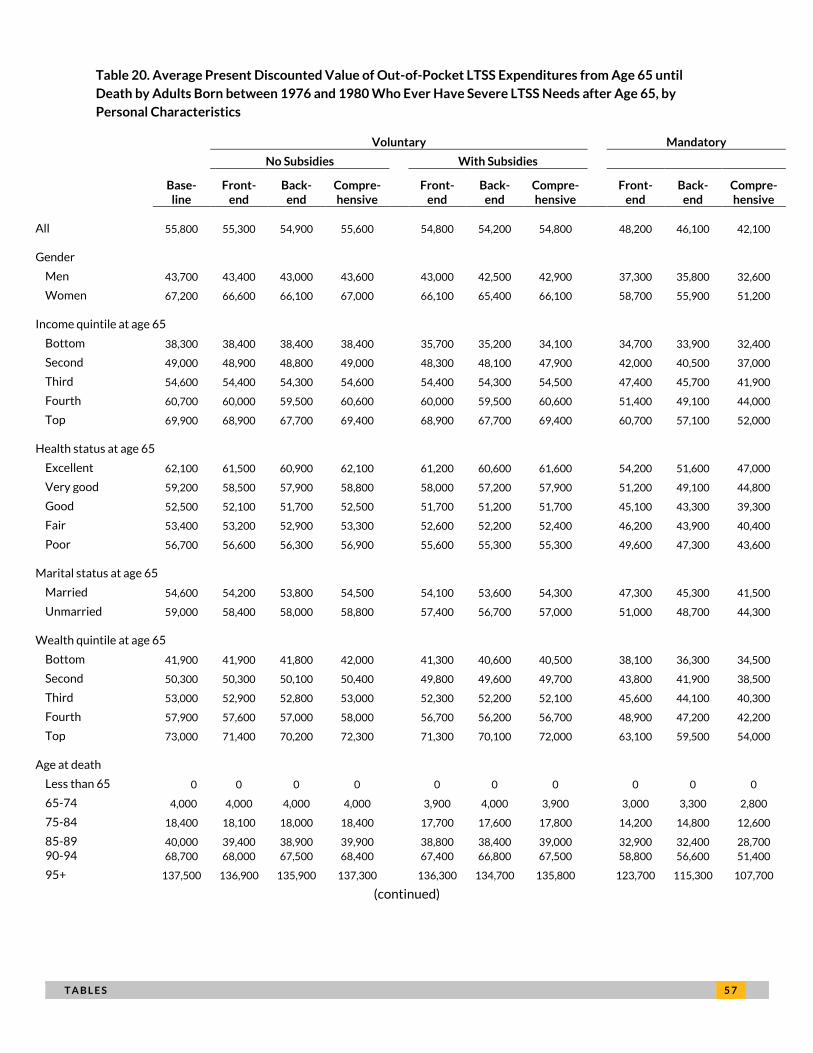
T A B L E S 5 7
Table 20. Average Present Discounted Value of Out-of-Pocket LTSS Expenditures from Age 65 until
Death by Adults Born between 1976 and 1980 Who Ever Have Severe LTSS Needs after Age 65, by
Personal Characteristics
Voluntary Mandatory
No Subsidies With Subsidies
Base-line
Front-end
Back-end
Compre-hensive
Front-end
Back-end
Compre-hensive
Front-end
Back-end
Compre-hensive
All 55,800 55,300 54,900 55,600 54,800 54,200 54,800 48,200 46,100 42,100 Gender
Men 43,700 43,400 43,000 43,600 43,000 42,500 42,900 37,300 35,800 32,600
Women 67,200 66,600 66,100 67,000 66,100 65,400 66,100 58,700 55,900 51,200 Income quintile at age 65
Bottom 38,300 38,400 38,400 38,400 35,700 35,200 34,100 34,700 33,900 32,400
Second 49,000 48,900 48,800 49,000 48,300 48,100 47,900 42,000 40,500 37,000
Third 54,600 54,400 54,300 54,600 54,400 54,300 54,500 47,400 45,700 41,900
Fourth 60,700 60,000 59,500 60,600 60,000 59,500 60,600 51,400 49,100 44,000
Top 69,900 68,900 67,700 69,400 68,900 67,700 69,400 60,700 57,100 52,000 Health status at age 65
Excellent 62,100 61,500 60,900 62,100 61,200 60,600 61,600 54,200 51,600 47,000
Very good 59,200 58,500 57,900 58,800 58,000 57,200 57,900 51,200 49,100 44,800
Good 52,500 52,100 51,700 52,500 51,700 51,200 51,700 45,100 43,300 39,300
Fair 53,400 53,200 52,900 53,300 52,600 52,200 52,400 46,200 43,900 40,400
Poor 56,700 56,600 56,300 56,900 55,600 55,300 55,300 49,600 47,300 43,600 Marital status at age 65
Married 54,600 54,200 53,800 54,500 54,100 53,600 54,300 47,300 45,300 41,500
Unmarried 59,000 58,400 58,000 58,800 57,400 56,700 57,000 51,000 48,700 44,300 Wealth quintile at age 65
Bottom 41,900 41,900 41,800 42,000 41,300 40,600 40,500 38,100 36,300 34,500
Second 50,300 50,300 50,100 50,400 49,800 49,600 49,700 43,800 41,900 38,500
Third 53,000 52,900 52,800 53,000 52,300 52,200 52,100 45,600 44,100 40,300
Fourth 57,900 57,600 57,000 58,000 56,700 56,200 56,700 48,900 47,200 42,200
Top 73,000 71,400 70,200 72,300 71,300 70,100 72,000 63,100 59,500 54,000 Age at death
Less than 65 0 0 0 0 0 0 0 0 0 0
65-74 4,000 4,000 4,000 4,000 3,900 4,000 3,900 3,000 3,300 2,800
75-84 18,400 18,100 18,000 18,400 17,700 17,600 17,800 14,200 14,800 12,600
85-89 40,000 39,400 38,900 39,900 38,800 38,400 39,000 32,900 32,400 28,700 90-94 68,700 68,000 67,500 68,400 67,400 66,800 67,500 58,800 56,600 51,400
95+ 137,500 136,900 135,900 137,300 136,300 134,700 135,800 123,700 115,300 107,700
(continued)
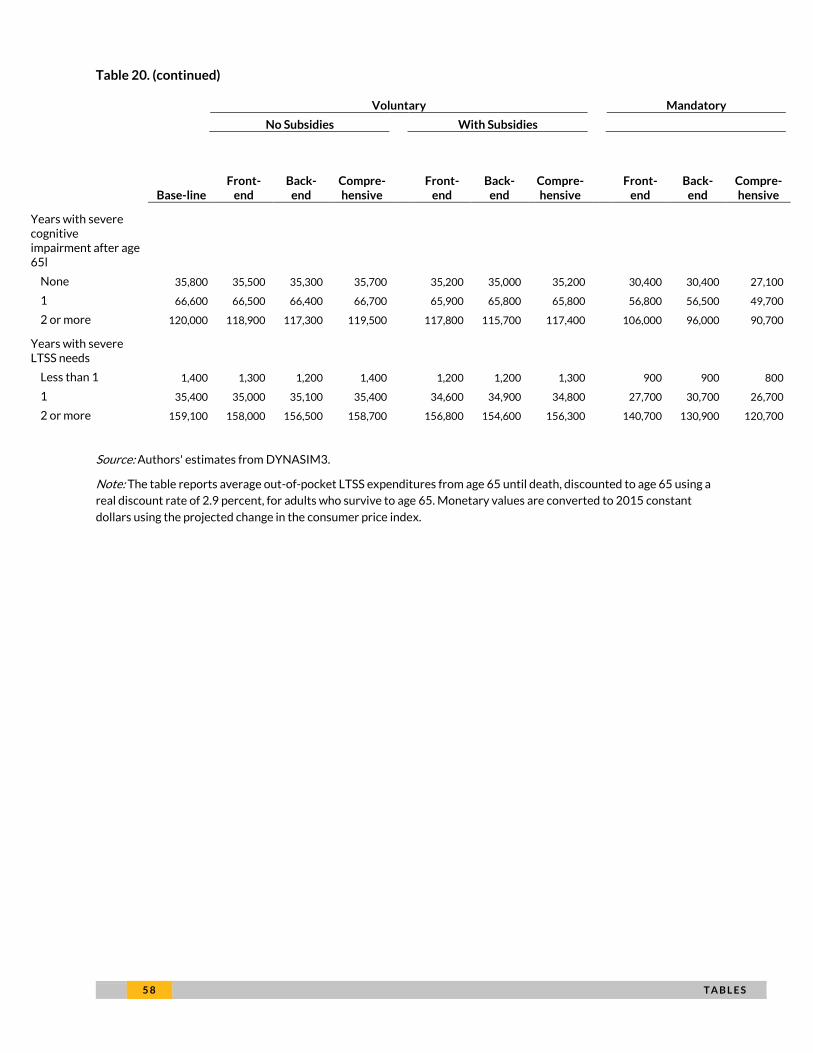
5 8 T A B L E S
Table 20. (continued)
Voluntary Mandatory
No Subsidies With Subsidies
Base-line
Front-end
Back-end
Compre-hensive
Front-end
Back-end
Compre-hensive
Front-end
Back-end
Compre-hensive
Years with severe cognitive impairment after age 65l
None 35,800 35,500 35,300 35,700 35,200 35,000 35,200 30,400 30,400 27,100
1 66,600 66,500 66,400 66,700 65,900 65,800 65,800 56,800 56,500 49,700
2 or more 120,000 118,900 117,300 119,500 117,800 115,700 117,400 106,000 96,000 90,700 Years with severe LTSS needs
Less than 1 1,400 1,300 1,200 1,400 1,200 1,200 1,300 900 900 800
1 35,400 35,000 35,100 35,400 34,600 34,900 34,800 27,700 30,700 26,700
2 or more 159,100 158,000 156,500 158,700 156,800 154,600 156,300 140,700 130,900 120,700
Source: Authors' estimates from DYNASIM3.
Note: The table reports average out-of-pocket LTSS expenditures from age 65 until death, discounted to age 65 using a
real discount rate of 2.9 percent, for adults who survive to age 65. Monetary values are converted to 2015 constant
dollars using the projected change in the consumer price index.
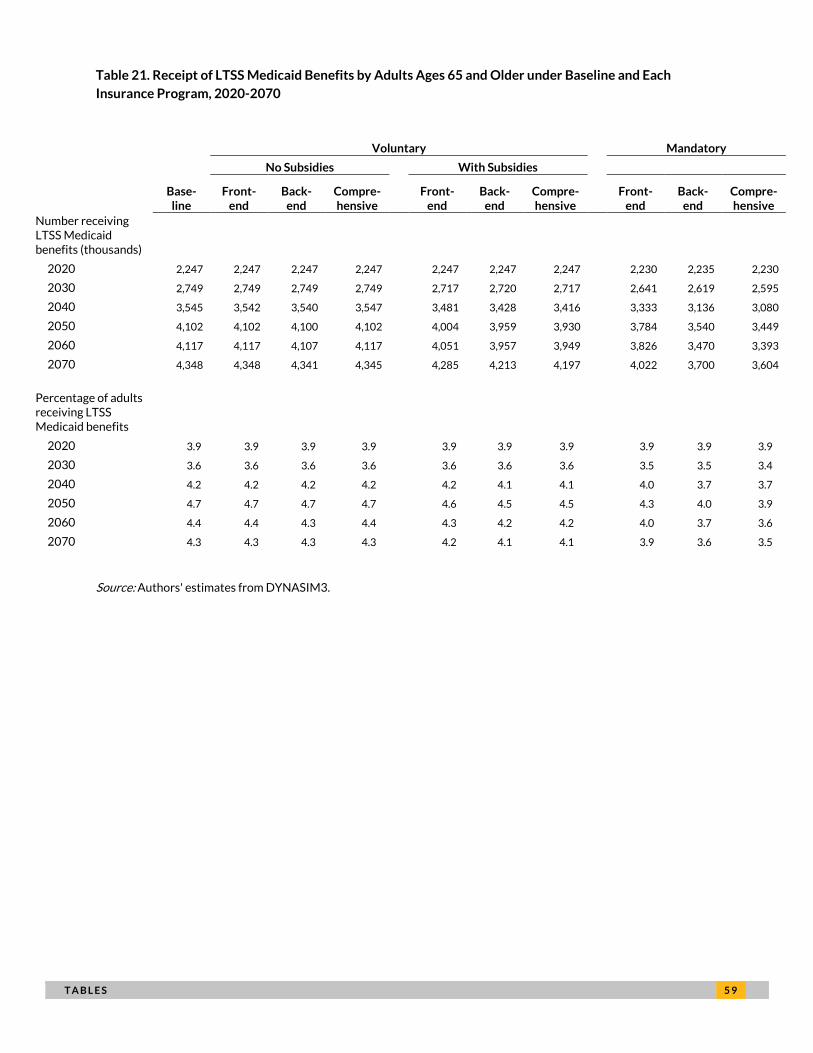
T A B L E S 5 9
Table 21. Receipt of LTSS Medicaid Benefits by Adults Ages 65 and Older under Baseline and Each
Insurance Program, 2020-2070
Voluntary Mandatory
No Subsidies With Subsidies
Base-line
Front-end
Back-end
Compre-hensive
Front-end
Back-end
Compre-hensive
Front-end
Back-end
Compre-hensive
Number receiving LTSS Medicaid benefits (thousands)
2020 2,247 2,247 2,247 2,247 2,247 2,247 2,247 2,230 2,235 2,230
2030 2,749 2,749 2,749 2,749 2,717 2,720 2,717 2,641 2,619 2,595
2040 3,545 3,542 3,540 3,547 3,481 3,428 3,416 3,333 3,136 3,080
2050 4,102 4,102 4,100 4,102 4,004 3,959 3,930 3,784 3,540 3,449
2060 4,117 4,117 4,107 4,117 4,051 3,957 3,949 3,826 3,470 3,393
2070 4,348 4,348 4,341 4,345 4,285 4,213 4,197 4,022 3,700 3,604
Percentage of adults receiving LTSS Medicaid benefits
2020 3.9 3.9 3.9 3.9 3.9 3.9 3.9 3.9 3.9 3.9
2030 3.6 3.6 3.6 3.6 3.6 3.6 3.6 3.5 3.5 3.4
2040 4.2 4.2 4.2 4.2 4.2 4.1 4.1 4.0 3.7 3.7
2050 4.7 4.7 4.7 4.7 4.6 4.5 4.5 4.3 4.0 3.9
2060 4.4 4.4 4.3 4.4 4.3 4.2 4.2 4.0 3.7 3.6
2070 4.3 4.3 4.3 4.3 4.2 4.1 4.1 3.9 3.6 3.5
Source: Authors' estimates from DYNASIM3.
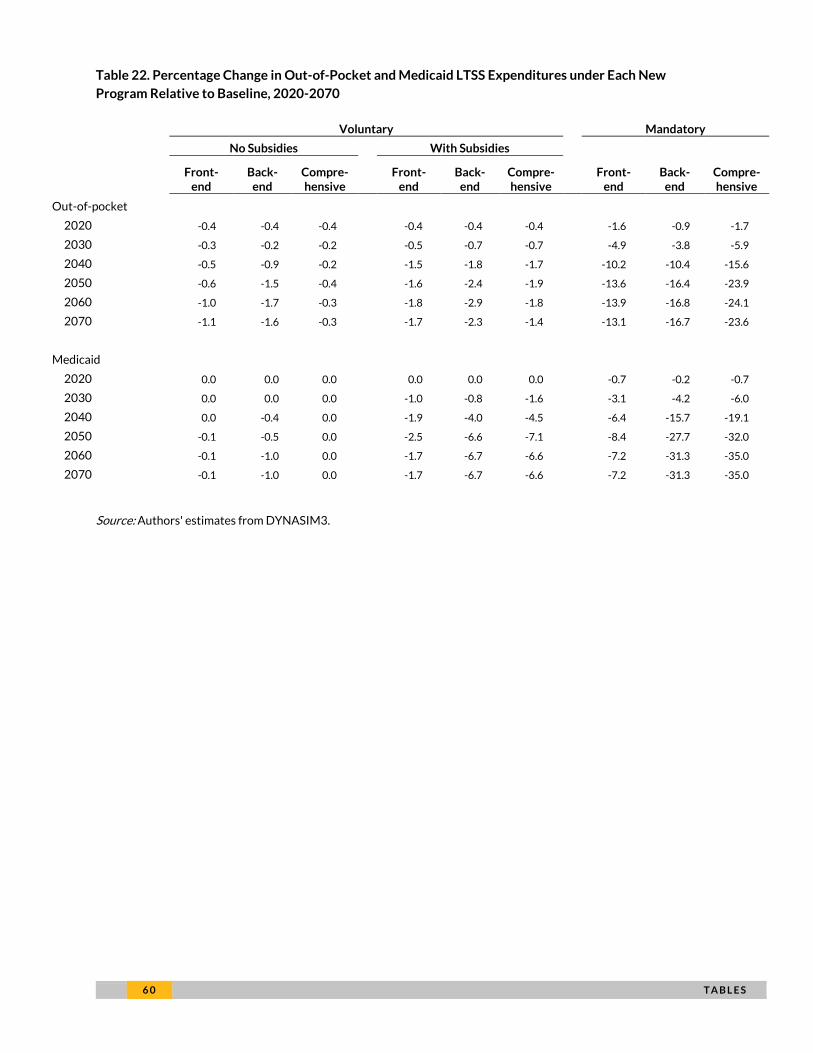
6 0 T A B L E S
Table 22. Percentage Change in Out-of-Pocket and Medicaid LTSS Expenditures under Each New
Program Relative to Baseline, 2020-2070
Voluntary Mandatory
No Subsidies With Subsidies
Front-end
Back-end
Compre-hensive
Front-end
Back-end
Compre-hensive
Front-end
Back-end
Compre-hensive
Out-of-pocket
2020 -0.4 -0.4 -0.4 -0.4 -0.4 -0.4 -1.6 -0.9 -1.7
2030 -0.3 -0.2 -0.2 -0.5 -0.7 -0.7 -4.9 -3.8 -5.9
2040 -0.5 -0.9 -0.2 -1.5 -1.8 -1.7 -10.2 -10.4 -15.6
2050 -0.6 -1.5 -0.4 -1.6 -2.4 -1.9 -13.6 -16.4 -23.9
2060 -1.0 -1.7 -0.3 -1.8 -2.9 -1.8 -13.9 -16.8 -24.1
2070 -1.1 -1.6 -0.3 -1.7 -2.3 -1.4 -13.1 -16.7 -23.6
Medicaid
2020 0.0 0.0 0.0 0.0 0.0 0.0 -0.7 -0.2 -0.7
2030 0.0 0.0 0.0 -1.0 -0.8 -1.6 -3.1 -4.2 -6.0
2040 0.0 -0.4 0.0 -1.9 -4.0 -4.5 -6.4 -15.7 -19.1
2050 -0.1 -0.5 0.0 -2.5 -6.6 -7.1 -8.4 -27.7 -32.0
2060 -0.1 -1.0 0.0 -1.7 -6.7 -6.6 -7.2 -31.3 -35.0
2070 -0.1 -1.0 0.0 -1.7 -6.7 -6.6 -7.2 -31.3 -35.0
Source: Authors' estimates from DYNASIM3.
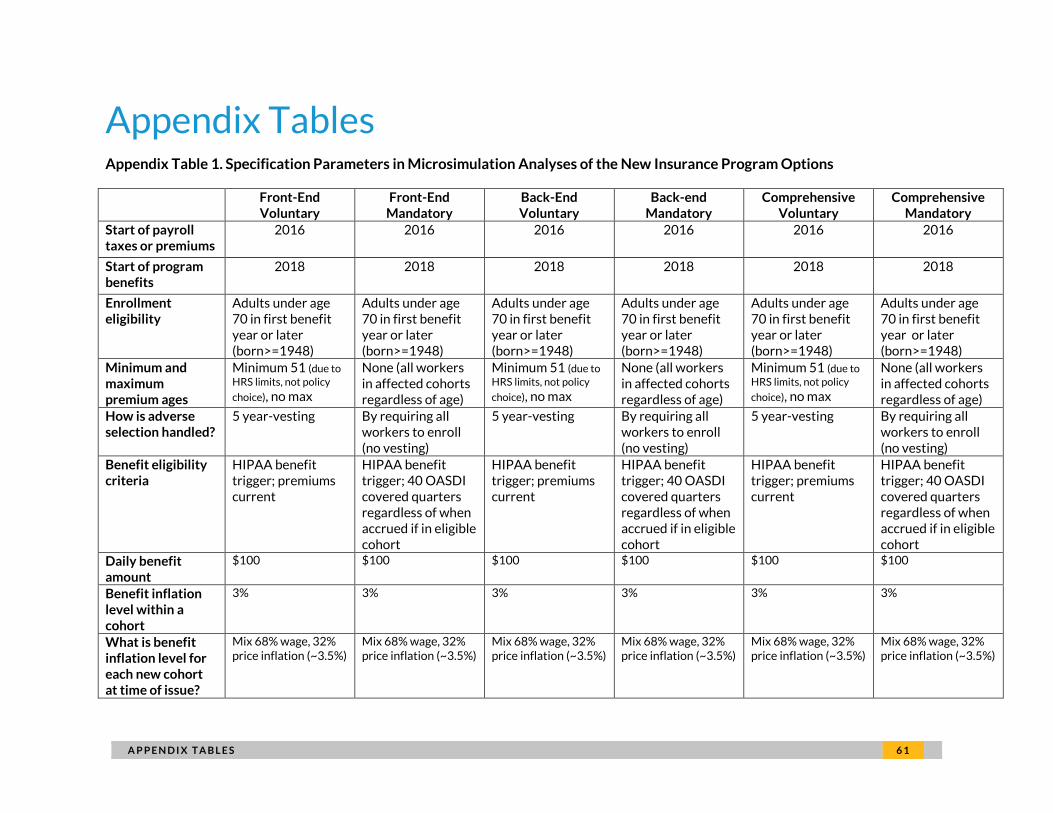
F I N A N C I N G O P T I O N S A P P E N D I X T A B L E S 6 1
Appendix Tables Appendix Table 1. Specification Parameters in Microsimulation Analyses of the New Insurance Program Options
Front-End Voluntary
Front-End Mandatory
Back-End Voluntary
Back-end Mandatory
Comprehensive Voluntary
Comprehensive Mandatory
Start of payroll taxes or premiums
2016 2016 2016 2016 2016 2016
Start of program benefits
2018 2018 2018 2018 2018 2018
Enrollment eligibility
Adults under age 70 in first benefit year or later (born>=1948)
Adults under age 70 in first benefit year or later (born>=1948)
Adults under age 70 in first benefit year or later (born>=1948)
Adults under age 70 in first benefit year or later (born>=1948)
Adults under age 70 in first benefit year or later (born>=1948)
Adults under age 70 in first benefit year or later (born>=1948)
Minimum and maximum premium ages
Minimum 51 (due to
HRS limits, not policy
choice), no max
None (all workers in affected cohorts regardless of age)
Minimum 51 (due to
HRS limits, not policy
choice), no max
None (all workers in affected cohorts regardless of age)
Minimum 51 (due to
HRS limits, not policy
choice), no max
None (all workers in affected cohorts regardless of age)
How is adverse selection handled?
5 year-vesting By requiring all workers to enroll (no vesting)
5 year-vesting By requiring all workers to enroll (no vesting)
5 year-vesting By requiring all workers to enroll (no vesting)
Benefit eligibility criteria
HIPAA benefit trigger; premiums current
HIPAA benefit trigger; 40 OASDI covered quarters regardless of when accrued if in eligible cohort
HIPAA benefit trigger; premiums current
HIPAA benefit trigger; 40 OASDI covered quarters regardless of when accrued if in eligible cohort
HIPAA benefit trigger; premiums current
HIPAA benefit trigger; 40 OASDI covered quarters regardless of when accrued if in eligible cohort
Daily benefit amount
$100 $100 $100 $100 $100 $100
Benefit inflation level within a cohort
3% 3% 3% 3% 3% 3%
What is benefit inflation level for each new cohort at time of issue?
Mix 68% wage, 32% price inflation (~3.5%)
Mix 68% wage, 32% price inflation (~3.5%)
Mix 68% wage, 32% price inflation (~3.5%)
Mix 68% wage, 32% price inflation (~3.5%)
Mix 68% wage, 32% price inflation (~3.5%)
Mix 68% wage, 32% price inflation (~3.5%)
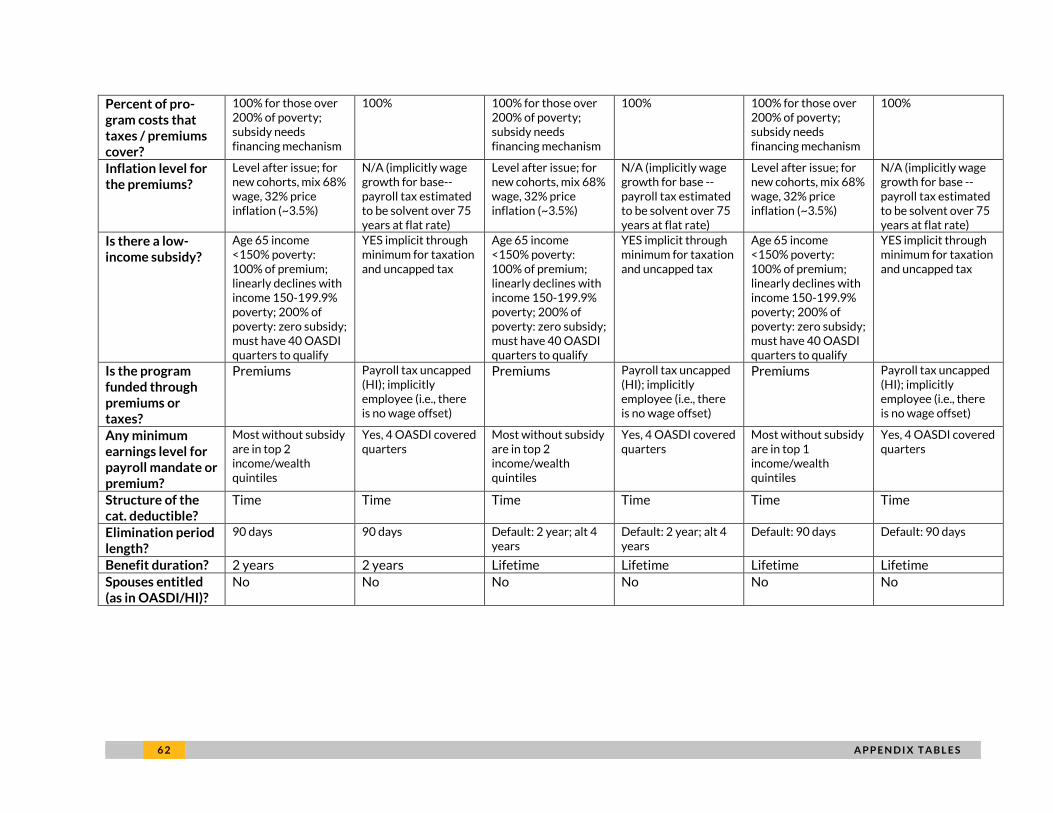
6 2 A P P E N D I X T A B L E S
Percent of pro-gram costs that taxes / premiums cover?
100% for those over 200% of poverty; subsidy needs financing mechanism
100% 100% for those over 200% of poverty; subsidy needs financing mechanism
100% 100% for those over 200% of poverty; subsidy needs financing mechanism
100%
Inflation level for the premiums?
Level after issue; for new cohorts, mix 68% wage, 32% price inflation (~3.5%)
N/A (implicitly wage growth for base--payroll tax estimated to be solvent over 75 years at flat rate)
Level after issue; for new cohorts, mix 68% wage, 32% price inflation (~3.5%)
N/A (implicitly wage growth for base --payroll tax estimated to be solvent over 75 years at flat rate)
Level after issue; for new cohorts, mix 68% wage, 32% price inflation (~3.5%)
N/A (implicitly wage growth for base --payroll tax estimated to be solvent over 75 years at flat rate)
Is there a low-income subsidy?
Age 65 income <150% poverty: 100% of premium; linearly declines with income 150-199.9% poverty; 200% of poverty: zero subsidy; must have 40 OASDI quarters to qualify
YES implicit through minimum for taxation and uncapped tax
Age 65 income <150% poverty: 100% of premium; linearly declines with income 150-199.9% poverty; 200% of poverty: zero subsidy; must have 40 OASDI quarters to qualify
YES implicit through minimum for taxation and uncapped tax
Age 65 income <150% poverty: 100% of premium; linearly declines with income 150-199.9% poverty; 200% of poverty: zero subsidy; must have 40 OASDI quarters to qualify
YES implicit through minimum for taxation and uncapped tax
Is the program funded through premiums or taxes?
Premiums Payroll tax uncapped (HI); implicitly employee (i.e., there is no wage offset)
Premiums Payroll tax uncapped (HI); implicitly employee (i.e., there is no wage offset)
Premiums Payroll tax uncapped (HI); implicitly employee (i.e., there is no wage offset)
Any minimum earnings level for payroll mandate or premium?
Most without subsidy are in top 2 income/wealth quintiles
Yes, 4 OASDI covered quarters
Most without subsidy are in top 2 income/wealth quintiles
Yes, 4 OASDI covered quarters
Most without subsidy are in top 1 income/wealth quintiles
Yes, 4 OASDI covered quarters
Structure of the cat. deductible?
Time Time Time Time Time Time
Elimination period length?
90 days 90 days Default: 2 year; alt 4 years
Default: 2 year; alt 4 years
Default: 90 days Default: 90 days
Benefit duration? 2 years 2 years Lifetime Lifetime Lifetime Lifetime
Spouses entitled (as in OASDI/HI)?
No No No No No No
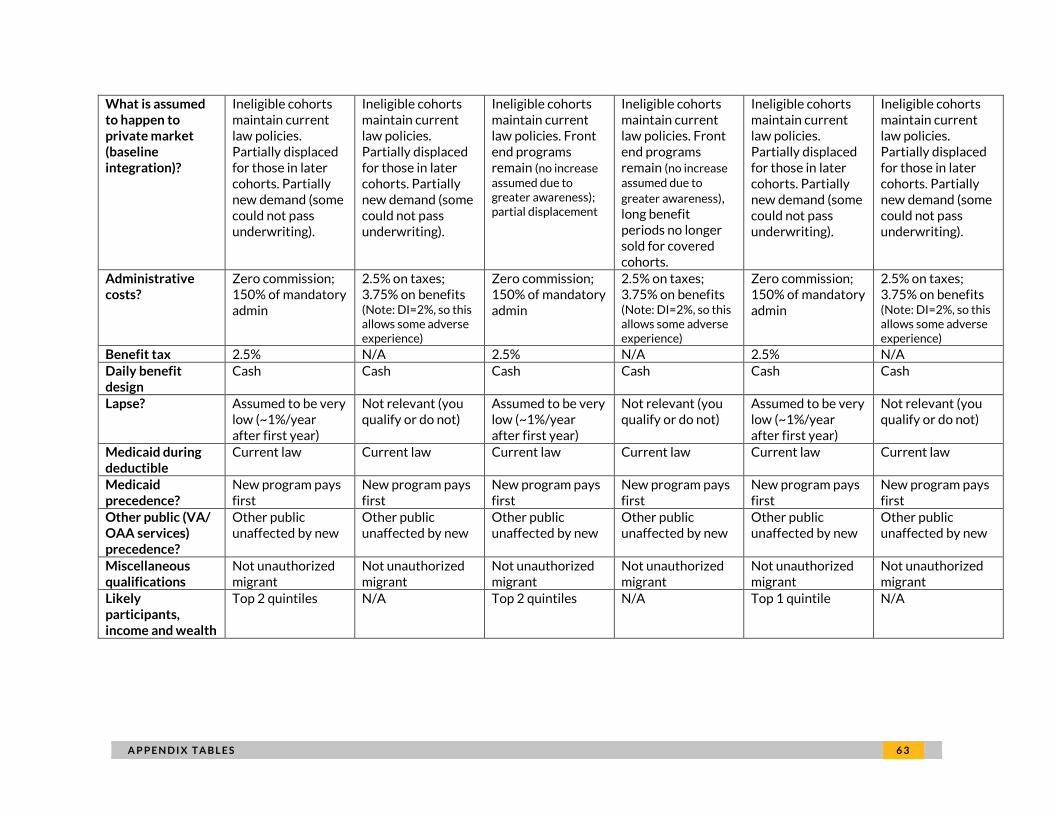
F I N A N C I N G O P T I O N S A P P E N D I X T A B L E S 6 3
What is assumed to happen to private market (baseline integration)?
Ineligible cohorts maintain current law policies. Partially displaced for those in later cohorts. Partially new demand (some could not pass underwriting).
Ineligible cohorts maintain current law policies. Partially displaced for those in later cohorts. Partially new demand (some could not pass underwriting).
Ineligible cohorts maintain current law policies. Front end programs remain (no increase assumed due to greater awareness); partial displacement
Ineligible cohorts maintain current law policies. Front end programs remain (no increase assumed due to
greater awareness), long benefit periods no longer sold for covered cohorts.
Ineligible cohorts maintain current law policies. Partially displaced for those in later cohorts. Partially new demand (some could not pass underwriting).
Ineligible cohorts maintain current law policies. Partially displaced for those in later cohorts. Partially new demand (some could not pass underwriting).
Administrative costs?
Zero commission; 150% of mandatory admin
2.5% on taxes; 3.75% on benefits (Note: DI=2%, so this allows some adverse experience)
Zero commission; 150% of mandatory admin
2.5% on taxes; 3.75% on benefits (Note: DI=2%, so this allows some adverse experience)
Zero commission; 150% of mandatory admin
2.5% on taxes; 3.75% on benefits (Note: DI=2%, so this allows some adverse experience)
Benefit tax 2.5% N/A 2.5% N/A 2.5% N/A
Daily benefit design
Cash Cash Cash Cash Cash Cash
Lapse? Assumed to be very low (~1%/year after first year)
Not relevant (you qualify or do not)
Assumed to be very low (~1%/year after first year)
Not relevant (you qualify or do not)
Assumed to be very low (~1%/year after first year)
Not relevant (you qualify or do not)
Medicaid during deductible
Current law Current law Current law Current law Current law Current law
Medicaid precedence?
New program pays first
New program pays first
New program pays first
New program pays first
New program pays first
New program pays first
Other public (VA/ OAA services) precedence?
Other public unaffected by new
Other public unaffected by new
Other public unaffected by new
Other public unaffected by new
Other public unaffected by new
Other public unaffected by new
Miscellaneous qualifications
Not unauthorized migrant
Not unauthorized migrant
Not unauthorized migrant
Not unauthorized migrant
Not unauthorized migrant
Not unauthorized migrant
Likely participants, income and wealth
Top 2 quintiles N/A Top 2 quintiles N/A Top 1 quintile N/A
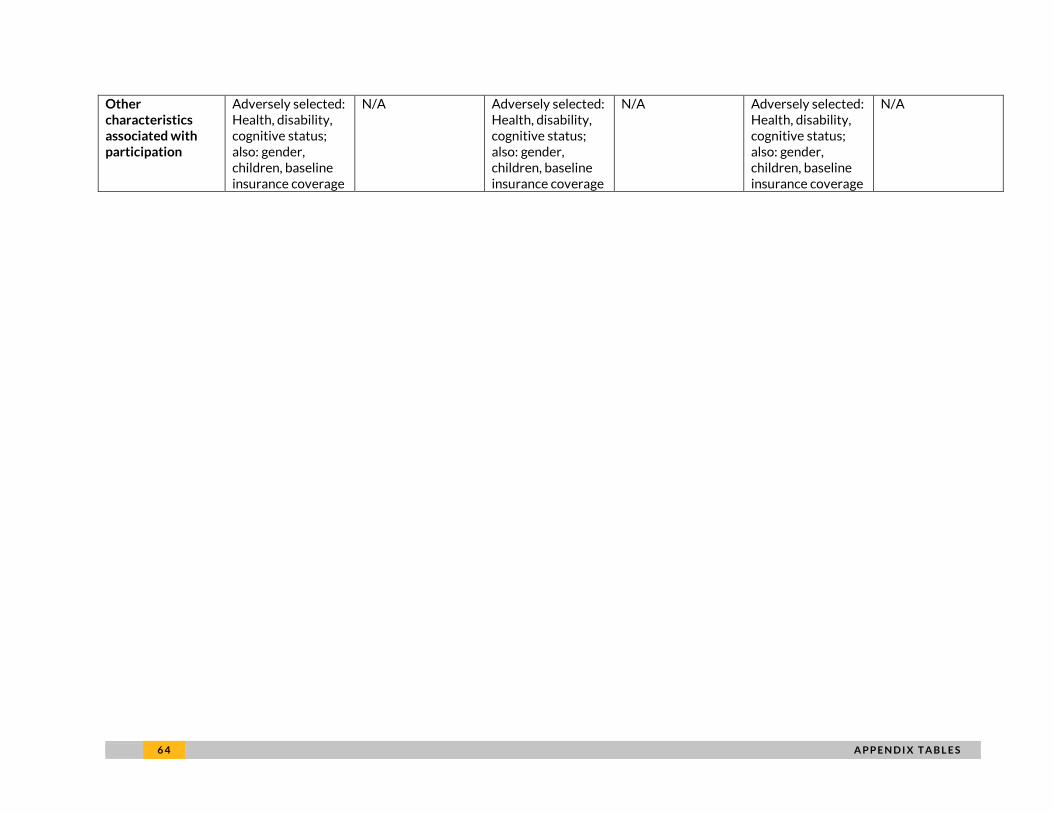
6 4 A P P E N D I X T A B L E S
Other characteristics associated with participation
Adversely selected: Health, disability, cognitive status; also: gender, children, baseline insurance coverage
N/A Adversely selected: Health, disability, cognitive status; also: gender, children, baseline insurance coverage
N/A Adversely selected: Health, disability, cognitive status; also: gender, children, baseline insurance coverage
N/A
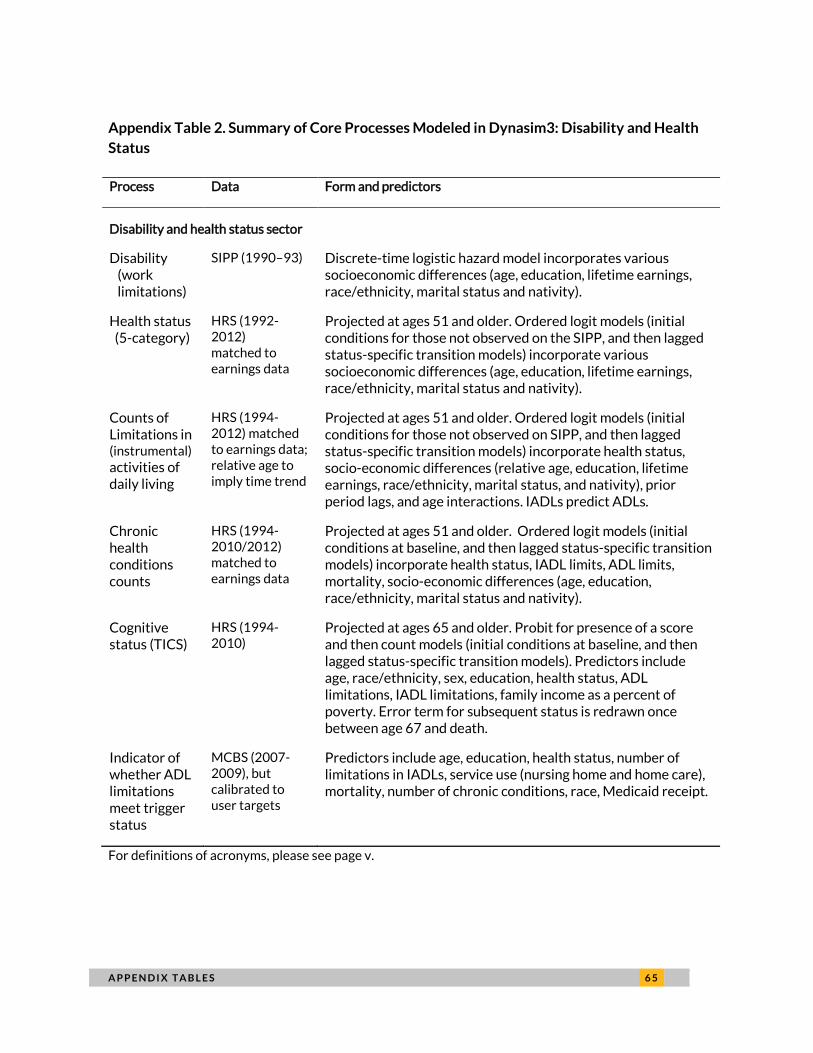
A P P E N D I X T A B L E S 6 5
Appendix Table 2. Summary of Core Processes Modeled in Dynasim3: Disability and Health
Status
Process Data Form and predictors
Disability and health status sector
Disability (work limitations)
SIPP (1990–93) Discrete-time logistic hazard model incorporates various socioeconomic differences (age, education, lifetime earnings, race/ethnicity, marital status and nativity).
Health status (5-category)
HRS (1992-2012) matched to earnings data
Projected at ages 51 and older. Ordered logit models (initial conditions for those not observed on the SIPP, and then lagged status-specific transition models) incorporate various socioeconomic differences (age, education, lifetime earnings, race/ethnicity, marital status and nativity).
Counts of Limitations in (instrumental)
activities of daily living
HRS (1994-2012) matched to earnings data; relative age to imply time trend
Projected at ages 51 and older. Ordered logit models (initial conditions for those not observed on SIPP, and then lagged status-specific transition models) incorporate health status, socio-economic differences (relative age, education, lifetime earnings, race/ethnicity, marital status, and nativity), prior period lags, and age interactions. IADLs predict ADLs.
Chronic health conditions counts
HRS (1994-2010/2012) matched to earnings data
Projected at ages 51 and older. Ordered logit models (initial conditions at baseline, and then lagged status-specific transition models) incorporate health status, IADL limits, ADL limits, mortality, socio-economic differences (age, education, race/ethnicity, marital status and nativity).
Cognitive status (TICS)
HRS (1994-2010)
Projected at ages 65 and older. Probit for presence of a score and then count models (initial conditions at baseline, and then lagged status-specific transition models). Predictors include age, race/ethnicity, sex, education, health status, ADL limitations, IADL limitations, family income as a percent of poverty. Error term for subsequent status is redrawn once between age 67 and death.
Indicator of whether ADL limitations meet trigger status
MCBS (2007-2009), but calibrated to user targets
Predictors include age, education, health status, number of limitations in IADLs, service use (nursing home and home care), mortality, number of chronic conditions, race, Medicaid receipt.
For definitions of acronyms, please see page v.
6 6 A P P E N D I X T A B L E S
Appendix Table 3. Summary of Core Processes Modeled in DYNASIM3: Demand and Prices
for Long-Term Services and Supports
Process Data Form and predictors
Long-term services and support
Use of home care, nursing home, and residential care
HRS (1994-2010)
Projected at ages 65 and older. Trivariate probit model incorporates various socioeconomic differences (age, education, race/ethnicity, family income, insurance status, marital status, nativity and number of children, wealth). Also includes chronic conditions, cognitive status, limitations in IADLs/ ADLs, health status, and mortality.
Intensity of LTSS use (home care hours and nursing home days)
HRS (2002-2010); NHATS (2011)
Separate zero-truncated negative binomial models for those projected to have either type of expense; incorporates various socioeconomic differences (age, education, race/ethnicity, family income, insurance status, marital status, nativity and number of children, wealth). Also includes chronic conditions, cognitive impairment, limitations in IADLs/ADLs, and health status. For home care, use NHATS table to translate monthly into annual.
LTSS prices, Medicaid
Various (e.g., Eljay 2014, 2012, 2009, Mollica 2009, Ng. et al. 2014)
Use state-specific Medicaid rates from various review articles when attributing costs for LTSS. Indexed to wage inflation after baseline.
LTSS prices, non-Medicaid
Genworth (2014, 2015)
State-specific. Use median, semi-private NH rooms, home health aide rates. Nursing home and residential care prices are indexed to wage inflation after baseline. Home care prices are indexed to the average of wage and price inflation after baseline. Assume that user provided share of individuals with family income of at least 5 times poverty pays above-market rates and a user provided share of individuals with family income of less than 3 times poverty pays below-market rates, with variation based on income level.
For definitions of acronyms, please see page v.
A P P E N D I X T A B L E S 6 7
Appendix Table 4. Summary of Core Processes Modeled in DYNASIM3: Payer Allocation for
Long-Term Services and Supports
Process Data Form and predictors
Long-term services and support
Private long-term care insurance: purchase
HRS (2002-2010);
Project unlapsed coverage as of age 65 (using sample of 60-65 year olds). Predictors include education, life expectancy, health status, wealth, number of children, nativity, race/ethnicity, gender.
Private long-term care insurance: plan features
Parameters from AALTCI and private industry data (including Milliman Long-Term Care data base); Broker World Survey (July 2014)
Plans have varied daily/ lifetime maximum (5 and 6 groups, respectively), elimination periods (4 groups), inflation protection (yes/no). Lapse is projected from ages 66 onward. Premiums vary based on gender and marital status, projected issue age, and assigned plan features (benefit period and inflation protection).
Allocation of LTSS costs to payers
MCBS (2007-09), plus Medicaid and private plan rules
Use Medicaid, Medicare, and stylized private plan rules to determine eligibility for payment from different sources. Estimates from MCBS and historical aggregates provide targets.
Veterans Administra-tion nursing home
MCBS (2007-09) Applied only to those in nursing homes. Predictors include gender, education, race, IADL limitations, health status, chronic conditions, Medicaid status.
For definitions of acronyms, please see page v.
6 8 A P P E N D I X T A B L E S
Appendix Table 5. Summary of Core Processes Modeled in DYNASIM3: Health Care
Coverage and Use (Excluding Long-Term Services and Supports)
Process Data Form and predictors
Medicare (including RHI)
Medicare and total health spending
MCBS (2007-09) Projected at ages 65 and older. Square root for baseline, includes first-order autoregressive error that varies based on prior spending. Baseline predictors include age, sex, education, mortality, marital status, insurance type, health status, chronic conditions, ADL/IADL limitations, ln(per capita income), region, nursing home status, household size. Growth function takes into account technological change and growth in costs shares (premiums and out-of-pocket).
Insurance status
MCBS (2007-09) Seven stylized statuses (Medicaid, other public, employer fee-for-service, employer health maintenance organization (HMO), self-pay fee-for-service, self-pay HMO, no supplemental) projected at ages 65 and older. Multinomial logit for baseline. Baseline predictors include age, education, employment status, gender, health status, limitations in ADLs/IADLs, race/ethnicity, marital status, mortality, chronic conditions, household size. Transition model takes into account premiums and health status.
Premiums Rule based Take into account spending growth, changes in insurance status, load factors.
Out-of-pocket
MCBS (2007-09) Varies by insurance type and decile of spending.
Medicaid
Medicaid eligibility
Rule based, state-specific
Separate full-scope pathways for SSI receipt/eligibility, percent-of-poverty, Medically Needy, non-SSI in nursing home if income near SSI limits, HCBS; also QMB, SLMB, and QI. Accounts for cost shares, spousal impoverishment, partnership programs, and other details.
Medicaid take-up
Stochastic, with grounding in related literature
For Medically needy, varies by spending quintile and income quintile; lower for MSPs than for full-scope pathways, with QMB higher than SLMB and SLMB higher than QI. Because HCBS programs have waiting lists, take-up is assumed to be 100 percent. Similarly, nursing homes are assumed to require Medicaid application for those qualifying through that pathway (i.e., take up is also 100 percent).
For definitions of acronyms, please see page v.
A P P E N D I X 6 9
Appendix: Data from Private
Insurance Industry Experience
RESULTS
Appendix Tables 6.1 (Female) and 6.2 (Male) show an estimated distribution of future long-term care
(LTC) expenditures incurred during an individual’s years of needing services. The costs are shown by
care setting across all individuals turning age 65 in 2014 (i.e., the cohort includes both individuals that
need care during their lifetime and individuals that do not need care during their lifetime).
The estimates shown are representative of an insured population, and may not relate to other
populations (e.g., due to the different patterns of care for individuals with funding support from
government programs). In addition, these estimates reflect a LTC product design with a service
reimbursement benefit and HIPAA benefit trigger. Different covered populations, eligibility
requirements, benefit levels, etc. (e.g., cash benefits or less restrictive benefit triggers) may result in
different patterns.
METHODS AND ASSUMPTIONS
Data Source: Continuance and incidence rates were developed from the 2014 Milliman Long-Term
Care Guidelines (Guidelines), which are based on approximately $25 billion of LTC private market
insured claim experience from 450,000 claims. The Guidelines are developed from private LTC
insurance experience and do not include public or private funding or the cost of informal caregiver
services.
Average Length of Stay: Continuance tables from the Guidelines by gender and care setting (Skilled
Nursing Facility (SNF), Assisted Living Facility (ALF) and Home Health Care (HHC)) without any benefit
limitations applied were used to calculate the average length of stay for an individual. These tables
were adjusted so that claim terminations reflect only disabled mortality rates, based upon Milliman
claim termination research.
Lifetime Probability of LTC Need: The lifetime probability of need takes into account both the
probability that an individual will need LTC services and the probability that they are still alive at that
given age. Incidence rates by gender and care setting from the Guidelines were used to estimate the
probability of an individual needing LTC services. These incidence rates were applied to a population
projection of 65 year olds in 2014 developed using the 1994 GAM Static Table adjusted to reflect only
mortality for a non-disabled population.

7 0 A P P E N D I X
Cost of Care: Average LTC costs for all individuals were estimated assuming a current average SNF
daily cost of $230, ALF daily cost of $200, and HHC daily cost of $160. Future costs of care were
estimated using a 4% annual increase in costs for SNF and ALF and 3% annual increase for HHC. All
future dollar amounts were then discounted back to 2014 using a 5.6% discount rate.
CAVEATS AND LIMITATIONS
This Appendix has been prepared for The Urban Institute (Urban). Milliman does not intend to benefit,
or create a legal duty to, any third-party recipient of this work. This communication must be read in its
entirety.
This Appendix summarizes estimates of future LTC expenditures incurred by year of need. Various
assumptions were used to construct these estimates. Different assumptions may produce materially
different results, such as the population covered, eligibility for benefits, cost subsidies, benefit levels,
and future rates of inflation. Actual results will vary from these estimates. This information may not be
appropriate, and should not be used, for other purposes.
Guidelines issued by the American Academy of Actuaries require actuaries to include their professional
qualifications in all actuarial communications. Chris Giese and Al Schmitz are members of the American
Academy of Actuaries and meet the qualification standards for performing the analyses in this
Appendix.
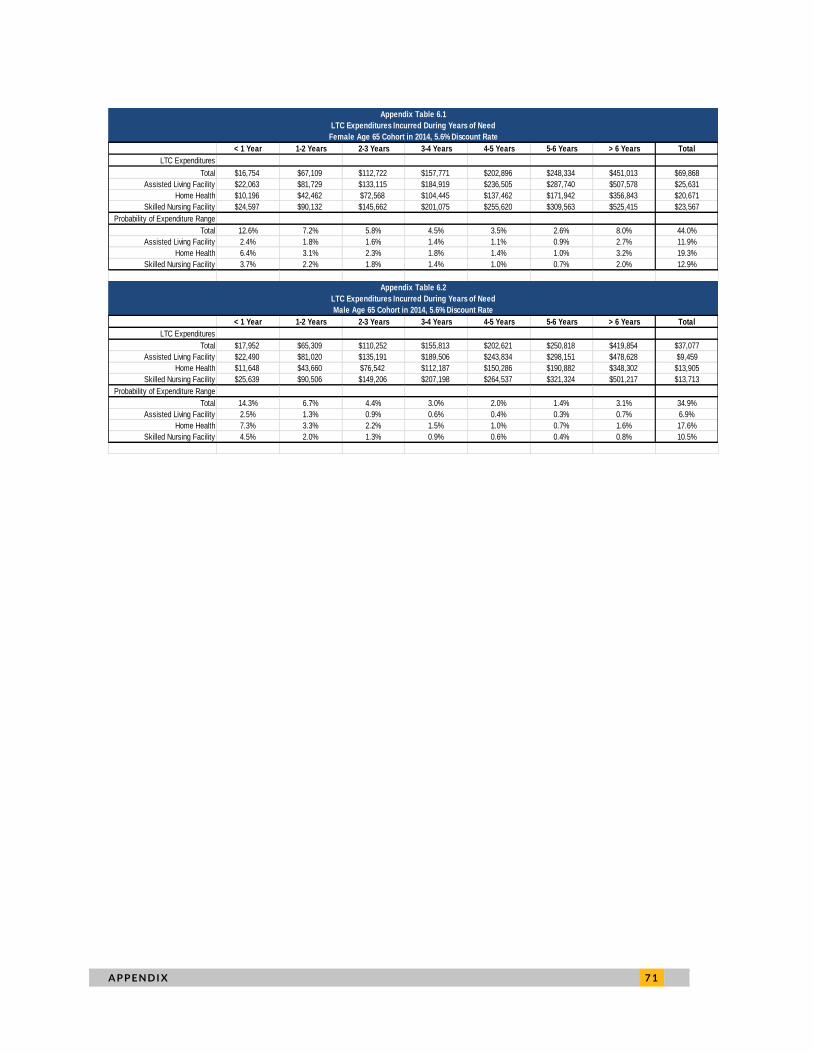
A P P E N D I X 7 1
Appendix Table 6.1
LTC Expenditures Incurred During Years of Need
Female Age 65 Cohort in 2014, 5.6% Discount Rate
< 1 Year 1-2 Years 2-3 Years 3-4 Years 4-5 Years 5-6 Years > 6 Years Total
LTC Expenditures
Total $16,754 $67,109 $112,722 $157,771 $202,896 $248,334 $451,013 $69,868
Assisted Living Facility $22,063 $81,729 $133,115 $184,919 $236,505 $287,740 $507,578 $25,631
Home Health $10,196 $42,462 $72,568 $104,445 $137,462 $171,942 $356,843 $20,671
Skilled Nursing Facility $24,597 $90,132 $145,662 $201,075 $255,620 $309,563 $525,415 $23,567
Probability of Expenditure Range
Total 12.6% 7.2% 5.8% 4.5% 3.5% 2.6% 8.0% 44.0%
Assisted Living Facility 2.4% 1.8% 1.6% 1.4% 1.1% 0.9% 2.7% 11.9%
Home Health 6.4% 3.1% 2.3% 1.8% 1.4% 1.0% 3.2% 19.3%
Skilled Nursing Facility 3.7% 2.2% 1.8% 1.4% 1.0% 0.7% 2.0% 12.9%
Appendix Table 6.2
LTC Expenditures Incurred During Years of Need
Male Age 65 Cohort in 2014, 5.6% Discount Rate
< 1 Year 1-2 Years 2-3 Years 3-4 Years 4-5 Years 5-6 Years > 6 Years Total
LTC Expenditures
Total $17,952 $65,309 $110,252 $155,813 $202,621 $250,818 $419,854 $37,077
Assisted Living Facility $22,490 $81,020 $135,191 $189,506 $243,834 $298,151 $478,628 $9,459
Home Health $11,648 $43,660 $76,542 $112,187 $150,286 $190,882 $348,302 $13,905
Skilled Nursing Facility $25,639 $90,506 $149,206 $207,198 $264,537 $321,324 $501,217 $13,713
Probability of Expenditure Range
Total 14.3% 6.7% 4.4% 3.0% 2.0% 1.4% 3.1% 34.9%
Assisted Living Facility 2.5% 1.3% 0.9% 0.6% 0.4% 0.3% 0.7% 6.9%
Home Health 7.3% 3.3% 2.2% 1.5% 1.0% 0.7% 1.6% 17.6%
Skilled Nursing Facility 4.5% 2.0% 1.3% 0.9% 0.6% 0.4% 0.8% 10.5%

7 2 A B O U T T H E A U T H O R S
About the Authors Melissa M. Favreault is a senior fellow in the Income and Benefits Policy Center at the
Urban Institute, where her work focuses on the economic well-being and health status
of older Americans and individuals with disabilities. She also analyzes long-term care
needs and the distributional effects of Medicare and Medicaid. Her work in this area
has focused on how changes in family structure and work/earnings patterns affect
economic well-being in retirement, with a special emphasis on effects for women and
lower-wage workers. For this research, she has often relied on dynamic
microsimulation models. She has helped develop these types of models for both Urban
and the Social Security Administration. Favreault coedited Social Security and the
Family: Addressing Unmet Needs in an Underfunded System with Frank Sammartino
and C. Eugene Steuerle, and has written extensively about the distributional effects of
proposed changes to Social Security. She served on the Social Security Advisory
Board’s 2011 Technical Panel on Assumptions and Methods.
Richard W. Johnson is a senior fellow in the Income and Benefits Policy Center at the
Urban Institute, where he directs the Program on Retirement Policy. His current
research focuses on older Americans’ employment and retirement decisions, long-term
services and supports for older adults with disabilities, and state and local pensions. His
recent studies have examined job loss at older ages, occupational change after age 50,
employment prospects for age 50+ African Americans and Hispanics, and the impact of
the 2007–09 recession and its aftermath on older workers and future retirement
incomes. He has also written extensively about retirement preparedness, including the
financial and health risks people face as they approach retirement, economic hardship
in the years before Social Security's early eligibility age, and the adequacy of the
disability safety net.


2100 M Street NW
Washington, DC 20037
www.urban.org


