12
RF BD statistics in the TD26CC accelerating structure J. Giner-Navarro 18/11/2014 CLIC Breakdown meeting 1 18/11/2014 J. Giner-Navarro
| Date post: | 22-Dec-2015 |
| Category: |
Documents |
| Upload: | elijah-lamb |
| View: | 217 times |
| Download: | 0 times |

J. Giner-Navarro 1
RF BD statistics in the TD26CC accelerating structure
J. Giner-Navarro18/11/2014
CLIC Breakdown meeting
18/11/2014

J. Giner-Navarro 2
BD analysis: TD26CC history
Data taken for the analysis (at similar conditions):250 ns conditioning + BDR measurementFrom 15th-Nov-2013 to 18th-Dec-201318/11/2014

J. Giner-Navarro 3
BD and cell history
REF-TRA method to locate breakdowns in the structure.
0 5 10 15 20 25 30 35 40 45 50
2
4
6
8
10
12
14
16
18
20
22
24
26
28
#Pulses (M)
BD
cel
l
18/11/2014
J. Giner-Navarro 4
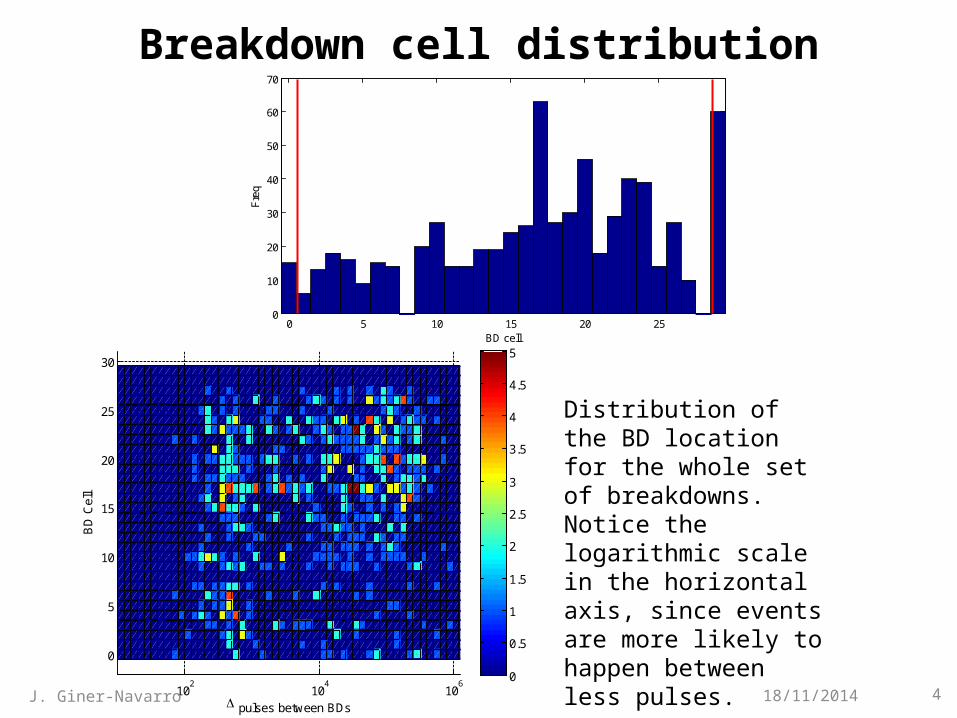
Breakdown cell distribution
102
104
106
0
5
10
15
20
25
30
pulses between BDs
BD
Cel
l
0
0.5
1
1.5
2
2.5
3
3.5
4
4.5
5
Distribution of the BD location for the whole set of breakdowns.Notice the logarithmic scale in the horizontal axis, since events are more likely to happen between less pulses.
0 5 10 15 20 250
10
20
30
40
50
60
70
BD cell
Fre
q
18/11/2014

J. Giner-Navarro 5
Pulses between BDs distribution
0 0.2 0.4 0.6 0.8 1 1.2 1.4 1.6 1.8 2
x 106
0
0.1
0.2
0.3
0.4
0.5
0.6
0.7
0.8
0.9
1
#Pulses between BDs
Data
Poisson fit
First 26,000 pulses outRemoval of the number of first pulses optimized by chi2 minimization
0 0.2 0.4 0.6 0.8 1 1.2 1.4 1.6 1.8 2
x 106
0
0.1
0.2
0.3
0.4
0.5
0.6
0.7
0.8
0.9
1
#Pulses between BDs
Data
Poisson fit
Expected distribution
BDR= 5.61e-6 bpp
Total 676 BD eventsBDR = 1.31e-5 bpp
I call this subset of 279 BDs the Poissonian data
18/11/2014

J. Giner-Navarro 6
0 0.2 0.4 0.6 0.8 1 1.2 1.4 1.6 1.8 2
x 106
10-2
10-1
100
#Pulses between BDs
Data
Poisson fit
0 0.2 0.4 0.6 0.8 1 1.2 1.4 1.6 1.8 2
x 106
10-2
10-1
100
#Pulses between BDs
Data
Poisson fit
Pulses between BDs distribution
First 26,000 pulses outRemoval of the number of first pulses optimized by chi2 minimization
Expected distribution
BDR= 5.61e-6 bppTotal 676 BD eventsBDR = 1.31e-5 bpp
I call this subset of 279 BDs the Poissonian data
18/11/2014
Better to see in logarithmic scale

J. Giner-Navarro 7
Consecutive BD cell displacementDistribution of cell displacement between two consecutive breakdowns.
If next BD was randomly located, we would expect a triangular distribution (red), due to the effect of edges which can move towards only one direction.
If we normalize the distribution to be uniform, we see more probability of trigger a breakdown in the vicinity of the previous BD cell.
(Poissonian data: first 26000 pulses out)
-30 -20 -10 0 10 20 300
2
4
6
8
10
12
14
16
18
20
BD cell displacement
Fre
q
-30 -20 -10 0 10 20 300
0.1
0.2
0.3
0.4
0.5
0.6
0.7
0.8
BD cell displacementF
req
norm
aliz
ed
18/11/2014

J. Giner-Navarro 8
Are the BD clusters also poissonian?
It doesn’t look like poissonian, far from an exponential distribution.
0 0.5 1 1.5 2 2.5 3
x 104
10-2
10-1
100
#Pulses between BDs
Data
Poisson fit
I call this subset of 397 BDs the pre-Poissonian data
0 0.5 1 1.5 2 2.5 3
x 104
0
0.1
0.2
0.3
0.4
0.5
0.6
0.7
0.8
0.9
1
#Pulses between BDs
Data
Poisson fit
18/11/2014

J. Giner-Navarro 9
-30 -20 -10 0 10 20 300
0.2
0.4
0.6
0.8
1
1.2
1.4
BD cell displacement
Fre
q no
rmal
ized
-30 -20 -10 0 10 20 300
5
10
15
20
25
30
35
BD cell displacement
Fre
q
Are the BD clusters also poissonian?Distribution of cell displacement between two consecutive breakdowns.
(pre-poissonian data: only first 26000 pulses)
Same behaviour as the poissonian data: BDs triggered in near cells to the previous one
18/11/2014

J. Giner-Navarro 10
Correlation Pulses and BD displacement
Pre-poissonian data subset.
We look for a correlation between the number of pulses and cell location variation between two consecutive breakdowns, to check if BDs within a certain number of pulses are more likely to be closer.This would indicate a debris of the previous breakdown which triggers a new one.
0 0.5 1 1.5 2 2.5
x 104
-30
-20
-10
0
10
20
30
pulses between BDs
BD
Cel
l dis
plac
emen
t
0 0.5 1 1.5 2 2.5
x 104
0
5
10
15
20
25
30Correlation coeficient r= 0.14026
pulses between BDs
BD
Cel
l dis
plac
emen
t
Abso
lute
val
ue
18/11/2014

J. Giner-Navarro 11
BD Cell displacement?
Here we normalize the distribution taking into account that a displacement
of 0 cells can come from more cells than a displacement of +28 cells.
Then, it seems that it is more likely that a BD is triggered near the previous one when there were less pulses in between.
pulses between BDs
Cel
l dis
plac
emen
t
102
103
104
105
-25
-20
-15
-10
-5
0
5
10
15
20
25
0.5
1
1.5
2
2.5
3
3.5
4
4.5
5
pulses between BDs
Cel
l dis
plac
emen
t
102
103
104
105
-25
-20
-15
-10
-5
0
5
10
15
20
25
0.05
0.1
0.15
0.2
0.25
0.3
18/11/2014

J. Giner-Navarro 12
Conclusions• Data behaves poissonian as we remove clusters separated by
less than 26000 pulses, to compare with the 10000 pulses obtained by Anders’ experiment in the Fixed-Gap system.
• These figures shows qualitatively that most clustered breakdowns appear near the previous one.
• Need of statistics and alternative methods to quantify this correlation between the number of pulses needed to trigger a new BD and its location.
18/11/2014


