28
NCAT Report 03-06 RUTTING EVALUATION OF LOPKE AGGREGATE BLENDS By Brian D. Prowell Mike Huner August 2003 277 Technology Parkway Auburn, AL 36830

NCAT Report 03-06
RUTTING EVALUATION OF LOPKE AGGREGATE BLENDS By Brian D. Prowell
Mike Huner
August 2003
277 Technology Parkway Auburn, AL 36830

RUTTING EVALUATION OF LOPKE AGGREGATE BLENDS
By:
Brian D. Prowell Assistant Director
National Center for Asphalt Technology Auburn University, Auburn, Alabama
Sponsored by
F. S. Lopke Contracting, Inc. Apalachin, NY
NCAT Report 03-06
August 2003

Prowell
-ii-
DISCLAIMER
The contents of this report reflect the views of the author who is responsible for the facts and accuracy of the data presented herein. The material is based upon work requested and supported by F. S. Lopke Contracting, Inc. The contents do not necessarily reflect the official views or policies of the F. S. Lopke Contracting, Inc. or the National Center for Asphalt Technology. This report does not constitute a standard, specification or regulation.
Prowell
-iii-
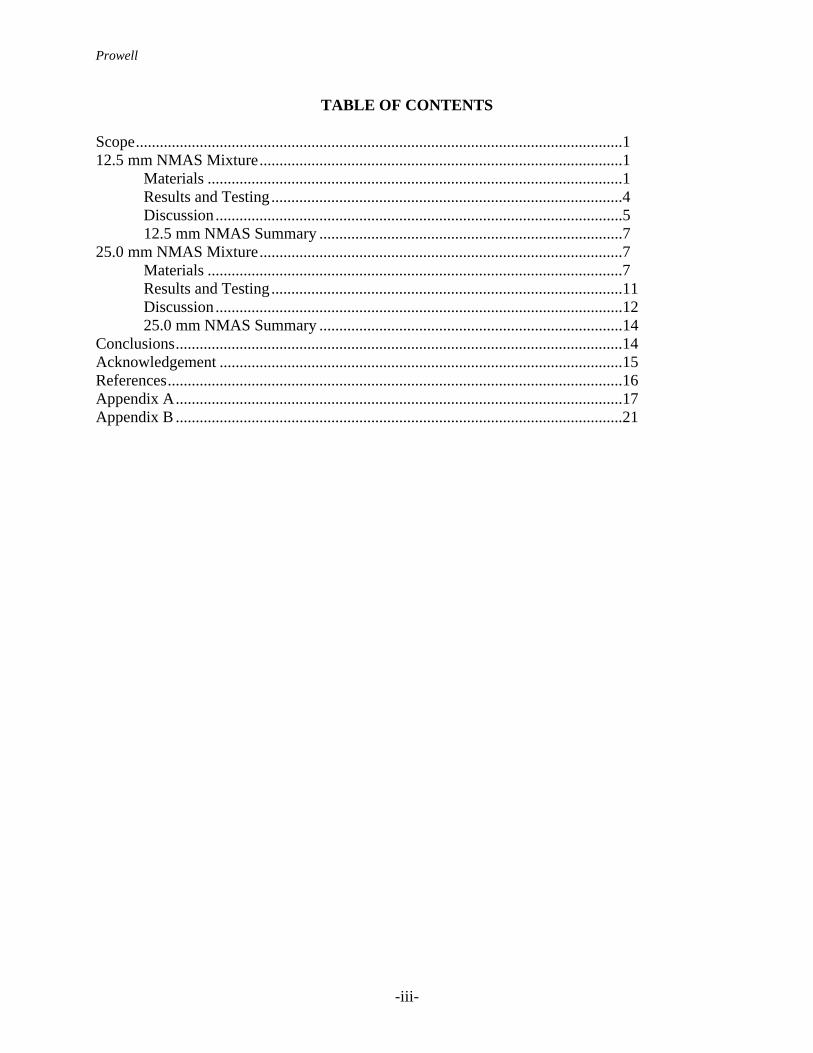
TABLE OF CONTENTS Scope..........................................................................................................................1 12.5 mm NMAS Mixture...........................................................................................1 Materials ........................................................................................................1 Results and Testing........................................................................................4 Discussion......................................................................................................5 12.5 mm NMAS Summary ............................................................................7 25.0 mm NMAS Mixture...........................................................................................7 Materials ........................................................................................................7 Results and Testing........................................................................................11 Discussion......................................................................................................12 25.0 mm NMAS Summary ............................................................................14 Conclusions................................................................................................................14 Acknowledgement .....................................................................................................15 References..................................................................................................................16 Appendix A................................................................................................................17 Appendix B ................................................................................................................21
Prowell
-iv-
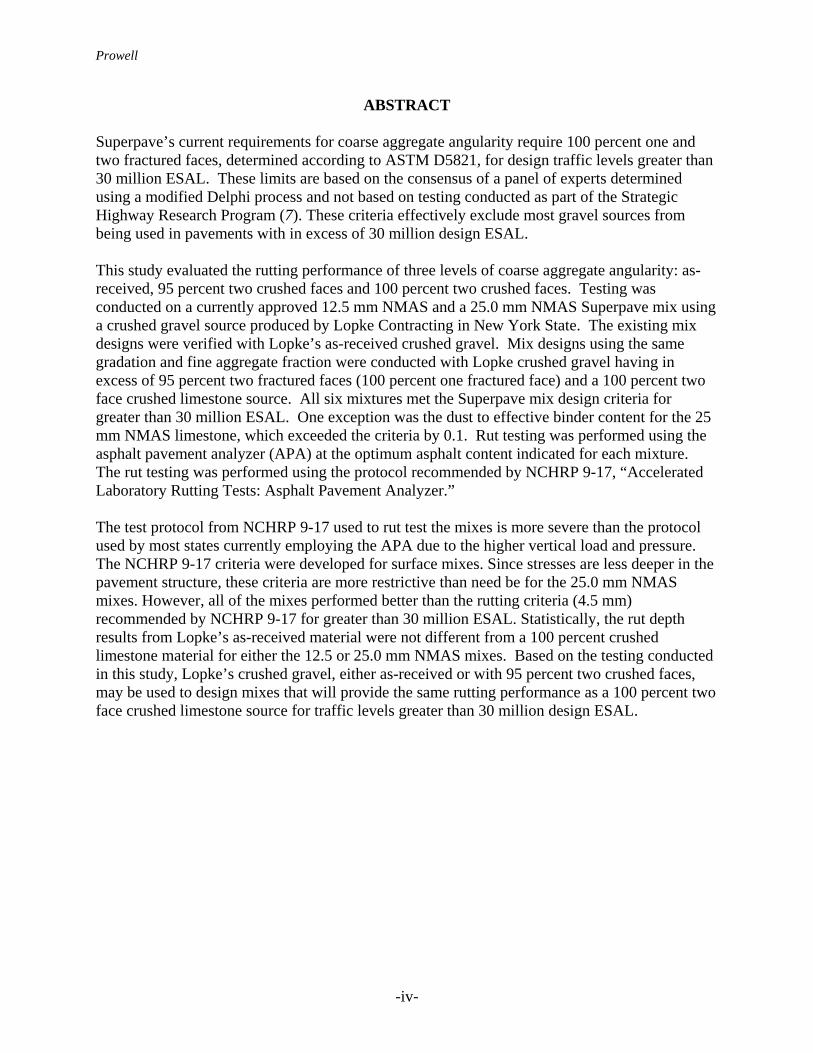
ABSTRACT Superpave’s current requirements for coarse aggregate angularity require 100 percent one and two fractured faces, determined according to ASTM D5821, for design traffic levels greater than 30 million ESAL. These limits are based on the consensus of a panel of experts determined using a modified Delphi process and not based on testing conducted as part of the Strategic Highway Research Program (7). These criteria effectively exclude most gravel sources from being used in pavements with in excess of 30 million design ESAL. This study evaluated the rutting performance of three levels of coarse aggregate angularity: as-received, 95 percent two crushed faces and 100 percent two crushed faces. Testing was conducted on a currently approved 12.5 mm NMAS and a 25.0 mm NMAS Superpave mix using a crushed gravel source produced by Lopke Contracting in New York State. The existing mix designs were verified with Lopke’s as-received crushed gravel. Mix designs using the same gradation and fine aggregate fraction were conducted with Lopke crushed gravel having in excess of 95 percent two fractured faces (100 percent one fractured face) and a 100 percent two face crushed limestone source. All six mixtures met the Superpave mix design criteria for greater than 30 million ESAL. One exception was the dust to effective binder content for the 25 mm NMAS limestone, which exceeded the criteria by 0.1. Rut testing was performed using the asphalt pavement analyzer (APA) at the optimum asphalt content indicated for each mixture. The rut testing was performed using the protocol recommended by NCHRP 9-17, “Accelerated Laboratory Rutting Tests: Asphalt Pavement Analyzer.” The test protocol from NCHRP 9-17 used to rut test the mixes is more severe than the protocol used by most states currently employing the APA due to the higher vertical load and pressure. The NCHRP 9-17 criteria were developed for surface mixes. Since stresses are less deeper in the pavement structure, these criteria are more restrictive than need be for the 25.0 mm NMAS mixes. However, all of the mixes performed better than the rutting criteria (4.5 mm) recommended by NCHRP 9-17 for greater than 30 million ESAL. Statistically, the rut depth results from Lopke’s as-received material were not different from a 100 percent crushed limestone material for either the 12.5 or 25.0 mm NMAS mixes. Based on the testing conducted in this study, Lopke’s crushed gravel, either as-received or with 95 percent two crushed faces, may be used to design mixes that will provide the same rutting performance as a 100 percent two face crushed limestone source for traffic levels greater than 30 million design ESAL.

Prowell
1
RUTTING EVALUATION OF LOPKE AGGREGATE BLENDS
Brian D. Prowell SCOPE Lopke Contracting provided aggregate to NCAT to evaluate the affect of coarse aggregate fractured faces on rutting susceptibility. Superpave currently specifies 100 percent one and two fractured faces for design traffic in excess of 30 million equivalent single axle loads (ESALs). Two mix designs were used in the study, a 12.5 mm nominal maximum aggregate size (NMAS) and a 25.0 mm NMAS. Barrett Paving completed both mix designs for roadways with less than 30 million design ESALs. The rutting susceptibility of a given mixture (12.5 or 25.0 mm NMAS) produced with three levels of two fractured faces was compared. The three levels for two fractured faces were Lopke’s current stockpile (approximately 90), 95 and 100 percent. The purpose of this study was to evaluate whether 100 percent two fractured faces provided a statistically more rut resistant mix than 95 or the current as-received percent crushed faces. 12.5 MM NMAS MIXTURE Materials Lopke Contracting provided aggregate to NCAT to produce three variations of a 12.5 mm NMAS Superpave mix. The three variations of the 12.5 mm NMAS mix design included coarse aggregates representing three levels of two fractured faces: current production stockpile, 95 and 100 percent. The three variations were referred to as as-received, 100/95 and 100/100 to represent the target percent fractured faces. The as-received production and 100/95 materials were samples of Lopke’s crushed gravel. The 100/100 material was a crushed limestone source. Coarse aggregates from two stockpiles: 1 and 1A were provided for the 12.5 mm NMAS mixture from each target fractured face level.
Washed gradations were performed by NCAT according to AASHTO T11 on the materials provided. The stockpile gradations are shown in Table 1. The fractured faces counts were tested according to ASTM D5821. The results for each stockpile and the blend average are reported in Table 2. Table 2 indicates that the as-received material had a blend percent two fractured faces of 90.4 percent. The 100/95 material actually had a blend percent two fractured faces of 98.2 percent. Lopke reports that the percent one crushed face results for the as-received material are somewhat higher than expected based on historical data. Hand et al (1) report the expected difference between two properly conducted tests in two different laboratories to be 5.1 percent. This indicates the somewhat subjective nature of ASTM D5821.
The aggregates were combined to meet a mix design provided by Lopke Contracting. The 12.5 mm NMAS mix design was from Barrett Paving’s Vestal location, job mix formula (JMF) No. 02092532, dated January 16, 2002. The design asphalt content for the 12.5 mm NMAS mix was 5.5 percent. The design asphalt content was determined for a design traffic level of less than 3 million ESAL using Ndesign = 100 gyrations. Barret’s mix design was used as a starting point for

Prowell
2
Table 1: 12.5 mm NMAS Stockpile Gradations (Percent Passing)
Lopke As-Received Lopke 100/95 Limestone 100/100 Lopke Common Fine Aggregate
Sieve Size (in)
Sieve Size (mm)
1 1A
1 1A
1 1A
Manufactured Sand
Natural Sand
¾ 19.0 100 100 100 100 100 100 100 100 ½ 12.5 96.8 100 96.0 100 96.3 100 100 100
3/8 9.5 73.7 100 58.5 100 57.2 100 100 100 #4 4.75 4.3 54.9 1.4 49.4 4.2 52.7 99.0 99.6 #8 2.36 2.0 2.6 1.0 1.6 3.4 5.8 72.3 90.8 #16 1.18 1.7 1.1 1.0 0.8 3.1 3.6 42.2 64.1 #30 0.600 1.7 1.1 1.0 0.8 2.9 3.2 28.3 36.7 #50 0.300 1.6 1.1 1.0 0.8 2.8 2.9 21.4 14.0 #100 0.150 1.6 1.1 1.0 0.8 2.8 2.9 17.3 6.6 #200 0.075 1.5 1.0 1.0 0.8 2.7 2.9 13.7 3.6
Table 2: 12.5 mm NMAS Fractured Face Count
Lopke As-Received Lopke 100/95 Limestone 100/100 Stockpile Percent One
Fractured Face
Percent Two Fractured
Faces
Percent One Fractured
Face
Percent Two Fractured
Faces
Percent One Fractured
Face
Percent Two Fractured
Faces 1 100 85.4 100 97.4 100 100 1A 100 97.9 100 98.7 100 100 Blend 100 90.4 100 98.2 100 100
Prowell
3
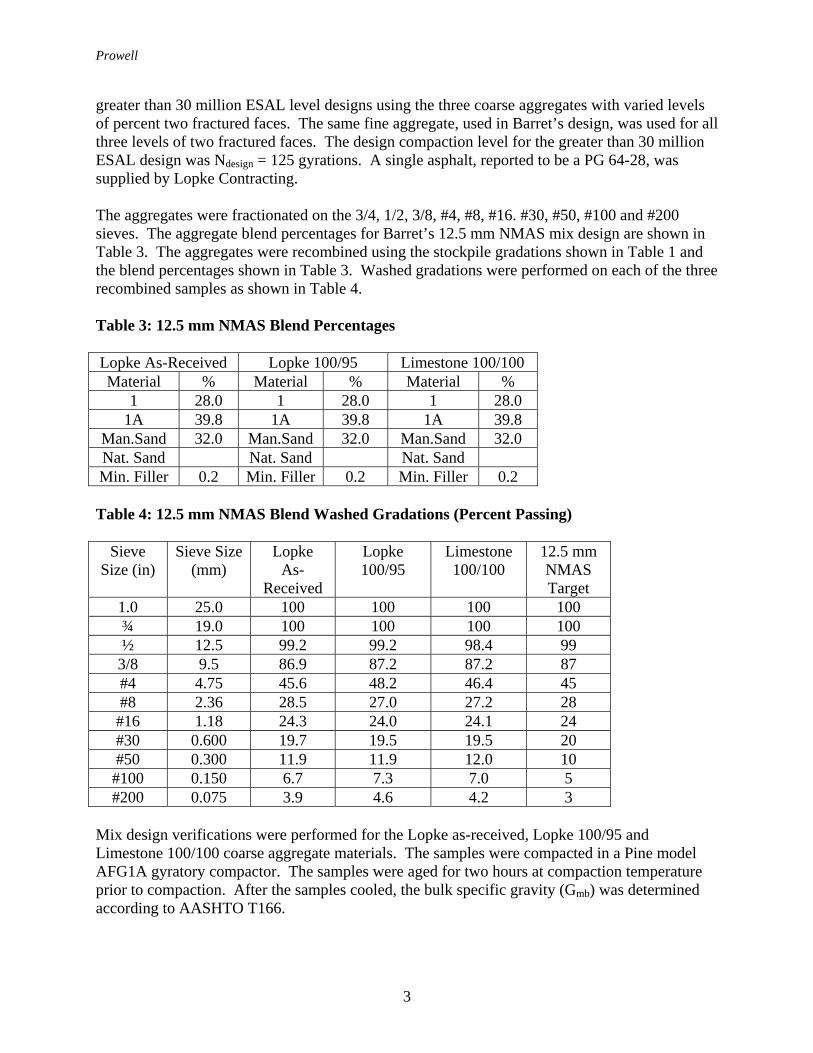
greater than 30 million ESAL level designs using the three coarse aggregates with varied levels of percent two fractured faces. The same fine aggregate, used in Barret’s design, was used for all three levels of two fractured faces. The design compaction level for the greater than 30 million ESAL design was Ndesign = 125 gyrations. A single asphalt, reported to be a PG 64-28, was supplied by Lopke Contracting. The aggregates were fractionated on the 3/4, 1/2, 3/8, #4, #8, #16. #30, #50, #100 and #200 sieves. The aggregate blend percentages for Barret’s 12.5 mm NMAS mix design are shown in Table 3. The aggregates were recombined using the stockpile gradations shown in Table 1 and the blend percentages shown in Table 3. Washed gradations were performed on each of the three recombined samples as shown in Table 4.
Table 3: 12.5 mm NMAS Blend Percentages
Lopke As-Received Lopke 100/95 Limestone 100/100 Material % Material % Material %
1 28.0 1 28.0 1 28.0 1A 39.8 1A 39.8 1A 39.8
Man.Sand 32.0 Man.Sand 32.0 Man.Sand 32.0 Nat. Sand Nat. Sand Nat. Sand Min. Filler 0.2 Min. Filler 0.2 Min. Filler 0.2
Table 4: 12.5 mm NMAS Blend Washed Gradations (Percent Passing)
Sieve Size (in)
Sieve Size (mm)
Lopke As-
Received
Lopke 100/95
Limestone 100/100
12.5 mm NMAS Target
1.0 25.0 100 100 100 100 ¾ 19.0 100 100 100 100 ½ 12.5 99.2 99.2 98.4 99
3/8 9.5 86.9 87.2 87.2 87 #4 4.75 45.6 48.2 46.4 45 #8 2.36 28.5 27.0 27.2 28 #16 1.18 24.3 24.0 24.1 24 #30 0.600 19.7 19.5 19.5 20 #50 0.300 11.9 11.9 12.0 10 #100 0.150 6.7 7.3 7.0 5 #200 0.075 3.9 4.6 4.2 3
Mix design verifications were performed for the Lopke as-received, Lopke 100/95 and Limestone 100/100 coarse aggregate materials. The samples were compacted in a Pine model AFG1A gyratory compactor. The samples were aged for two hours at compaction temperature prior to compaction. After the samples cooled, the bulk specific gravity (Gmb) was determined according to AASHTO T166.

Prowell
4
The volumetric properties at the optimum asphalt content are summarized in Table 5 for each of the three target fractured face count levels. The complete volumetric data are shown in Appendix A. There is a trend of increasing VMA with increasing fractured face count. The design asphalt content of the two Lopke blends are the same at 5.8 percent. This is 0.3 percent higher than the optimum asphalt content reported by Barret for the less than 3 million ESAL design. The limestone coarse aggregate produces lower design asphalt content even with the higher VMA due to the lower water absorption of the aggregate. Mixtures produced with all three levels of fractured faces met all of the Superpave volumetric criteria.
Table 5: 12.5 mm NMAS Volumetric Properties Property Lopke
As-Received Lopke 100/95
Limestone 100/100
Optimum AC% 5.8 5.8 5.5 Air Voids, % 4.0 4.0 4.0 VMA, % 14.5 14.8 15.1 VFA, % 72.7 72.2 73.6 Dust to Asphalt Ratio 0.8 1.1 1.1 % Gmm at Nini 86.2 85.8 86.1 Gmm 2.443 2.444 2.489 Blend Gsb 2.586 2.591 2.659 Once the optimum asphalt content for each level of fractured faces was determined, a total of six gyratory samples were prepared for each of the three combinations described above for testing in the Asphalt Pavement Analyzer (APA). The samples were again aged for two hours at compaction temperature and compacted to Ndesign. The draft APA protocol requires the sample air voids to be 4 ± 0.5 percent (2). Results and Testing The gyratory samples were tested in the APA to determine their rutting susceptibility. The APA is based on the Georgia loaded-wheel tester. The Georgia Department of Transportation (DOT) has used this procedure to qualify mixes since 1990 (3). The samples were tested at 58 °C, 120 lb vertical load and 120-psi hose pressure. The 58 ºC temperature corresponds to the base climatic high temperature recommended by LTPPBind for New York state (4). This combination of test parameters corresponds to the current recommendations from NCHRP 9-17 (2). The 120 lb vertical load and 120 psi hose pressure is more severe than the procedure originated by Georgia DOT, which specifies a 100 lb vertical load and 100-psi hose pressure. The higher vertical load and hose pressure were adopted by NCHRP 9-17 based on testing conducted by Williams and Prowell (5) on samples taken from WesTrack. Eight thousand cycles (16,000 passes) were applied to the samples. The measured rut depths are the difference between pre- and post-test manual measurements. The individual rut depths and the corresponding sample air voids are shown in Table 6. The draft AASHTO Provisional Test Method for the APA specifies averaging the results from the two cylinders loaded with a given air hose.

Prowell
5
Table 6: 12.5 mm NMAS APA Rut Depths and Tukey’s Rankings
Lopke As-Received Lopke 100/95 Limestone 100/100 Sample Air Voids,
% Rut
Depth, mm
Air Voids, %
Rut Depth,
mm
Air Voids, %
Rut Depth,
mm 1 a 3.7 7.15 4.0 5.07 3.5 2.02 1 b 4.3 3.85 3.8 4.62 4.1 2.63 2 a 3.6 3.16 4.0 3.87 4.2 2.92 2 b 3.7 3.03 4.5 3.97 4.2 2.67 3 a 3.6 3.22 4.1 3.48 4.2 3.86 3 b 4.3 4.11 4.5 4.91 3.8 2.11 Average 3.9 4.09 4.2 4.32 4 2.70 Standard Deviation
0.34 1.56 0.29 0.64 0.29 0.66
APA Average by Position 1 5.50 4.85 2.33 2 3.10 3.92 2.80 3 3.67 4.20 2.99 Tukey’s Ranking1
A
A
A
1Means with the same letter are not statistically different at a 95 percent confidence level Discussion One of the concerns about the implementation of most performance tests, including the APA, is the variability of results from sample to sample. Sample 1a of the Lopke as-received material appears to be an outlier with approximately twice the rutting of the other Lopke as-received samples. There was insufficient material remaining to replicate the test. Grubb’s outlier test identifies the sample as an outlier at the 1 percent significance level (99 percent confidence) (7). However, the draft AASHTO procedure, “Determining Rutting Susceptibility of Asphalt Paving Mixtures Using the Asphalt Paving Analyzer (APA),” includes an outlier analysis that states if the standard deviation of the three positions (left, center and right) is less than 2.0 mm than all of the data should be averaged. As shown in Table 6, all of the mixes tested meet this criterion. Therefore, the Lopke as-received sample 1a was not removed as an outlier. The rut depth for sample 1a is consistent with the level of variability expected with APA test results. Rutting criteria as a function of ESALs have been recommended by several states and NCHRP 9-17, “Accelerated Laboratory Rutting Tests: Asphalt Pavement Analyzer.” NCHRP 9-17 specifies that the tests be conducted on SGC cylinders, compacted to 4 ± 0.5 percent air voids. The tests are to be conducted at the base climatic high temperature for the locale (58 ºC). Loading is applied for 8,000 cycles with a 120 lb vertical load and 120 psi hose pressure. The 120 lb vertical load and 120 psi hose pressure are more severe than the test method used by Georgia DOT.

Prowell
6
The limestone mixture with 100 percent two crushed faces has the lowest average rut depth followed by the Lopke as-received and Lopke 95 percent two crushed faces. Based on NCHRP 9-17, the recommended criterion for greater than 30 million design ESALs is less than 4.5 mm of rutting (2). The HMA produced with all three levels of percent two fractured faces meets this requirement. All three mixes also meet Alabama’s, Georgia’s and Utah’s APA rut depth criteria for high traffic pavements (4.5, 5, and 5 mm, respectively). All three states specify testing be conducted at the base climatic PG high temperature with only a 100 lb vertical load and 100-psi hose pressure. More severe criteria were used for the testing discussed herein.
Two tests were performed to statistically compare the results, an F-test to compare the variability of the results from one mix design to another and a t-test to compare the population means of the test results. The results from the limestone 100 percent two crushed faces were compared to both the Lopke as-received percent two crushed faces and the Lopke 95 percent two crushed faces in two separate analyses. The F-test indicated that the rut test results for all three mixes had similar variability.
The t-test was used to compare the magnitude of the APA rut test results. A two- sample t-test for results with equal variances was performed to compare the mixes. The null hypothesis was that the difference between the average APA rut depths for any two mixes was zero. The calculated t-value (one-tailed, e.g. if there was a difference, it was expected that 100 percent two fractured faces would produce less rutting) when comparing the Lopke as-received to the 100 percent two fractured faces of 1.84 was less than the critical t-value 2.13. Therefore, at the 95 percent confidence level, we can accept the null hypothesis and state that the amount of rutting measured using the APA for Lopke as-received and the limestone 100 percent two crushed faces were not different.
The same t-test was used to compare the Lopke 95 percent two fractured faces to the Limestone 100 percent two fractured faces. The calculated t-value, 4.80, was greater than the critical t-value of 2.13. Thus, we would reject the null hypothesis and state that the mix with Lopke 95 percent two crushed face aggregate had more rutting than the mix with the limestone 100 percent two fractured faces at the 95 percent confidence level. A comparison was also performed between the two Lopke mixes. The calculated t-value of 0.30 was less than t-critical, 2.13, indicating the rut depths of the two mixes were not different.
Analysis of variance (ANOVA) and Tukey’s pairwise comparisons were performed with Minitab Statistical software. The one-way ANOVA was performed with APA rut depth as the response and percent crushed faces as the factor. The calculated p-value = 0.094 indicated that percent crushed faces was not significant at the 95 percent confidence level. Tukey’s pairwise comparisons also indicated that all three mixes would be ranked the same. This indicates that the Lopke mixes and the 100 percent two crushed faces limestone mixture are expected to provide the same rut resistance.
Prowell
7
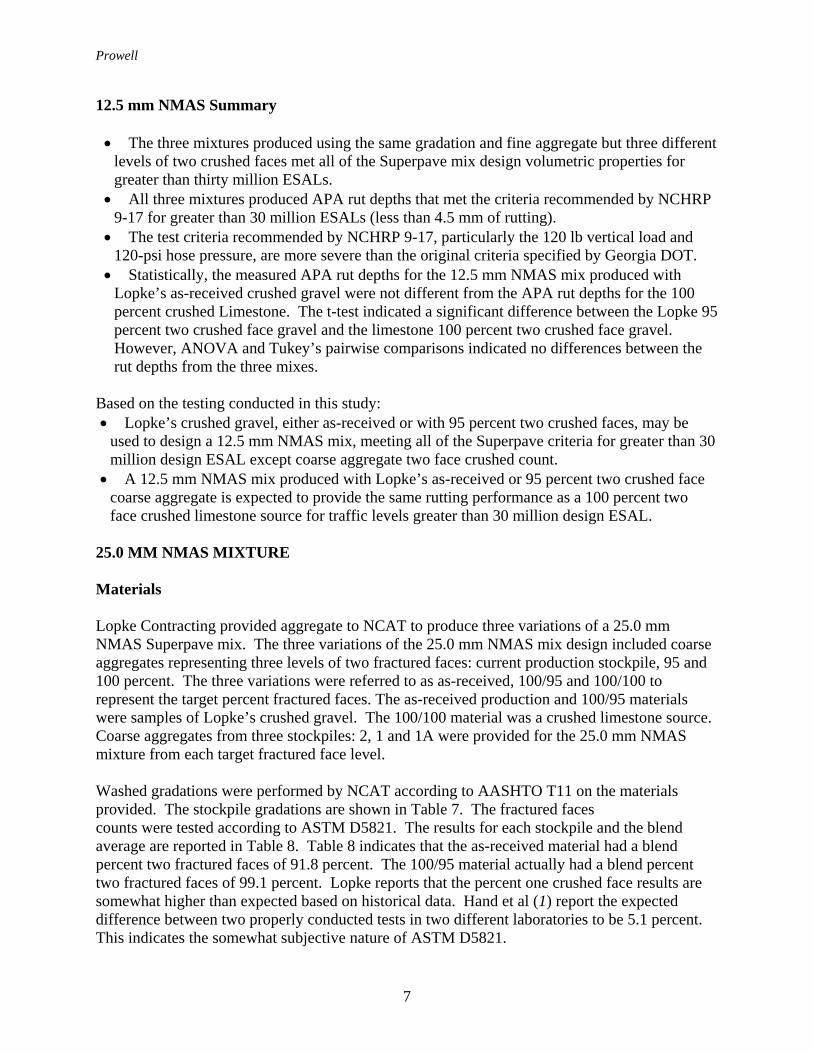
12.5 mm NMAS Summary
• The three mixtures produced using the same gradation and fine aggregate but three different levels of two crushed faces met all of the Superpave mix design volumetric properties for greater than thirty million ESALs.
• All three mixtures produced APA rut depths that met the criteria recommended by NCHRP 9-17 for greater than 30 million ESALs (less than 4.5 mm of rutting).
• The test criteria recommended by NCHRP 9-17, particularly the 120 lb vertical load and 120-psi hose pressure, are more severe than the original criteria specified by Georgia DOT.
• Statistically, the measured APA rut depths for the 12.5 mm NMAS mix produced with Lopke’s as-received crushed gravel were not different from the APA rut depths for the 100 percent crushed Limestone. The t-test indicated a significant difference between the Lopke 95 percent two crushed face gravel and the limestone 100 percent two crushed face gravel. However, ANOVA and Tukey’s pairwise comparisons indicated no differences between the rut depths from the three mixes.
Based on the testing conducted in this study: • Lopke’s crushed gravel, either as-received or with 95 percent two crushed faces, may be
used to design a 12.5 mm NMAS mix, meeting all of the Superpave criteria for greater than 30 million design ESAL except coarse aggregate two face crushed count.
• A 12.5 mm NMAS mix produced with Lopke’s as-received or 95 percent two crushed face coarse aggregate is expected to provide the same rutting performance as a 100 percent two face crushed limestone source for traffic levels greater than 30 million design ESAL.
25.0 MM NMAS MIXTURE Materials Lopke Contracting provided aggregate to NCAT to produce three variations of a 25.0 mm NMAS Superpave mix. The three variations of the 25.0 mm NMAS mix design included coarse aggregates representing three levels of two fractured faces: current production stockpile, 95 and 100 percent. The three variations were referred to as as-received, 100/95 and 100/100 to represent the target percent fractured faces. The as-received production and 100/95 materials were samples of Lopke’s crushed gravel. The 100/100 material was a crushed limestone source. Coarse aggregates from three stockpiles: 2, 1 and 1A were provided for the 25.0 mm NMAS mixture from each target fractured face level.
Washed gradations were performed by NCAT according to AASHTO T11 on the materials provided. The stockpile gradations are shown in Table 7. The fractured faces counts were tested according to ASTM D5821. The results for each stockpile and the blend average are reported in Table 8. Table 8 indicates that the as-received material had a blend percent two fractured faces of 91.8 percent. The 100/95 material actually had a blend percent two fractured faces of 99.1 percent. Lopke reports that the percent one crushed face results are somewhat higher than expected based on historical data. Hand et al (1) report the expected difference between two properly conducted tests in two different laboratories to be 5.1 percent. This indicates the somewhat subjective nature of ASTM D5821.

Prowell
8
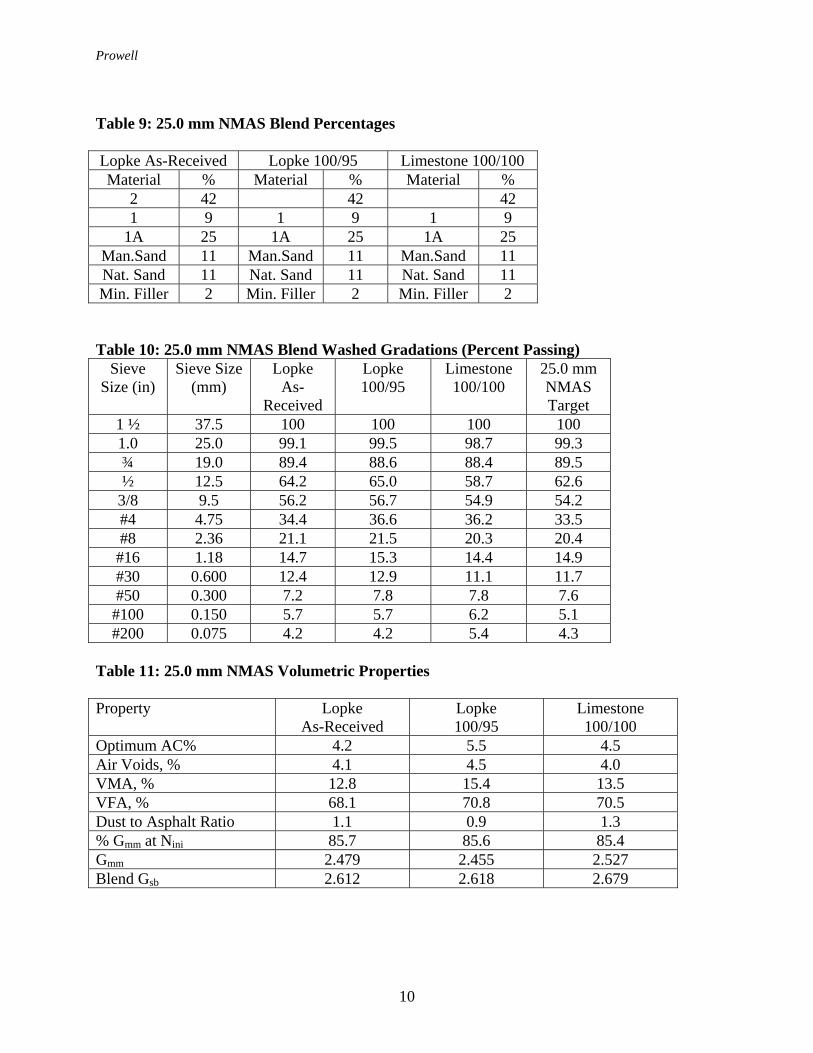
The aggregates were combined to meet a mix design provided by Lopke Contracting. The 25.0 mm NMAS mix design was from Barrett Paving’s Vestal location, JMF No. 98092510, dated June 8, 1998. The design asphalt content for the 25.0 mm NMAS mix was 4.2 percent. The design asphalt content was determined for a design traffic level of less than 10 million ESAL using Ndesign = 100 gyrations. Barret’s mix design was used as a starting point for greater than 30 million ESAL level designs using the three coarse aggregates with varied levels of percent two fractured faces. The same fine aggregate, used in Barret’s design, was used for all three levels of two fractured faces. The design compaction level for the greater than 30 million ESAL design was Ndesign = 125 gyrations. A single asphalt, reported to be a PG 64-28, was supplied by Lopke Contracting. The aggregates were fractionated on the 1 ½, 1, ¾, ½, 3/8, #4, #8, #16. #30, #50, #100 and #200 sieves. The aggregate blend percentages for Barret’s 25.0 mm NMAS mix design are shown in Table 9. The aggregates were recombined using the stockpile gradations shown in Table 7 and the blend percentages shown in Table 7. Washed gradations were performed on each of the three recombined samples as shown in Table 10.
Mix design verifications were performed for the Lopke as-received, Lopke 100/95 and Limestone 100/100 coarse aggregate materials. The samples were compacted in a Pine model AFG1A gyratory compactor. The samples were aged for two hours at compaction temperature prior to compaction. After the samples cooled, the bulk specific gravity (Gmb) was determined according to AASHTO T166.
The volumetric properties at the optimum asphalt content are summarized in Table 11 for each of the three target fractured face count levels. The complete volumetric data are shown in Appendix B. The mixture produced with the Lopke as-received aggregate matched the optimum asphalt content reported by Barret for a less than 10 million ESAL design. The Lopke 100/95 blend produced a higher VMA (15.0 percent at 5.0 percent AC) and optimum asphalt content (5.5 percent) than the Lopke as-received material. Investigations were conducted to verify this result. The gradation of the first design matched the data shown in Table 10. Since this design was approximately 3 percent finer on the No. 4 sieve than the target job mix formula, new samples were prepared such that the percent passing the No. 4 sieve was 33.6 percent without changing the gradation on the other sieves. As shown in Appendix B, samples were prepared at 4.2, 5.0, 5.5, and 6.0 percent asphalt content. This blend also indicated an optimum asphalt content of 5.5 percent.
The VMA for Lopke’s 100/95 blend was 2.6 percent higher than Lopke’s as-received blend. Superpave’s rule of thumb that states that an increase in asphalt content of 0.4 percent will decrease the air voids by 1.0 percent. Therefore, the increase in asphalt content between Lopke’s as-received and 100/95 blend appears reasonable. Mixtures produced with all three levels of fractured faces met all of the Superpave volumetric criteria. Other than the percent fractured faces for the Lopke coarse aggregate, the only exception to the Superpave criteria for greater than 30 million ESAL was the dust to effective binder content for the Limestone mixture. The calculated value, 1.3 was higher than the 1.2

Prowell
9
Table 7: 25.0 mm NMAS Stockpile Gradations (Percent Passing)
Lopke As-Recieved Lopke 100/95 Limestone 100/100 Lopke Common Fine Aggregate
Sieve Size (in)
Sieve Size (mm) 2 1 1A 2 1 1A 2 1 1A Manufactured
Sand Natural Sand
1 ½ 37.5 100 100 100 100 100 100 100 100 100 100 100 1 25.0 98.4 100 100 97.4 100 100 93.8 100 100 100 100 ¾ 19.0 71.2 100 100 78.4 100 100 47.6 100 100 100 100 ½ 12.5 12.5 96.8 100 20.1 96.0 100 3.2 96.3 100 100 100
3/8 9.5 1.7 73.7 100 1.3 58.5 100 1.6 57.2 100 100 100 #4 4.75 1.2 4.3 54.9 0.6 1.4 49.4 1.6 4.2 52.7 99.0 99.6 #8 2.36 1.2 2.0 2.6 0.6 1.0 1.6 1.6 3.4 5.8 72.3 90.8 #16 1.18 1.1 1.7 1.1 0.6 1.0 0.8 1.6 3.1 3.6 42.2 64.1 #30 0.600 1.1 1.7 1.1 0.6 1.0 0.8 1.6 2.9 3.2 28.3 36.7 #50 0.300 1.1 1.6 1.1 0.6 1.0 0.8 1.6 2.8 2.9 21.4 14.0 #100 0.150 1.1 1.6 1.1 0.6 1.0 0.8 1.6 2.8 2.9 17.3 6.6 #200 0.075 1.0 1.5 1.0 0.6 1.0 0.8 1.5 2.7 2.9 13.7 3.6
Table 8: 25.0 mm NMAS Fractured Face Count
Lopke As-Received Lopke 100/95 Limestone 100/100 Stockpile Percent One
Fractured Face
Percent Two Fractured
Faces
Percent One Fractured
Face
Percent Two Fractured
Faces
Percent One Fractured
Face
Percent Two Fractured
Faces 2 100 89.6 100 99.9 100 100 1 100 85.4 100 97.4 100 100 1A 100 97.9 100 98.7 100 100 Blend 100 91.8 100 99.1 100 100
Prowell
10
Table 9: 25.0 mm NMAS Blend Percentages
Lopke As-Received Lopke 100/95 Limestone 100/100 Material % Material % Material %
2 42 42 42 1 9 1 9 1 9
1A 25 1A 25 1A 25 Man.Sand 11 Man.Sand 11 Man.Sand 11 Nat. Sand 11 Nat. Sand 11 Nat. Sand 11 Min. Filler 2 Min. Filler 2 Min. Filler 2
Table 10: 25.0 mm NMAS Blend Washed Gradations (Percent Passing) Sieve
Size (in) Sieve Size
(mm) Lopke
As-Received
Lopke 100/95
Limestone 100/100
25.0 mm NMAS Target
1 ½ 37.5 100 100 100 100 1.0 25.0 99.1 99.5 98.7 99.3 ¾ 19.0 89.4 88.6 88.4 89.5 ½ 12.5 64.2 65.0 58.7 62.6
3/8 9.5 56.2 56.7 54.9 54.2 #4 4.75 34.4 36.6 36.2 33.5 #8 2.36 21.1 21.5 20.3 20.4 #16 1.18 14.7 15.3 14.4 14.9 #30 0.600 12.4 12.9 11.1 11.7 #50 0.300 7.2 7.8 7.8 7.6 #100 0.150 5.7 5.7 6.2 5.1 #200 0.075 4.2 4.2 5.4 4.3
Table 11: 25.0 mm NMAS Volumetric Properties Property Lopke
As-Received Lopke 100/95
Limestone 100/100
Optimum AC% 4.2 5.5 4.5 Air Voids, % 4.1 4.5 4.0 VMA, % 12.8 15.4 13.5 VFA, % 68.1 70.8 70.5 Dust to Asphalt Ratio 1.1 0.9 1.3 % Gmm at Nini 85.7 85.6 85.4 Gmm 2.479 2.455 2.527 Blend Gsb 2.612 2.618 2.679

Prowell
11
allowed by Superpave. This would tend to stiffen the binder and improve the rutting performance of the limestone mixture.
Once the optimum asphalt content for each level of fractured faces was determined, a total of six gyratory samples were prepared for each of the three combinations described above for testing in the APA. The samples were again aged for two hours at compaction temperature and compacted to Ndesign. The draft APA protocol requires the sample air voids to be 4 ± 0.5 percent (2). Results and Testing The gyratory samples were tested in the APA to determine their rutting susceptibility. The APA is based on the Georgia loaded-wheel tester. The Georgia Department of Transportation (DOT) has used this procedure to qualify mixes since 1990 (3). The samples were tested at 58 °C, 120 lb vertical load and 120-psi hose pressure. The 58 ºC temperature corresponds to the base climatic high temperature recommended by LTPPBind for New York state (4). This combination of test parameters corresponds to the current recommendations from NCHRP 9-17 (2). The 120 lb vertical load and 120 psi hose pressure is more severe than the procedure originated by Georgia DOT, which specifies a 100 lb vertical load and 100-psi hose pressure. The higher vertical load and hose pressure were adopted by NCHRP 9-17 based on testing conducted by Williams and Prowell (5) on samples taken from WesTrack. Eight thousand cycles (16,000 passes) were applied to the samples. The measured rut depths are the difference between pre- and post-test manual measurements. The individual rut depths and the corresponding sample air voids are shown in Table 12. The draft AASHTO Provisional Test Method for the APA specifies averaging the results from the two cylinders loaded with a given air hose. The APA results for the 25.0 mm NMAS mixes by position are shown in Table 12. Table 12: 25.0 mm NMAS APA Rut Depths and Tukey’s Rankings
Lopke As-Received Lopke 100/95 Limestone 100/100 Sample Air
Voids, % Rut
Depth,mm Air
Voids, % Rut Depth,
mm Air
Voids, % Rut Depth,
mm 1 a 4.3 4.25 4.2 3.26 4.2 3.81 1 b 4.0 4.55 3.6 5.30 3.9 2.91 2 a 4.4 0.96 4.2 6.09 4.1 3.61 2 b 4.3 2.67 3.5 6.34 3.9 3.41 3 a 3.7 2.79 3.8 2.42 4.3 4.43 3 b 4.2 2.25 3.7 3.78 3.4 3.20 Average 4.2 2.91 3.8 4.53 4.0 3.56 Standard Deviation
0.26 1.33 0.30 1.61 0.32 0.53
APA Average by Position 1 4.40 4.28 3.36 2 1.82 6.22 3.51 3 2.52 3.10 3.82 Tukey’s Ranking
A
A
A

Prowell
12
Discussion The rut depths on samples 2a and 2b for Lopke’s 100/95 mixture appear to be somewhat higher than the remaining four tests. The draft AASHTO procedure, “Determining Rutting Susceptibility of Asphalt Paving Mixtures Using the Asphalt Paving Analyzer (APA),” includes an outlier analysis that states if the standard deviation of the three positions (left, center and right) is less than 2.0 mm than all of the data should be averaged. As shown in Table 12, all of the mixes tested meet this criterion. The rut depth data for samples 2a and 2b of Lopke’s 100/95 blend are within the accepted variability of the test method. Rutting criterion as a function of ESALs have been recommended by several states and NCHRP 9-17, “Accelerated Laboratory Rutting Tests: Asphalt Pavement Analyzer.” NCHRP 9-17 specifies that the tests be conducted on SGC cylinders, compacted to 4 ± 0.5 percent air voids. The tests are to be conducted at the base climatic high temperature for the locale (58ºC). Loading is applied for 8,000 cycles with a 120 lb vertical load and 120-psi hose pressure. The 120 lb vertical load and 120-psi hose pressure are more severe than test method used by Georgia DOT.
The Lopke as-received has the lowest average rut depth followed by the limestone mixture with 100 percent two crushed faces and Lopke 95 percent two crushed faces. Based on NCHRP 9-17, the recommended criterion for greater than 30 million design ESALs is less than 4.5 mm of rutting (2). The HMA produced with the Lopke as-received crushed gravel and limestone 100 percent two fractured faces produce less rutting than this requirement. The Lopke crushed gravel with 95 percent (target) two fractured faces was equal to the NCHRP 9-17 criterion. The NCHRP 9-17 requirements were developed for surface mixes. Since the 25.0 mm mix will be used as a lower lift and since stresses are less lower in the pavement structure, the NCHRP 9-17 criteria are most likely more stringent than necessary for a 25.0 mm NMAS lift. All three mixes also meet Alabama, Georgia’s and Utah’s APA rut depth criteria for high traffic pavements (4.5, 5, and 5 mm, respectively). All three states specify testing be conducted at the base climatic PG high temperature with only a 100 lb vertical load and 100-psi hose pressure. More severe criteria were used for the testing discussed herein. Two tests were performed to statistically compare the results, an F-test to compare the variability of the results from one mix design to another and a t-test to compare the population means of the test results. The results from the limestone 100 percent two crushed faces were compared to both the Lopke as-received percent two crushed faces and the Lopke 95 percent two crushed faces in two separate analyses. The F-test indicated that the rut test results for the two Lopke mixes were more variable than the results from the limestone mixture. The two rut depths results from the Lopke mixes had similar variability.
The t-test was used to compare the magnitude of the APA rut test results. A two- sample t-test for results with un-equal variances was performed to compare the Lopke mixes to the limestone mixture. The null hypothesis was that the difference between the average APA rut depths for any two mixes was zero. The calculated t-value (one-tailed, e.g. if there was a difference, it was expected that 100 percent two fractured faces would produce less rutting) when comparing the Lopke as-received to the 100 percent two fractured faces of –0.83 was less than the critical t-
Prowell
13
value 2.91. Therefore, at the 95 percent confidence level, we can accept the null hypothesis and state that the amount of rutting measured using the APA for Lopke as-received and the limestone 100 percent two crushed faces were not different.
The same t-test was used to compare the Lopke 95 percent two fractured faces to the Limestone 100 percent two fractured faces. The calculated t-value, 1.05, was less than the critical t-value of 2.92. Therefore, at the 95 percent confidence level, we can accept the null hypothesis and state that the amount of rutting measured using the APA for Lopke’s 95 percent two fractured faces and the limestone 100 percent two crushed faces were not different. A comparison was also performed between the two Lopke mixes with a t-test for equal sample variances. The calculated t-value of –1.36 was less than t-critical, 2.13, indicating the rut depths of the two mixes were not different.
ANOVA and Tukey’s pairwise comparisons were performed with Minitab Statistical software. The one-way ANOVA was performed with APA rut depth as the response and percent crushed faces as the factor. The calculated p-value = 0.32 indicated that percent crushed faces was not significant at the 95 percent confidence level. Tukey’s pairwise comparisons also indicated that all three mixes would be ranked the same. This indicates that the Lopke mixes and the 100 percent two crushed faces limestone mixture are expected to provide the same rut resistance. 25.0 mm NMAS Summary
• The three mixtures produced using the same gradation and fine aggregate but three different levels of two crushed faces met all of the Superpave volumetric mix design criteria for greater than thirty million ESALs.
• All three mixtures produced APA rut depths that met the criteria recommended by NCHRP 9-17 for greater than 30 million ESALs. Based on the depth in the pavement structure that the 25.0 mm mixes will likely be used, the NCHRP 9-17 criteria are most likely more stringent than necessary.
• Statistically, the measured APA rut depths for the two Lopke mixes were not different from the limestone mix with 100 percent two fractured faces. ANOVA and Tukey’s pairwise comparisons also indicated no differences between the rut depths from the three mixes.
Based on the testing conducted in this study: • Lopke’s crushed gravel, either as-received or with 95 percent two crushed faces, may be
used to design a 25.0 mm NMAS mix, meeting all of the Superpave criteria for greater than 30 million design ESAL except coarse aggregate two face crushed count.
• A 25.0 mm NMAS mix produced with Lopke’s as-received or 95 percent two crushed face coarse aggregate is expected to provide the same rutting performance as a 100 percent two face crushed limestone source for traffic levels greater than 30 million design ESAL.

Prowell
14
CONCLUSIONS Superpave’s current requirements for coarse aggregate angularity require 100 percent one and two fractured faces, determined according to ASTM D5821, for design traffic levels greater than 30 million ESAL. These limits are based on the consensus of a panel of experts determined using a modified Delphi process and not based on testing conducted as part of the Strategic Highway Research Program (7). These criteria effectively exclude most gravel sources from being used in pavements with in excess of 30 million design ESAL. This study evaluated the rutting performance of three levels of coarse aggregate two fractured faces. Testing was conducted on a currently approved 12.5 mm NMAS and a 25.0 mm NMAS Superpave mix using a crushed gravel source produced by Lopke Contracting in New York State. The existing mix designs were verified with Lopke’s as-received crushed gravel. Mix designs using the same gradation and fine aggregate fraction were conducted with Lopke crushed gravel having in excess of 95 percent two fractured faces (100 percent one fractured face) and a 100 percent two face crushed limestone source. All six mixtures met the Superpave mix design criteria for greater than 30 million ESAL. One exception was the dust to effective binder content for the 25 mm NMAS limestone, which exceeded the criteria by 0.1.
Rut testing was performed using the APA at the optimum asphalt content indicated for each mixture. The rut testing was performed using the protocol recommended by NCHRP 9-17, “Accelerated Laboratory Rutting Tests: Asphalt Pavement Analyzer.” The following conclusions can be made from the testing: • Mix designs meeting all of the Superpave criteria for greater than 30 million design ESALS,
except coarse aggregate two crushed faces, could be prepared with Lopke’s as-received gravel. • The test protocol from NCHRP 9-17 used to rut test the mixes is more severe than the
protocol used by most states currently employing the APA. • Since the NCHRP 9-17 criteria were developed for surface mixes, the criteria are most likely
more stringent than necessary since stresses are less, deeper in the pavement structure. • All of the mixes performed better than the rutting criteria (4.5 mm) recommended by
NCHRP 9-17 for greater than 30 million ESAL. • Statistically, the rut depth results from Lopke’s as-received material were not different from
a 100 percent crushed limestone material for either the 12.5 or 25.0 mm NMAS mixes. Based on the testing performed in this study, Lopke’s crushed gravel, either as-received or with 95 percent two crushed faces can be used to design a 12.5 or 25.0 mm NMAS Superpave mixture for greater than 30 million ESAL that will provide the same rutting performance as a limestone mixture with 100 percent two crushed faces. ACKNOWLEDGEMENT The author thanks F.S. Lopke Contracting for their support of this work. The author also thanks Rob Kennedy and Jim Scherocman for their assistance with this work.

Prowell
15
REFERENCES 1. Hand, A. J., Epps, J. A., and Sebaaly, P. E., “Precision of ASTM D 5821 Standard Test
Method for Determining the Percentage of Fractured Particles in Coarse Aggregate,” Journal of Testing and Evaluation, American Society for Testing and Materials, JTEVA, Vol. 28, No. 2, March 2000, pp. 67-76.
2. Kandhal, P, and L. Allen Cooley, Jr. “Accelerated Laboratory Rutting Tests: Asphalt Pavement Analyzer” Draft Final Report NCHRP 9-17, National Academies, Washington, DC, 2003.
3. Lai, J. S. and T. Lee. Use of a Loaded-Wheel Testing Machine to Evaluate Rutting of Asphalt Mixes. Transportation Research Record 1269. Washington, D.C.: Transportation Research Board, National Research Council. 1990.
4. Federal Highway Administration. LTPPBIND, Version 2.0. Washington, D. C. 1998. 5. Williams, R.C. and Prowell, B.D. Comparison of Laboratory Wheel Tracking Test
Results to WesTrack Performance. Transportation Research Record 1681. Transportation Research Board, National Academy of Sciences, Washington, DC, 1999. Pp. 121-128.
6. Taylor, J. T., Quality Assurance of Chemical Measurements Lewis Publishers Inc., Chelsea, Michigan, 1987.
7. Cominsky, R., Leahy, R. B., and Harrigan, E. T. Level One Mix Design: Materials Selection, Compaction, and Conditioning, SHRP A-408. Strategic Highway Research Program, National Research Council, Washington, DC. 1994.

Prowell
16
Appendix A

Prowell
17
Mixture Summary Report for Varying %AC Analysis Lopke 12.5 mm As-Received
Project Name: N Initial: 9 Workbook Name: 12.5 Lopke as received.xlsN Design: 125 Technician: N Max: 125 Date: Nom. Sieve Size: 12.5 mm Asphalt Grade: PG 64-28 Compaction Temperature: °C Mixture Temperature: °C Design ESAL's (millions): 30. Depth from Surface (mm): 0 mm Design Temperature: °C Mold Size: 150 mm Results
Property 5.5% 5.8% 6.0% 6.5% Criteria %AC 5.5 5.8 6.0 6.5
%Air Voids (Va) 5.5 4.0 3.2 1.4 4.0% %VMA 15.3 14.5 14.3 13.8 14.0% Min. %VFA 63.9 72.7 77.5 90.1 65.0% Min.
Dust/Asphalt Ratio 0.9 0.8 0.8 0.7 0.6 - 1.2% Max. Specific Gravity (Gmm) 2.454 2.443 2.436 2.418 Bulk Specific Gravity (Gmb) 2.319 2.346 2.358 2.385
%Gmm @ Nini 86.6 86.2 86.8 88.4 89.0% Max.
%Gmm @ Ndes 94.5 96.0 96.8 98.6 96.0% Max. Effective Sp. Gravity of Blend (Gse) 2.669 2.668 2.669 2.668 ---
Sp. Gravity of Binder (Gb) 1.030 1.030 1.030 1.030 --- Sp. Gravity of Aggregate (Gsb) 2.586 2.586 2.586 2.586 ---

Prowell
18
Mixture Summary Report for Varying %AC Analysis Lopke 100/95 12.5 mm
Project Name: N Initial: 9 Workbook Name: 12.5 Lopke 95 100.xls N Design: 125 Technician: N Max: 125 Date: Nom. Sieve Size: 12.5 mm Asphalt Grade: PG 64-28 Compaction Temperature: °C Mixture Temperature: °C Design ESAL's (millions): 30. Depth from Surface (mm): 0 mm Design Temperature: °C Mold Size: 150 mm Results
Property 5.0% 5.5% 5.8% Blend 4 Criteria %AC 5.0 5.5 5.8
%Air Voids (Va) 4.1 4.0% %VMA 14.8 14.0% Min. %VFA 72.2 65.0% Min.
75.0% Max. Dust/Asphalt Ratio 1.3 1.2 1.1 0.6 - 1.2%
Max. Specific Gravity (Gmm) 2.473 2.455 2.444 0.000 Bulk Specific Gravity (Gmb) 2.344
%Gmm @ Nini 85.8 89.0% Max.
%Gmm @ Ndes 95.9 96.0% Max. Effective Sp. Gravity of Blend (Gse) 2.670 2.670 2.670 ---
Sp. Gravity of Binder (Gb) 1.030 1.030 1.030 --- Sp. Gravity of Aggregate (Gsb) 2.591 2.591 2.591 ---

Prowell
19
Mixture Summary Report for Varying %AC Analysis Limestone 100 Percent Crushed 12.5 mm
Project Name: N Initial: 9 Workbook Name: 12.5 Limestone 100 100.xls N Design: 125 Technician: N Max: 125 Date: Nom. Sieve Size: 12.5 mm Asphalt Grade: PG 64-28 Compaction Temperature: °C Mixture Temperature: °C Design ESAL's (millions): 30. Depth from Surface (mm): 0 mm Design Temperature: °C Mold Size: 150 mm Results
Property 5.0% 5.5% 5.8% Blend 4 Criteria %AC 5.0 5.5 5.8
%Air Voids (Va) 5.8 4.0 2.7 4.0% %VMA 15.6 15.1 14.6 14.0% Min. %VFA 62.9 73.6 81.7 65.0% Min.
75.0% Max. Dust/Asphalt Ratio 1.2 1.1 1.0 0.6 - 1.2%
Max. Specific Gravity (Gmm) 2.508 2.489 2.478 0.000 Bulk Specific Gravity (Gmb) 2.363 2.390 2.412
%Gmm @ Nini 84.8 86.1 86.7 89.0% Max.
%Gmm @ Ndes 94.2 96.0 97.3 96.0% Max. Effective Sp. Gravity of Blend (Gse) 2.713 2.713 2.713 ---
Sp. Gravity of Binder (Gb) 1.030 1.030 1.030 --- Sp. Gravity of Aggregate (Gsb) 2.659 2.659 2.659 ---

Prowell
20
Appendix B

Prowell
21
Mixture Summary Report for Varying %AC Analysis Lopke As-Received 25.0 mm NMAS
Project Name: Lopke N Initial: 9 Workbook Name: Lopke 25.0 as received gravel.xlsN Design: 125 Technician: Kevin Williams N Max: 125 Date: Nom. Sieve Size: 25 mm Asphalt Grade: Compaction Temperature: °C Mixture Temperature: °C Design ESAL's (millions): 30. Depth from Surface (mm): 100 mm Design Temperature: °C Mold Size: 150 mm Results
Property 4.2 Blend 2 Blend 3 Blend 4 Criteria %AC 4.2
%Air Voids (Va) 4.1 4.0% %VMA 12.8 12.0% Min. %VFA 68.1 65.0% Min.
75.0% Max. Dust/Asphalt Ratio 1.1 0.6 - 1.2%
Max. Specific Gravity (Gmm) 2.479 0.000 0.000 0.000 Bulk Specific Gravity (Gmb) 2.378
%Gmm @ Nini 85.7 89.0% Max.
%Gmm @ Ndes 95.9 96.0% Max. Effective Sp. Gravity of Blend (Gse) 2.642 ---
Sp. Gravity of Binder (Gb) 1.030 --- Sp. Gravity of Aggregate (Gsb) 2.612 ---

Prowell
22
Mixture Summary Report for Varying %AC Analysis Lopke 100/95 25.0 mm NMAS
Project Name: Lopke N Initial: 9 Workbook Name: Lopke 25.0 95 100 II.xls N Design: 125 Technician: Kevin Williams N Max: 125 Date: Nom. Sieve Size: 25 mm Asphalt Grade: Compaction Temperature: °C Mixture Temperature: °C Design ESAL's (millions): 30. Depth from Surface (mm): 100 mm Design Temperature: °C Mold Size: 150 mm Results
Property 4.2 5.0 5.5 6.0 Criteria %AC 4.2 5.0 5.5 6.0
%Air Voids (Va) 7.4 4.9 4.5 3.5 4.0% %VMA 15.2 14.7 15.4 15.5 12.0% Min. %VFA 51.4 66.6 70.8 77.7 65.0% Min.
75.0% Max. Dust/Asphalt Ratio 1.2 1.0 0.9 0.8 0.6 - 1.2%
Max. Specific Gravity (Gmm) 2.503 2.473 2.455 2.437 Bulk Specific Gravity (Gmb) 2.319 2.352 2.345 2.353
%Gmm @ Nini 83.1 85.2 85.6 85.9 89.0% Max.
%Gmm @ Ndes 92.6 95.1 95.5 96.5 96.0% Max. Effective Sp. Gravity of Blend (Gse) 2.670 2.670 2.670 2.670 ---
Sp. Gravity of Binder (Gb) 1.030 1.030 1.030 1.030 --- Sp. Gravity of Aggregate (Gsb) 2.618 2.618 2.618 2.618 ---

Prowell
23
Mixture Summary Report for Varying %AC Analysis Limestone 100 Percent Crushed 25.0 mm NMAS
Project Name: Lopke N Initial: 9 Workbook Name: Lopke 25.0 limestone 100 100.xlsN Design: 125 Technician: Kevin Williams N Max: 125 Date: Nom. Sieve Size: 25 mm Asphalt Grade: Compaction Temperature: °C Mixture Temperature: °C Design ESAL's (millions): 30. Depth from Surface (mm): 100 mm Design Temperature: °C Mold Size: 150 mm Results
Property 4.2 4.5 Blend 3 Blend 4 Criteria %AC 4.2 4.5
%Air Voids (Va) 4.8 4.0 4.0% %VMA 13.6 13.5 12.0% Min. %VFA 64.7 70.3 65.0% Min.
75.0% Max. Dust/Asphalt Ratio 1.4 1.3 0.6 - 1.2%
Max. Specific Gravity (Gmm) 2.539 2.527 0.000 0.000 Bulk Specific Gravity (Gmb) 2.418 2.426
%Gmm @ Nini 84.6 85.5 89.0% Max.
%Gmm @ Ndes 95.2 96.0 96.0% Max. Effective Sp. Gravity of Blend (Gse) 2.713 2.713 ---
Sp. Gravity of Binder (Gb) 1.030 1.030 --- Sp. Gravity of Aggregate (Gsb) 2.679 2.679 ---


