44
Sample Reports – U.S.A. www.lwolf.com 1.866.CRY.WOLF(279.9653) Modified: 17/04/20

Sample Reports – U.S.A.
www.lwolf.com1.866.CRY.WOLF(279.9653)
Modified: 17/04/20

2
TABLE OF CONTENTS
Fundamental Management Tools2.P.4.1 Agent Ranking by Commission .............................................................................................................................. 32.P.5.3 Source of Business Report ..................................................................................................................................... 42.P.5.6 Commission Cutting Report.................................................................................................................................... 52.P.5.9 Business Analysis Report ....................................................................................................................................... 62.P.C.1 Commissions with Other Broker Report ................................................................................................................. 72.P.C.2 Other Contact Activity Report ................................................................................................................................. 88.5.C Agent Prior Year Comparison-By Commission ....................................................................................................... 98.F.2 Net Worth Report .................................................................................................................................................... 108.F.2 Agent Net Worth Summary Report ......................................................................................................................... 118.F.8 Agent Value Report ................................................................................................................................................ 128.F.P Agent Performance Analysis .................................................................................................................................. 13
Agent Communication2.L.2 Leads Production Report ........................................................................................................................................ 148.5.9 Fee Target Report ................................................................................................................................................... 158.5.P Transaction Production Report ............................................................................................................................... 168.7.1 Agent Payroll History .............................................................................................................................................. 178.B.3 Agent Budget Report .............................................................................................................................................. 18
Agent Billing8.6.1 Agent Expense Statement ...................................................................................................................................... 198.6.6 Agent Expenses Uncovered ................................................................................................................................... 208.6.A Agent Expense Annual Summary ........................................................................................................................... 218.6.5 Expense Listing by Chargeable Item ...................................................................................................................... 22
Transaction Reports2.1 Transaction Record Sheet ...................................................................................................................................... 232.P.1.2 Transaction Action Report ...................................................................................................................................... 242.P.2 Pending Transaction Report ................................................................................................................................... 252.P.3 Transaction Register Report ................................................................................................................................... 262.P.8 Manager’s Transaction Report ............................................................................................................................... 273.8 Trust Reconciliation ................................................................................................................................................ 283.8 Trust Reconciliation Ledger .................................................................................................................................... 293.6 Trust Ledger ........................................................................................................................................................... 30
Accounts Payable Reports5.1 Allocation of Invoice Entry ...................................................................................................................................... 315.6.1 Detailed Aging Report............................................................................................................................................. 325.2.M A/P Check Listing ................................................................................................................................................... 33
Listing Reports1.2.1.2 Listing Inventory Report.......................................................................................................................................... 341.2.2.2 Listing Expense Report .......................................................................................................................................... 351.2.1.7 Listing by Agent Report .......................................................................................................................................... 36
Financial ReportsF.S Cash Status Report ................................................................................................................................................ 37F.4.1 Financial Statement ................................................................................................................................................ 38F.4.3 Annual Income Statement ...................................................................................................................................... 40F.4.4 Multi Office Income Statement ............................................................................................................................... 42F.6.2 Summary Trial Balance .......................................................................................................................................... 44

3
CanAmera Realty [2.P.4.1]
Ranking of Agents by Commission $ - All OfficesBased upon Written Date - All Agents Results
From January 01, 20XX to July 31, 20XXInactive Agents Included
Agent # Agent Name Off. Rank Sides Sales Volume Commission Agent% Total%002 Donna Wales 1 1 11.00 4,905,600.00 124,516.54 12.45 12.45009 Jonathan Wallace 2 2 11.00 4,923,100.00 124,470.55 12.44 24.89010 James Bower 2 3 12.00 4,673,100.00 104,436.90 10.44 35.33011 Teresa Gray 2 4 8.00 4,211,400.00 94,254.45 9.42 44.75005 Barbara Thompson 1 5 8.00 3,295,200.00 83,047.82 8.30 53.05008 Jeremy Fernendes 2 6 6.00 2,419,000.00 54,216.00 5.42 58.47013 Janis Ian 2 7 4.00 2,120,300.00 53,586.75 5.36 63.83003 Amy Morrow 1 8 7.00 2,247,100.00 49,915.25 4.99 68.82004 Joanne Murphy 2 9 5.00 2,178,200.00 49,796.80 4.98 73.80012 David Allen 1 10 4.00 1,823,600.00 46,991.23 4.70 78.50016 Jimmy Sorensen 1 11 2.00 1,299,100.00 33,256.96 3.32 81.82006 Erin Penner 1 12 4.00 1,218,700.00 29,648.15 2.96 84.78017 Carleen Edson 2 13 4.00 1,198,500.00 28,809.55 2.88 87.66015 Ashley Feth 2 14 3.00 1,168,500.00 28,235.70 2.82 90.48018 Mandi Suydam 1 15 2.00 975,600.00 24,939.01 2.49 92.97022 Eric Lightfoot 1 16 2.00 649,300.00 16,487.26 1.65 94.62020 Austin Hamsher 1 17 2.00 589,000.00 15,295.00 1.53 96.15021 Luke Horstman 1 18 2.00 602,100.00 15,211.70 1.52 97.67019 Eva Mutch 1 19 2.00 598,700.00 14,403.72 1.44 99.11014 Chelsey Ryan 2 20 1.00 369,500.00 8,720.20 0.89 100.00
100.00 41,465,600.00 1,000,239.54 100.00* Denotes Inactive AgentsOffices: (based on agent's current office)1 North Office 2 South Office
Prepared by: Debra JonesAugust 06, 20XX, 10:59:27 AM
Lone Wolf Technologies [2.P.4.1] brokerWOLF (Version XX.06.01) Page: 1 of 1
EVER WONDER WHO REALLY DOES BUSINESS IN YOUR OFFICE?You’ve heard of the 80/20 rule, where 80% of business is done by 20% of the agents. Use this report to understand what each agent does of your business in the office as well as how quickly the top agents add up. The better distributed this report is, the better balanced your office is and the less dependent you are on just a few agents!
Real Numbers… Real Insights
Which agent is generating you business?
“Two deals in seven months” anyone below here may
be an issue

4
CanAmera Realty [2.P.5.3]
Sources Of Business Summary Report - All Offices Based Upon Closed Date
From January 01, 20XX To July 31, 20XX
Seller Buyer TotalsCD Description # Value % # Value % # Value %A NEWSPAPER ADVERTISING 1.00 11,250 2.6 1.00 14,040 3.4 2.00 25,290 3.0B FOR SALE SIGN 2.00 17,310 3.9 2.00 22,620 5.5 4.00 39,930 4.7C REPEAT BUSINESS 5.00 58,140 13.2 1.00 22,500 5.5 6.00 80,640 9.5D PERSONAL LEAD 3.00 41,300 9.4 2.00 25,560 6.3 5.00 66,860 7.9E OTHER BROKER-LEAD/REF 0.00 0 0.0 2.00 18,120 4.4 2.00 18,120 2.1F OFFICE WALK IN 1.00 10,620 2.4 2.00 24,120 5.9 3.00 34,740 4.1G RELOCATION 1.00 14,040 3.2 3.00 43,170 10.6 4.00 57,210 6.7H BILLBOARD ADVERTISING 1.00 10,350 2.4 2.00 24,750 6.1 3.00 35,100 4.1I BUS BENCH 2.00 25,620 5.8 2.00 23,100 5.7 4.00 48,720 5.7J DIRECT MAIL 0.00 0 0.0 2.00 32,220 7.9 2.00 32,220 3.8K DRIP MARKETING CAMPAIGN 3.00 44,817 10.2 1.00 13,020 3.2 4.00 57,837 6.8L COLD CALL 3.00 28,245 6.4 4.00 50,775 12.4 7.00 79,020 9.3M OPEN HOUSE 1.00 13,950 3.2 1.00 10,350 2.5 2.00 24,300 2.9S AGENT WEBSITE 2.00 33,420 7.6 0.00 0 0.0 2.00 33,420 3.9T SOCIAL MEDIA 2.00 38,190 8.7 1.00 13,770 3.4 3.00 51,960 6.1W OFFICE WEBSITE 7.00 92,640 21.1 5.00 70,707 17.3 12.00 163,347 19.2
34.00 439,892 100.1 31.00 408,822 100.1 65.00 848,714 99.8
Prepared by: Bailey WestwoodAugust 09, 20XX, 09:24:22 AM
Lone Wolf Technologies [2.P.5.3] brokerWOLF (Version XX.07.04) Page: 1 of 1
WHERE SHOULD YOU SPEND TO GENERATE MORE LEADS?Knowing where leads have come from, is half the battle. The other half is knowing what they turned into! Generate this report, by office or by agent, to see the source of business for all your transactions and the related dollar value. Never wonder again!
Real Numbers… Real Insights
Invest in these toolsShow your agents the importance of being
remembered

5
CanAmera Realty [2.P.5.6]
Commission Cutting Report - SummaryFrom January 01, 20XX To June 30, 20XX
Agent # Agent Rank Volume* Ends Commis. Avg.% Rank Volume* Ends Commis. Avg.% Rank Volume* Ends Commis. Avg.%
2.50%Lost
Commis.Listing Side Selling Side Combined
020 Hamsher, Austin 1 199,500 1.00 5,207 2.61 2 389,500 1.00 10,088 2.59 1 589,000 2.00 15,295 2.60012 Allen, David 2 1,398,600 3.00 36,324 2.60 10 425,000 1.00 10,668 2.51 2 1,823,600 4.00 46,991 2.58002 Wales, Donna 6 1,302,000 3.00 32,943 2.53 1 4,003,100 9.00 103,521 2.59 3 5,305,100 12.00 136,465 2.57018 Suydam, Mandi 3 350,000 1.00 9,030 2.58 5 625,600 1.00 15,909 2.54 4 975,600 2.00 24,939 2.56016 Sorensen, Jimmy 4 799,600 1.00 20,470 2.56 4 499,500 1.00 12,787 2.56 5 1,299,100 2.00 33,257 2.56022 Lightfoot, Eric 8 289,700 1.00 7,300 2.52 3 249,800 1.00 6,420 2.57 6 539,500 2.00 13,720 2.54009 Wallace, Jonathan 5 2,273,100 5.00 57,536 2.53 8 2,949,500 7.00 74,471 2.52 7 5,222,600 12.00 132,008 2.53013 Ian, Janis 9 395,500 1.00 9,927 2.51 6 1,325,300 2.00 33,672 2.54 8 1,720,800 3.00 43,599 2.53021 Horstman, Luke 7 352,500 1.00 8,922 2.53 9 249,600 1.00 6,290 2.52 9 602,100 2.00 15,212 2.53005 Thompson, Barbara 10 998,100 3.00 24,872 2.49 7 2,297,100 5.00 58,176 2.53 10 3,295,200 8.00 83,048 2.52006 Penner, Erin 14 848,900 3.00 20,551 2.42 11 369,800 1.00 9,097 2.46 11 1,218,700 4.00 29,648 2.43 853015 Feth, Ashley 12 799,000 2.00 19,516 2.44 14 369,500 1.00 8,720 2.36 12 1,168,500 3.00 28,236 2.42 935019 Mutch, Eva 15 249,500 1.00 5,988 2.40 13 349,200 1.00 8,416 2.41 13 598,700 2.00 14,404 2.41 539014 Ryan, Chelsey 20 0 0.00 0 0.00 14 369,500 1.00 8,720 2.36 14 369,500 1.00 8,720 2.36 517017 Edson, Carleen 17 349,500 1.00 7,794 2.23 12 299,000 1.00 7,266 2.43 15 648,500 2.00 15,060 2.32 1,167010 Bower, James 11 2,553,700 5.00 63,176 2.47 20 2,491,500 6.00 54,094 2.17 16 5,045,200 11.00 117,270 2.32 9,081004 Murphy, Joanne 13 499,600 1.00 12,140 2.43 16 2,178,200 5.00 49,797 2.29 17 2,677,800 6.00 61,937 2.31 5,088008 Fernendes, Jeremy 18 425,000 1.00 8,925 2.10 17 1,994,000 5.00 45,291 2.27 18 2,419,000 6.00 54,216 2.24 6,289003 Morrow, Amy 16 898,600 3.00 20,397 2.27 19 1,348,500 4.00 29,518 2.19 19 2,247,100 7.00 49,915 2.22 6,292011 Gray, Teresa 19 699,500 1.00 14,440 2.06 18 3,311,800 7.00 74,213 2.24 20 4,011,300 8.00 88,653 2.21 11,633
Report Totals: 15,681,900 38.00 385,458 2.46 26,095,000 61.00 627,134 2.40 41,776,900 99.00 1,012,593 2.42 42,394
* Volume is based on the agent's % of the deal and the sell price. Not the agent's side count.
Prepared by: Bailey WestwoodJune 26, 20XX, 11:03:53 AM
Lone Wolf Technologies [2.P.5.6] brokerWOLF (Version XX.06.01) Page: 1 of 1
DO AGENTS COMPLAIN THEY DON’T MAKE ENOUGH MONEY?...and then try to make it your problem by having you make less?
The real problem is them leaving money on the table by not adequately charging for their services. Use this report to take control of the discussion and make it about them. Play offense not defense!
Run this report to be proactive by identifying the agents cutting commission and going to them first, before it becomes your problem!
Real Numbers… Real Insights
Set YOUR expectation
They left over $20,000 on the table
Everyone under here sells
themselves short

6
CanAmera Realty [2.P.5.9]
Business Analysis ReportClose Date From January 01, 20XX To July 31, 20XX
Closed, Open Firm, Open Conditional
Listing Selling Referral TotalMonth Side Volume Comm. Company $ Side Volume Comm. Company $ Fees Side Volume Comm. Company $
% ofGCI
Jan 20XX 3.0 951,000.00 22,874.48 9,899.79 5.0 1,750,600.00 42,700.75 19,837.54 0.00 8.0 2,701,600.00 65,575.23 29,737.33 45.3%Feb 20XX 2.0 849,100.00 21,077.90 6,521.61 5.0 2,197,000.00 50,620.70 18,862.81 0.00 7.0 3,046,100.00 71,698.60 25,384.42 35.4%Mar 20XX 4.0 1,773,500.00 39,671.45 16,019.78 4.0 1,615,000.00 37,068.40 6,224.40 0.00 8.0 3,388,500.00 76,739.85 22,244.18 29.0% Apr 20XX 4.0 1,498,000.00 36,845.80 9,325.47 5.0 2,323,600.00 57,235.36 27,815.45 0.00 9.0 3,821,600.00 94,081.16 37,140.92 39.5%May 20XX 5.0 1,922,600.00 47,341.53 18,645.89 11.0 5,013,600.00 121,668.05 55,189.25 0.00 16.0 6,936,200.00 169,009.58 73,835.14 43.7%Jun 20XX 11.0 4,976,000.00 126,478.78 38,508.71 15.0 6,004,900.00 146,619.97 69,676.95 0.00 26.0 1 0,980,900.00 273,098.75 108,185.66 39.6%Jul 20XX 10.0 3,636,500.00 91,491.67 39,961.37 15.0 6,644,100.00 158,200.96 62,011.82 0.00 25.0 10,280,600.00 249,692.63 101,973.19 40.8%Totals: 39.0 15,606,700.00 385,781.61 138,882.62 60.0 25,548,800.00 614,114.19 259,618.22 0.00 99.0 41,155,500.00 999,895.80 398,500.84
Averages: 5.5 2,229,528.57 55,111.65 19,840.37 8.5 3,649,828.57 87,730.59 37,088.31 0.00 14.1 5,879,357.14 142,842.25 56,928.69 39.0%
Prepared by: Debra JonesAugust 06, 20XX, 10:53:40 AM
Lone Wolf Technologies [2.P.5.9] brokerWOLF (Version XX.06.01) Page: 1 of 1
KNOW WHEN TO INVEST YOUR RESOURCES INTO YOUR BUSINESSWe all know the ebb and flow of Real Estate, are you taking advantage of it? A monthly Business Analysis Report is a brokerage must. Clearly see how your business fundamentals are progressing over any chosen period, ensuring you can act quickly when needed. Are the number of sides, agent commission and your dollars on target? Know on the first day of the month, and do something about it.
Real Numbers… Real Insights
Are your agents struggling to bring sellers to the table and create the
opportunity for a double ender?

7
CanAmera Realty [2.P.C.1]
Commissions With Other Broker's - DetailedClosed & Finalized From February 01, 20XX To May 31, 20XX
Grouped By Broker
Agent Trans. # Address Sell PriceSelling
# Comm % CommissionListing
# Comm % Commission # TotalBroker: First Choice Realty (516)859-6363
Arthur Collver (Listing) 060140 101 Monaco Street 499,500 0 0.00% 0.00 1 2.07% 10,339.40 1 10,339.40Arthur Collver (Listing) 060148 1711 Dallas Ave 399,500 0 0.00% 0.00 1 1.74% 6,941.00 1 6,941.00Arthur Collver (Listing) 060153 777 Willowdale Ave 399,500 0 0.00% 0.00 1 2.14% 8,539.00 1 8,539.00
Outside Agent Total: 1,298,500 0 0.00 3 25,819.40 3 25,819.40
Ben Thomas (Listing) 060128 26 Cumming Ave 369,500 0 0.00% 0.00 1 2.51% 9,274.45 1 9,274.45Outside Agent Total: 369,500 0 0.00 1 9,274.45 1 9,274.45
Brent Smith (Selling) 060133 22 Birch Street 299,000 1 2.50% 7,475.00 0 0.00% 0.00 1 7,475.00Brent Smith (Selling) 060145 99 Kingston 699,500 1 2.24% 15,633.83 0 0.00% 0.00 1 15,633.83
Outside Agent Total: 998,500 2 23,108.83 0 0.00 2 23,108.83
Broker Total: 2,666,500 2 23,108.83 4 35,093.85 6 58,202.68
Broker: Jones Realty Professionals (516)895-3623Cindy Alberta (Selling) 060155 9 Beeler Ave 299,600 1 2.50% 7,490.00 0 0.00% 0.00 1 7,490.00
Outside Agent Total: 299,600 1 7,490.00 0 0.00 1 7,490.00
Donna Meeks (Listing) 060130 52 Harrison 499,800 0 0.00% 0.00 1 2.48% 12,394.94 1 12,394.94Outside Agent Total: 499,800 0 0.00 1 12,394.94 1 12,394.94
Lauren Ryan (Listing) 060138 89 Eduroa Drive 699,500 0 0.00% 0.00 1 1.96% 13,740.00 1 13,740.00Outside Agent Total: 699,500 0 0.00 1 13,740.00 1 13,740.00
Broker Total: 1,498,900 1 7,490.00 2 26,134.94 3 33,624.94
Broker: The Gold Team Real Estate (516)412-5255Brian Gray (Selling) 060150 5 Dayton Ave 299,500 1 2.66% 7,951.73 0 0.00% 0.00 1 7,951.73Brian Gray (Selling) 060161 42 Lowry 699,500 1 2.50% 17,487.50 0 0.00% 0.00 1 17,487.50
Outside Agent Total: 999,000 2 25,439.23 0 0.00 2 25,439.23
Jeff Goldman (Selling) 060107 35 Hilton Circle 349,500 1 2.35% 8,213.25 0 0.00% 0.00 1 8,213.25Jeff Goldman (Selling) 060118 89 Beck Ave 525,000 1 2.50% 13,125.00 0 0.00% 0.00 1 13,125.00
Outside Agent Total: 874,500 2 21,338.25 0 0.00 2 21,338.25
Jeff Goldman (Listing) 060120 22 Maple Road 366,500 0 0.00% 0.00 1 2.43% 8,912.50 1 8,912.50Jeff Goldman (Listing) 060159 10 Main Street 499,500 0 0.00% 0.00 0 0.00% 0.00 0 0.00
Outside Agent Total: 866,000 0 0.00 1 8,912.50 1 8,912.50
Jeff Goldman (Selling) 060162 52 Moore Ave 499,500 1 2.50% 12,487.50 0 0.00% 0.00 1 12,487.50Outside Agent Total: 499,500 1 12,487.50 0 0.00 1 12,487.50
Marjorie Simpson (Selling) 060125 52 Mark Ave 349,600 1 2.20% 7,691.20 0 0.00% 0.00 1 7,691.20Outside Agent Total: 349,600 1 7,691.20 0 0.00 1 7,691.20
Broker Total: 3,588,600 6 66,956.18 1 8,912.50 7 75,868.68
Report Total: 7,754,000 9 97,555.01 7 70,141.29 16 167,696.30
Prepared by: Bailey WestwoodJune 24, 20XX, 03:32:17 PM
Lone Wolf Technologies [2.P.C.1] brokerWOLF (Version XX.06.01) Page: 1 of 1
EVER HAVE CHALLENGES FINDING STRONG AGENTS TO RECRUIT?Use your own data to gain real insights into how other brokerages’ agents perform! This report gives a clear indication which agents you should be paying attention to. You see who is active in selling but also who has stronger commission splits. If you want to grow your agents, do it with insightful information that allows you to target ones that know your brokerage, AND ones you know you want!
Real Numbers… Real Insights
Reach out to Jeff to see if he might be interested

8
CanAmera Realty [2.P.C.2]
Other Contact's Activity Report - Detailed - All OfficesWritten Date From May 01, 20XX To July 31, 20XX
All Company Types - All Contacts
Agent Trans. # Address Close Date Cls. Sides Sell Price Commission
Escrow Company: American Escrow (303)253-6323Bruce Dixon American 060199 33855 Pine Drop Drive 07/18/20XX C 1.00 349,600 8,740.00
Contact Total: 1.00 349,600 8,740.00
Lauren Scott American 060169 89 Birch Ave 06/24/20XX B 1.00 499,600 12,490.00 Contact Total: 1.00 499,600 12,490.00
Company Total: 2.00 849,200 21,230.00
Home Inspection Company: Your Home Assurance (303)980-1253Andrea Jones Your Home 060187 1507 S Minton Road 06/26/20XX B 1.00 349,200 8,415.72
Contact Total: 1.00 349,200 8,415.72
Morris Reeves Your Home 060181 4610 Penny Ave 06/26/20XX C 1.00 799,600 20,469.76Contact Total: 1.00 799,600 20,469.76
Company Total: 2.00 1,148,800 28,885.48
Lawyer/Solicitor: Firth & Wynn Associates (303)859-4525Desmond Wallace Firth & 060194 7943 Ronson Road 07/01/20XX C 1.00 399,500 10,067.40
Contact Total: 1.00 399,500 10,067.40
Mike Rowan Firth & Wynn 060181 4610 Penny Ave 06/26/20XX C 1.00 799,600 20,469.76Contact Total: 1.00 799,600 20,469.76
Company Total: 2.00 1,199,100 30,537.16
Mortgage Company: 1st Time Mortgages (303)458-9633Andrew Collver 1st Time 060199 33855 Pine Drop Drive 07/18/20XX C 1.00 349,600 8,740.00
Contact Total: 1.00 349,600 8,740.00
Gerard Baker 1st Time 060187 1507 S Minton Road 06/26/20XX B 1.00 349,200 8,415.72Contact Total: 1.00 349,200 8,415.72
Kimberly Smith 1st Time 060169 89 Birch Ave 06/24/20XX B 1.00 499,600 12,490.00Kimberly Smith 1st Time 060195 101 Foxboro 07/09/20XX C 1.00 275,000 6,875.00
Contact Total: 2.00 774,600 19,365.00
Company Total: 4.00 1,473,400 36,520.72
Staging Company: Home Appeal Staging (303)279-9651James Walsh Home Appeal 060195 101 Foxboro 07/09/20XX C 1.00 275,000 6,875.00
Contact Total: 1.00 275,000 6,875.00
Richard Penman Home 060194 7943 Ronson Road 07/01/20XX C 1.00 399,500 10,067.40Contact Total: 1.00 399,500 10,067.40
Company Total: 2.00 674,500 16,942.40
Report Total: 12.00 5,345,000 134,115.76
D AGENT DOUBLE ENDERE APPRAISAL OR VALUATION FEE
C LISTING SIDEA OFFICE DOUBLE ENDER
H REFERRALSB SELLING SIDE
Prepared by: Debra JonesAugust 06, 20XX, 10:36:50 AM
Lone Wolf Technologies [2.P.C.2] brokerWOLF (Version XX.06.01) Page: 1 of 1
WHICH TITLE AND ESCROW COMPANIES ARE YOU HELPING GROW?Use your relationship to build a stronger business for all concerned. Within your system you can easily track the business you do with third party companies (even add to the types). With this valuable information you will be able to leverage these relationships to improve the value of your organization.
Real Numbers… Real Insights
Show your contacts the value of your relationship

9
CanAmera Realty [8.5.C ]
Agent Prior Year Comparison - By CommissionClosed Transactions From January 01, 20XX To December 31, 20XX
Open Transactions To February 10, 20XXSorting By: Agent Name Detail Format
Trans. # AddressCloseDate Commission Sides Volume Net to Office Mths
Prior YearCommission
PriorMths % Change
OpenCommission
518 Britten, Andre Office060120 78 Westchester 01/15/20XX 8,250.00 1.00 275,000.00 412.50060121 52 Chalmers 02/01/20XX 7,950.00 1.00 265,000.00 397.50060097 47 Sand Dollar Drive 02/04/20XX 4,540.00 1.00 227,000.00 0.00060119 85 Brooklyn Drive 02/09/20XX 12,750.00 1.00 425,000.00 0.00
33,490.00 4.00 1,192,000.00 810.00 12.0 10,950.00 12.0 205.84 0.00500 Dean, Richard Office
060082 1402 Lewiston Road 01/04/20XX 13,440.00 1.00 448,000.00 25.00060083 219 Sunspot Terrace 01/04/20XX 6,420.00 1.00 321,000.00 25.00060110 22 Fairview Road 01/19/20XX 4,125.00 1.00 165,000.00 25.00060105 1 Seabreeze Road 210 01/25/20XX 5,250.00 1.00 175,000.00 25.00060104 85 Millcreek Drive 02/03/20XX 5,250.00 1.00 175,000.00 25.00060090 93 Conche Drive 02/04/20XX 9,975.00 1.00 399,000.00 25.00060095 98 Park Place 301 02/04/20XX 2,990.00 1.00 149,500.00 25.00060103 37 Galela Road 02/04/20XX 10,950.00 1.00 365,000.00 2,215.00
58,400.00 8.00 2,197,500.00 2,390.00 12.0 179,575.66 12.0 -67.47 0.00502 Elliott, Tammy Office
060014-I 1227 Industrial Boulevard 10 01/04/20XX 100.000.000.0025.00060081 22 Little Dipper Drive 01/04/20XX 2,798.00 1.00 139,900.00 1,144.20060108 34 Wheatland Drive 01/28/20XX 14,250.00 1.00 475,000.00 4,866.25060107 124 Main Street 01/31/20XX 4,050.00 1.00 135,000.00 1,240.00060014-N 1227 Industrial Boulevard 10 02/04/20XX 100.00 0.00 0.00 25.00060093 95 Stingray Drive 02/04/20XX 9,196.00 1.00 229,900.00 3,703.40060111 6 Fern Road 02/06/20XX 7,950.00 1.00 265,000.00 4,795.00060014-K 1227 Industrial Boulevard 10 03/06/20XX 100.00 0.00 0.00 25.00
38,544.00 5.00 1,244,800.00 15,823.85 12.0 55,770.50 12.0 -30.88 0.00* - Terminated Agents Report Totals: 130,434.00 17.00 4,634,300.00 19,023.85 246,296.16 -47.04 0.00
Prepared by: Linda Jones-ReeseFebruary 10, 20XX, 11:04:12 AM
Lone Wolf Technologies [8.5.C ] brokerWOLF (Version XX.01.03) Page: 1 of 1
YOUR AGENT ROCKS BUT ARE THEY TRULY BETTER THAN LAST YEAR?Be proactive and use facts to help your agents reach for targets. The Agent Prior Year Comparison Report brings to light year over year changes in business commission and volume. Allowing you to have important proactive discussions with your agents to motivate them to excel or remove them from your team.
Real Numbers… Real Insights
Richard is your strongest volume but he has taken his foot off the pedal

10
CanAmera Realty [8.F.2.2]
Net Worth Executive SummaryFrom January 01, 20XX To September 30, 20XX
Works Commission Expense Gross Expenses Net ToAgent # Agent At Home Deductions Earnings Earnings Allocated Office Agent%
Office: 002 - South Office011 Gray, Teresa N 35,195.98 13,576.35 48,772.33 8,317.18 40,455.14 29.70%009 Wallace, Jonathan N 43,037.62 4,915.00 47,952.62 9,056.07 38,896.54 28.55%004 Murphy, Joanne N 29,622.81 5,356.45 34,979.26 7,639.81 27,339.44 20.07%010 Bower, James N 2,896.32 20,199.47 23,095.79 6,969.63 16,126.15 11.83%008 Fernendes, Jeremy N 16,841.40 2,850.00 19,691.40 7,637.97 12,053.42 8.84%013 Ian, Janis N 9,886.28 5,825.00 15,711.28 7,447.68 8,263.59 6.06%017 Edson, Carleen N 2,338.16 3,204.67 5,542.83 7,080.02 -1,537.19 -1.12%015 Feth, Ashley N 3,626.37 2,222.50 5,848.87 7,503.72 -1,654.85 -1.21%014 Ryan, Chelsey N 2,152.50 1,035.00 3,187.50 6,918.76 -3,731.26 -2.73%
Office 002 - South Office Totals: 145,597.44 59,184.44 204,781.88 68,570.88 136,210.99 100.00%
Report Totals: 145,597.44 59,184.44 204,781.88 68,570.88 136,210.99 100.00%
Commission Deductions Included$47,248.24
Commission Split Fee $98,349.20
Expense Earnings IncludedAdvance (77)ADVERT FEE (20)ADVERT. - OTHER (24)BOARD ANNUAL DUES (13)BOARD DUES & FEES (10)BUSINESS CARDS (07)CELLULAR PHONE (02)COURIER (08)DESK FEE (45)E & O INSURANCE (35)
FAX CHARGES (14)INTERNET (98)LAWN MAINTENANCE (99)LONG DISTANCE (01)MLS CATALOGUES (11)PAGER COSTS (04)PHOTOCOPIES (05)SIGNS (15)SOCIAL CLUB (09)STATIONERY SUPPLIES (06)WEBSITE (97)
Prepared by: Bailey WestwoodOctober 31, 20XX, 11:28:47 AM
Lone Wolf Technologies [8.F.2] brokerWOLF (Version XX.08.05) Page: 1 of 1
AGENT PROFITABILITY, CAN I REALLY UNDERSTAND THAT?Absolutely! The Net Worth Executive Summary ranks your agents and gives you a true perspective on what each agent brings to your office. Don’t be surprised when that top agent actually costs you money because of the split you’ve given them and the expenses you incur for them. Have the knowledge to make the tough conversations easier so you can build your business to be more profitable.
Real Numbers… Real Insights
Your most profitable agents might surprise you Below here are agents
that cost you money

11
CanAmera Realty [8.F.2]
Net Worth Report For Agent #210 - Beams, Maryanne Office: North OfficeFrom January 01, 20XX To October 31, 20XX
Various Fees - Various Chargeable Items
Gross Commissions Earned 44,640.00
Earnings From Transactions4% Deduction 1,992.00
Split Fee 9,963.00
Total Fees Received: 11,955.00
Earnings From Expenses45 Desk Fee 10,200.00
50 Franchise Fee 2,009.00
52 Management Fee 4,500.00
Total Expenses Recovered: 16,709.00
Gross Earnings To Office: 28,664.00
Expense Totals Allocated# of Agents on Staff (Code A): 15.87
Gross Office Commissions (Code V): $202,941.00
62101 RENT & OCC. - RENT EXPENSE 75,000.00 A 4,724.72
62103 RENT & OCC. - UTILITIES 834.96 A 52.60
62104 RENT & OCC. - REPAIRS & MAINT. 1,492.96 A 94.05
64101 SELLING - MLS FEES 4,072.10 A 256.53
64102 SELLING - SIGNS 3,687.50 A 232.30
65102 ADVERTISING - OTHER MEDIUM 7,194.50 V 1,582.54
65103 ADVERTISING - YELLOW PAGES 276.08 A 17.39
70102 LABOR EXP. - SALARIES 26,916.55 V 5,921.64
75102 OFFICE EXP. - OFFICE SUPPLIES 12,086.82 A 761.42
75104 OFFICE EXP. - POSTAGE 28.53 A 1.80
75105 OFFICE EXP. - COURIER SERVICE 80.24 A 5.05
75112 OFFICE EXP. - PHOTOCOPIES 315.42 A 19.87
72103 COMMUN. EXP. - PAGERS 980.00 A 61.74
72104 COMMUN. EXP. - CELLULAR 1,051.85 A 66.26
69101 FRANCHISE COSTS - PARTICIPATION 2,856.00 A 179.92
64199 SELLING - MISC. 187.14 A 11.79
72199 COMMUN. EXP. - MISC. 482.44 A 30.39
75199 OFFICE EXP. - MISC. 152.16 A 9.59
Total Allocated Expenses: 14,029.60
Net Earned By Office: 14,634.40
Prepared by: Bailey WestwoodOctober 31, 20XX, 02:34 PM
Lone Wolf Technologies brokerWOLF (Version XX.02.13) Page: 1 of 1
ARE YOU SURE YOUR AGENT IS MAKING YOU MONEY?Welcome to the report that truly helps you see what each agent is worth to you. Taking what you earn from each agent through commission fees and billing, you take their portion of your overheads and get a true picture of the bottom line for each agent. This is the information you need to make decisions with about this agent!
Real Numbers… Real Insights
What you made
What it cost to have them here
What they brought in
Clearly you are making money from this agent

12
CanAmera Realty [8.F.8]
Detailed Recruiter Agent Value ReportClose Date From January 01, 20XX To December 31, 20XX
Sorting By: Agent Name
Agent # Agent NameReal Estate
Ends ValueTitle Company
Ends ValueMortgage Company
Ends ValueTotal
Ends Value
Recruiter: BAKRO Baker, RobertBAKRO Baker, Robert 14.0 42,039 10.0 3,0001.0 300 26.0 45,339
Existing RecruitsALLDA Allen, David 3.0 24,047 1.0 6501.0 300 6.5 24,997ASHBI Ashford, Bill 8.5 23,424 6.0 1,8501.0 300 16.5 25,574BONHO Bond, Howard 9.4 33,483 7.0 2,6201.0 300 19.8 36,403CLALA Clark, Larry 10.0 39,759 9.0 2,6000.0 150 20.5 42,509DRETR Drew, Trevor 10.2 36,229 9.0 2,5500.0 0 19.7 38,779
Totals:# of Recruits: 5 41.1 156,942 32.0 10,2703.0 1,050 83.0 168,262
Totals:Total Recruited: 5 55.1 198,982 42.0 13,2704.0 1,350 109.0 213,602
Recruiter: COLLA Colt, LawrenceCOLLA Colt, Lawrence 5.0 17,729 4.0 1,3500.0 0 10.0 19,079
Existing RecruitsDAN Gibson, Dan 10.6 11,279 8.0 2,1802.0 600 21.2 14,059MAB Hammond, Matthew 8.5 11,179 8.0 2,2001.0 300 17.5 13,679MACJE Macmillan, Jeff 12.5 33,148 11.0 3,2501.0 300 25.0 36,698MOSMO Moser, Molly 2.5 14,585 2.0 7251.0 300 6.0 15,610
Totals:# of Recruits: 4 34.1 70,193 29.0 8,3555.0 1,500 69.7 80,048
Totals:Total Recruited: 4 39.1 87,922 33.0 9,7055.0 1,500 79.7 99,127
Recruiter: CRACI Crawford, CindyCRACI Crawford, Cindy 24.5 61,452 20.0 5,8502.0 600 47.0 67,902
New RecruitsSCOTY Scott, Tyler 6.0 29,372 4.0 9501.0 300 11.0 30,622
Totals:# of Recruits: 1 6.0 29,372 4.0 9501.0 300 11.0 30,622
Existing RecruitsGAZAL Gaze, Al 5.5 16,633 5.0 1,4001.0 300 11.5 18,333GRURA Grummett, Ralph 11.2 29,456 9.0 2,6501.0 300 21.2 32,406HILKE Hilsen, Kelly 15.0 8,426 15.0 4,1501.0 300 31.0 12,876
Totals:# of Recruits: 3 31.7 54,516 29.0 8,2003.0 900 63.7 63,616
Totals:Total Recruited: 4 62.2 145,341 53.0 15,0006.0 1,800 121.7 162,141
Report Totals: 156.5 432,246 128.0 37,97515.0 4,650 310.5 474,871
Selected OptionsStatuses:
Closed
Fees:ADMIN FEE BROKER FEE CMN E&O FEEFRANCH 4% PROPM SPLIT FEE
Chargeable Items:ADVERTISING - BROKERAGE (AD) BOARD DUES & FEES (BD) CREDIT (RC)DESK FEE (DF) E & O INSURANCE (EO) FRANCHISE INTERNATIONAL DUES (RI)
Prepared by: Bailey WestwoodAugust 21, 20XX, 11:49:36 AM
Lone Wolf Technologies [8.F.8] brokerWOLF (Version XX.07.04) Page: 1 of 1
HOW VALUABLE IS AN AGENT ACROSS YOUR WHOLE BUSINESS?Seeing what an agent generates across your entire operation, not just the Real Estate component, offers you insights into the true value of each agent. Each part of your operation generates revenue and understanding how each agent uses those parts is important. Look at the recruiter version and it will track the recruiter contribution along with his/her recruits.
Real Numbers… Real Insights
Who is your biggest brand advocate?
Which agents are utilizing your preferred business contacts... it becomes very clear

13
CanAmera Realty [8.F.P]
Agent Performance - Summary ReportDate Range January 01, 20XX - July 31, 20XX
Comm. %(<=2.90%)
G.C.I.(<=50,000)
Volume(<=2,000,000)
Sides(<=8.00)
Listings(<=2)
Anniv.MM/DDOfficeAgent # Agent
2.6226,216.38999,100.002.00006/05North Office012 Allen, David2.36120,694.935,105,600.0012.00001/01North Office010 Bower, James2.4028,809.551,198,500.004.00112/04North Office017 Edson, Carleen2.2454,216.002,419,000.006.00001/15North Office008 Fernendes, Jeremy2.4228,235.701,168,500.003.00103/16North Office015 Feth, Ashley2.1875,332.953,456,300.007.00001/01North Office011 Gray, Teresa2.6015,295.00589,000.002.00008/10North Office020 Hamsher, Austin2.538,921.78352,500.001.00209/20North Office021 Horstman, Luke2.5343,599.251,720,800.003.00102/14North Office013 Ian, Janis2.5416,487.26649,300.002.00107/17North Office022 Lightfoot, Eric2.2249,915.252,247,100.007.00010/13North Office003 Morrow, Amy2.3161,937.082,677,800.006.00001/01North Office004 Murphy, Joanne2.4114,403.72598,700.002.00105/31North Office019 Mutch, Eva2.4329,648.151,218,700.004.00111/19North Office006 Penner, Erin2.368,720.20369,500.001.00104/02North Office014 Ryan, Chelsey2.5633,256.961,299,100.002.00209/10North Office016 Sorensen, Jimmy2.5624,939.01975,600.002.00112/31North Office018 Suydam, Mandi2.5283,047.823,295,200.008.00006/22North Office005 Thompson, Barbara2.57136,464.595,305,100.0012.00008/30North Office002 Wales, Donna2.53132,007.555,222,600.0012.00001/29North Office009 Wallace, Jonathan
List Statuses: Available
Trans. Statuses: Closed, Open Firm, OpenConditional
Classes: All Classes
Property Types: All Property Types
Prepared by: Debra JonesJuly 24, 20XX, 12:56:48 PM
Lone Wolf Technologies [8.F.P] brokerWOLF (Version XX.06.01) Page: 1 of 1
AGENTS ARE BUSY, ARE THEY PERFORMING TO YOUR EXPECTATIONS?You have goals for listings, sides, volume, GCI and commission % and knowing what agents are achieving those goals and which ones aren’t is critical to fine-tuning your operation. Learn each agent’s performance so you can have proactive discussions with them.
Real Numbers… Real Insights
Set your expectations
Identify which agents are not meeting expectations.
Anything bold pay attention to!

14
CanAmera Realty [2.L.2]
Leads Production Detailed ReportFor 01/01/20XX To 02/09/20XX
Agent: Britten, Andre (518)
ActiveEmail Phone #Lead [email protected](456)778-778812/01/20XX99 Heartland Cres, St. Petersburg FLSusan [email protected](479)879-879812/16/20XX45 Hunters Court, Jacksonville FLDesmond [email protected](456)798-798712/31/20XX42 Essex Point, Tampa FLBetty [email protected](858)999-999901/01/20XX78 Westchester Blvd, Jacksonville FLLorne [email protected](465)789-772201/15/20XX52 Chalmers Street, Cape Coral FLDave [email protected](467)987-788802/01/20XX799 Brooke Ave, Jacksonville FLChristina [email protected](465)789-777702/09/20XX55 Halo Court, Miami FLTashia Mackenzie
Total Active: 7
ClosedCommissionSidesVolumeDaysClose DateLead DateAddressTrans. #Name
12,750.001.00425,00030 01/31/20XX01/01/20XX85 Brooklyn Drive, Tampa060James SmithTotal Closed: 1 12,750.001.00425,00030
CancelledEmailPhone #Lead [email protected](789)797-778810/01/200855 Azores Court, Orlando FLJefferey [email protected](987)789-789911/01/200863 Crossover Road, Tallahassee FLLaura Kennedy
Total Cancelled: 2
Prepared by: Linda Jones-ReeseFebruary 11, 20XX, 04:46:46 PM
Lone Wolf Technologies [2.L.2] brokerWOLF (Version XX.01.03) Page: 1 of 1
DO YOU GET CREDIT FOR WHAT YOU DO FOR AGENTS?Knowing what you’ve done for them is critical. Clearly identify which of your agents are converting leads and how many days it takes for a lead to close. If you are investing to generate leads, this shows where your dollars are best spent.
Real Numbers… Real Insights
Show your agents how you are helping them get more business,
reinforce the value of your partnership
Opportunity to coach agents

15
CanAmera Realty [8.5.9.2]
Fee Target Report - COM. SPLIT - DetailedFrom January 01, 20XX To December 31, 20XX Fee = 30.00%
Trans. # Address Class. StatusOfferDate
CloseDate
Comm.Flag
FeeAmount %
DecliningBalance
010 - Bower,James 24,000.00060111 45 Chestnut Ave B Closed 01/01/20XX 02/21/20XX Yes 1,976.70 30.0 22,023.30 060107 35 Hilton Circle C Closed 01/10/20XX 04/16/20XX Yes 2,546.25 30.0 19,477.05060110 142 Blake Street A Closed 01/11/20XX 05/18/20XX Yes 3,588.00 30.0 15,889.05 060120 22 Maple Road B Closed 01/01/20XX 05/22/20XX Yes 2,748.75 30.0 13,140.30060103 865 Manitou Drive B Firm 02/15/20XX 06/11/20XX Yes 2,075.85 30.0 11,064.45060112 89 Platte Street B Firm 01/01/20XX 08/11/20XX Yes 2,400.00 30.0 8,664.45060104 8875 Pond Road C Firm 03/04/20XX 09/15/20XX Yes 1,992.24 30.0 6,672.21060105 12 Weber Street A Firm 04/12/20XX 10/22/20XX Yes 2,896.32 30.0 3,775.89
20,224.11Report Total: 20,224.11 3,775.89 **
** Total only includes agent balances that have limitsA OFFICE DOUBLE ENDER B SELLING SIDE C LISTING SIDED AGENT DOUBLE ENDER E APPRAISAL OR VALUATION FEE H REFERRALS
Prepared by: Bailey WestwoodJune 13, 20XX, 04:13:28 PM
Lone Wolf Technologies [8.5.9.2] brokerWOLF (Version XX.06.01) Page: 1 of 1
CanAmera Realty [8.5.9.1]
Fee Summary Report
Agent Fee Name Fee # Collected Start End Target StatusMurphy, Joanne - 004 COM. SPLIT 28,000.00 2 4,625.95 01/01/20XX 12/31/20XX 4,219.18 406.77Thompson, Barbara - 005 COM. SPLIT 20,000.00 2 2,050.00 01/01/20XX 12/31/20XX 3,013.70 -963.70Bower, James - 010 COM. SPLIT 24,000.00 3 4,937.60 01/01/20XX 12/31/20XX 3,616.44 1,321.16Ryan, Chelsey - 014 COM. SPLIT 29,000.00 1 1,100.00 01/01/20XX 12/31/20XX 4,369.86 -3,269.86Hamsher, Austin - 020 COM. SPLIT 25,000.00 4 25,000.00 01/01/20XX 12/31/20XX 3,767.12 21,232.88
LegendCompletedOn TargetOff Target
Prepared by: Lone Wolf Software Support StaffFebruary 25, 2014, 08:58:54 AM
Lone Wolf Software [8.5.9.1]brokerWOLF (Version 14.02.02) Page: 1 of 1
EVER HAD AN AGENT WHO DIDN’T PRODUCE ENOUGH TO COVER THEIR FEES?... and not find out until it was too late! Generate a report showing how an agent is progressing in paying their split and how much is left to cover. Be proactive and have the conversation early enough to ensure that they cover their fees. Especially since you can’t turn around and get the money elsewhere for your bills.
Real Numbers… Real Insights
Clearly see who is coming up short on their contract
What do you do now?A) Have them pay it?B) Add on to next year?C) Eat it?
What you hoped to get! Eye catching graphic to help you read the report

16
CanAmera Realty [8.5.P]
Transaction Production ReportAgent: 010 - Bower, James (North Office)
Listings
Type Address% of Listing
Listing # Seller Status List Date Expiry Date Listing VolumeRes. 42155 Fern Hill Road, Steamboat000003 Doug Simpson Available 11/15/20XX 09/30/20XX 100.00 239,500Res. 2965 Trails Edge Road, Steamboat000004 Mary Bennett Sold/Closed 01/18/20XX 10/01/20XX 100.00 459,900Res. 33855 Pine Drop Drive, Steamboat000002 Andrew Aitken Firm Sale/Pending 10/03/20XX 11/16/20XX 100.00 175,000
Listing Count: 3 874,400
Pending Transactions - (Close Date: 01/01/2013 - 12/31/2013)
Type Address% of Sale
Trans. # Firm Listing # Firm Date Close Date Side Sides Volume CommissionListing Side
Res. 142 Blake Street, Colorado Springs060110 Yes 000019 01/11/20XX 09/01/20XX 100.00 1.00 555,000 11,960.00Res. 33855 Pine Drop Drive, Steamboat Springs 80477060199 Yes 000002 06/12/20XX 07/18/20XX 100.00 1.00 349,600 8,740.00
Total # of Listing Sides: 2.00 904,600 20,700.00Selling Side
Res. 89 Fairfax Drive, Denver060197 Yes 06/30/20XX 07/31/2013 100.00 1.00 265,800 6,645.00Total # of Selling Sides: 1.00 265,800 6,645.00
Total # of Sides For Pending Transactions - (Close Date: 01/01/20XX - 12/31/20XX): 3.00 1,170,400 27,345.00
Closed Transactions - (Close Date: 01/01/2013 - 12/31/2013)
Type Address% of Sale
Trans. # Listing # Firm Date Close Date Side Sides Volume CommissionListing Side
Res. 102 Tremont St, Boulder060102 000020 02/22/20XX 06/12/20XX 100.00 1.00 899,500 26,735.00Res. 35 Hilton Circle, Colorado Springs060107 000016 01/10/20XX 04/16/20XX 100.00 1.00 349,500 8,487.50Res. 12 Weber Street, Denver060105 000004 04/12/20XX 06/19/20XX 100.00 1.00 450,200 9,654.40
Total # of Listing Sides: 3.00 1,699,200 44,876.90Selling Side
Res. 22 Bassett Street, Denver060109 12/31/20XX 06/24/20XX 100.00 1.00 375,500 8,843.03Res. 22 Maple Road, Denver060120 05/01/20XX 05/22/20XX 100.00 1.00 366,500 9,162.50
Total # of Selling Sides: 2.00 742,000 18,005.53Total # of Sides For Closed Transactions - (Close Date: 01/01/20XX - 12/31/20XX) 5.00 2,441,200 62,882.43
Sides Volume Commission
Listings Totals: 3.00 874,400Pending Transactions - (Close Date: 01/01/20XX - 12/31/20XX) Totals: 3.00 1,170,400 27,345.00
Closed Transactions - (Close Date: 01/01/20XX - 12/31/20XX) Totals: 5.00 2,441,200 62,882.43
Sides: Listing/Listing Other/Selling/Selling Other Listings: IncludedFirm Types: Firm/Conditional New Written Transactions: Not Included
Property Types: Residential/Commercial Pending Transactions: IncludedSorted By: Agent Name Closed Transactions: Included
Prepared by: Debra JonesJuly 24, 20XX 03:45:34 PM
Lone Wolf Technologies [8.5.P] brokerWOLF (Version XX.06.01) Page: 1 of 1
ARE YOUR AGENTS BUILDING A FUTURE OR LIVING IN THE PAST?See how their business is unfolding for the year! This report is a great snapshot to show agents where they are at with listings, pendings and closed transactions. You can discuss this report with your agents directly or email them their own report with 1 click. Technology actually making your life easier!
Real Numbers… Real Insights
Projected income for rest of year
YTD volume
Potential Sales

17
CanAmera Realty [8.7.1]
Agent Payroll History Report - DetailedFrom May 01, 20XX To February 04, 20XX
Multi-Cheque Breakdown: Yes
Chk # Date Trans. # Address Gross E&O Split Charity Expenses Net501 - Charmaine LasalleEFT4 05/07 060011 122 Crawford Crescent 8,925.00 25.00 3,570.00 0.00 0.00 5,330.0000025 05/07 060012 2120 Mason Road 5 4,987.50 25.00 1,990.79 0.00 0.00 2,971.7100049 06/06 060020 200 Lakeview Road 220 5,757.50 25.00 1,727.25 0.00 0.00 4,005.2500067 07/07 060032 176 Seabreeze Shores Blvd. 4,770.00 25.00 1,431.00 0.00 0.00 3,314.0000068 07/07 060033 1200 Leader Street 505 5,197.50 25.00 1,559.25 0.00 0.00 3,613.2500083 08/06 060040 24 Siver Sunset Road 4,275.00 25.00 1,282.50 0.00 0.00 2,967.5000084 08/06 060041 1455 Lorimer Street 7 3,247.50 25.00 974.25 0.00 0.00 2,248.2500095 09/06 060048 99 Kissimmee Lane 3,990.00 25.00 1,197.00 0.00 0.00 2,768.0000118 10/07 060058 22 Parkside Place 5,458.75 25.00 1,247.39 0.00 0.00 4,186.3600136 11/04 060065 87 Rolling Waves Circle 8,955.00 25.00 1,791.00 0.00 0.00 7,139.0000137 11/04 060066 77 Tropic Drive 4,612.50 25.00 922.50 0.00 0.00 3,665.0000156 12/05 060073 9 Lemon Drop Crescent 8,400.00 25.00 1,680.00 50.00 0.00 6,645.0000157 12/05 060076 86 Seafarer Court 6,997.50 25.00 1,399.50 50.00 0.00 5,523.0000005 12/31 060021 4100 Route B 3,450.00 25.00 1,035.00 0.00 122.80 2,267.2000180 01/04 060084 62 Catamaran Court 19,350.00 25.00 2,648.26 50.00 0.00 16,626.7400192 02/04 060091 11 Seahorse Crescent 9,687.50 25.00 968.75 50.00 0.00 8,643.7500193 02/04 060096 1422 Sunset Glow Street 2,370.00 25.00 237.00 50.00 0.00 2,058.0000003 02/04 060057 14 Gator Gate 1,824.00 25.00 547.20 0.00 100.00 1,151.80ESCROW 02/04 060085 31 Ranwood Drive 2,848.50 25.00 569.70 50.00 150.00 2,053.8000004 02/04 060047 75 Crestview Ridge Manor 5,890.00 25.00 1,767.00 0.00 250.00 3,848.00
120,993.75 500.00 28,545.34 300.00 622.80 91,025.61
Prepared by: Linda Jones-ReeseFebruary 04, 20XX, 04:42:12 PM
Lone Wolf Technologies [8.7.1] brokerWOLF (Version XX.01.03) Page: 1 of 1
DON’T WASTE EVEN A MINUTE OF YOUR TIME!What are your Agent’s 1099’s going to be based upon this year? Be proactive at year-end by printing or e-mail-ing the Agent Earnings report and know for sure before you ever have to create your 1099’s. Clear, quick and straightforward, the way it should be!
Real Numbers… Real Insights
Easy summary for their accountant, no more shoe
box of pay stubs!

18
CanAmera Realty [8.B.3]
Budget for Agent 010 - Bower, James for Year Ending: December 31, 20XXVariance Calculated up to: December 31, 20XX
MonthBudget
Ends Volume Rate CommissionActual
Ends Volume Rate CommissionVariance
Ends Volume Rate Commission010 - Bower, James
January 20XX 1.00 250,000.00 3.00% 7,500.00 3.00 840,300.00 2.36% 19,859.00 2.00 590,300.00 -0.64% 12,359.00February 20XX 1.00 250,000.00 3.00% 7,500.00 2.00 799,000.00 2.14% 17,078.50 1.00 549,000.00 -0.86% 9,578.50March 20XX 2.00 500,000.00 3.00% 15,000.00 3.00 1,214,500.00 2.30% 27,985.00 1.00 714,500.00 -0.70% 12,985.00April 20XX 3.00 750,000.00 3.00% 22,500.00 2.00 719,300.00 2.46% 17,695.52 -1.00 -30,700.00 -0.54% -4,804.48May 20XX 4.00 1,000,000.00 3.00% 30,000.00 3.00 1,217,300.00 2.50% 30,475.00 -1.00 217,300.00 -0.50% 475.00June 20XX 6.00 1,500,000.00 3.00% 45,000.00 3.00 1,644,500.00 2.69% 44,298.23 -3.00 144,500.00 -0.31% -701.77July 20XX 8.00 2,000,000.00 3.00% 60,000.00 8.00 2,638,400.00 2.56% 67,664.01 0.00 638,400.00 -0.44% 7,664.01August 20XX 8.00 2,000,000.00 3.00% 60,000.00 9.00 2,623,000.00 2.82% 73,870.60 1.00 623,000.00 -0.18% 13,870.60September 20XX 3.00 750,000.00 3.00% 22,500.00 2.00 1,049,000.00 2.53% 26,574.50 -1.00 299,000.00 -0.47% 4,074.50October 20XX 1.00 250,000.00 3.00% 7,500.00 1.00 299,500.00 2.50% 7,487.50 0.00 49,500.00 -0.50% -12.50November 20XX 1.00 250,000.00 3.00% 7,500.00 1.00 100,000.00 2.50% 2,500.00 0.00 -150,000.00 -0.50% -5,000.00December 20XX 1.00 250,000.00 3.00% 7,500.00 1.00 325,000.00 2.23% 7,250.00 0.00 75,000.00 -0.77% -250.00
39.00 9,750,000.00 3.00% 292,500.00 38.00 13,469,800.00 2.54% 342,737.86 -1.00 3,719,800.00 -0.46% 50,237.86
Average Selling Price: 250,000.00 Average Selling Price: 354,468.42 Average Selling Price: 104,468.42
Prepared by: Michelle KoracaOctober 15, 20XX, 04:33:22 PM
Lone Wolf Technologies [8.B.3] brokerWOLF (Version XX.08.05) Page: 1 of 1
ARE YOU DEVELOPING YOUR AGENTS?You should be guiding them to achieve their goals. But do they even set goals? Help your agents with creating a budget and tracking their progress. This simple to use function and report in the system, creates an amazing opportunity to interact with and coach your agents. Remember, if they do well, you do well!
Real Numbers… Real Insights
Set the budget with your agent
Track them monthly to see how they are doing
Take corrective action to keep them on track

19
CanAmera Realty89 Essex AveDenver CO 098981
General EXPENSE STATEMENT # 201308Statement Date: August 31, 20XX
Summary Of Expense Account ActivityPrevious Balances: $1,158.25Expenses Charged: 1,507.25
Payments Received: -2,115.50Expense Total Now Due: $550.00
Agt. # 003 (1)Amy Morrow23 Concession AveDenver CO 456422
Summary Of New ChargesPersonal ExpensesCD Description Vend# Invoice# Date Quantity Cost Extended20 ADVERT.
AD FOR 102 MAIN STREETREAL 072013 08/01/20XX 1.00 42.00 42.00
08 COURIERCOURIER FOR 89 BELLAMY AVE
COUR 2536 08/05/20XX 1.00 29.90 29.90
01 LONG DISTANCE BELL 072013 08/15/20XX 1.00 46.50 46.5002 CELLULAR PHONE BELL 072013 08/15/20XX 1.00 65.85 65.8507 BUSINESS CARDS COL001 5289 08/19/20XX 3.00 35.00 105.0015 SIGNS SIGN 63526 08/25/20XX 1.00 05.50 105.5005 PHOTOCOPIES CANA 082013 08/31/20XX 125.00 0.10 12.5035 E & O INSURANCE OSTIC 083013 08/31/20XX 1.00 100.00 100.00
507.25
Office ChargesCD Description Vend# Invoice# Date Quantity Cost Extended45 DESK FEE 08/01/20XX 1.00 1,000.00 1,000.00
1,000.00
Payments Made In This PeriodCD Description Check # Date Trans. # Address AmountCH Cash Payment VISA 08/13/20XX -525.00CH Cash Payment 41 08/19/20XX -1,040.50CH Commission check 060112-A 00012 08/22/20XX 060112 89 Platte Street, -550.00
-2,115.50
Prepared by: Bailey WestwoodJuly 25, 20XX, 01:21:42 PM
Lone Wolf Technologies [8.6.1] brokerWOLF (Version XX.06.01) Page: 1
Previous Balance$1,158.25
Expenses Charged1,507.25
Payments Received-2,115.50
Total Now Due$550.00
Overdue Expense BreakdownCurrent
1,105.7531-60 Days
0.0061-90 Days
-555.7591-120 Days
0.00Over 120 Days
0.00
IS YOUR STAFF INUNDATED WITH QUESTIONS FROM AGENTS?Eliminate the ones you can by emailing them a copy of their expense statement with one click directly out of brokerWOLF. With the Agent Expense Statement report in the agents’ inbox, your staff can get back to doing what they should be, driving your office forward.
Real Numbers… Real Insights
Track how they are received
Clearly tell them what
is due
Show the detail so
there are no questions

20
CanAmera Realty [8.6.6]
Expenses Uncovered - All SheetsAs At May 31, 20XX
Deals Closing WithinO/S UncoveredAgent # Agent/Staff Name Last Charge Last Payment Expenses 30 Days 60 Days Over 60 Expenses
012 Allen, David 05/31/20XX 04/15/20XX 4,396.62 5,278.36 0.00 0.00 0.00010 Bower, James 05/31/20XX 04/28/20XX 11,219.47 6,831.45 8,611.20 10,324.08 0.00008 Fernendes, Jeremy 05/01/20XX 04/22/20XX 625.00 0.00 0.00 0.00 625.00011 Gray, Teresa 05/31/20XX 04/28/20XX 10,051.35 9,777.12 14,970.51 0.00 0.00003 Morrow, Amy 05/31/20XX 04/16/20XX 2,852.76 4,151.70 0.00 0.00 0.00004 Murphy, Joanne 05/31/20XX 04/30/20XX 1,626.95 0.00 0.00 0.00 1,626.95005 Thompson, Barbara 05/31/20XX 04/22/20XX 1,646.32 5,141.37 0.00 7,677.10 0.00002 Wales, Donna 05/31/20XX 04/25/20XX 2,802.56 0.00 8,520.48 0.00 0.00009 Wallace, Jonathan 05/01/20XX 04/29/20XX 1,300.00 0.00 0.00 0.00 1,300.00
Report Totals : 36,521.03 31,180.00 32,102.19 18,001.18 3,551.95
Office SummaryAgents
UncoveredExpensesAverage
9 394.66 3,551.959 394.66 3,551.95
Prepared by: Bailey WestwoodMay 31, 20XX, 09:59:43 AM
Lone Wolf Technologies [8.6.6] brokerWOLF (Version XX.05.01) Page: 1 of 1
EVER LOST MONEY BECAUSE AN AGENT WAS UNABLE TO COVER THEIR EXPENSES?Uncover exactly where risk lies in collecting fees from agents. The final column of this report is the difference between what an agent owes and what future commission an agent will be receiving, meaning what expenses are uncovered. Focus on your potential bad debts before they walk out the door.
Real Numbers… Real Insights
Biggest number not a bad debt
Smallest number hiding under the big number
Your bad debt

21
CanAmera Realty [8.6.A]
Agent Expense Annual Summary - by Agent Name - All (Excluding Shadow) SheetsYear ended December 31, 20XX
Code Description Jan. 'XX Feb. 'XX Mar. 'XX Apr. 'XX May 'XX Jun. 'XX Jul. 'XX Aug. 'XX Sep. 'XX Oct. 'XX Nov. 'XX Dec. 'XX Total CRACI Crawford, Cindy
AD ADVERTISING - BROKERAGE 50.00 0.00 450.00 50.00 50.00 50.00 50.00 50.00 50.00 50.00 50.00 50.00 950.00
AO ADVERTISING PROMOTION 0.00 75.00 650.00 250.00 850.00 150.00 250.00 420.00 0.00 350.00 300.00 100.00 3,395.00
BD BOARD DUES & FEES 25.00 75.00 25.00 25.00 25.00 25.00 50.00 50.00 25.00 49.50 30.00 25.00 429.50
DF DESK FEE 1,000.00 1,000.00 1,000.00 1,000.00 1,000.00 1,350.00 1,350.00 1,350.00 1,350.00 1,350.00 1,000.00 1,000.00 13,750.00
EO E & O INSURANCE 100.00 100.00 100.00 100.00 100.00 100.00 100.00 100.00 100.00 100.00 100.00 100.00 1,200.00
IT TECHNOLOGY FEE 25.00 25.00 50.00 50.00 50.00 50.00 50.00 75.00 50.00 50.00 25.00 25.00 525.00
MS MISCELLANEOUS 12.00 12.00 12.00 12.00 12.00 12.00 112.00 12.00 12.00 137.00 12.00 12.00 369.00
PC PHOTOCOPIES 27.00 17.36 81.75 88.80 122.50 60.00 42.00 33.00 60.00 68.00 32.50 17.75 650.66
Total Taxes
Total ChargedPayments / Cash receiptsTotal
0.00
1,239.00-800.00
439.00
0.00
1,304.36-1,200.00
104.36
0.00
2,368.75-2,343.75
25.00
0.00
1,575.80-1,700.00
-124.20
0.00
2,209.50-500.00
1,709.50
0.00
1,797.00-1,700.00
97.00
0.00
2,004.00-3,483.05
-1,479.05
0.00
2,090.00-485.00
1,605.00
0.00
1,647.00-935.00
712.00
0.00
2,154.50-847.50
1,307.00
0.00
1,549.50-755.00
794.50
0.00
1,329.75-1,275.00
54.75
0.00
21,269.16-16,024.30
5,244.86
Prepared by: Bailey WestwoodAugust 16, 20XX, 01:03:41 PM
Lone Wolf Technologies [8.6.A] brokerWOLF (Version XX.07.04) Page: 1 of 1
HELP YOUR AGENT HELP THEMSELVES!Invariably at tax time, your Agent will come to you asking for their last 12 months of statements. Print or e-mail this simple one page report and your problem is solved.
Real Numbers… Real Insights
Identify what they still owe!
Provides totals for each billable item, making
reporting of expenses easy

22
CanAmera Realty [8.6.5]
General Expense Listing by Chargeable Item CodeFrom July 01, 20XX To October 01, 20XX
All Offices
Quantity Expense HST PaymentCode: 45 Desk Fee
Agent: 216 Allen, David 3.00 900.00 117.00 678.00Agent: 208 Ashford, Bill 3.00 1,500.00 195.00 0.00Agent: 207 Baker, Robert 3.00 1,500.00 195.00 1,695.00Agent: 205 Bond, Howard 3.00 1,500.00 195.00 1,000.00Agent: 212 Clark, Larry 3.00 1,200.00 156.00 800.00Agent: 214 Drew, Trevor 3.00 1,500.00 195.00 0.00Agent: 206 Finnman, Gail 3.00 1,500.00 195.00 700.00Agent: 203 Scott, Olivia 3.00 750.00 97.50 247.50
Code Total: 24.00 10,350.00 1,345.50 5,120.50Code: IT Technology Fee
Agent: 216 Allen, David 3.00 75.00 9.75 56.50Agent: 208 Ashford, Bill 3.00 75.00 9.75 0.00Agent: 207 Baker, Robert 3.00 75.00 9.75 0.00Agent: 205 Bond, Howard 3.00 75.00 9.75 50.00Agent: 212 Clark, Larry 3.00 75.00 9.75 84.75Agent: 214 Drew, Trevor 3.00 75.00 9.75 43.00Agent: 206 Finnman, Gail 3.00 75.00 9.75 0.00Agent: 209 Gaze, Al 3.00 75.00 9.75 28.25Agent: 201 Gibson, Dan 3.00 75.00 9.75 56.50Agent: 213 Grummett, Ralph 3.00 75.00 9.75 84.75Agent: 202 Hammond, Matthew 3.00 75.00 9.75 54.89Agent: 211 Herman, Rich 3.00 75.00 9.75 0.00Agent: 204 Hilsen, Kelly 3.00 75.00 9.75 56.50Agent: 210 Macmillan, Jeff 3.00 75.00 9.75 28.25Agent: 215 Sand, Jodie 3.00 75.00 9.75 53.28Agent: 203 Scott, Olivia 3.00 75.00 9.75 27.84Agent: 200 Shubert, Karen 3.00 75.00 9.75 84.75
Code Total: 51.00 1,275.00 165.75 709.26Code: WB Website Maintenance
Agent: 216 Allen, David 3.00 135.00 17.55 101.70Agent: 208 Ashford, Bill 3.00 135.00 17.55 0.00Agent: 207 Baker, Robert 3.00 135.00 17.55 0.00Agent: 205 Bond, Howard 3.00 135.00 17.55 152.55Agent: 212 Clark, Larry 3.00 135.00 17.55 105.25Agent: 214 Drew, Trevor 3.00 135.00 17.55 46.15Agent: 206 Finnman, Gail 3.00 135.00 17.55 152.55Agent: 209 Gaze, Al 3.00 135.00 17.55 50.85Agent: 213 Grummett, Ralph 3.00 135.00 17.55 67.52Agent: 211 Herman, Rich 3.00 135.00 17.55 152.55Agent: 204 Hilsen, Kelly 3.00 135.00 17.55 101.70Agent: 210 Macmillan, Jeff 3.00 135.00 17.55 50.85Agent: 203 Scott, Olivia 3.00 135.00 17.55 0.00Agent: 200 Shubert, Karen 3.00 135.00 17.55 116.00
Code Total: 42.00 1,890.00 245.70 1,097.67Grand Total: 117.00 13,515.00 1,756.95 6,927.43
Prepared by: Bailey WestwoodOctober 21, 20XX, 04:47:40 PM
Lone Wolf Technologies [8.6.5] brokerWOLF (Version XX.10.03) Page: 1 of 1
EVER FORGET TO CHARGE A RECURRING FEE TO AN AGENT?And then you lost the revenue all together? By reviewing the Expense Listing by Chargeable Item Code report every month, you will ensure any changes in your agent roster will be caught before it is too late. Attention to detail doesn’t have to take time, it just needs to be possible. With this report it is!
Real Numbers… Real Insights
Are you missing some desk fees
during this period?
Number of expenses charged
in period
Identify who has
paid

23
CanAmera Realty 00001437 Essex Point
Cambridge,ONProperty:
Type: RESIDENTIALClass.: LISTING SIDE Status: Closed MLS #: 45122
O�er Date: January 21, 20XX Entry Date: January 21, 20XX No ConditionsFirm Date: April 15, 20XX Close Date: April 15, 20XX
Contacts:Type End Name Phone # Address Contact Work/FaxBuyer S Jason Spitz (755)789-7777 37 Essex Point, Cambridge, ONSeller L Jane Miller (416)858-9999 564 Darrien Road, Willowdale, ON, N2H-2P6Solicitor L Pitcher & Associates (465)478-9777 700 President Street, Toronto, ON, M1T-2N8 Jim Pitcher ( ) -Solicitor S Hansen & Botello (465)479-8798 2053 Foxgrove, Missisauga, ON, M1T-3M1 Brian Botello ( ) -
Outside Brokers:Type End Name Phone # Address Agent FaxOutside Broker S Realty Executives of GTA (451)657-8979 2000 Wist�eld, Cambridge, ON, N2H-2P9 Donald Collver (789)778-9999
Deposit:Bank Account Date Amount Int. Included Received Int. Bearing Held By Received FromTrust 01/21/20XX $5,000.00 $0.00 Y N CanAmera Realty Jason Spitz
Financial:Selling Price: $265,000.00 Listing Comm. Rate: 3.00% Selling Comm. Rate: 3.00% A/R: $11,695.00
Income Listing Listing Other Selling Selling Other Sub-Total GST TotalCommission $7,950.00 $0.00 $7,950.00 $0.00 $15,900.00 $795.00 $16,695.00
ExpensesO.B. Realty Executives of GTA/Donald Col $0.00 $0.00 $7,950.00 $0.00 $7,950.00 $397.50 $8,347.50
Base O�ce Commission $7,950.00 $0.00 $0.00 $0.00 $7,950.00 $397.50 $8,347.50
Agents(A) 006 - Agent, Andy GST#:9999999999 $6,950.00 $0.00 $0.00 $0.00 $6,950.00 $347.50 $7,297.50
LiabilitiesSPLIT FEE $1,000.00 $0.00 $0.00 $0.00 $1,000.00 $50.00 $1,050.00
Net to O�ce $0.00 $0.00 $0.00 $0.00 $0.00 $0.00 $0.00
Agents:(A) 006 - Agent, Andy
Listing: 100.00% End Cnt: 1.00Agent Base $7,950.00SPLIT FEE 12.57% $1,000.00
$6,950.00
Trust Activity Date Reference Amount O�ce # 2: 100.00% End: ListingJason Spitz 01/21/20XX TR000014 $5,000.00
It is understood between all parties that this agreement shallCambridge on the Grand Realty 01/21/20XX 00002 $-5,000.00constitute a Commission Trust Agreement as set out in the contract.Balance $0.00
Commission Trust Activity Date Reference AmountTo the best of my knowledge the above information is correct. DatedPitcher & Associates 01/21/20XX 7789 $11,695.00at Cambridge on April 15, 20XX006 000014-A Agent, Andy 01/21/20XX 00014 $-6,797.50
Trust Funds Transferred 01/21/20XX 00002 $5,000.00***** O�ce Copy *****Realty Executives of GTA 04/15/20XX 00021 $-8,347.50Agent: 006 - Agent, Andy (2)Lone Wolf Real Estate Technolo 04/15/20XX 00022 $-1,550.00
Balance $0.00General Activity Date Reference Amount Signature:_____________________________________________TR000014-A Lone Wolf Real Esta 04/15/20XX CH00022 $1,550.00
Broker of Record: CanAmera RealtyBalance $1,550.00
Signature:_____________________________________________Trade #: 000014
Prepared by: Bailey WestwoodApril 15, 20XX, 09:53:37 AM
Lone Wolf Technologies [2.1.P] brokerWOLF (Version XX.03.03) Page: 1 of 1
IS YOUR TRANSACTION DATA AT YOUR FINGER TIPS?Having live data makes pulling a transaction literally a click of a button. The Transaction Record Sheet report has all the information to satisfy a Real Estate Council request. Eliminate wasted time and know you have the right information at your finger tips.
Real Numbers… Real Insights
Shows net to office and agent
expenses deducted on each deal
Clearly see disbursements for each deal
Agent and broker can both sign off on the transaction agreement

24
CanAmera Realty [2.P.1.2]
Transaction Action Report - Pay Out Report as of July 25, 20XX
Prepared by: Bailey WestwoodJuly 25, 20XX, 03:00:19 PM
Lone Wolf Technologies [2.P.1] brokerWOLF (Version XX.06.01) Page: 1 of 1
DO YOU KNOW YOUR TRANSACTIONS ARE BEING CLOSED PROPERLY?Understand which transactions are still outstanding and get the funds into your business immediately by following up on a timely basis. Run this report monthly to ensure your team is closing off transactions completely.
Real Numbers… Real Insights
Your office hasn’t been paid yet
Identifies which deals require action to ensure everyone gets paid,
including your office!
Agents and outside brokers haven’t been paid yet
Why hasn’t this deal been paid yet?

25
CanAmera Realty [2.P.2]
Pending Transaction Report (Firm and Conditional) from June 01, 20XX to August 31, 20XX
Trans. # Address MLS #Type/Cls. Closing A/R Trust Dep. Commission Exp. Fees O/Brokers Pay Agents Agent Liab. Net
060101 89 Cheyenee Pl RS/B 06/01/20XX * 11,985.00 0.00 11,985.00 0.00 0.00 6,831.45 359.55 4,794.00060103 865 Manitou Drive RS/B 06/11/20XX * 6,919.50 0.00 6,919.50 0.00 0.00 4,151.70 0.00 2,767.80060105 12 Weber Street RS/A 06/18/20XX * 8,458.20 10,000.00 18,458.20 250.00 0.00 11,071.00 281.61 6,855.59 060106 4402 King Street RS/B 06/28/20XX * 6,888.50 0.00 6,888.50 0.00 0.00 5,141.37 25.00 1,722.13060104 8875 Pond Road RS/C 06/30/20XX * 4,380.80 10,000.00 14,380.80 250.00 7,490.00 3,984.48 0.00 2,656.32
Total # of Transactions For June, 20XX: 5Recurring Billing: 8,450.00
27,245.84
38,632.00 20,000.00 58,632.00 500.00 7,490.00 31,180.00 666.16 18,795.84
060107 35 Hilton Circle RS/C 07/02/20XX * 7,475.00 10,000.00 17,475.00 250.00 8,737.50 6,620.25 0.00 1,867.25060108 16 Edward Street RS/A 07/11/20XX * 3,714.85 20,000.00 23,714.85 250.00 0.00 15,498.99 355.02 7,610.84060110 142 Blake Street RS/A 07/24/20XX * 530.00 25,000.00 25,530.00 250.00 0.00 16,603.20 358.80 8,318.00
Total # of Transactions For July, 20XX: 3Recurring Billing: 8,450.00
26,246.09
11,719.85 55,000.00 66,719.85 750.00 8,737.50 38,722.44 713.82 17,796.09
060111 45 Chestnut Ave RS/B 08/03/20XX * 6,589.00 0.00 6,589.00 0.00 0.00 4,744.08 197.67 1,647.25 060112 89 Platte Street RS/C 08/11/20XX * 1,000.00 15,000.00 16,000.00 250.00 8,000.00 5,580.00 232.50 1,937.50060113 101 Franklin Ave RS/D 08/16/20XX * 2,878.50 10,000.00 12,878.50 0.00 0.00 7,677.10 50.00 5,151.40
Total # of Transactions For August, 20XX: 3Recurring Billing: 8,450.00
17,186.15
10,467.50 25,000.00 35,467.50 250.00 8,000.00 18,001.18 480.17 8,736.15
Total # of Transactions: 11 60,819.35 100,000.00 160,819.35 1,500.00 24,227.50 87,903.62 1,860.15 45,328.08
* - Firm Transactions Total Firm Transactions: 45,328.08
Aging By Weeks Aging By MonthsOverdue $0.00 Overdue $0.001 Week $4,794.00 1 Month $18,795.842 Weeks $2,767.80 2 Months $17,796.093 Weeks $6,855.59 3 Months $8,736.154 Weeks $1,722.13 4 Months $0.00Beyond $29,188.56 Beyond $0.00
$45,328.08 $45,328.08
Classifications:A Office Double Ender B Selling Side C Listing SideD Agent Double Ender E Appraisal Or Valuation Fee H Referrals
Recurring Billing:45 DESK FEE ($8,450.00)
Prepared by: Bailey WestwoodMay 31, 20XX, 01:45:51 PM
Lone Wolf Technologies [2.P.2] brokerWOLF (Version XX.05.01) Page: 1 of 1
HAS CASH FLOW EVER BEEN TIGHTER THAN YOU WANTED?The Pending Transaction Report is your crystal ball, showing you the future. Knowing how much revenue you’ll be generating in future months allows you to start directing activities to ensure future success. Real estate transactions can span several weeks or months and the time to know there is not enough coming is before the month happens, not after.
Real Numbers… Real Insights
Project your income for future months including recurring agent charges
Separate agent deductions not staying in your office
Shows agents recurring office charges
View your transaction pipeline

26
CanAmera Realty [2.P.3]
Transaction Register Report from January 08, 20XX to January 31, 20XXAll Offices
Trans. # Address Office Firm Cls. Offer Date Sell Price Deposit Base Office Pay Agents Agent Liab. Net060090 93 Conche Drive 1 FM R/L 01/14/20XX 399,000.00 0.00 9,975.00 7,905.00 2,045.00 2,070.00
Agents: 500 Richard DeanSeller: Verne/Shirley CroyerBuyer: Ramir/Sara Romez
060091 11 Seahorse Crescent 1 FM R/L 01/09/20XX 387,500.00 5,000.00 9,687.50 8,643.75 50.00 1,043.75 Agents: 501 Charmaine LaSalleSeller: Chuck/Mary WolfeBuyer: Gary/Linda Whitehead
060092 56 Coral Springs Road 1 FM R/L 01/14/20XX 210,000.00 0.00 6,300.00 5,595.00 50.00 705.00 Agents: 503 Martin JamesSeller: George StevensBuyer: Joseph/Karen Miller
060096 1422 Sunset Glow Street 1 FM R/S 01/09/20XX 118,500.00 0.00 2,370.00 2,058.00 50.00 312.00Agents: 501 Charmaine LaSalleSeller: Elsie BrownBuyer: Richard Martin
060098 36 Shady Park Place 1 Transaction AbortedAgents: 504 Norah PattersonBuyer: Johnathan & Marlese Smith
060099 10 Yacht Club Boardwalk 1 FM R/L 01/19/20XX 999,900.00 10,000.00 29,997.00 26,422.30 50.00 3,574.70Agents: 504 Norah PattersonSeller: Robert/Sharon MacMillanBuyer: Jeff Jones
060102 62 West Treetop Place 1 FM R/S 01/23/20XX 189,900.00 0.00 3,798.00 3,798.00 0.00 0.00 Agents: 517 Colin FirthBuyer: Mark/Judy Lambe
060104 85 Millcreek Drive 1 FM R/S 01/15/20XX 175,000.00 0.00 5,250.00 4,125.00 1,100.00 1,125.00Agents: 500 Richard DeanSeller: Maureen JonesBuyer: Mike Hansen
Firm Transactions: 2,479,800.00 15,000.00 67,377.50 58,547.05 3,345.00 8,830.45Conditional Transactions: 0.00 0.00 0.00 0.00 0.00 0.00
Total Transactions: 2,479,800.00 15,000.00 67,377.50 58,547.05 3,345.00 8,830.45Classification: A AGENT DOUBLE ENDER E BPO H HOME WARRANTY
L LISTING SIDE O OFFICE DOUBLE ENDER R REFERRALSS SELLING SIDE X RELO Y REOZ LEASE
Offices:1 Office 2 Office 2 ? No Office
Prepared by: Linda Jones-ReeseFebruary 12, 20XX, 10:28:52 AM
Lone Wolf Technologies [2.P.3] brokerWOLF (Version XX.01.03) Page: 1 of 1
ARE YOU MEETING YOUR REAL ESTATE COUNCIL’S TRANSACTIONAL REQUIREMENTS?Having a complete ledger for your escrow/trust files is critical for compliance with your Real Estate Council. The data is complete, ensuring not only that you are compliant, but that you address any issues that may arise with the handling of the funds. Clear, quick and straightforward, the way it should be!
Real Numbers… Real Insights
Great audit tool!
A comprehensive list of transactions including cancelled deals

27
CanAmera Realty [2.P.8.1]
Manager’s Transaction Report - All OfficesFrom July 01, 20XX To July 31, 20XX
Statuses: Closed, Open Firm, Open Conditional
Trans. # Address Office Class.CloseDate Sell Price
GrossCommission Comm. %
O/BsReferrals Pay Agents
AgentLiability Net Office
Transaction Classification: SELLING SIDE060160 1156 Essex Ave, Denver B 07/16/20XX * 799,500.00 20,787.00 2.60 375.00 6,310.78 0.00 14,101.22060187 11507 S Minton Road, Denver B 07/18/20XX * 349,200.00 8,415.72 2.41 500.00 5,516.00 25.00 2,374.72 060134 27 Holly Road, Denver B 07/29/20XX * 525,000.00 10,500.00 2.00 500.00 5,700.00 300.00 4,000.00# of Sides in class: 3 1,673,700.00 39,702.72 1,375.00 17,526.78 325.00 20,475.94
Averages: 557,900.00 13,234.24 2.33 458.33 5,842.26 108.33 6,825.31
Transaction Classification: LISTING SIDE060128 126 Cumming Ave, Denver C 07/01/20XX * 369,500.00 9,274.45 2.51 500.00 6,117.11 25.00 2,632.34060157 1123 Willow Ave, Cambridge C 07/12/20XX * 299,500.00 7,487.50 2.50 250.00 5,066.25 0.00 2,171.25060104 18875 Pond Road, Denver C 07/31/20XX * 299,600.00 6,890.80 2.30 375.00 1,954.74 0.00 4,561.06# of Sides in class: 3 968,600.00 23,652.75 1,125.00 13,138.10 25.00 9,364.65
Averages: 322,866.66 7,884.25 2.43 375.00 4,379.36 8.33 3,121.55
Transaction Classification: AGENT DOUBLE ENDER060194 17943 Ronson Road, Denver D - 07/01/20XX * 399,500.00 10,067.40 2.52 0.00 7,022.18 0.00 3,045.22060194 17943 Ronson Road, Denver D - 07/01/20XX * 399,500.00 9,987.50 2.50 325.00 6,738.75 0.00 2,923.75# of Sides in class: 2 799,000.00 20,054.90 325.00 13,760.93 0.00 5,968.97
Averages: 399,500.00 10,027.45 2.51 162.50 6,880.46 0.00 2,984.48
Transaction Classification: REFERRALS060166 136 Cumming Ave, Denver H 07/16/20XX * 699,500.00 700.00 0.10 0.00 444.00 46.00 210.00# of Sides in class: 1 699,500.00 700.00 0.00 444.00 46.00 210.00
Averages: 699,500.00 700.00 0.10 0.00 444.00 46.00 210.00
Transaction Classification: BPO060199 233855 Pine Drop Drive, Steamboat M 07/18/20XX * 349,600.00 500.00 0.14 0.00 325.00 25.00 150.00060152 17 Valentia Drive, Denver M 07/28/20XX * 329,500.00 500.00 0.15 0.00 325.00 0.00 175.00# of Sides in class: 2 679,100.00 1,000.00 0.00 650.00 25.00 325.00
Averages: 339,550.00 500.00 0.14 0.00 325.00 12.50 162.50
Total # of Sides: 11 4,819,900.00 85,110.37 2,825.00 45,519.81 421.00 36,344.56
Overall Averages: 438,172.72 7,737.30 1.79 256.81 4,138.16 38.27 3,304.05
* - Firm Transactions Total Firm: 36,344.56
Classifications:A OFFICE DOUBLE ENDER B SELLING SIDEC LISTING SIDE D AGENT DOUBLE ENDERE APPRAISAL OR VALUATION FEE H REFERRALSM BPO Q RENTAL
1 - North Office 2 - South Office
Prepared by: Debra JonesAugust 07, 20XX, 10:15:23 AM
Lone Wolf Technologies [2.P.8.1] brokerWOLF (Version XX.06.01) Page: 1 of 1
WHICH BUSINESS CLASSIFICATION IS YOUR HIGHEST SALES PRODUCTION?Never be in the dark again. Understand your company’s transaction trends and use them to build your business. See all of your closing by commission type, the allocation of commission and your company’s averages. Share this at your next office meeting and your team will know you are watching!
Real Numbers… Real Insights
Easily identify production by classification
Averages calculated by class to allow easy comparisons

28
CanAmera Realty [3.8]
Trust XXXX2333 GL#10002 Account ReconciliationAs of June 30, 20XX
Balance Per Bank Statement 119,967.00
Outstanding TransactionsTrans. # Address Payee Date Reference Amount060112 89 Platte Street Canamera Realty - General C 03/02/20XX 00103 -15,000.00060113 101 Franklin Ave Canamera Realty - General C 06/30/20XX 00151 -10,000.00060114 29 Cook Street Canamera Realty - General C 06/30/20XX 00152 -7,787.00060114 29 Cook Street Canamera Realty - General C 06/30/20XX 00153 -2,213.00060116 77 Jackson Blvd Denver Canamera Realty - General C 06/30/20XX 00154 -10,000.00060157 123 Willow Ave Canamera Realty - General C 06/30/20XX 00159 -10,000.00060199 33855 Pine Drop Drive Bruce Jones D 06/12/20XX TR060199 10,000.00060191 5814 Windsor Drive Andrea Smith D 06/29/20XX TR060191 5,000.00
Total Outstanding: -40,000.00
Misc. Outstanding TransactionsDescription Date Reference AmountBank Charges 06/30/20XX 15.00Bank Charges 05/31/20XX 18.00
Total Misc. Outstanding: 33.00
Balance Per Trust Ledger 80,000.00
Checks Cleared: -60,000.00 Total Credits Cleared: -60,000.00Deposits Cleared: 180,000.00 Total Debits Cleared: 180,000.00
* Remember, your debits are credits to the bankand vice versa.
Reviewed By: Date:
Approved By: Date:
Prepared by: Bailey WestwoodJuly 26, 20XX, 02:34:30 PM
Lone Wolf Technologies [3.8] brokerWOLF (Version XX.06.01) Page: 1 of 1
ARE YOU DOING EVERYTHING TO ELIMINATE FRAUD?Before it happens? Adding this simple step into your procedures, it is a clear signal you are watching. The Escrow Reconciliation shows your balance per bank statement. Now all you need to do is review, add comments and sign off once the reconciliation is done. These actions show you are watching, helping eliminate fraud.
Real Numbers… Real Insights
Where is this money as it should have been in the bank weeks ago!
Temporarily record items on your bank statement that haven’t been
recorded in brokerWOLF yet
Identify outstanding
items not cleared at your bank

29
CanAmera Realty [3.8]
Trust Ledger As Of June 30, 20XXClosing Deposits Liability
Trans. # Address Buyer / Seller Date In Trust For FundsBank Account: Trust Deposits In Trust G/L Account #: 10002
060110 142 Blake Street Wallace,Margaret / Hill,Angela 09/01/20XX 25,000.00 25,000.00 060169 89 Birch Ave Lahey,Jeremey / Tino,David 06/24/20XX 5,000.00 0.00*060181 4610 Penny Ave Kinsella,Nancy / Boutzis,Doug 06/26/20XX 10,000.00 0.00*060191 5814 Windsor Drive McPhadden,Louise / Stewart,Raymo 08/15/20XX 5,000.00 5,000.00060194 7943 Ronson Road Smith,George / Hart,Angie 07/01/20XX 15,000.00 15,000.00060198 29 Cumming Ave Jones,Monica / Irwin,James 08/01/20XX 10,000.00 10,000.00 060199 33855 Pine Drop Drive Aitken,Andrew 07/18/20XX 10,000.00 10,000.00
Number of Deposits: 7 80,000.00 65,000.00
Total Number of Deposits: 7Excess Trust Funds To Transfer: 15,000.00 80,000.00 65,000.00Liability for Funds G/L Account #: 21300
* - Denotes closed Transactions as of 06/30/20XX
Prepared by: Lone Wolf Technologies Support Staff July 26, 20XX, 02:34:59 PM
Lone Wolf Technologies [3.8] brokerWOLF (Version XX.06.01) Page: 1 of 1
THINK YOU MIGHT BE AUDITED?Now know you are perfect! It is critical to identify deposits in escrow versus liability for funds, make it easy with the Escrow / Trust Reconciliation Ledger report. With the click of a button, you can review this report on a regular basis. If deposits and liability totals match move onto more important items on your to-do list.
Real Numbers… Real Insights
Deal closed why have these not been transferred

30
CanAmera Realty [3.6]
Trust Sub-Ledger (Trust - G/L #10002)As of June 30, 20XX - Summary
Property Management Deals Included
Trans.# Description Buyer Seller Status Close Date Amount
142 Blake Street Wallace,Margaret Hill,Angela Open 09/01/20XX 25,000.0006011089 Birch Ave Lahey,Jeremey Tino,David Closed 06/24/20XX 5,000.000601694610 Penny Ave Kinsella,Nancy Boutzis,Doug Closed 06/26/20XX 10,000.000601817943 Ronson Road Smith,George Hart,Angie Closed 07/01/20XX* 5,000.0006019429 Cumming Ave Jones,Monica Irwin,James Open 08/01/20XX 10,000.00060198
5 Transactions<*> - Cleared as of printing dateTotal For Open Trades = 50,000.00
Report Totals: 65,000.00
Prepared by: Bailey WestwoodJuly 19, 20XX, 02:41:51 PM
Lone Wolf Technologies [3.6] brokerWOLF (Version XX.06.01) Page: 1 of 1
DO YOU KNOW YOUR ESCROW / TRUST ACCOUNT IS CLEAN?With the flow of funds to and from your escrow / trust account, are you sure there is nothing outstanding? A careful review your live data will show any errors which then can be quickly adjusted to keep your books clean.
Real Numbers… Real Insights
“*” Shows this was cleared as of the print date July 19
These should have been transferred by now as the report is June 30 and close dates are June 24 and 26
31
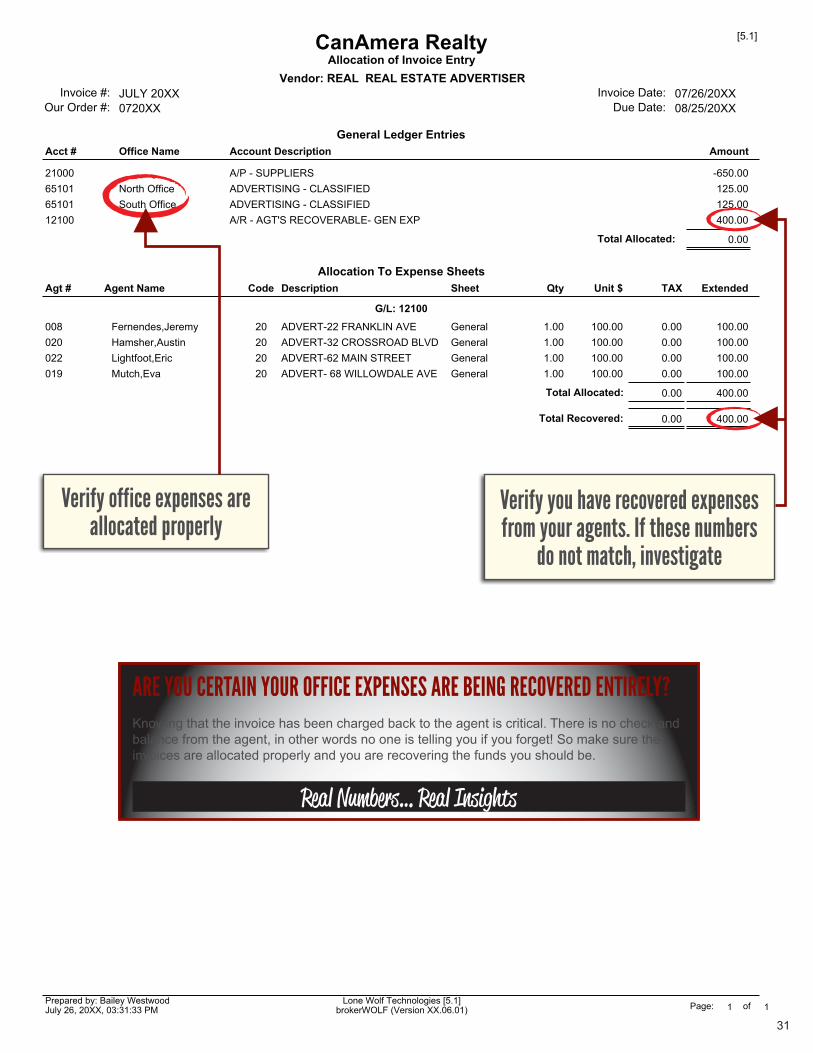
CanAmera Realty [5.1]
Allocation of Invoice EntryVendor: REAL REAL ESTATE ADVERTISER
Invoice #: JULY 20XX Invoice Date: 07/26/20XXOur Order #: 0720XX Due Date: 08/25/20XX
General Ledger EntriesAcct # Office Name Account Description Amount
-650.0021000 A/P - SUPPLIERS125.0065101 North Office ADVERTISING - CLASSIFIED125.0065101 South Office ADVERTISING - CLASSIFIED400.0012100 A/R - AGT'S RECOVERABLE- GEN EXP
0.00Total Allocated:
Allocation To Expense SheetsAgt # Agent Name Code Description Sheet Qty Unit $ TAX Extended
G/L: 12100
100.00008 Fernendes,Jeremy 20 ADVERT-22 FRANKLIN AVE General 1.00 100.00 0.00100.00020 Hamsher,Austin 20 ADVERT-32 CROSSROAD BLVD General 1.00 100.00 0.00100.00022 Lightfoot,Eric 20 ADVERT-62 MAIN STREET General 1.00 100.00 0.00100.00019 Mutch,Eva 20 ADVERT- 68 WILLOWDALE AVE General 1.00 100.00 0.00
0.00 400.00Total Allocated:
0.00 400.00Total Recovered:
Prepared by: Bailey WestwoodJuly 26, 20XX, 03:31:33 PM
Lone Wolf Technologies [5.1] brokerWOLF (Version XX.06.01) Page: 1 of 1
ARE YOU CERTAIN YOUR OFFICE EXPENSES ARE BEING RECOVERED ENTIRELY? Knowing that the invoice has been charged back to the agent is critical. There is no check and balance from the agent, in other words no one is telling you if you forget! So make sure the invoices are allocated properly and you are recovering the funds you should be.
Real Numbers… Real Insights
Verify office expenses are allocated properly
Verify you have recovered expenses from your agents. If these numbers
do not match, investigate

32
CanAmera Realty [5.6.1]
Detailed Aging ReportAs of August 20, 20XX
Vend # Name AverageTrans.# / Order# Cd Date A/P Current 31 - 60 61 - 90 91 - 120 Over 120 Days O/S
CPA001 Eide Bailey CPA Firm 21234 Post Dr (303)908-231237488 I 05/21/20XX 1,200.00 0.00 0.00 0.00 1,200.00 0.00394878 I 06/21/20XX 1,200.00 0.00 1,200.00 0.00 0.00 0.0034798 I 04/21/20XX 1,200.00 0.00 0.00 0.00 0.00 1,200.0000318 P 08/20/20XX -800.00 0.00 0.00 0.00 0.00 -800.003984798 I 08/20/20XX 1,200.00 1,200.00 0.00 0.00 0.00 0.00CR90384 C 04/28/20XX -600.00 0.00 0.00 0.00 -600.00 0.00 CR12000 A 06/20/20XX 400.00 0.00 0.00 400.00 0.00 0.00
Vendor Total: 3,800.00 1,200.00 1,200.00 400.00 600.00 400.00 81.14
DEN001 The Daily Post34859 I 08/09/20XX 400.00 400.00 0.00 0.00 0.00 0.0043598789 I 08/14/20XX 500.00 500.00 0.00 0.00 0.00 0.00 49090 I 08/16/20XX 500.00 500.00 0.00 0.00 0.00 0.003748979 I 07/20/20XX 350.00 0.00 350.00 0.00 0.00 0.00
Vendor Total: 1,750.00 1,400.00 350.00 0.00 0.00 0.00 13.00
FRA001 Franchise Office 1236 - 55 AvenueTR11000212-A I 08/16/20XX 113.70 113.70 0.00 0.00 0.00 0.00TR11000212-A I 08/16/20XX 113.70 113.70 0.00 0.00 0.00 0.00
Vendor Total: 227.40 227.40 0.00 0.00 0.00 0.00 4.00
NVE001 NV Energy PO Box 10100 (702)402-5000348799 I 02/14/20XX 350.00 0.00 0.00 0.00 0.00 350.00
Vendor Total: 350.00 0.00 0.00 0.00 0.00 350.00 187.00
SIG001 Signs Are Us - Real Estate Sign Co. 587 Brockton Drive (702)585-55858237489 I 02/14/20XX 250.00 0.00 0.00 0.00 0.00 250.00
Vendor Total: 250.00 0.00 0.00 0.00 0.00 250.00 187.00
Report Totals:
Invoices = 12 Payments = 1
Adjustments = 1 Discounts = 0
Unapplied = 0 Credits = 1
6,377.40 2,827.40 1,550.00 400.00 600.00 1,000.00 66.80
44.33% 24.30% 6.27% 9.40% 15.68%
* - Indicates paid now
Prepared by: Bailey WestwoodAugust 20, 20XX, 11:10:34 AM
Lone Wolf Technologies [5.6.1] brokerWOLF (Version XX.07.04) Page: 1 of 1
EVER MISS A VENDOR DEADLINE AND BEEN CHARGED A LATE FEE? Even when you were actively trying to pay everyone on time? The Detailed Aging report is one that will ensure you are kept fully informed about what you owe and when so nothing will slip through the cracks. Eliminate extra fees and manage your cash flow on your terms!
Real Numbers… Real Insights
Identify unapplied credits to offset payables
Over due invoices that need your attention

33
CanAmera Realty [5.2.M]
Multiple A/P Check ListingCut-Off Date: 08/31/20XX
Seq # Code Invoice # Date Due Date AmountExpectedCheck #
Vendor: BELL - Bell
1 I JULY 20XX July 08, 20XX August 07, 20XX 463.852 I JUNE 20XX June 15, 20XX June 30, 20XX 369.45
Check Amount: 833.30 00128
Vendor: CANA - CANAMERA CORPORATE
1 I TR060199-A July 18, 20XX July 18, 20XX 262.20
Check Amount: 262.20 00129
Vendor: COL001 - Colour Tech
1 I JULY 20XX July 01, 20XX July 30, 20XX 301.252 I JUNE 20XX June 15, 20XX June 30, 20XX 125.503 I MAY 20XX May 15, 20XX May 30, 20XX 269.50
Check Amount: 696.25 00130
Vendor: COUR - Express Courier Services
1 I 9625312 July 06, 20XX August 05, 20XX 36.50
Check Amount: 36.50 00131
Vendor: RAIN - RAINBOW CHILDREN'S CHARITY
1 I TR060165-A April 24, 20XX April 24, 20XX 25.002 I TR060175-A May 24, 20XX May 24, 20XX 25.003 I TR060193-A June 26, 20XX June 26, 20XX 25.004 I TR060199-A July 18, 20XX July 18, 20XX 25.00
Check Amount: 100.00 00132
Total of Checks Printed: 1,928.25Approved By:
Prepared by: Bailey WestwoodJuly 26, 20XX, 03:47:29 PM
Lone Wolf Technologies [5.2.M] brokerWOLF (Version XX.06.01) Page: 1 of 1
DO YOU WANT MORE CONTROL OF YOUR A/P CHECK PROCESSING?And increasing everyone’s productivity! The Multiple A/P Check Listing report is the most efficient way to view a check run and approve it so your team can get on with their day. You manage control, they get your approval. A win/win for the office!
Real Numbers… Real Insights
Review and give your approval before any checks are printed.
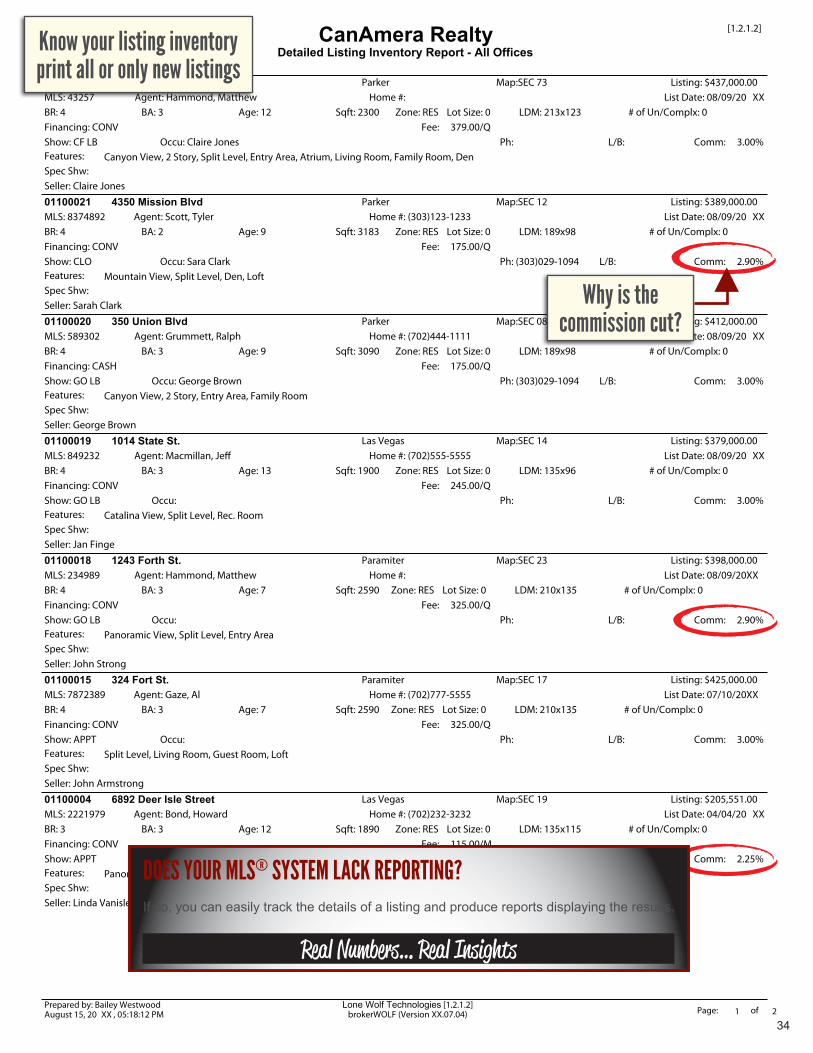
34
CanAmera Realty [1.2.1.2]
Detailed Listing Inventory Report - All Offices
01100022 6456 Fountain Street Parker Map:SEC 73 Listing: $437,000.00MLS: 43257 Agent: Hammond, Matthew Home #: List Date: 08/09/20 XXBR: 4 BA: 3 Age: 12 Sqft: 2300 Zone: RES Lot Size: 0 LDM: 213x123 # of Un/Complx: 0Financing: CONV Fee: 379.00/QShow: CF LB Occu: Claire Jones Ph: L/B: Comm: 3.00%Features: Canyon View, 2 Story, Split Level, Entry Area, Atrium, Living Room, Family Room, DenSpec Shw:Seller: Claire Jones
01100021 4350 Mission Blvd Parker Map:SEC 12 Listing: $389,000.00MLS: 8374892 Agent: Scott, Tyler Home #: (303)123-1233 List Date: 08/09/20 XXBR: 4 BA: 2 Age: 9 Sqft: 3183 Zone: RES Lot Size: 0 LDM: 189x98 # of Un/Complx: 0Financing: CONV Fee: 175.00/QShow: CLO Occu: Sara Clark Ph: (303)029-1094 L/B: Comm: 2.90%Features: Mountain View, Split Level, Den, LoftSpec Shw:Seller: Sarah Clark
01100020 350 Union Blvd Parker Map:SEC 08 Listing: $412,000.00MLS: 589302 Agent: Grummett, Ralph Home #: (702)444-1111 List Date: 08/09/20 XXBR: 4 BA: 3 Age: 9 Sqft: 3090 Zone: RES Lot Size: 0 LDM: 189x98 # of Un/Complx: 0Financing: CASH Fee: 175.00/QShow: GO LB Occu: George Brown Ph: (303)029-1094 L/B: Comm: 3.00%Features: Canyon View, 2 Story, Entry Area, Family RoomSpec Shw:Seller: George Brown
01100019 1014 State St. Las Vegas Map:SEC 14 Listing: $379,000.00MLS: 849232 Agent: Macmillan, Je� Home #: (702)555-5555 List Date: 08/09/20 XXBR: 4 BA: 3 Age: 13 Sqft: 1900 Zone: RES Lot Size: 0 LDM: 135x96 # of Un/Complx: 0Financing: CONV Fee: 245.00/QShow: GO LB Occu: Ph: L/B: Comm: 3.00%Features: Catalina View, Split Level, Rec. RoomSpec Shw:Seller: Jan Finge
01100018 1243 Forth St. Paramiter Map:SEC 23 Listing: $398,000.00MLS: 234989 Agent: Hammond, Matthew Home #: List Date: 08/09/20XXBR: 4 BA: 3 Age: 7 Sqft: 2590 Zone: RES Lot Size: 0 LDM: 210x135 # of Un/Complx: 0Financing: CONV Fee: 325.00/QShow: GO LB Occu: Ph: L/B: Comm: 2.90%Features: Panoramic View, Split Level, Entry AreaSpec Shw:Seller: John Strong
01100015 324 Fort St. Paramiter Map:SEC 17 Listing: $425,000.00MLS: 7872389 Agent: Gaze, Al Home #: (702)777-5555 List Date: 07/10/20XXBR: 4 BA: 3 Age: 7 Sqft: 2590 Zone: RES Lot Size: 0 LDM: 210x135 # of Un/Complx: 0Financing: CONV Fee: 325.00/QShow: APPT Occu: Ph: L/B: Comm: 3.00%Features: Split Level, Living Room, Guest Room, LoftSpec Shw:Seller: John Armstrong
01100004 6892 Deer Isle Street Las Vegas Map:SEC 19 Listing: $205,551.00MLS: 2221979 Agent: Bond, Howard Home #: (702)232-3232 List Date: 04/04/20 XXBR: 3 BA: 3 Age: 12 Sqft: 1890 Zone: RES Lot Size: 0 LDM: 135x115 # of Un/Complx: 0Financing: CONV Fee: 115.00/MShow: APPT Occu: Ph: L/B: Comm: 2.25%Features: Panoramic ViewSpec Shw:Seller: Linda Vanisle
Prepared by: Bailey WestwoodAugust 15, 20 XX , 05:18:12 PM
Lone Wolf Technologies [1.2.1.2] brokerWOLF (Version XX.07.04) Page: 1 of 2
Know your listing inventory print all or only new listings
DOES YOUR MLS® SYSTEM LACK REPORTING?If so, you can easily track the details of a listing and produce reports displaying the results.
Real Numbers… Real Insights
Why is the commission cut?

35
CanAmera Realty [1.2.2.2]
Listing Expense Report - All OfficesFrom January 01, 20XX To July 31, 20XX
Grouped By Listing
Date Description Vend# Invoice# Who Paid Qty Amount Total000003 42155 Fern Hill Road
010 Bower,James07/24/20XX ADVERT. REAL 562585 Agent 1.00 35.50 35.5007/17/20XX SIGNS SIGN 4564987 Company 1.00 55.00 55.00
90.50Listing Totals: Agent Paid: 35.50 Company Paid: 55.00
000008 77 Vezina Court021 Horstman,Luke
07/24/20XX LAWN MAINTENANCE GREEN 072013 Agent 1.00 72.50 72.5007/11/20XX ADVERT. COL001 45646545 Company 1.00 62.50 62.50
135.00Listing Totals: Agent Paid: 72.50 Company Paid: 62.50
000009 111 Maple Drive017 Edson,Carleen
07/19/20XX LAWN MAINTENANCE GREEN 7897864 Agent 1.00 65.00 65.0007/01/20XX SIGNS SIGN 52478666 Company 1.00 75.00 75.00
140.00Listing Totals: Agent Paid: 65.00 Company Paid: 75.00
000012 52 Concession Ave022 Lightfoot,Eric
07/19/20XX ADVERT. COL001 45645641 Agent 1.00 25.00 25.00 07/19/20XX LAWN MAINTENANCE GREEN 74477 Company 1.00 29.00 29.00
54.00Listing Totals: Agent Paid: 25.00 Company Paid: 29.00
000013 34 Elliott Street019 Mutch,Eva
07/12/20XX LAWN MAINTENANCE GREEN 52896 Agent 1.00 125.00 125.00
125.00Listing Totals: Agent Paid: 125.00 Company Paid: 0.00
000014 56 Bishop Street006 Penner,Erin
06/01/20XX SIGNS SIGN 9635222 Company 1.00 73.25 73.25 07/12/20XX ADVERT. REAL 96852 Company 1.00 85.50 85.50
158.75Listing Totals: Agent Paid: 0.00 Company Paid: 158.75
000015 104 Markle Ave016 Sorensen,Jimmy
06/15/20XX LAWN MAINTENANCE GREEN 45645698 Agent 1.00 50.00 50.00 07/24/20XX SIGNS SIGN 5287444 Company 1.00 65.00 65.00
115.00Listing Totals: Agent Paid: 50.00 Company Paid: 65.00
000017 52 Pontefract Place014 Ryan,Chelsey
05/30/20XX SIGNS SIGN 45643123 Agent 1.00 55.60 55.60 05/24/20XX ADVERT. COL001 456456423 Company 0.00 119.50 0.00
55.60Listing Totals: Agent Paid: 55.60 Company Paid: 0.00
000018 101 Bellamy018 Suydam,Mandi
07/24/20XX COURIER COUR 45622 Agent 1.00 53.50 53.50 05/24/20XX LAWN MAINTENANCE GREEN 26589 Company 1.00 45.00 45.00 07/24/20XX ADVERT. REAL 5251 Company 1.00 45.00 45.0007/24/20XX SIGNS SIGN 12547 Company 1.00 65.00 65.00
208.50Listing Totals: Agent Paid: 53.50 Company Paid: 155.00
1,082.35Report Totals: Agent Paid: 482.10 Company Paid: 600.25
Prepared by: Debra JonesJuly 24, 20XX, 03:06:01 PM
Lone Wolf Technologies [1.2.2.2]brokerWOLF (Version XX.06.01) Page: 1 of 1
HOW MUCH MONEY ARE YOU SPENDING TO DRIVE A LISTING?Start considering your ROI for every dollar spent. You can track the expenses associated with a listing and easily produce a report sorted by Listing or Agent to track the costs associated with the listing.
Real Numbers… Real Insights
How much money are you investing in helping your agents sell their property vs. what did the agent invest?

36
CanAmera Realty [1.2.1.7]
Listings By Agents - Available, Cond. Sale/PendingDetail Format - Sorted By Agent Name
Listing Date From May 01, 20XX To July 31, 20XX
Agent # Name Listing # Address City Expiry Type Lot/Unit Beds Baths Sq. Ft. MLS # Price Status017 Edson, Carleen 000009 111 Maple Drive Denver 12/31/20XX RESIDENTIA 0.00 3 2.00 2,015 632631 299,600.00 Available015 Feth, Ashley 000007 26 Cumming Ave Colorado Springs 10/31/20XX RESIDENTIA 0.00 2 1.00 1,050 856329 169,700.00 Available021 Horstman, Luke 000008 77 Vezina Court Denver 09/30/20XX RESIDENTIA 0.00 2 1.56 1,999 746325 699,400.00 Available
000010 99 Porritt Ave Denver 12/31/20XX RESIDENTIA 0.00 3 2.50 1,420 426985 435,500.00 Available000011 203 Main Street 2 Denver 01/01/20XX COMMERCI 0.00 0 0.00 15,000 852362 1,400,000.00 Cond. 000012 52 Concession Ave Denver 09/30/20XX RESIDENTIA 0.00 2 1.50 1,675 528965 450,000.00 Available
019 Mutch, Eva 000013 34 Elliott Street Avon Park 02/01/20XX RESIDENTIA 0.00 4 2.50 1,520 256359 269,800.00 Available006 Penner, Erin 000014 56 Bishop Street Dove Creek 03/01/20XX RESIDENTIA 0.00 4 2.50 3,250 529636 349,800.00 Cond.014 Ryan, Chelsey 000017 52 Pontefract Place Avon Park 12/31/20XX RESIDENTIA 0.00 5 3.00 3,000 523695 899,500.00 Cond.016 Sorensen, Jimmy 000015 104 Markle Ave Denver 11/30/20XX RESIDENTIA 0.00 2 2.00 1,150 259635 425,600.00 Cond.
000016 3362 Water Ave Denver 12/31/20XX RESIDENTIA 0.00 2 1.50 989 526985 199,800.00 Available018 Suydam, Mandi 000018 101 Bellamy 2 Denver 02/01/20XX RESIDENTIA 0.00 3 1.50 1,575 625958 299,600.00 Available
Prepared by: Debra JonesJuly 24, 20XX, 03:33:48 PM
Lone Wolf Technologies [1.2.1.7] brokerWOLF (Version XX.06.01) Page: 1 of 1
WHO IS YOUR TOP LISTING AGENT?Easily see your inventory by agent or even drill down by particular property type. Find out who is doing what, so you can work with them to build their business even more.
Real Numbers… Real Insights
Luke has the largest available inventory for our brokerage
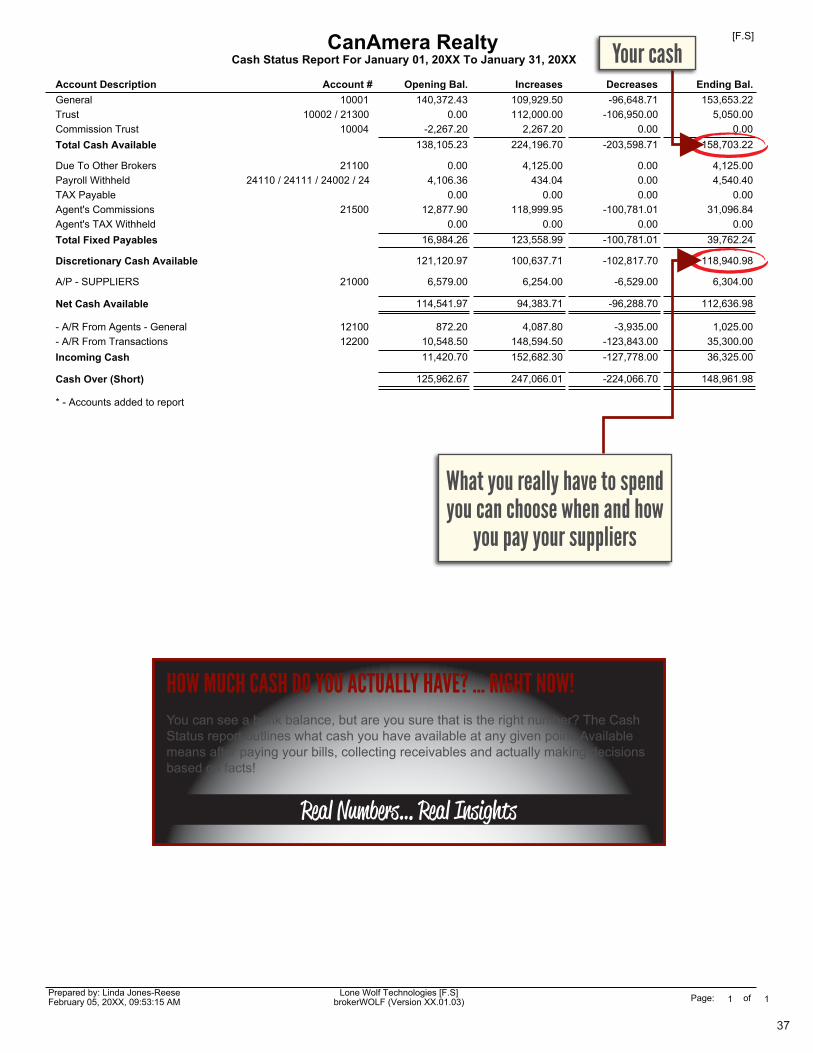
37
CanAmera Realty [F.S]
Cash Status Report For January 01, 20XX To January 31, 20XX
Account Description Account # Opening Bal. Increases Decreases Ending Bal.General 10001 140,372.43 109,929.50 -96,648.71 153,653.22Trust 10002 / 21300 0.00 112,000.00 -106,950.00 5,050.00Commission Trust 10004 -2,267.20 2,267.20 0.00 0.00Total Cash Available 138,105.23 224,196.70 -203,598.71 158,703.22
Due To Other Brokers 21100 0.00 4,125.00 0.00 4,125.00Payroll Withheld 24110 / 24111 / 24002 / 24 4,106.36 434.04 0.00 4,540.40TAX Payable 0.00 0.00 0.00 0.00Agent's Commissions 21500 12,877.90 118,999.95 -100,781.01 31,096.84Agent's TAX Withheld 0.00 0.00 0.00 0.00Total Fixed Payables 16,984.26 123,558.99 -100,781.01 39,762.24
Discretionary Cash Available 121,120.97 100,637.71 -102,817.70 118,940.98
A/P - SUPPLIERS 21000 6,579.00 6,254.00 -6,529.00 6,304.00
Net Cash Available 114,541.97 94,383.71 -96,288.70 112,636.98
- A/R From Agents - General 12100 872.20 4,087.80 -3,935.00 1,025.00- A/R From Transactions 12200 10,548.50 148,594.50 -123,843.00 35,300.00Incoming Cash 11,420.70 152,682.30 -127,778.00 36,325.00
Cash Over (Short) 125,962.67 247,066.01 -224,066.70 148,961.98
* - Accounts added to report
Prepared by: Linda Jones-ReeseFebruary 05, 20XX, 09:53:15 AM
Lone Wolf Technologies [F.S] brokerWOLF (Version XX.01.03) Page: 1 of 1
HOW MUCH CASH DO YOU ACTUALLY HAVE? … RIGHT NOW!You can see a bank balance, but are you sure that is the right number? The Cash Status report outlines what cash you have available at any given point. Available means after paying your bills, collecting receivables and actually making decisions based on facts!
Real Numbers… Real Insights
What you really have to spend you can choose when and how
you pay your suppliers
Your cash

38
CanAmera Realty [F.4.1]
Income Statement - All Offices
Acct. # Description
Actual20XX
01/01/20XXTo: 12/31/20XX
Budget20XX
01/01/20XXTo: 12/31/20XX
Variance
Gross Commission Earned40100-1 Commission Income 2,499,567.27 2,100,000.00 399,567.2740100-2 Commission Income 534,072.47 420,000.00 114,072.4751100-1 Commission To Other Brokers -164,884.20 -168,000.00 3,115.8051100-2 Commission To Other Brokers -30,626.75 -30,000.00 -626.75
2,838,128.79 2,322,000.00 516,128.79
Agent's Commission Expense50100-1 Agent's Commission 2,421,735.13 1,800,000.00 621,735.1350100-2 Agent's Commission 397,920.97 504,000.00 -106,079.0364108-1 Selling Exp-Mentor Expenses 18,472.69 18,000.00 472.69
2,838,128.79 2,322,000.00 516,128.79
Net Commission 0.00 0.00 0.00
Other Income43100-1 Other Income 10,389.85 16,252.50 -5,862.6543100-2 Other Income 3,152.75 3,600.00 -447.2545100-1 Desk Fee Income 254,125.00 240,000.00 14,125.0045100-2 Desk Fee Income 74,275.00 72,000.00 2,275.0046100-1 Split Income 545,159.89 529,056.00 16,103.8946100-2 Split Income 149,305.31 120,000.00 29,305.3147100-1 Franchise 4% Income 73,684.36 66,000.00 7,684.3647100-2 Franchise 4% Income 26,191.48 30,000.00 -3,808.52
1,136,283.64 1,076,908.50 59,375.14
Gross Income 1,136,283.64 1,076,908.50 59,375.14
Selling & Administrative ExpensesRent & Occupancy
62101-1 Rent & Occ. - Rent Expense 108,002.85 108,000.00 2.8562101-2 Rent & Occ. - Rent Expense 36,000.90 36,000.00 0.9062103-1 Rent & Occ. - Utilities 13,468.10 12,000.00 1,468.1062103-2 Rent & Occ. - Utilities 4,372.65 3,600.00 772.65
161,844.50 159,600.00 2,244.50
Licenses & Insurance63101-1 Lic. & Ins. - Errors & Ommiss. 9,600.00 9,600.00 0.0063101-2 Lic. & Ins. - Errors & Ommiss. 3,600.00 3,600.00 0.00
13,200.00 13,200.00 0.00
Selling Expenses64101-1 Selling - Mls Fees 8,911.50 9,600.00 -688.5064101-2 Selling - Mls Fees 4,168.50 3,600.00 568.5064106-1 Selling - Web-Site 12,491.25 12,000.00 491.2564106-2 Selling - Web-Site 2,078.75 2,400.00 -321.2564107-1 Selling Exp. - Technology 10,087.50 9,600.00 487.5064107-2 Selling Exp. - Technology 2,537.50 2,400.00 137.50
40,275.00 39,600.00 675.00
Advertising65101-1 Advertising - Classified 81,790.84 84,000.00 -2,209.1665101-2 Advertising - Classified 24,055.84 24,000.00 55.8465101-3 Advertising - Classified 233.32 0.00 233.3265105-1 Advertising - Promotional 6,369.25 6,000.00 369.2565105-2 Advertising - Promotional 2,434.75 2,400.00 34.75
114,884.00 116,400.00 -1,516.00
Franchise Costs69101-1 Franchise - Regional Mgmt Fees 72,602.25 72,000.00 602.2569101-2 Franchise - Regional Mgmt Fees 35,050.75 32,450.00 2,600.7569102-1 Franchise - Regional Ad Fund 38,958.25 36,000.00 2,958.2569102-2 Franchise - Regional Ad Fund 13,089.25 12,000.00 1,089.2569103-1 Franchise - International Fees 20,514.75 18,000.00 2,514.7569103-2 Franchise - International Fees 8,888.25 9,600.00 -711.75
189,103.50 180,050.00 9,053.50
Communication Expenses72103-1 Commun. Exp. - After Hours Ans. 9,391.25 9,000.00 391.2572103-2 Commun. Exp. - After Hours Ans. 3,343.75 3,000.00 343.75
Prepared by: Bailey WestwoodAugust 19, 20XX, 08:38:11 PM
Lone Wolf Technologies [F.4.1] brokerWOLF (Version XX.07.04) Page: 1 of 2
Compare actual vs. budgeted income
and expenses
Breakdown by office
Every income statement tells a story, consider why you are ahead and
can you maintain it
Look at each line and ask yourself can you improve
while maintaining your growth?

39
CanAmera Realty [F.4.1]
Income Statement - All Offices
Acct. # Description
Actual20XX
01/01/20XXTo: 12/31/20XX
Budget20XX
01/01/20XXTo: 12/31/20XX
Variance
12,735.00 12,000.00 735.00
Office Expenses & Supplies75102-1 Office Exp. - Office Supplies 8,528.25 8,400.00 128.2575102-2 Office Exp. - Office Supplies 2,549.75 2,400.00 149.7575112-1 Office Exp. - Photocopies 4,443.24 4,800.00 -356.7675112-2 Office Exp. - Photocopies 2,213.75 2,400.00 -186.2575199-1 Office Exp. - Misc. 5,084.00 4,800.00 284.0075199-2 Office Exp. - Misc. 2,051.00 2,400.00 -349.00
24,869.99 25,200.00 -330.01
Total Selling & Admin. Costs 556,911.99 546,050.00 10,861.99
Net Income Before Tax 579,371.65 530,858.50 48,513.15
Net Income 579,371.65 530,858.50 48,513.15
Prepared by: Bailey WestwoodAugust 19, 20XX, 08:38:11 PM
Lone Wolf Technologies [F.4.1] brokerWOLF (Version XX.07.04) Page: 2 of 2
IF YOU ARE WAITING FOR YOUR ACCOUNTANT, YOU’RE WAITING TOO LONG!The Financial Statement report is the health of your business and you need to know this all the time, not just at year-end. Don’t wait weeks for your accountant, know instantly, any day and every day. Customize up to seven columns of data which would allow for budget versus actual, monthly, Year-to-Date and annual numbers all on one report.
Real Numbers… Real Insights
Don’t be surprised at year-end, compare actual vs. budget regularly to proactively
make business decisions and stay on target

40
CanAmera Realty [F.4.3]Annual Income Statement - December 31, 20XX - All Offices
Account # Description Jan. 'XX Feb. 'XX Mar. 'XX Apr. 'XX May 'XX Jun. 'XX Jul. 'XX Aug. 'XX Sep. 'XX Oct. 'XX Nov. 'XX Dec. 'XX TotalGross Commission Earned40100 Commission Income 108,500 130,200 329,089 138,500 258,487 258,952 348,984 251,292 171,753 605,742 310,398 121,740 3,033,63951100 Commission To Other Brokers 0 -21,000 -37,050 -19,877 -37,812 -19,873 -9,748 -17,423 -6,137 -4,326 -14,613 -7,651 -195,510
108,500 109,200 292,039 118,623 220,675 239,079 339,236 233,869 165,615 601,416 295,784 114,089 2,838,128
Agent's Commission Expense50100 Agent's Commission 106,000 106,700 292,039 117,123 220,675 235,579 337,236 233,869 163,615 600,954 293,774 112,089 2,819,65664108 Selling Exp-Mentor Expenses 2,500 2,500 0 1,500 0 3,500 2,000 0 2,000 462 2,010 2,000 18,472
108,500 109,200 292,039 118,623 220,675 239,079 339,236 233,869 165,615 601,416 295,784 114,089 2,838,128
Net Commission 0 0 0 0 0 0 0 0 0 0 0 0 0
0.00% 0.00% 0.00% 0.00% 0.00% 0.00% 0.00% 0.00% 0.00% 0.00% 0.00% 0.00% 0.00%
Other Income43100 Other Income 1,042 1,000 1,125 1,250 1,200 1,200 1,000 1,100 1,150 1,250 1,200 1,025 13,54245100 Desk Fee Income 29,000 29,000 29,000 29,000 29,400 5,400 29,400 29,400 29,700 29,700 29,700 29,700 328,40046100 Split Income 31,550 24,270 74,672 25,825 55,377 83,872 72,228 48,313 35,791 134,812 75,586 32,165 694,46547100 Franchise 4% Income 4,250 4,832 12,048 4,440 8,829 9,543 9,635 9,596 6,244 12,774 12,401 5,279 99,875
65,842 59,102 116,845 60,515 94,807 100,016 112,264 88,410 72,885 178,537 118,887 68,169 1,136,283
Gross Income 65,842 59,102 116,845 60,515 94,807 100,016 112,264 88,410 72,885 178,537 118,887 68,169 1,136,283
60.68% 54.12% 40.01% 51.01% 42.96% 41.83% 33.09% 37.80% 44.00% 29.68% 40.19% 59.75% 40.03%
Selling & Administrative ExpensesRent & Occupancy62101 Rent & Occ. - Rent Expense 12,000 0 24,000 12,000 12,000 12,000 12,000 12,000 12,000 12,000 12,000 12,000 144,00362103 Rent & Occ. - Utilities 1,642 1,592 1,661 1,592 1,621 1,321 1,619 1,511 1,411 1,240 1,319 1,308 17,840
13,643 1,593 25,661 13,593 13,621 13,321 13,619 13,511 13,411 13,240 13,319 13,308 161,844
Licenses & Insurance63101 Lic. & Ins. - Errors & Ommiss. 1,100 1,100 1,100 1,100 1,100 1,100 1,100 1,100 1,100 1,100 1,100 1,100 13,200
1,100 1,100 1,100 1,100 1,100 1,100 1,100 1,100 1,100 1,100 1,100 1,100 13,200
Selling Expenses64101 Selling - Mls Fees 1,020 1,025 1,096 1,070 1,165 1,065 1,040 1,310 1,032 1,101 1,015 1,141 13,08064106 Selling - Web-Site 1,215 1,205 1,215 1,215 1,215 1,215 1,215 1,215 1,215 1,215 1,215 1,215 14,57064107 Selling Exp. - Technology 1,000 1,000 1,975 750 875 1,000 1,000 1,025 1,000 1,000 1,000 1,000 12,625
3,235 3,230 4,286 3,035 3,255 3,280 3,255 3,550 3,247 3,316 3,230 3,356 40,275
Advertising65101 Advertising - Classified 8,800 8,300 8,650 9,200 8,150 10,050 8,790 9,010 8,800 8,100 8,500 9,730 106,08065105 Advertising - Promotional 1,000 825 900 875 415 975 746 775 763 750 780 0 8,804
9,800 9,125 9,550 10,075 8,565 11,025 9,536 9,785 9,563 8,850 9,280 9,730 114,884
Franchise Costs69101 Franchise - Regional Mgmt Fees 3,800 5,750 6,450 4,435 7,650 10,450 11,929 11,200 6,909 24,450 11,030 3,600 107,65369102 Franchise - Regional Ad Fund 1,930 1,657 6,387 3,250 3,887 4,287 5,987 5,967 2,687 12,077 1,930 1,997 52,04769103 Franchise - International Fees 1,200 1,250 2,920 1,580 2,250 2,850 3,950 2,950 1,733 6,184 1,276 1,260 29,403
6,930 8,657 15,757 9,265 13,787 17,587 21,866 20,117 11,329 42,711 14,236 6,857 189,103
Communication Expenses72103 Commun. Exp. - After Hours 1,090 1,072 1,042 1,062 762 1,085 1,072 1,147 892 1,294 1,166 1,047 12,735
1,090 1,072 1,042 1,062 762 1,085 1,072 1,147 892 1,294 1,166 1,047 12,735
Office Expenses & Supplies75102 Office Exp. - Office Supplies 1,500 1,495 1,350 1,200 0 987 567 1,847 879 389 475 389 11,07875112 Office Exp. - Photocopies 473 502 541 597 608 702 557 508 555 611 439 558 6,656
Prepared by: Bailey WestwoodAugust 19, 20XX, 08:35:05 PM
Lone Wolf Technologies [F.4.3] brokerWOLF (Version XX.07.04) Page: 1 of 2
Easily identify posting errors by viewing monthly activity

41
CanAmera Realty [F.4.3]Annual Income Statement - December 31, 20XX - All Offices
Account # Description Jan. 'XX Feb. 'XX Mar. 'XX Apr. 'XX May 'XX Jun. 'XX Jul. 'XX Aug. 'XX Sep. 'XX Oct. 'XX Nov. 'XX Dec. 'XX TotalOffice Expenses & Supplies75199 Office Exp. - Misc. 902 777 513 552 625 363 288 737 374 688 913 403 7,135
2,875 2,774 2,404 2,349 1,233 2,052 1,412 3,092 1,808 1,688 1,827 1,350 24,869
Total Selling & Admin. Costs 38,673 27,552 59,802 40,480 42,325 49,451 51,862 52,304 41,352 72,201 44,159 36,749 556,911
35.64% 25.23% 20.47% 34.12% 19.17% 20.68% 15.28% 22.36% 24.96% 12.00% 14.92% 32.21% 19.62%
Net Income Before Tax 27,169 31,549 57,043 20,034 52,482 50,565 60,402 36,106 31,533 106,336 74,728 31,420 579,371
25.04% 28.89% 19.53% 16.88% 23.78% 21.14% 17.80% 15.43% 19.04% 17.68% 25.26% 27.54% 20.41%
Net Income 27,169 31,549 57,043 20,034 52,482 50,565 60,402 36,106 31,533 106,336 74,728 31,420 579,371
% of Gross Commission Earned: 25.04% 28.89% 19.53% 16.88% 23.78% 21.14% 17.80% 15.43% 19.04% 17.68% 25.26% 27.54% 20.41%% of Total Net Income: 4.68% 5.44% 9.84% 3.45% 9.05% 8.72% 10.42% 6.23% 5.44% 18.35% 12.89% 5.42%
Prepared by: Bailey WestwoodAugust 19, 20XX, 08:35:05 PM
Lone Wolf Technologies [F.4.3] brokerWOLF (Version XX.07.04) Page: 2 of 2
YEAR-ENDS ARE FOR AMATEURS!What a professional uses is trends and flow to analyze a business. Using this spreadsheet looking format, you can easily spot irregularities in expenses and see trends developing. Established brokerages’ income and expenses are generally consistent so anything out of the norm requires attention.
Real Numbers… Real Insights
If it doesn’t look right – investigate

42
CanAmera Realty [F.4.4]
Multi-Office Income StatementFrom August 01, 20XX To August 31, 20XX
Main Office ParkerBranch
TotalAccount # Description
Gross Commission Earned40100 Commission Income 186,510 43,873 230,38351100 Commission To Other Brokers -13,500 -2,803 -16,303
173,010 41,070 214,080
Agent's Commission Expense50100 Agent's Commission 173,010 41,070 214,080
173,010 41,070 214,080
Net Commission 0 0 0
Other Income44100 Deal Fee Income 9,504 3,210 12,71445100 Desk Fee Income 31,750 10,150 41,90046100 Split Income 42,955 7,050 50,00547100 Franchise 4% Income 7,037 1,380 8,41748100 Lead Fee Income 4,583 875 5,458
95,829 22,665 118,494
Gross Income 95,829 22,665 118,494
Selling & Administrative ExpensesEquipment Rental
60102 Equip. Rental - Furniture 4,050 1,350 5,400
4,050 1,350 5,400
Sales Equipment0 0 0
Rent & Occupancy62101 Rent & Occ. - Rent Expense 2,467 822 3,28962103 Rent & Occ. - Utilities 769 256 1,025
3,236 1,078 4,314
Licenses & Insurance63101 Lic. & Ins. - Errors & Ommiss. 2,563 888 3,451
2,563 888 3,451
Selling Expenses64101 Selling - Mls Fees 26 94 12064102 Selling - Signs 188 63 25164106 Selling - Web-Site 365 137 50264107 Selling Exp. - Technology 213 88 301
792 382 1,174
Advertising65101 Advertising - Classified 963 38 1,001
963 38 1,001
Recruiting And Retention66102 Recruiting Exp. 375 125 500
375 125 500
Franchise Costs69101 Franchise - Regional Mgmt Fees 4,950 1,650 6,60069102 Franchise - Regional Ad Fund 654 218 87269103 Franchise - International Fees 975 325 1,300
6,579 2,193 8,772
Payroll Expenses70102 Payroll Exp. - Salaries 3,375 1,125 4,500
3,375 1,125 4,500
Bank Charges71104 Bank Charges - Service Charges 251 84 335
251 84 335
Communication Expenses72103 Commun. Exp. - After Hours 493 164 657
493 164 657
Office Expenses & Supplies75101 Office Exp. - Computer Supplies 281 94 37575105 Office Exp. - Courier Service 150 50 20075112 Office Exp. - Photocopies 478 159 637
Prepared by: Bailey WestwoodAugust 16, 20XX, 09:52:14 AM
Lone Wolf Technologies [F.4.4] brokerWOLF (Version XX.07.04) Page: 1 of 2
Review income and expenses by office

43
CanAmera Realty [F.4.4]
Multi-Office Income StatementFrom August 01, 20XX To August 31, 20XX
Main Office ParkerBranch
TotalAccount # Description
Office Expenses & Supplies75199 Office Exp. - Misc. 397 161 558
1,306 464 1,770
Professional Fees76102 Prof. Fees - Accounting 600 200 80076103 Prof. Fees - Consulting 938 313 1,251
1,538 513 2,051
Depreciation Costs79101 Depreciation -900 -300 -1,200
-900 -300 -1,200
Misc. Revenue & Expense0 0 0
Total Selling & Admin. Costs 24,621 8,104 32,725
Net Income Before Tax 71,208 14,561 85,769
Income Taxes90101 Federal Income Taxes 7,650 2,550 10,20090102 State Income Taxes 1,838 613 2,451
9,488 3,163 12,651
Net Income 61,720 11,398 73,118
% of Total: 84% 16%
Prepared by: Bailey WestwoodAugust 16, 20XX, 09:52:14 AM
Lone Wolf Technologies [F.4.4] brokerWOLF (Version XX.07.04) Page: 2 of 2
WHICH OF YOUR BRANCH OFFICES IS THE MOST PROFITABLE?This incredible report will help to track trends in your income and expenses by comparing your offices in a simple to interpret format. While your overall company might be healthy, it’s important to drill down to the office level to really make decisions.
Real Numbers… Real Insights
Both offices are profitable and viable but that is not always the case
Know your breakdown by office to make
informed decisions

44
Lone Wolf Real Estate Technologies [F.6.2]
Summary Format Trial BalanceFrom January 01, 20XX To January 31, 20XX
Account # Description F/S Line # Opening Debits Credits Final10001 CASH - CURRENT ACCOUNT 0200 140,372.43 109,929.50 -97,130.71 153,171.2210002 CASH - TRUST 0900 0.00 66,000.00 -40,000.00 26,000.0010004 CASH - COMMISSION TRUST 0200 -2,267.20 2,267.20 0.00 0.0012100 A/R - AGT'S RECOVERABLE- GEN 0350 807.20 4,487.80 -3,935.00 1,360.0012110 A/R AGENT STRESS FREE PLAN 0350 -9,733.50 0.00 -4,470.00 -14,203.5012200 A/R - COMMISSION FROM DEALS 0350 10,548.50 148,594.50 -123,843.00 35,300.0021000 A/P - SUPPLIERS 1200 -6,219.00 6,529.00 -6,904.00 -6,594.0021100 A/P - OTHER BROKERS & 1300 0.00 0.00 -4,125.00 -4,125.0021300 LIABILITY FOR TRUST FUNDS HELD 0900 0.00 46,000.00 -66,950.00 -20,950.0021500 COMMISSION PAYABLE 1300 -12,877.90 100,781.01 -118,999.95 -31,096.8424002 FEDERAL INCOME TAX EMPLOYEE 1350 -1,224.36 0.00 -136.04 -1,360.4024110 FICA SS EMPLOYEE W/H 1350 -1,116.00 0.00 -124.00 -1,240.0024111 FICA SS EMPLOTER W/H 1350 -1,116.00 0.00 -124.00 -1,240.0024140 FL UNEMPLOYMENT W/H 1350 -650.00 0.00 -50.00 -700.0028000 SHAREHOLDER LOAN - Richard Dean 1640 -26,490.80 0.00 -5,847.00 -32,337.8040100 COMMISSION INCOME 4000 -735,736.72 17,848.50 -153,144.50 -871,032.7243105 SPLIT FEE % INCOME 5500 -84,982.02 3,105.04 -13,358.55 -95,235.5343110 SR. AGENT SPLIT FEE INCOME 5500 -35,108.35 0.00 -4,219.00 -39,327.3543115 SR. AGENT PER TRANS FEE INCOME 5500 -9,200.00 25.00 -1,050.00 -10,225.0043120 ADMIN FEE INCOME 5500 -3,000.00 0.00 -550.00 -3,550.0043125 BUYER/SELLER ADMIN FEE INCOME 5500 -2,750.00 500.00 -1,000.00 -3,250.0045100 SR. DESK FEE INCOME 5500 -10,000.00 0.00 -1,000.00 -11,000.0045105 JR. DESK FEE INCOME 5500 -15,000.00 0.00 -1,500.00 -16,500.0050100 AGENT'S COMMISSION 4500 716,293.72 149,019.50 -17,848.50 847,464.7251100 COMMISSION TO OTHER BROKERS 4000 19,443.00 4,125.00 0.00 23,568.0060102 EQUIP. RENTAL - FURNITURE 7050 12,000.00 1,200.00 0.00 13,200.0062101 RENT & OCC. - RENT EXPENSE 7150 30,000.00 3,000.00 0.00 33,000.0063101 LIC. & INS. - ERRORS & OMMISS. 7200 -1,275.00 50.00 -515.00 -1,740.0063102 LIC. & INS. - OFFICE CONTENTS 7200 0.00 220.00 0.00 220.0064101 SELLING - MLS FEES 7250 0.00 0.00 -225.00 -225.0064102 SELLING - SIGNS 7250 0.00 0.00 -42.00 -42.0065101 ADVERTISING - CLASSIFIED 7300 350.00 250.00 0.00 600.0070102 PAYROLL EXP. - SALARIES 7400 20,000.00 2,000.00 0.00 22,000.0070109 FICA SS EMPLOYER EXPENSE 7400 1,116.00 124.00 0.00 1,240.0070111 FL STATE UNEMPLOYMENT 7400 650.00 50.00 0.00 700.0072101 COMMUN. EXP. - TELEPHONE LINES 7500 7,111.00 729.00 0.00 7,840.0075112 OFFICE EXP. - PHOTOCOPIES 7550 0.00 0.00 -5.80 -5.8075117 OFFICE EXP. - ENTERTAINMENT 7550 55.00 0.00 0.00 55.0076101 PROF. FEES - LEGAL 7600 0.00 262.00 0.00 262.00Report Totals: 0.00 667,097.05 -667,097.05 0.00
Total of Income Statement Accounts Listed: $11,950.31Number of G/L Entries: 2,646
Prepared by: Linda Jones-ReeseFebruary 05, 20XX, 12:12:45 PM
Lone Wolf Technologies [F.6.2] brokerWOLF (Version XX.01.03) Page: 1 of 1
DO YOU WANT TO KNOW YOUR COMPANY’S ACCURATE FINANCIAL STATUS?The Summary Trial Balance Report is a valuable tool to see your Balance Sheet and Income Statement in one combined snapshot. Being able to identify all the debits and credits will stop you estimating your income and expenses, and get a precise status of your financials. Also use it to ensure that your accounting cycle is being followed correctly and that every transaction in your business is recorded accurately.
Real Numbers… Real Insights
A/R should not be a negative, better check it out!
See activity for each account including overall profitability


