Dasu et al. Protection and Control of Modern Power Systems (2021) 6:35 https://doi.org/10.1186/s41601-021-00215-w
ORIGINAL RESEARCH
Small signal stability enhancement of a large scale power system using a bio-inspired whale optimization algorithmButti Dasu1* , Sivakumar Mangipudi1 and Srinivasarao Rayapudi2
Abstract
A whale optimization algorithm (WOA)-based power system stabilizer (PSS) design methodology on modified single machine infinite bus (MSMIB) and multi-machine systems to enhance the small-signal stability (SSS) of the power system is presented. The PSS design methodology is implemented using an eigenvalue (EV)-based objective func-tion. The performance of the WOA is tested with several CEC14 and CEC17 test functions to investigate its potential in optimizing the complex mathematical equations. The New England 10-generator 39-bus system and the MSMIB system operating at various loading conditions are considered as the test systems to examine the proposed method. Extensive simulation results are obtained which validate the effectiveness of the proposed WOA method when com-pared with other algorithms.
Keywords: Small-signal stability, Power system stabilizer, Stability, Modified single machine infinite bus system, Multi-machine system, Whale optimization algorithm, Eigenvalues
1 IntroductionIt is well-known that a power system is a practical exam-ple of a highly non-linear interconnected system formed by a number of transmission lines, switchgear equipment, various generators with diversified configurations, and a variety of loads. Increasing electrical energy demand has led almost all power grids to operate at their stability lim-its. Under such highly stressed conditions, the nonlinear behavior of the system is more pronounced by small dis-turbances. The Power System Stabilizer (PSS) has been developed as a supplementary controller to produce the necessary damping torque to suppress electromechani-cal oscillations in the range of 0.1–1.5 Hz originated from small disturbances [1].
The role of the PSS in coordination with the excitation system in a generator is illustrated in [2–8], while many
classical PSS design techniques on various scenarios have been developed after the realization of the role PSS role in the power system. Such techniques include the pole placement technique [9, 10], sliding mode approach [11–14], linear quadratic regulator [15, 16], H − ∞ tech-nique [17, 18], and fuzzy logic [19, 20]. The design of a PSS using the above-mentioned conventional methods for single machine and multi-machine interconnected systems of highly varying loading conditions is tedi-ous, requires extensive expertise, and consumes much computational time. Many mathematical calculations and several parameters are required to design the PSS parameters for such a highly non-linear, time-varying, and complex large scale power system. In addition, the design of a PSS using conventional techniques for the multi-machine power system, one that always operates at variable loading conditions is a complex process. In recent decades, heuristic search algorithms have evolved and have proven their significance in solving complex problems, optimizing design parameters, and minimizing
Open Access
Protection and Control ofModern Power Systems
*Correspondence: [email protected] Department of EEE, Gudlavalleru Engineering College, Gudlavlleru, Krishna (Dt.), Andhra Pradesh 521301, IndiaFull list of author information is available at the end of the article
Page 2 of 17Dasu et al. Protection and Control of Modern Power Systems (2021) 6:35
the cost of fuel. PSS design using heuristic algorithms can reduce the above- mentioned drawbacks.
Extensive literature is available on the methods of PSS design for the single machine and multi-machine power systems including-Tabu search [21, 22], and algorithms such as genetic [23, 24], particle swarm optimization (PSO) [25–29], differential evolution (DE) [30, 31], hybrid differential evolution [32, 33], chaotic swarm optimization [34], fire-fly [35], harmony search [36], bacterial foraging search [37], cuckoo search [38], bat [39, 40], gravitational search [41], and grey wolf [42] algorithms. The above PSS design techniques, implemented on single and multi-machine systems have proven their efficacy in improving the small-signal stability of the power system. However, some drawbacks and limitations have also been observed including lack of fast convergence, the need for large num-bers of design parameters, and not maintaining a good balance between the exploitation and exploration stages. To address these issues, a Whale Optimization Algorithm (WOA) is implemented in this paper on single machine and large scale multi-machine systems to design the PSS parameters. Recently, WOA [43, 44] has been developed based on the hunting strategy of the humpback whale. The advantage of the WOA is the maintenance of a good balance between exploitation and exploration stages to identify the best global solution, while very few numbers of control parameters are required to. Compared to other heuristic search algorithms the number of steps involved in the evolving process and the rate of the convergence in the WOA are also improved. To validate the performance of the WOA, it is tested on various CEC 14 and CEC 17 test functions before designing the PSS parameters. Two test cases working with various loading conditions under several disturbance conditions are considered in the design of the PSS parameters using WOA. The first test case is the recently developed MSMIB system which is the modified version of the SMIB system. This takes the transformer secondary bus voltage of the generator side, instead of an
infinite bus voltage. The details of this model are illustrated in [44]. The well-known IEEE New England 10-generator 39-bus MM test system is considered as the second test case to design the PSS parameters using the WOA.
The remainder of the paper is as follows: the test sys-tems considered are described in Sect. 2, while the struc-ture of the PSS and formulation of the objective function for the PSS design are provided in Sect. 3. PSS design using the WOA is described in Sect. 4, and in Sect. 5, the performance analysis of the WOA on CEC 14 and CEC 17 test functions is presented. Simulation results are pre-sented in Sect. 6 and finally, Sect. 7 draws the conclusion.
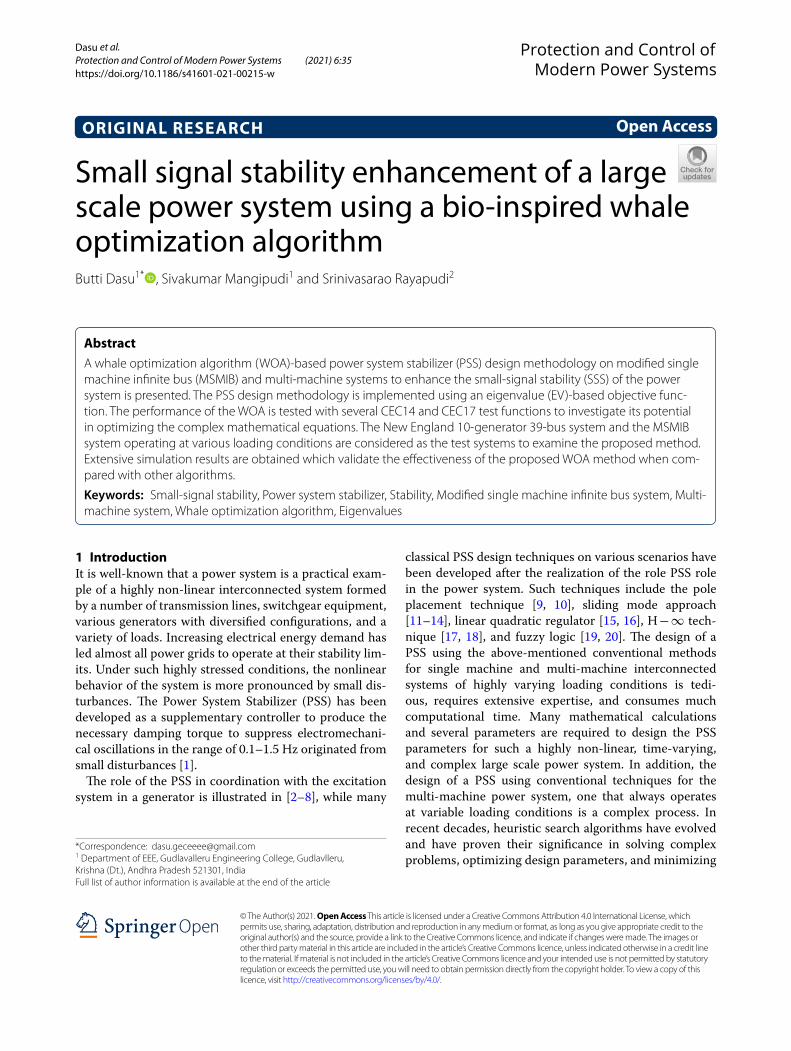
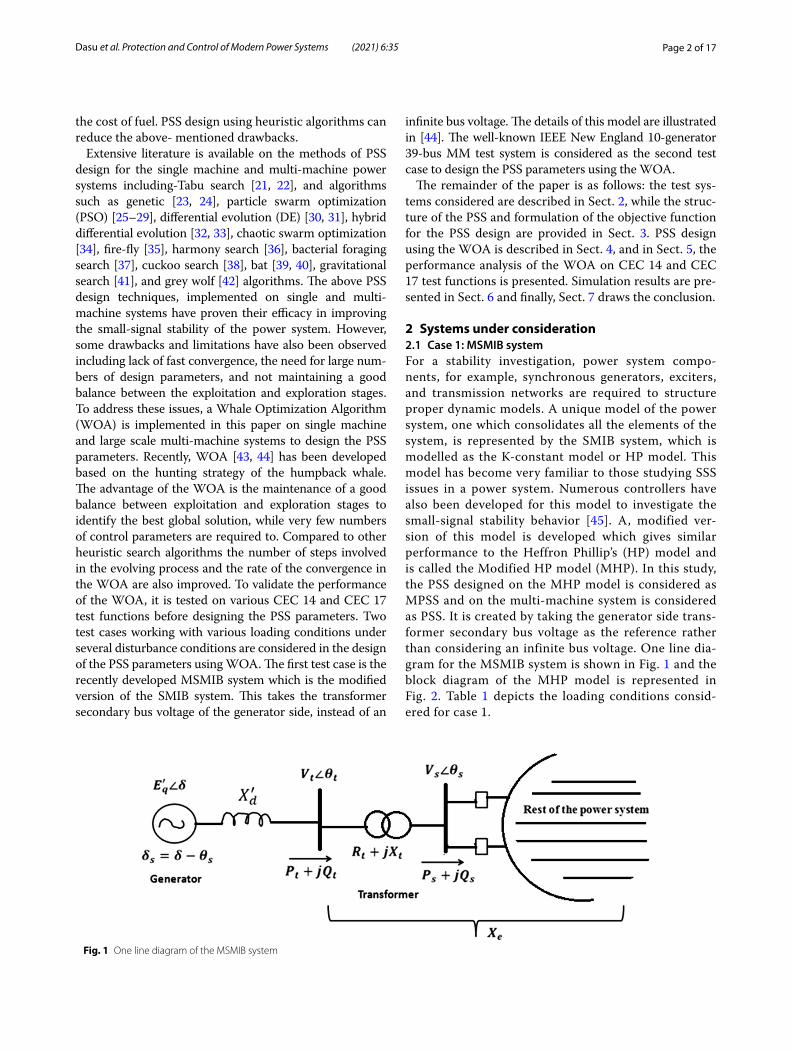
2 Systems under consideration2.1 Case 1: MSMIB systemFor a stability investigation, power system compo-nents, for example, synchronous generators, exciters, and transmission networks are required to structure proper dynamic models. A unique model of the power system, one which consolidates all the elements of the system, is represented by the SMIB system, which is modelled as the K-constant model or HP model. This model has become very familiar to those studying SSS issues in a power system. Numerous controllers have also been developed for this model to investigate the small-signal stability behavior [45]. A, modified ver-sion of this model is developed which gives similar performance to the Heffron Phillip’s (HP) model and is called the Modified HP model (MHP). In this study, the PSS designed on the MHP model is considered as MPSS and on the multi-machine system is considered as PSS. It is created by taking the generator side trans-former secondary bus voltage as the reference rather than considering an infinite bus voltage. One line dia-gram for the MSMIB system is shown in Fig. 1 and the block diagram of the MHP model is represented in Fig. 2. Table 1 depicts the loading conditions consid-ered for case 1.
Fig. 1 One line diagram of the MSMIB system
Page 3 of 17Dasu et al. Protection and Control of Modern Power Systems (2021) 6:35
2.2 Case 2: The New England 10‑generator 39‑bus systemThis test system [46] is the second case study for the design of PSS. Optimal tuning of PSS parameters for the test case is carried out using the proposed tech-niques. Various disturbances are created on the system to investigate the performance of the proposed tech-nique. The block diagram of the New England 10-gen-erator 39-bus system is shown in Fig. 3.
3 PSS structureIt is well-known that a complex interconnected power system is always subjected to various types of dis-turbances. Maintaining system stability under such
conditions is a crucial task for the operation engineers. PSS has developed as the supplementary controller to the excitation system to provide the required damping to mitigate the oscillations originatig from the distur-bances. Typically, the PSS is formulated by three impor-tant blocks namely, the phase compensation, washout, and gain blocks. The damping performance of the system is affected by the contribution of each block. The phase compensation block acts as a lead-lag compensator, the wash out block acts as the high pass filter, and the gain block provides necessary gain value to damp the oscilla-tions. The transfer function of the PSS is represented as
here Vs is the output from the PSS, Kpssi is the gain value of the PSS, subscript ’i’ represents the ith machine, Twi is the time constant of the washout block, T1i, T2i, T3i, and T4i are the phase compensation blocks’ time constants and Δωi is the speed deviation of the ith machine. It has been shown in the literature that the performance of the PSS for any test system can be significantly affected by its parameters. Thus the proposed algorithm is developed
(1)
VS = KPSSi
sTWi
1+ sTWi
[
(1+ sT1i)(1+ sT2i)
(1+ sT3i)(1+ sT4i)
]
�ω1(s)
Fig. 2 Block diagram of the MHP model
Table 1 Loading conditions considered for case 1
Loading condition
Xe Pt Qt
1 0.3-Higher loading 1 0.2
2 0.4-Nominal loading 0.8 0.41
3 0.8-Weak loading 1 0.5
4 Lead.P.F loading 1 − 0.5
Page 4 of 17Dasu et al. Protection and Control of Modern Power Systems (2021) 6:35
to properly design the parameters using the mentioned objective function for all the case studies.
3.1 Formulation of the EV‑based objective function for PSS design
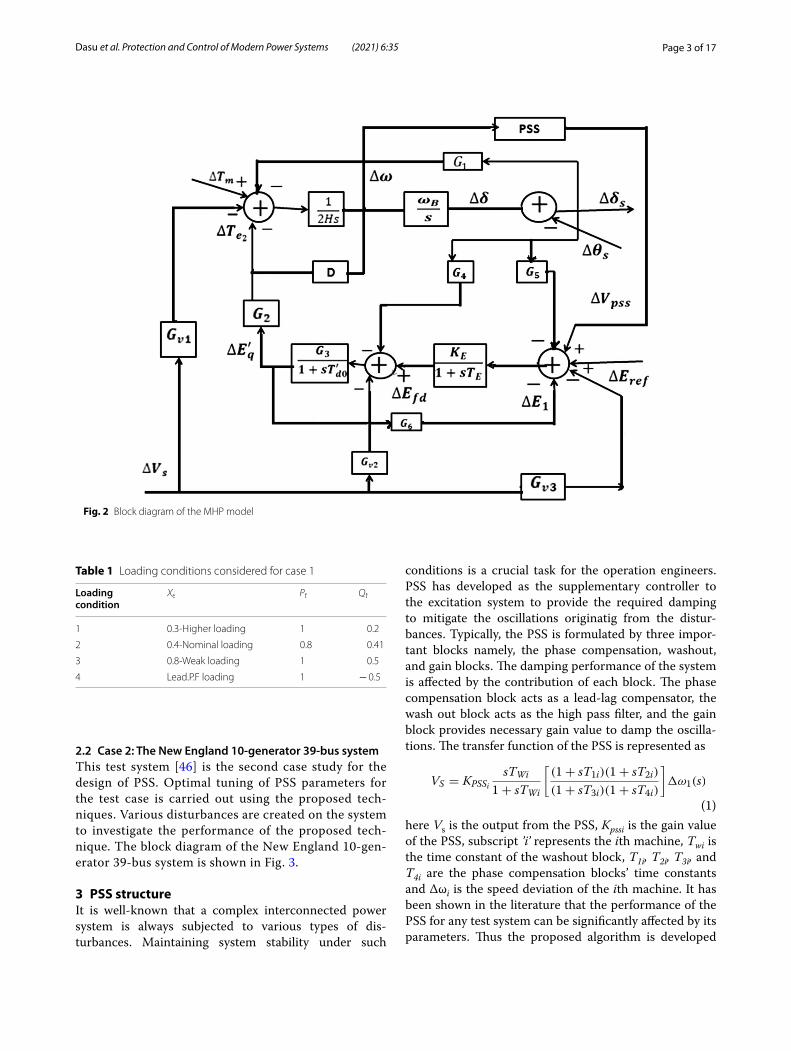
The single objective function for the design of the PSS is formed by combining two independent objective func-tions to place the lightly damped and unstable EVs of the system into the required s-plane regions. Figure 4 repre-sents eigenvalue regions of the EV-based objective func-tion. The first objective function is represented as
where Np is the total number of loading conditions con-sidered for the optimization process, σi is the real part of the ith eigenvalue of the system and σ0 is a constant value of the expected damping factor and is chosen as − 1.5. The real parts of poorly damped EVs of the system will be improved when the PSS is designed using the objective
(2)min Ja =
NP∑
j=1
∑
σi≥σ0
(σ0 ≥ σi)2
function. Hence the EVs will move to the left region of the imaginary axis as shown in Fig. 4a. The damping ratios of the lightly damped oscillating modes of the sys-tem will be improved, if the second objective function is considered alone. This is represented as
where ζi is the damping ratio of the ith EV of the sys-tem, ζ0 is a constant value of the expected damping ratio and is considered to be greater than 0.3. The EVs will be pushed into the wedge shape sector of Fig. 4b, when the PSS parameters are optimized based on this objective function. The advantage of this objective function is that the damping ratio of the low damped EVs of the system can be improved. Finally, the desired objective function is constructed by combining the two objective functions into one by assigning a weighting factor-C, used to offset the weights of Ja and Jb as the value of c is chosen as 10 [22].
(3)min Jb =
Np∑
j=1
∑
ζi≥ζ0
(ζ0 − ζi)2
Fig. 3 Block diagram of the New England 10-generator 39-bus system
Page 5 of 17Dasu et al. Protection and Control of Modern Power Systems (2021) 6:35
Thus, all the poorly damped eigenvalues will be shifted in the marked regions as shown in Fig. 4c, when JI is used.
4 PSS design using WOAThe WOA was developed by Seyedali Mirjalili in 2016, by observing the hunting strategy of Humpback whales. Humpback whales, when attacking targets, follow a spe-cial type of hunting technique which is known as the bubble-net feeding method. In this technique, the whales create two types of mechanisms to reach the target, i.e.,: a shrinking encircle mechanism and a spiral mechanism. The WOA has been developed based on these two hunting mechanisms and it has several advantages over other meth-ods. The biggest advantage of the WOA is that only one design parameter (a) is required for the optimization pro-cess [43]. This is fewer than other PSO and DE algorithms. The convergence rate of the WOA is superior and the num-ber of steps required in the WOA is also fewer than PSO and DE. After initialization of the design parameters, PSO requires an update of the position and velocity for each particle. For DE algorithm, crossover and mutation steps are required for the optimization process. For any optimi-zation algorithm, exploration and exploitation are the two important stages upon which the convergence of the opti-mal solution depends. The exploration stage is to get the
(4)JI = Ja + cJb
(5)JI =
Np∑
j=1
∑
σi≥σ0
(σ0 − σi)2 + C
Np∑
j=1
∑
ζi≥ζ0
(ζ0 − ζi)2
global best solution and the exploitation stage is required to get the local best solution. Achieving a good balance between the two stages is the most challenging task for an optimization algorithm because of the stochastic nature of the algorithm. If an algorithm can succeeded in obtaining a good balance between the two, the optimal solutions can be found. As the WOA has been more successful in main-taining a good balance between the exploitation and the exploration stages than the other algorithms [43], it is used here for the design of the parameters of the PSS for the test cases.
4.1 Steps involved in the WOA algorithmIn the WOA, the steps of the hunting strategy of the whales are listed as:
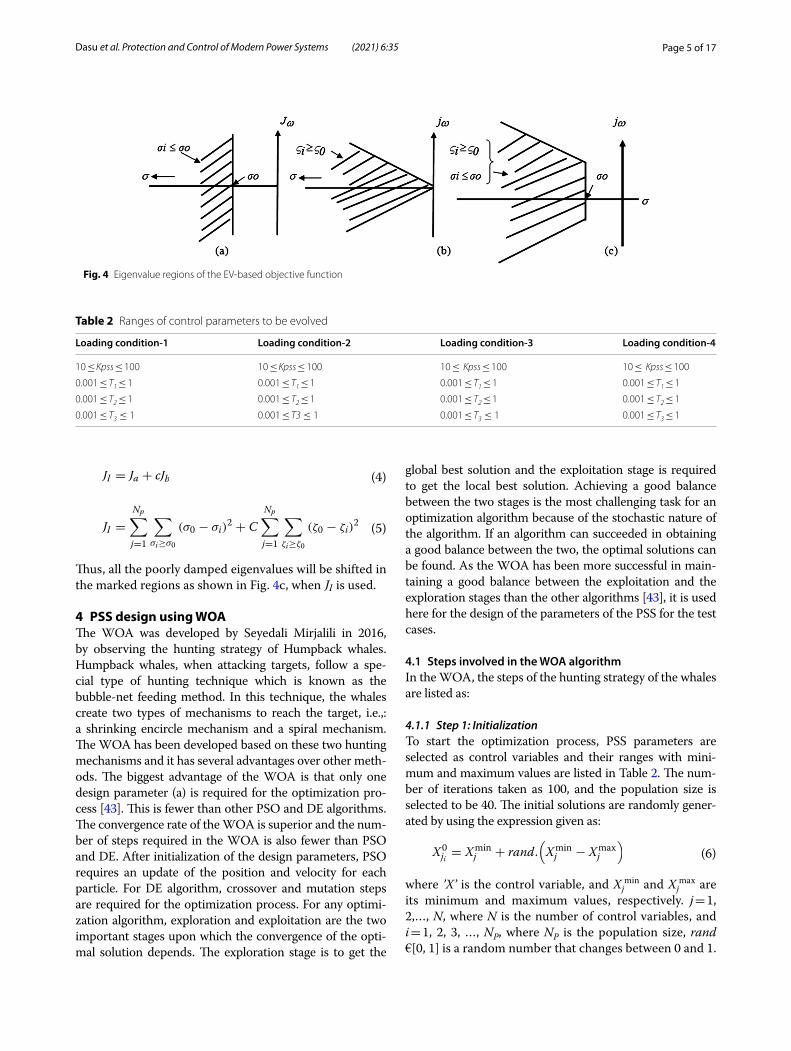
4.1.1 Step 1: InitializationTo start the optimization process, PSS parameters are selected as control variables and their ranges with mini-mum and maximum values are listed in Table 2. The num-ber of iterations taken as 100, and the population size is selected to be 40. The initial solutions are randomly gener-ated by using the expression given as:
where ’X’ is the control variable, and Xjmin and Xj
max are its minimum and maximum values, respectively. j = 1, 2,…, N, where N is the number of control variables, and i = 1, 2, 3, …, NP, where NP is the population size, rand €[0, 1] is a random number that changes between 0 and 1.
(6)X0
ji= Xmin
j + rand.(
Xmin
j − Xmax
j
)
Fig. 4 Eigenvalue regions of the EV-based objective function
Table 2 Ranges of control parameters to be evolved
0.001 ≤ T3 ≤ 1 0.001 ≤ T3 ≤ 1 0.001 ≤ T3 ≤ 1 0.001 ≤ T3 ≤ 1
Page 6 of 17Dasu et al. Protection and Control of Modern Power Systems (2021) 6:35
All the tuneable parameters are selected with their ranges and randomly generated using (16).
4.1.2 Step 2: Determination of EV‑based objective functionTo place the EVs in pre-determined regions, the EV-based objective function described in Sect. 3 is used. After ini-tial solutions of the PSS are randomly generated, the Sim-ulink models of the test cases in the MATLAB program are called and then the EVs of the test systems are determined. The EV-based objective function for the given population size s then found, and the EV-based objective function is determined for both test cases working with various oper-ating conditions.
After determining the objective function, updating the hunting agent process using the WOA is imitated. All the PSS parameters are treated as hunting agents in the opti-mization process. When the location of the target is iden-tified, the hunting agent updates its posture by using this mechanism to reach the prey. Since the best solution is not obvious, WOA assumes that the current solution is the optimum solution and updates its position using:
where �S is the distance between the whale and target, �R and, �A are the coefficient vectors, t is the current itera-tion, P* corresponds to the optimum solution attained up to now, and �P stands for the position vector.; || represents the absolute value, and ’.’ is the multiplication of elements to elements. The vectors �A , and �R are characterized as:
(7)�S =∣
∣
∣
�R · �P ∗ (t)�P(t)∣
∣
∣
(8)�P(t + 1) = �P∗(t)− �A · �S
(9)�A = 2�a · �r − �a
(10)�R = 2 · �r
where �A is a random value that decreases from 2 to 0 dur-ing the optimization process and �r is an arbitrary number that varies between (0and,1). In every iteration process, the values of a, A, R are updated for each hunting agent. The present hunting agents update their locations by (7), but if the value of �A is less than 1, the following are used instead:
(11)�S =∣
∣
∣
�R · �Prand − �P∣
∣
∣
(12)�P(t + 1) = �P∗(t)− �A · �S
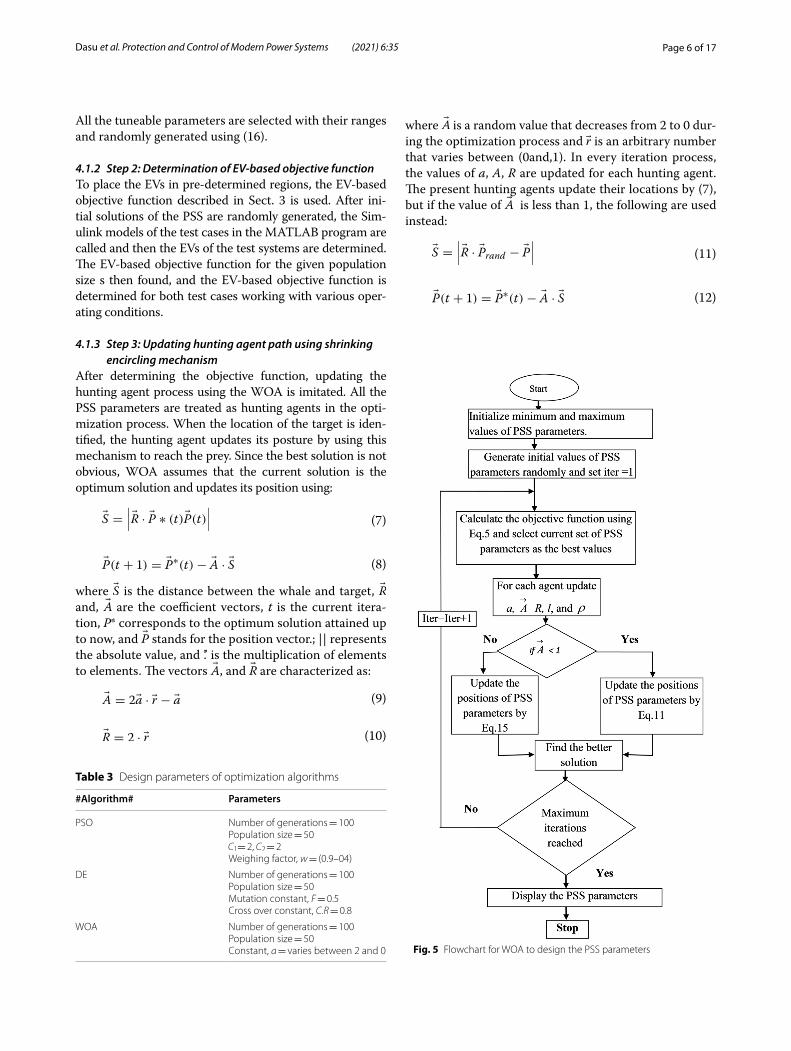
Fig. 5 Flowchart for WOA to design the PSS parameters
Table 3 Design parameters of optimization algorithms
#Algorithm# Parameters
PSO Number of generations = 100Population size = 50C1 = 2, C2 = 2Weighing factor, w = (0.9–04)
DE Number of generations = 100Population size = 50Mutation constant, F = 0.5Cross over constant, C.R = 0.8
WOA Number of generations = 100Population size = 50Constant, a = varies between 2 and 0
Page 7 of 17Dasu et al. Protection and Control of Modern Power Systems (2021) 6:35
where �ω is a position of the whale selected randomly from the present population.
4.1.4 Step 4: Updation of hunting agent path using a spiral mechanism
In this step, the hunting agents follow in a spiral-shaped path to reach the target. To simulate the spi-ral-shaped track between the whale and target, a spiral equation is formulated. All the hunting agents update their position based on the formulated equations as:
where
Here ’l’ is a stochastic limit that diverges between 0 and 1.The shrinking encircle itinerary and spiral itinerary
are merged by giving 50% probability to each of them to update the positions of the hunting agents to reach the prey as:
(13)�P(t + 1) = �S′ebl · cos(2∏
I)+ �P ∗ (t)− �A · �S
(14)�S =∣
∣
∣
�P∗(t)− �P(t)∣
∣
∣
(15)
�P(t + 1) =
{
�P ∗ (t)− �A · �S if δ∠0.5�S′ebl · cos(2
∏
I)+ �P ∗ (t)− �A · �S if δ ≥ 0.5
where δ is an arbitrary number that varies between 0 to 1.The flowchart for the WOA to design the PSS
parameters is depicted in Fig. 5, which describes vari-ous steps involved in the WOA. It starts with the ini-tialization of the PSS parameters with their minimum and maximum values, and then leads to the genera-tion of initial solutions, determination of the objective function, optimization of the PSS parameters accord-ing to the mechanisms mentioned above, and stopping criteria of the algorithm when the number of genera-tions is completed. Table 3 shows the design param-eters of the optimization algorithms.
5 Performance analysis of WOAMany complex test functions are tested with the pro-posed WOA to prove its performance in finding the global solution, and the test results for CEC 14 and CEC 17 functions are displayed in Tables 4 and 5 respec-tively. CEC14 test functions,e.g., High Conditioned Elliptic, Discuss, Rosenbrocks, Weierstrass, Griewanks, Rastrigins’s, Katsuura, Happy Cat, and Griewanks plus Rosenbrocks Functions are with the proposed WOA. The test results are also compared with PSO and, DE algorithms. As shown in Table 4, the results show that the WOA is succeeded in finding the global best fit-ness values for all test functions better than the other algorithms.
Table 5 Test results of CEC 17 test functions
S. nos. Name of the function Order of the function
WOA DE PSOFitness value
1 Bent Cigar function f1(x) 4.0897 e−88 3.3893 e−04 1.9313 e−15
2 Sum of differential power function f2(x) 99.515675945535875 99.5157 99.5157
3 Zakharov function f3(x) 9.5876 e−80 4.1649 e−09 2.7229 e−06
4 Rosenbrocks function f4(x) 1.1866 e−06 3.0034 e−03 1.6720 e−02
5 Rastrigins’s function f5(x) 1.3548 e−80 5.6960 e−05 0.001.2 e−03
6 Expanded Schaffers function f6(x) 0.0097 0.0065 0.0532
7 Lunaeek bi-Rastrigin function f7(x) 2.7252 e−07 0.0373 0.1205
8 Levy function F8(x) 70.0737 e+00 70.3698e+00 78.0292e+00
9 Modified Schwefel’s function F9(x) 4.1183e+06 4.1479e+06 4.1482e+06
10 High conditioned elliptic function f10(x) 3.5101 e−80 3.5632 e−04 1.6684 e−80
11 Discuss function F11(x) 1.7573 e−73 8.6146 e−13 3.1554 e−22
12 Ackley’s function F12(x) 1.6556e+002 1.6587e+002 8.5076e+00
13 Weierstrass function F13(x) 9.441375732713 e−03 9.441375732812 e−03 9.441375733129 e−03
14 Griewanks function F14(x) 5.6654 e−08 0.3131 e−04 1.0852 e−07
15 Katsuura function f15(x) 1.7937 e−10 4.4305 e−10 1.7377e−10
16 HappyCat function f16(x) 1.7126 e−04 0.9555 1.6875 e−08
17 HGBat function f17(x) 2.7428 e−06 2.5256 e−03 8.2076 e−04
18 Expanded Griewanks plus Rosen-brocks function
f18(x) 63.6412 4.5131 7.9816
19 Schffer’s function F19(x) 0.1606 0.0090 0.4613
Page 8 of 17Dasu et al. Protection and Control of Modern Power Systems (2021) 6:35
Similarly, the CEC17 test functions are such as Ras-trigins’s, Lunaeek bi-Rastrigin, Ackley’s Function, Grie-wanks, HG Bat, Griewanks plus Rosenbrocks and Schffer’s functions are tested with the proposed WOA to derive the best fitness value. The test results prove that the WOA can derive the best i.e. better than the other algorithms. The convergence plots of CEC14 and CEC 17 functions are shown in Fig. 6. From these results, it can be seen that WOA performed better in deriving the global best fitness values than the other algorithms.
6 Simulation results and discussions6.1 Case 1The WOA and DE algorithms are run several times con-sidering the new objective function. Evolved PSS param-eters for four loading conditions are listed in Table 6. The following disturbances are considered to test the efficacy and vigor of the proposed WOA-MPSS.
i. 10% step change at Vref
ii. 10% step change at �Tm
Table 4 Test results of CEC 14 test functions
S. nos. Name of the function Order of the function
WOA DE PSOFitness value
1 High Conditioned Elliptic function f1(x) 3.5101e−80 3.5632 e−04 1.6684 e−80
2 Bent Cigar function f2(x) 4.0897e−88 3.3893e−04 1.9313e−15
3 Discuss function f3(x) 1.7573 e−73 8.6146 e−13 3.1554 e−22
4 Rosenbrocks function f4(x) 1.1866 e−06 3.0034 e−03 1.6720 e−02
5 Ackley’s function f5(x) 4.4409 e−14 4.4409 e−14 4.4409 e−14
6 Weierstrass function f6(x) 9.441375732713 e−03 9.441375732812 e−03 9.441375733129 e−03
7 Griewanks function f7(x) 4.6928 e−08 7.0573 e−07 4.2514 e−06
8 Rastrigins’s function f8(x) 1.3548 e−80 5.6960 e−05 0.001.2 e−03
9 Modified Schwefel’s function f9(x) 0.0073 0.0038 0.0083
10 Katsuura function f10(x) 1.7937 e−10 4.4305 e−10 1.7377 e−10
11 HappyCat function f11(x) 1.7126 e−04 0.9555 1.6875 e−08
12 HGBat function f12(x) 2.7428 e−06 2.5256 e−03 8.2076 e−04
Fig. 6 Convergence plots of CEC14 and CEC 17 functions
Page 9 of 17Dasu et al. Protection and Control of Modern Power Systems (2021) 6:35
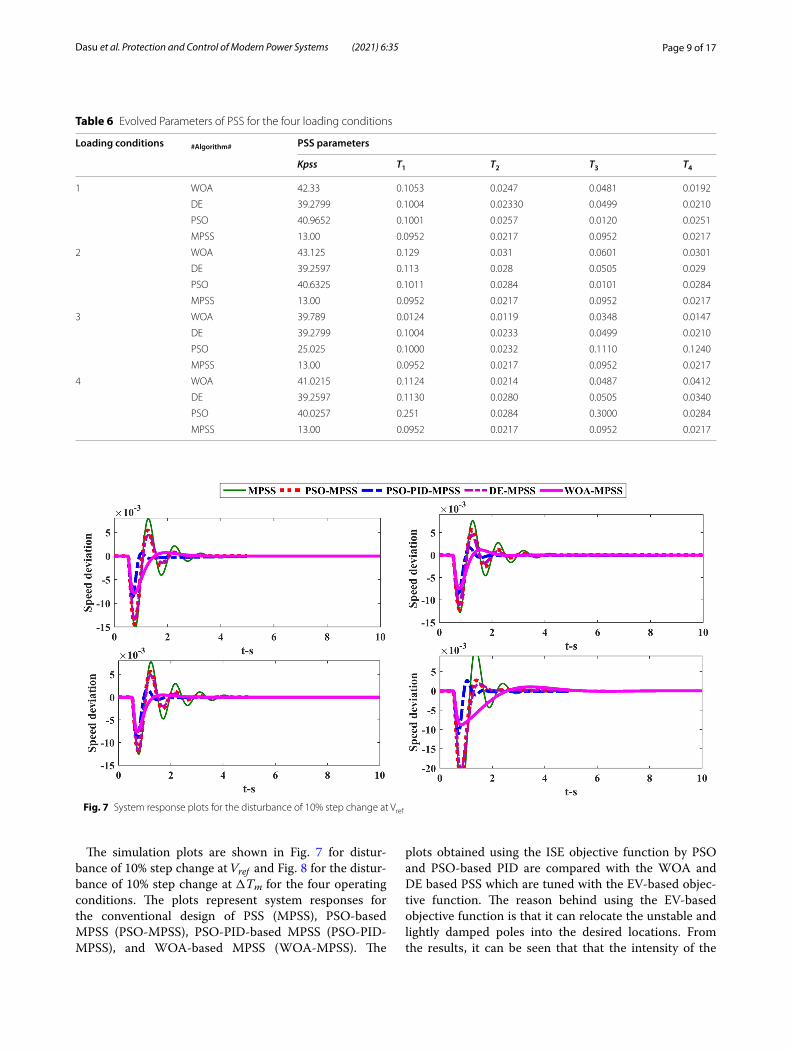
The simulation plots are shown in Fig. 7 for distur-bance of 10% step change at Vref and Fig. 8 for the distur-bance of 10% step change at �Tm for the four operating conditions. The plots represent system responses for the conventional design of PSS (MPSS), PSO-based MPSS (PSO-MPSS), PSO-PID-based MPSS (PSO-PID-MPSS), and WOA-based MPSS (WOA-MPSS). The
plots obtained using the ISE objective function by PSO and PSO-based PID are compared with the WOA and DE based PSS which are tuned with the EV-based objec-tive function. The reason behind using the EV-based objective function is that it can relocate the unstable and lightly damped poles into the desired locations. From the results, it can be seen that that the intensity of the
Table 6 Evolved Parameters of PSS for the four loading conditions
Loading conditions #Algorithm# PSS parameters
Kpss T1 T2 T3 T4
1 WOA 42.33 0.1053 0.0247 0.0481 0.0192
DE 39.2799 0.1004 0.02330 0.0499 0.0210
PSO 40.9652 0.1001 0.0257 0.0120 0.0251
MPSS 13.00 0.0952 0.0217 0.0952 0.0217
2 WOA 43.125 0.129 0.031 0.0601 0.0301
DE 39.2597 0.113 0.028 0.0505 0.029
PSO 40.6325 0.1011 0.0284 0.0101 0.0284
MPSS 13.00 0.0952 0.0217 0.0952 0.0217
3 WOA 39.789 0.0124 0.0119 0.0348 0.0147
DE 39.2799 0.1004 0.0233 0.0499 0.0210
PSO 25.025 0.1000 0.0232 0.1110 0.1240
MPSS 13.00 0.0952 0.0217 0.0952 0.0217
4 WOA 41.0215 0.1124 0.0214 0.0487 0.0412
DE 39.2597 0.1130 0.0280 0.0505 0.0340
PSO 40.0257 0.251 0.0284 0.3000 0.0284
MPSS 13.00 0.0952 0.0217 0.0952 0.0217
Fig. 7 System response plots for the disturbance of 10% step change at Vref
Page 10 of 17Dasu et al. Protection and Control of Modern Power Systems (2021) 6:35
oscillations has been minimized with the WOA-MPSS. The time taken for the oscillations to settle down is also reduced with WOA-MPSS when compared to other sta-bilizers in all cases. Hence it is concluded that the pro-posed WOA-MPSS tuned with the EV-based objective function shows superior performance over the MPSS, PSO-MPSS, DE-MPSS, and PSO-PID-MPSS for all the loading conditions under the typical disturbances.
To further, demonstrate the performance of the pro-posed PSS design technique, EV analysis (EVA) is car-ried out for all the loading conditions and is displayed in Table 7 for four loading conditions with NO-PSS, MPSS, PSO-MPSS, DE-MPSS, PSO-PID-MPSS, and WOA-MPSS. It is seen from the EVs that some of the poles lie on the right-hand side of the s-plane when the PSS is not established in the system and hence the system becomes unstable. It is known that, for any system, the complex conjugate or imaginary poles with low damping ratio are responsible for the oscillatory behavior and the oscilla-tory behavior is pronounced when they are located near the imaginary axis. On the other hand, the real poles do not cause any oscillatory behavior in the system as the damping ratio of the real root is unity. In the present work, the real roots of the system with the proposed and other methods for all the loading conditions are already located in the desired and stable regions. However, the damping ratio of the oscillation causing eigenvalues is less than unity and there is a need to improve the damp-ing ratio of these eigenvalues to improve the damping performance of the system. Therefore, in this work, much attention is paid to these complex conjugate poles with low damping ratios which causes oscillations in the sys-tem. Therefore, the oscillation causing eigenvalues or
complex conjugate poles with low damping ratios are considered to be shifted into the stable regions. Because of this reason, the EV-based objective function is con-structed in such a way that only lightly damped oscillat-ing modes are shifted into the desired locations.
For example, for loading condition 1, with MPSS, the pair of complex conjugate poles which causes the oscil-latory behavior are located at − 1.34 ± 6.39i with the damping ratio ( ς0 ) of 0.20. It is shifted to − 2.03 ± 6.44i with a damping ratio of 0.30 when MPSS is optimized with PSO. It means that the real value (σ) of the com-plex conjugate pole is shifted from − 1.34 to − 2.03. Then it is further shifted to − 6.16 ± 10.1i with a damping ratio of 0.52 when PSS is tuned with PSO- PID-MPSS. Finally, with WOA-PSS, it is shifted to − 2.06 ± 1.57i and the damping ratio is improved to 0.79. Thus the damp-ing ratio has been improved from 0.20 to 0.79 with the proposed WOA-MPSS. Similarly, for loading condition 2, the oscillation causing eigenvalue pair are located at − 1.24 ± 6.27i with the damping ratio of 0.19. When the PSO-MPSS is established in the system the damping ratio is improved to 0.23 and, with DE-MPSS it is improved to 0.26. After that with PSO-PID-MPSS, the damping ratio of the oscillatory causing eigenvalue is improved to 0.43, and finally to 0.80 with the proposed WOA-MPSS For the loading condition 3, the damping ratio is improved from 0.15 to 0.70 with the proposed WOA-MPSS. A sim-ilar improvement has also been observed with the fourth operating condition. Hence, from all these results it is seen that when the PSS parameters are optimized with the proposed WOA, the damping ratios of the oscilla-tion causing eigenvalues are improved and the damping performances of the system with the proposed optimized
Fig. 8 System response plots for the disturbance of 10% step change at ΔTm
Page 11 of 17Dasu et al. Protection and Control of Modern Power Systems (2021) 6:35
Tabl
e 7
Eige
nval
ue a
naly
sis
of fo
ur lo
adin
g co
nditi
ons
Load
ing
cond
ition
1Lo
adin
g co
nditi
on 2
Load
ing
cond
ition
3Lo
adin
g co
nditi
on 4
NO
-PSS
0.91
± 8
.55i
− 0
.10
8.60
1.84
± 9
.59i
− 0
.188
9.77
1.75
± 8
.90i
− 0
.19
9.07
2.88
± 1
2.8i
− 0
.220
13.1
− 2
6.1 ±
13.
30.
8929
.3−
27.
1 ±
15.
1i0.
8731
.022
.01.
0022
.0−
28.
1 ±
24.
3i0.
757
37.2
MPS
S−
0.5
11.
000.
51−
0.5
151.
000.
51−
0.5
11.
000.
51−
0.5
91.
000.
52
− 1
.34 ±
6.3
9i0.
206.
53−
1.2
4 ±
6.2
7i0.
196.
39−
1.0
3 ±
6.7
3i0.
156.
81−
1.7
1 ±
6.0
7i0.
276.
30
− 1
5.6
1.00
15.6
− 1
6.9
1.00
16.9
− 1
7.8
1.00
1.78
− 8
.74
1.00
8.74
− 4
4.3
1.00
44.3
− 5
6.2 ±
15.
6i0.
9658
.4−
49.
01.
0049
.1−
29.
81.
0029
.8
− 7
6.6
1.00
76.6
− 6
6.6
1.00
66.6
− 1
161.
0011
6
PSO
-MPS
S−
0.5
1.00
0.52
− 0
.51
1.00
0.51
− 0
.51
1.00
0.51
− 0
.55
1.00
0.55
− 2
.03 ±
6.4
4i0.
306.
75−
1.5
8 ±
6.5
5i0.
236.
73−
1.6
3 ±
6.7
9,0.
236.
99−
3.6
6 ±
5.7
1i0.
546.
78
− 1
7.7
1.00
17.7
− 1
9.5
1.00
19.5
− 2
0.1
1.00
20.1
− 8
.11
1.00
8.11
− 4
5.3 ±
4.5
0i0.
9945
.5−
45.
5 ±
12.
5i0.
9647
.2−
42.
3 ±
7.1
8i0.
9842
.9−
28.
21.
0028
.2
PSO
-PID
-MPS
S−
1.7
0e−
151.
001.
7e−
15−
2.1
e−16
1.00
21e−
16−
1.0
0e−
151.
001.
0e−
15−
2.1
e−15
1.00
2.1e−
15
− 0
.26
1.00
0.26
-0.3
71.
000.
37−
0.3
91.
000.
39−
0.0
21.
000.
02
− 6
.16 ±
10.
1i0.
5211
.8−
3.5
3 ±
7.4
2i0.
438.
22−
3.8
6 ±
8.1
0i0.
438.
97−
3.7
3 ±
10.
0i0.
3410
.7
− 1
3.6
1.00
13.6
− 2
1.3
1.00
21.3
− 1
9.1
1.00
19.1
− 1
1.6
1.00
11.6
− 1
091.
0010
9−
106
1.00
106
− 1
071.
0010
7−
158
1.00
158
DE-
MPS
S0.
511.
000.
5148
.11.
0048
.1−
0.4
41.
000.
44−
3.3
2 ±
5.4
2i0.
526.
35
− 1
.89 ±
6.4
60.
286.
73−
1.7
0 ±
6.0
61i
0.26
7.24
− 1
.60 ±
6.8
4i0.
227.
03−
8.8
41.
008.
84
− 1
7.6
1.00
17.6
− 2
0.2
1.00
20.2
− 1
9.9
1.00
19.9
− 2
7.7
1.00
27.7
43.9
1.00
43.9
− 4
0.5
1.00
40.5
− 3
8.7
1.00
38.7
− 6
7.8
1.00
67.8
− 6
1.9
1.00
61.9
− 4
1.4
1.00
41.4
− 4
6.5
46.5
1.00
Prop
osed
WO
A-M
PSS
− 0
.10
1.00
0.10
− 0
.10
1.00
0.10
− 0
.10
1.00
0.10
− 0
.10
1.00
0.10
− 2
.06 ±
1.5
7i0.
792.
59−
1.8
5 ±
1.4
1i0.
802.
33−
1.9
8 ±
2.2
6i0.
703.
00−
1.9
1 ±
1.3
60.
812.
34
− 7
.25
1.00
7.25
− 1
4.0 ±
7.8
5i0.
900.
16−
8.2
61.
008.
26−
14.
6 ±
1.3
6i0.
9815
.00
− 3
5.10
± 1
0.00
i0.
9636
.50
− 1
17.0
01.
0011
7−
27.
101.
0027
.1−
128
.00
1.00
128.
0
Page 12 of 17Dasu et al. Protection and Control of Modern Power Systems (2021) 6:35
parameters of the WOA are better enhanced for all the loading conditions than other methods.
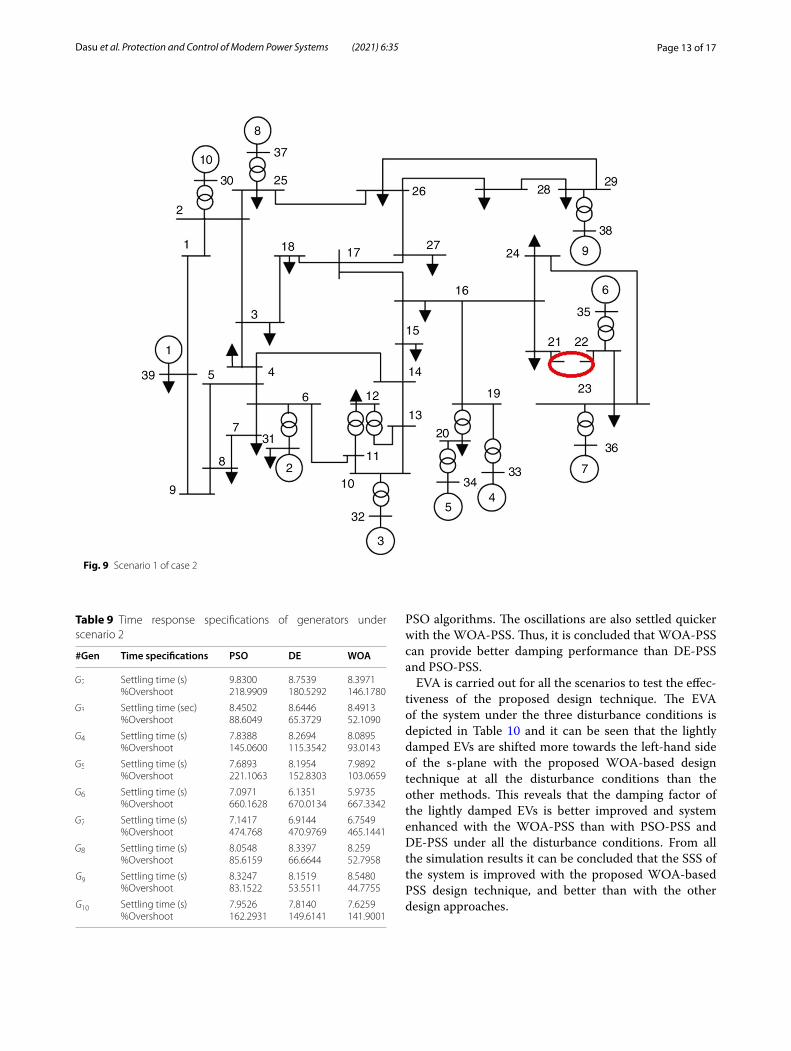
6.2 Case 2To test the efficacy of the suggested WOA-PSS, a second test case is considered. The optimal design of PSS is car-ried out by considering the EV-based objective function using the WOA, DE, and PSO algorithms. All the gen-erators except generator one, are equipped with PSS and the parameters are optimized using the WOA. In total 45 parameters named KPssi, T1i, T2i, T3i and T4i are opti-mized, as listed in Table 8. To test the effectiveness and robustness of the proposed WOA-PSS various distur-bances are created at various locations of the test system. These conditions are extremely harsh from a stability point of view with the following cases studied to investi-gate the efficacy of the WOA-PSS:
Scenario 1 line outage between 21 and 22.Scenario 2 line outage between 14 and 15.Scenario 3 25% increase in loads at buses 16 and 21, 25% increase in the generation of G7, and line outage between 21 and 22.
Figure 9 represents Scenario 1 of case 2. To create the disturbance, the line between buses 21 and 22 is open-circuited and the stability behavior of the generators with the proposed WOA-PSS and other PSSs are studied. After that, another disturbance of line outage between buses 14 and 15 (scenario 2) is created and the results are shown in Fig. 10. Similarly, the third disturbance con-dition of the line outage between 21 and 22 is created under scenario 3 to effectiveness of the proposed PSS design technique, and Fig. 11 shows the corresponding speed deviation of the system. It can be observed from the results that the system becomes unstable when PSSs are not connected to the generators. When PSSs are
incorporated (without proper tuning), more oscillations are observed in the system. This is because of the lack of sufficient damping torque. This is not desirable from the stability point of view. On the other hand, when PSS parameters are designed with the WOA and placed at respective generators, the oscillations are reduced. The intensity of the oscillations is considerably lower with WOA-PSS compared to PSO-PSS and DE-PSS, and the simulation results show that WOA-PSS provides better dynamic performance characteristics over DE-PSS and PSO-PSS.
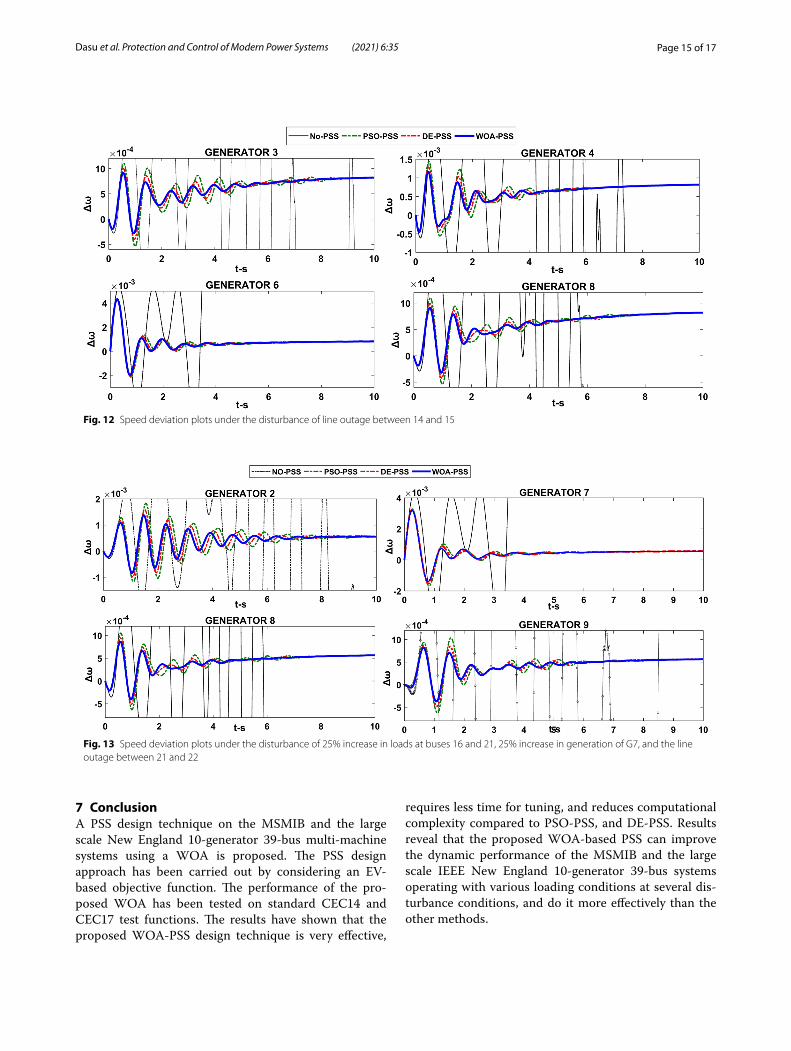
The system behavior under the second disturbance of line outage between 14 and 15 is studied. Extensive simulation results on the speed deviations are obtained and presented in Fig. 12. The simulation results show that WOA-PSS provides better damping performance than the other two methods. For the third scenario, the speed deviation under the disturbance of a 25% increase in loads at buses 16 and 21, a 25% increase in the gen-eration of G7, and the line outage between 21 and 22 are shown in Fig. 13. From these responses, it is noted that the oscillations are reduced and settled in quicker with the WOA-PSS compared to DE-PSS and PSO-PSS at all the generators shown. Hence, WOA-PSS can provide better damping performance than the other two stabiliz-ers. Table 9 depicts the time response specifications of generators under scenario 2. As seen, the settling time is decreased from 9.8300 to 8.9371 s with WOA-PSS for generator two. In the case of generator three, the settling time is reduced from 8.4502 to 8.4913 s, where as for generator five, oscillations are settled in 7.9892 s with the WOA-PSS. At generator six the settling time is 7.0971 s when PSO-PSS is used and is reduced to 6.1351 s with DE-PSS and to 5.9735 s with WOA-PSS. Similarly, the time taken for settling down the oscillations at generator seven with PSO-PSS is 7.1417 and is reduced to 6.7459 s with WOA-PSS. A similar decrement is also observed in the remaining generators. The peak overshoot is also decreased with WOA-PSS when compared to PSO-PSS and DE-PSS. Hence it is shown that the WOA-based sta-bilizers give better transient responses than the other DE and PSO based stabilizers for all the generators under this disturbance with significant improvements in peak overshoot and settling time.
The strength of the WOA-PSS is tested with the third disturbance condition. and Fig. 13 depicts the speed deviation plots under the disturbance of a 25% increase in loads at buses 16 and 21, a 25% increase in the gen-eration of G7, and the line outage between 21 and 22. The peak overshoots of the oscillations at generator two, seven, eight, and nine are reduced with the WOA-PSS compared to other stabilizers designed with the DE and
Table 8 Evolved parameters of PSS for case 2 using WOA
#Gen Kpss T1 T2 T3 T4
G2 51.234 0.345 0.0136 0.412 0.014
G3 29.126 0.674 0.0275 0.623 0.039
G4 42.654 0.728 0.0501 0.698 0.048
G5 50.143 0.126 0.0621 0.294 0.026
G6 47.865 0.701 0.0152 0.964 0.065
G7 2.879 0.379 0.0282 0.478 0.122
G8 27.125 0.852 0.0169 0.757 0.019
G9 5.654 0.248 0.0512 0.265 0.298
G10 19.597 1.023 0.0389 1.21 0.031
Page 13 of 17Dasu et al. Protection and Control of Modern Power Systems (2021) 6:35
PSO algorithms. The oscillations are also settled quicker with the WOA-PSS. Thus, it is concluded that WOA-PSS can provide better damping performance than DE-PSS and PSO-PSS.
EVA is carried out for all the scenarios to test the effec-tiveness of the proposed design technique. The EVA of the system under the three disturbance conditions is depicted in Table 10 and it can be seen that the lightly damped EVs are shifted more towards the left-hand side of the s-plane with the proposed WOA-based design technique at all the disturbance conditions than the other methods. This reveals that the damping factor of the lightly damped EVs is better improved and system enhanced with the WOA-PSS than with PSO-PSS and DE-PSS under all the disturbance conditions. From all the simulation results it can be concluded that the SSS of the system is improved with the proposed WOA-based PSS design technique, and better than with the other design approaches.
Fig. 9 Scenario 1 of case 2
Table 9 Time response specifications of generators under scenario 2
#Gen Time specifications PSO DE WOA
G2 Settling time (s)%Overshoot
9.8300218.9909
8.7539180.5292
8.3971146.1780
G3 Settling time (sec)%Overshoot
8.450288.6049
8.644665.3729
8.491352.1090
G4 Settling time (s)%Overshoot
7.8388145.0600
8.2694115.3542
8.089593.0143
G5 Settling time (s)%Overshoot
7.6893221.1063
8.1954152.8303
7.9892103.0659
G6 Settling time (s)%Overshoot
7.0971660.1628
6.1351670.0134
5.9735667.3342
G7 Settling time (s)%Overshoot
7.1417474.768
6.9144470.9769
6.7549465.1441
G8 Settling time (s)%Overshoot
8.054885.6159
8.339766.6644
8.25952.7958
G9 Settling time (s)%Overshoot
8.324783.1522
8.151953.5511
8.548044.7755
G10 Settling time (s)%Overshoot
7.9526162.2931
7.8140149.6141
7.6259141.9001
Page 14 of 17Dasu et al. Protection and Control of Modern Power Systems (2021) 6:35
Fig. 10 Scenario 2 of case 2
Fig. 11 Speed deviation plots under the disturbance of line outage between 21 and 22
Page 15 of 17Dasu et al. Protection and Control of Modern Power Systems (2021) 6:35
7 ConclusionA PSS design technique on the MSMIB and the large scale New England 10-generator 39-bus multi-machine systems using a WOA is proposed. The PSS design approach has been carried out by considering an EV-based objective function. The performance of the pro-posed WOA has been tested on standard CEC14 and CEC17 test functions. The results have shown that the proposed WOA-PSS design technique is very effective,
requires less time for tuning, and reduces computational complexity compared to PSO-PSS, and DE-PSS. Results reveal that the proposed WOA-based PSS can improve the dynamic performance of the MSMIB and the large scale IEEE New England 10-generator 39-bus systems operating with various loading conditions at several dis-turbance conditions, and do it more effectively than the other methods.
Fig. 12 Speed deviation plots under the disturbance of line outage between 14 and 15
Fig. 13 Speed deviation plots under the disturbance of 25% increase in loads at buses 16 and 21, 25% increase in generation of G7, and the line outage between 21 and 22
Page 16 of 17Dasu et al. Protection and Control of Modern Power Systems (2021) 6:35
AbbreviationsWOA: Whale optimization algorithm; PSS: Power system stabilizer; MPSS: Modi-fied power system stabilizer; MSMIB: Modified single machine infinite bus; MM: Multi-machine; SSS: Small signal stability; EV: Eigenvalue; PSO: Particle swarm optimization; DE: Differential evolution; HP: Heffron Phillips; MHP: Modified Heffron Phillips; EVA: Eigenvalue analysis.
AcknowledgementsNot applicable.
Authors’ contributionsBD designed the study and formulated the objective function. BD and MS performed the simulations on test systems. MS and RS as supervisors helped in pursing the work with constructive suggestions and edited the manuscript. All authors read and approved the final manuscript.
Authors’ informationB. Dasu: The author completed his M. Tech from JNTU Kakinada and pursuing his PhD in JNTU Kakinada. His research interests include Control application to Power Systems and Evolutionary Algorithms.Mangipudi Siva Kumar: The author completed his M.E and PhD from Andhra University. He is presently working as Professor in EEE Department, Gudlavalleru Engineering College, Gudlavalleru. He has contributed more than 40 technical papers in various referred journals and conference. He is a life member of ISTE, member of IEEE and IAEng and Fellow of Institution of Engi-neers. His research interests include model order reduction, interval system analysis, design of PI/PID controllers for Interval systems, sliding mode control and Soft computing Techniques.R. Srinivasa Rao: The author completed his M.E from IISC Bangalore and PhD from JNTU Hyderabad. He is currently working as professor in EEE Department of JNTU Kakinada. His research interests include Optimization Algorithms, State estimation, Modeling and control of Induction Generators. He has pub-lished papers in IEEE transactions, Elsevier Publications.
FundingThis work is carried out without support of any funding agency.
Availability of data and materialsPlease contact author for data and material request.
Declaration
Competing interestsThe authors declare that they have no known competing financial interests or personal relationships that could have appeared to influence the work reported in this paper.
Author details1 Department of EEE, Gudlavalleru Engineering College, Gudlavlleru, Krishna (Dt.), Andhra Pradesh 521301, India. 2 Department of EEE, University College of Engineering, JNTUK, Kakinada, East Godavari (Dt.), Andhra Pradesh 533001, India.
Received: 15 July 2020 Accepted: 2 November 2021
References 1. Demello, F. P., & Concordia, C. (1969). Concepts of synchronous machine
stability as affected by excitation control. IEEE Transactions on Power Apparatus and Systems PAS, 88(4), 316–329.
2. Schleif, F., Hunkins, H., Martin, G., & Hattan, E. (1968). Excitation control to improve powerline stability. IEEE Transactions on Power Apparatus and Systems PAS, 87(6), 1426–1434.
Page 17 of 17Dasu et al. Protection and Control of Modern Power Systems (2021) 6:35
3. Larsen, E. V., & Swann, D. A. (1981). Applying power system stabilizers parts I, II and III: Practical considerations. IEEE Transactions on Power Appa-ratus and Systems PAS, 100(6), 3034–3046.
4. Kundur, P., Klein, M., Rogers, G. J., & Zywno, M. S. (1989). Application of power system stabilizers for enhancement of overall system stability. IEEE Transactions on Power Systems, 4(2), 614–626.
5. Padiyar, K. R. (1996). Power system dynamics stability and control. Interline Publishing.
6. Gibbard, M. J. (1988). Co-ordinated design of multimachine power system stabilizers based on damping torque concepts. IEE Proceedings C Genera-tion, Transmission and Distribution, 135(4), 276.
7. Roger, G. (2000). Power system oscillations. Dordrecht: Kluwer. 8. Dysko, A., Leithead, W. E., & O’Reilly, J. (2010). Enhanced power system
stability by coordinated PSS design. IEEE Transmission Power Systems, 25(1), 1200.
9. Chow, J. H., & Sanchez-Gasca, J. J. (1989). Pole-placement designs of power system stabilizers. IEEE Transmission Power Systems, 4(1), 271–277.
10. Kashki, M., Abido, M. A., & Abdel-Magid, Y. L. (2010). Pole placement approach for robust optimum design of PSS and TCSC-based stabiliz-ers using reinforcement learning automata. Electrical Engineering, 91(7), 383–394.
11. Gomes, S., Guimarães, C. H. C., Martins, N., & Taranto, G. N. (2018). Damped Nyquist Plot for a pole placement design of power system stabilizers. Electric Power Systems Research, 158, 158–169.
12. Kothari, M. L., Nanda, J., & Bhattacharya, K. (1993). Design of variable structure power system stabilizers with desired Eigenvalues in the sliding mode. IEE Proceedings C Generation, Transmission and Distribution, 140(4), 263–268.
13. Bandal, V., & Bandyopadhyay, B. (2007). Robust decentralised output feedback sliding mode control technique-based power system stabiliser (PSS) for multimachine power system. IET Control Theory and Applications, 1(5), 1512–1522.
14. Dash, P. K., Patnaik, R. K., & Mishra, S. P. (2018). Adaptive fractional integral terminal sliding mode power control of UPFC in DFIG wind farm pen-etrated multimachine power system. Protection and Control of Modern Power Systems, 3(8), 1–14.
15. Aldeen, M. (1995). Multimachine power system stabiliser design based on new LQR approach. IEE Proceedings C Generation, Transmission and Distribution, 142(5), 494.
16. Ko, H. S., Lee, K. Y., & Kim, H. C. (2004). An intelligent based LQR controller design to power system stabilization. Electric Power Systems Research, 71(1), 1–9.
17. Yang, T. (1997). Applying H − ∞ optimisation method to power system stabiliser design, part 1: single-machine infinite-bus systems. International Journal of Electrical Power & Energy Systems, 19(1), 29–35.
18. Hardiansyah, S. F., & Irisawa, J. (2006). A robust H∞ power system stabi-lizer design using reduced-order models. International Journal of Electrical Power & Energy Systems, 28(1), 21–28.
19. Hoang, P., & Tomsovic, K. (1996). Design and analysis of an adaptive fuzzy power system stabilizer. IEEE Transactions on Energy Conversion, 11(2), 455–461.
20. Ghadimi, N. (2015). A new hybrid algorithm based on optimal fuzzy controller in multimachine power system. Complexity, 21(1), 78–93.
21. Abido, M. A. (1999). A novel approach to conventional power system stabilizer design using tabu search. International Journal of Electrical Power & Energy Systems, 21(6), 443–454.
22. Abido, M. A., & Abdel-Magid, Y. L. (2000). Robust design of multimachine power system stabilisers using tabu search algorithm. IEE Proceedings C Generation, Transmission and Distribution, 147(6), 387.
23. Abdel-Magid, Y. L., Abido, M. A., Al-Baiyat, S., & Mantawy, A. H. (1999). Simultaneous stabilization of multimachine power systems via genetic algorithms. IEEE Transactions on Power Systems, 14(4), 1428–1439.
24. Abdel-Magid, Y. L., & Abido, M. A. (2003). Optimal multiobjective design of robust power system stabilizers using genetic algorithms. IEEE Transac-tions on Power Systems, 18(3), 1125–1132.
25. Magdy, G., Shabib, G., Elbaset, A. A., et al. (2018). Optimized coordi-nated control of LFC and SMES to enhance frequency stability of a real
multi-source power system considering high renewable energy penetra-tion. Protection and Control of Modern Power Systems, 3(39), 1–15.
26. El-Zonkoly, M., Khalil, A. A., & Ahmied, N. M. (2009). Optimal tuning of lead-lag and fuzzy logic power system stabilizers using PSO. Expert Systems with Applications, 36(2), 2097–2106.
27. Butti, D., Mangipudi, S. K., & Rayapudi, S. R. (2019). Design of robust modi-fied power system stabilizer for dynamic stability improvement using Particle Swarm Optimization technique. Ain Shams Engineering Journal, 10(4), 769–783.
28. Keumarsi, V., Simab, M., & Shahgholian, G. (2014). An integrated approach for optimal placement and tuning of power system stabilizer in multi-machine systems. International Journal of Electrical Power & Energy Systems, 63, 132–137.
29. Eslami, M., Shareef, H., Mohamed, A., & Khajehzadeh, M. (2012). An efficient PSO technique with chaotic sequence for optimal tuning and placement of PSS in power systems. International Journal of Electrical Power & Energy Systems, 43(1), 1467–1478.
30. Wang, Z., Chung, C. Y., Wong, K. P., & Tse, C. T. (2008). Robust power system stabiliser design under multi-operating conditions using differential evolution. IET Generation, Transmission and Distribution, 2(5), 690.
31. Panda, S. (2009). Differential evolutionary algorithm for TCSC-based con-troller design. Simulation Modelling Practice and Theory, 17(10), 1618–1634.
32. Wang, S.-K., Chiou, J.-P., & Liu, C.-W. (2009). Parameters tuning of power system stabilizers using improved ant direction hybrid differential evolu-tion. International Journal of Electrical Power & Energy Systems, 31(1), 34–42.
33. Wang, S. K. (2016). Coordinated parameter design of power system stabilizers and static synchronous compensator using gradual hybrid differential evaluation. International Journal of Electrical Power & Energy Systems, 81, 165–174.
34. Chatterjee, A., Ghoshal, S. P., & Mukherjee, V. (2011). Chaotic ant swarm optimization for fuzzy-based tuning of power system stabilizer. Interna-tional Journal of Electrical Power & Energy Systems, 33(3), 657–672.
35. Sambariya, D. K., Prasad, R., & Birla, D. (2015). Design and performance analysis of PID based controller for SMIB power system using Firefly algorithm. In 2015 2nd international conference on recent advances in engineering & computational sciences (RAECS) (pp. 1–8).
36. Sambariya, D. K., & Prasad, R. (2015). Optimal tuning of fuzzy logic power system stabilizer using harmony search algorithm. International Journal of Fuzzy Systems, 17(3), 457–470.
37. Abd-Elazim, S. M., & Ali, E. S. (2015). A hybrid PSO and bacterial foraging for power system stability enhancement. Complexity, 21(2), 245–255.
38. Chitara, D., Niazi, K. R., Swarnkar, A., & Gupta, N. (2018). "Cuckoo search optimization algorithm for designing of a multi-machine power system stabilizer. IEEE Transactions on Industry Applications, 54(4), 3056–3065.
39. Ali, E. S. (2014). Optimization of power system stabilizers using BAT search algorithm. International Journal of Electrical Power & Energy Systems, 61, 683–690.
40. Chaib, L., Choucha, A., & Arif, S. (2017). Optimal design and tuning of novel fractional order PID power system stabilizer using a new metaheuristic Bat algorithm. Ain Shams Engineering Journal, 8(2), 113–125.
41. Khadanga, R. K., & Satapathy, J. K. (2015). Time delay approach for PSS and SSSC based coordinated controller design using hybrid PSO–GSA algorithm. International Journal of Electrical Power & Energy Systems, 71, 262–273.
42. Shakarami, M. R., & Faraji Davoudkhani, I. (2016). Wide-area power system stabilizer design based on Grey Wolf Optimization algorithm considering the time delay. Electric Power Systems Research, 133, 149–159.
43. Mirjalili, S., & Lewis, A. (2016). The whale optimization algorithm. Advances in Engineering Software, 95, 51–67.
44. Dasu, B., Sivakumar, M., & Srinivasarao, R. (2019). Interconnected multi-machine power system stabilizer design using whale optimization algorithm. Protection and Control of Modern Power Systems, 4(2), 1–11.
45. Gurrala, G., & Sen, I. (2008). A modified Heffron-Phillip’s model for the design of power system stabilizers. In Joint international conference on power system technology and IEEE power India (pp. 1–6).
46. Pai, M. A. (1989). Energy function analysis for power system stability. Boston, MA: Springer, US.