22
Statistical Inference Week 4: Statistical power, ANOVA, and post hoc tests
| Date post: | 14-Jul-2015 |
| Category: |
Education |
| Upload: | eugene-yan |
| View: | 665 times |
| Download: | 0 times |
Statistical InferenceWeek 4: Statistical power, ANOVA, and post hoc tests
Statistical Power
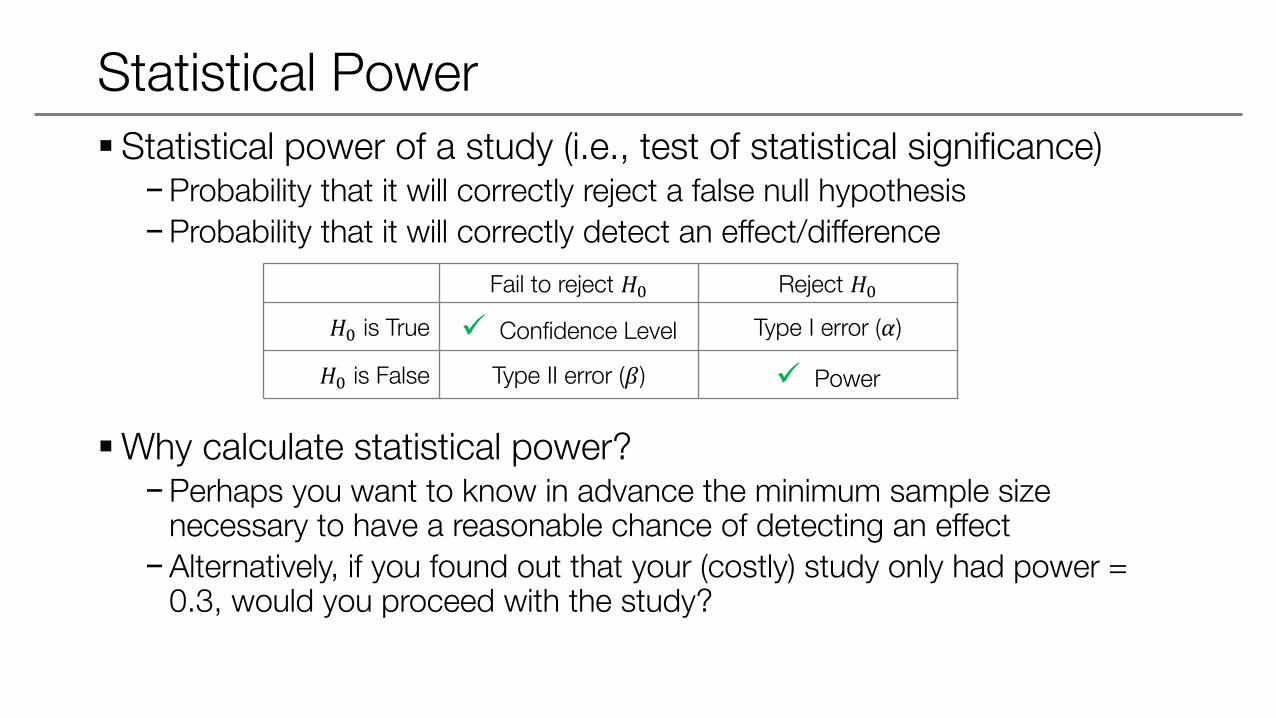
Statistical power of a study (i.e., test of statistical significance)−Probability that it will correctly reject a false null hypothesis
−Probability that it will correctly detect an effect/difference
Why calculate statistical power?−Perhaps you want to know in advance the minimum sample size
necessary to have a reasonable chance of detecting an effect
−Alternatively, if you found out that your (costly) study only had power = 0.3, would you proceed with the study?
Fail to reject 𝐻0 Reject 𝐻0
𝐻0 is True Confidence Level Type I error (𝛼)
𝐻0 is False Type II error (𝛽) Power
Calculating Statistical Power
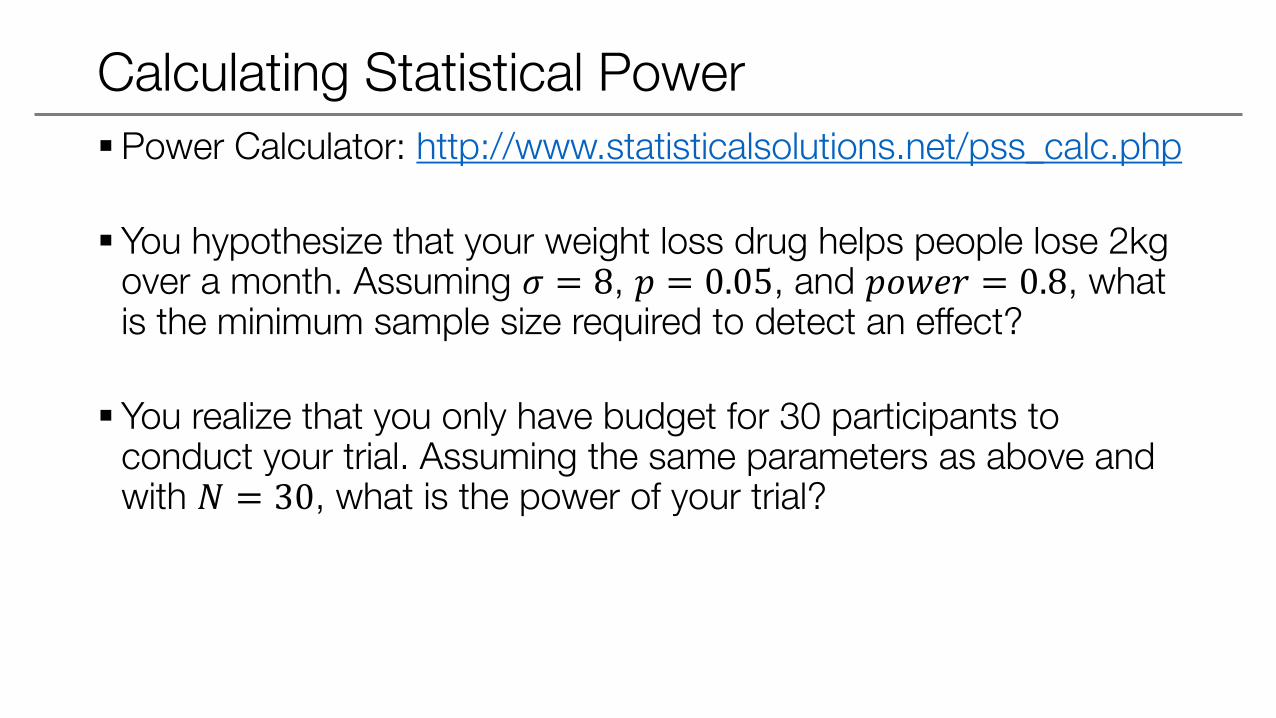
Power Calculator: http://www.statisticalsolutions.net/pss_calc.php
You hypothesize that your weight loss drug helps people lose 2kg over a month. Assuming 𝜎 = 8, 𝑝 = 0.05, and 𝑝𝑜𝑤𝑒𝑟 = 0.8, what is the minimum sample size required to detect an effect?
You realize that you only have budget for 30 participants to conduct your trial. Assuming the same parameters as above and with 𝑁 = 30, what is the power of your trial?

Parameters of Statistical Power
𝑆𝑖𝑔𝑛𝑖𝑓𝑖𝑐𝑎𝑛𝑐𝑒 𝐿𝑒𝑣𝑒𝑙 / 𝑝 − 𝑣𝑎𝑙𝑢𝑒 (𝛼) 𝑆𝑎𝑚𝑝𝑙𝑒 𝑆𝑖𝑧𝑒 (𝑁)
𝐸𝑓𝑓𝑒𝑐𝑡 𝑆𝑖𝑧𝑒 (𝐶𝑜ℎ𝑒𝑛′𝑠 𝑑) 𝐷𝑖𝑠𝑡𝑟𝑖𝑏𝑢𝑡𝑖𝑜𝑛 𝜎2
Tests with smaller p-values are more “rigorous” and require more power.− Increasing p-value from 0.01 to 0.1 means that you will
be rejecting 𝐻0 more often (99% vs 90%)− There is a greater chance of accepting B relative to A
The bars show the 95% CI. In C, the sample sizes are small and thus the CI is large; in contrast, D has larger sample sizes and thus smaller CI.As a result, it would be easier to detect the difference in D relative to C.
DC
FE
Given that the size of difference (effect size) in F is much larger than in E, a statistical test would find it easier to detect the difference in F.
As the distribution of H has lesser variance than G, there would be lesser overlap in their CIs. Thus, it would be easier to detect the difference in H.
HG
BA 𝛼 = 0.01 𝛼 = 0.1
Comparing more than two means
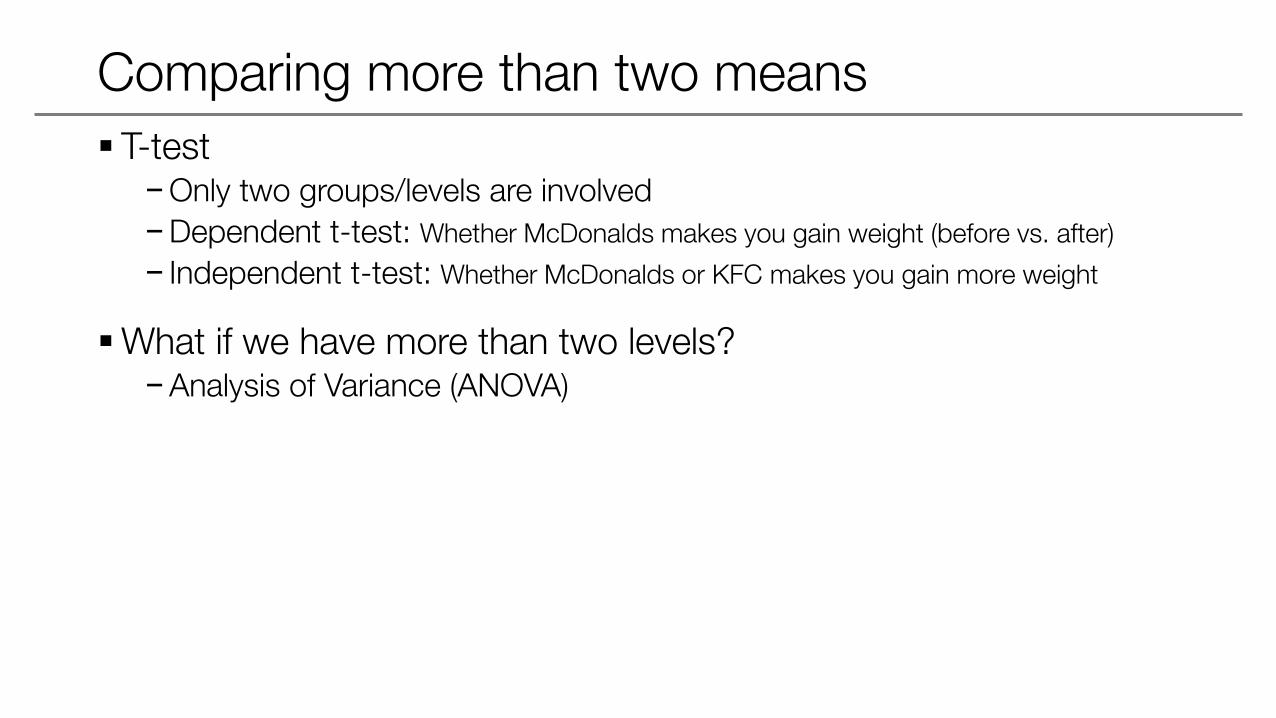
T-test−Only two groups/levels are involved
−Dependent t-test: Whether McDonalds makes you gain weight (before vs. after)
− Independent t-test: Whether McDonalds or KFC makes you gain more weight
What if we have more than two levels?−Analysis of Variance (ANOVA)
Hypothesis testing for ANOVA
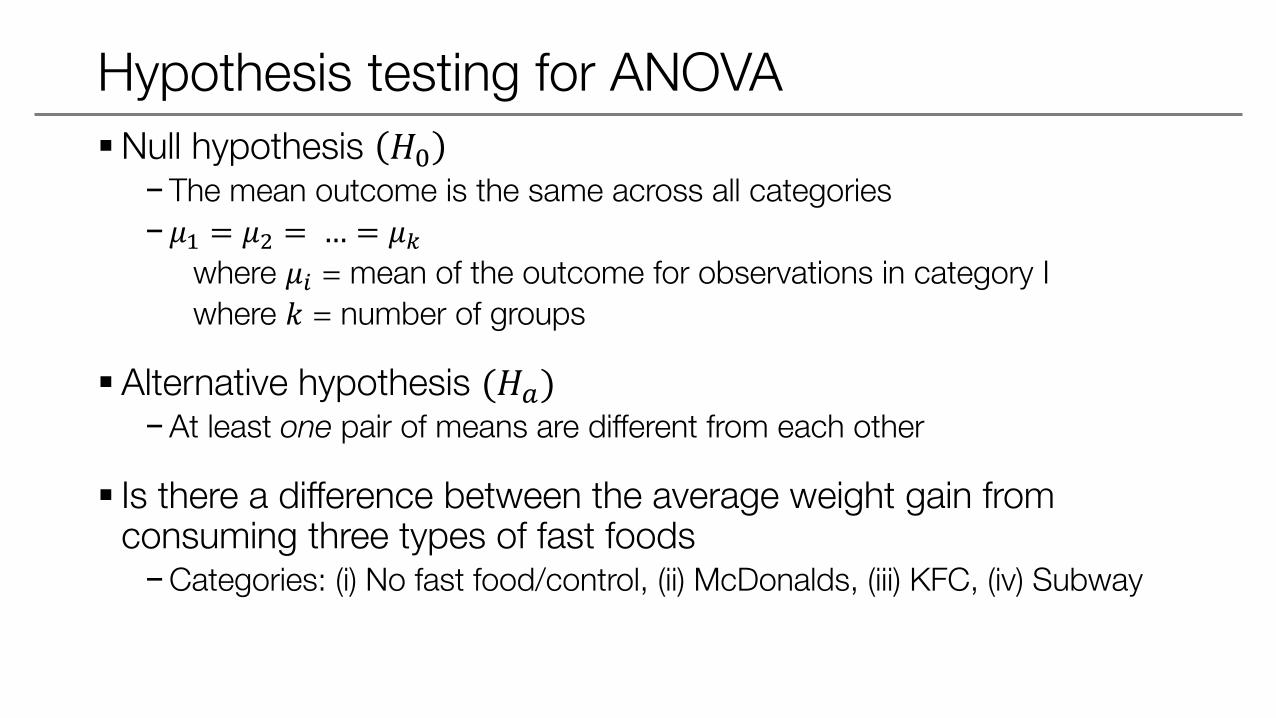
Null hypothesis 𝐻0−The mean outcome is the same across all categories
− 𝜇1 = 𝜇2 = … = 𝜇𝑘where 𝜇𝑖 = mean of the outcome for observations in category I
where 𝑘 = number of groups
Alternative hypothesis (𝐻𝑎)−At least one pair of means are different from each other
Is there a difference between the average weight gain from consuming three types of fast foods−Categories: (i) No fast food/control, (ii) McDonalds, (iii) KFC, (iv) Subway
Variability portioning in ANOVA
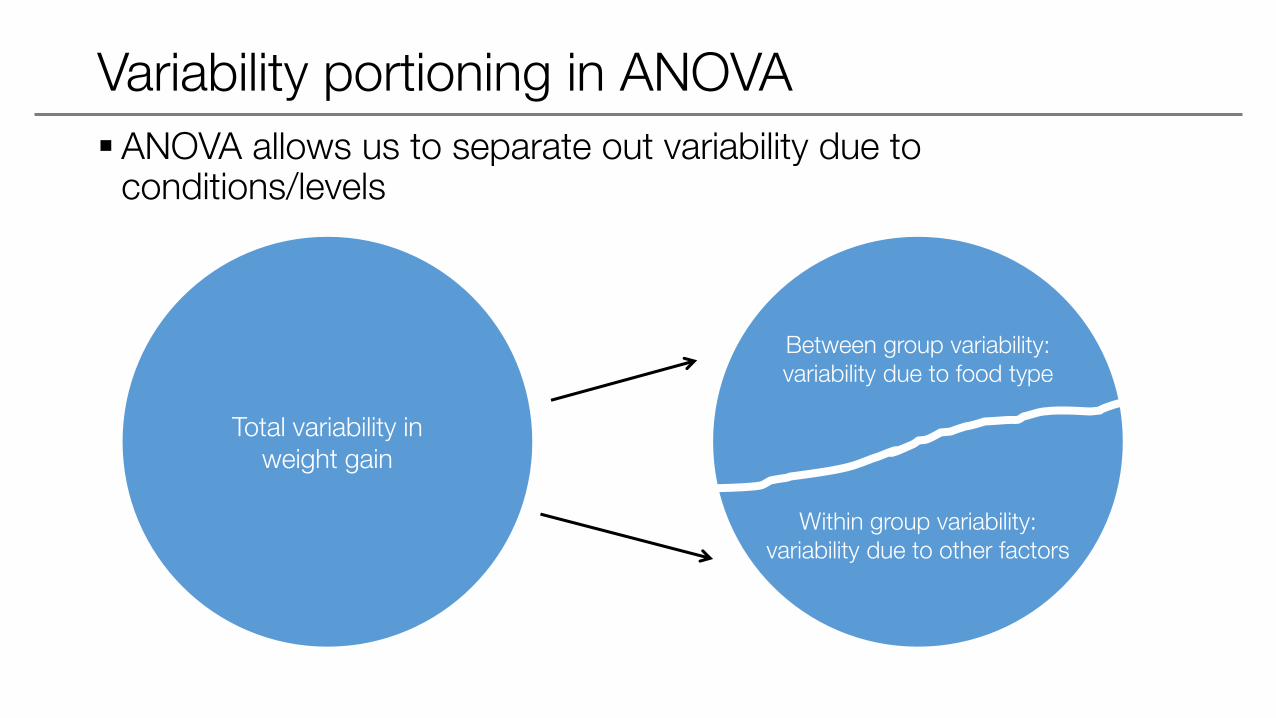
ANOVA allows us to separate out variability due to conditions/levels
Total variability in weight gain
Between group variability: variability due to food type
Within group variability: variability due to other factors
t test vs. ANOVA
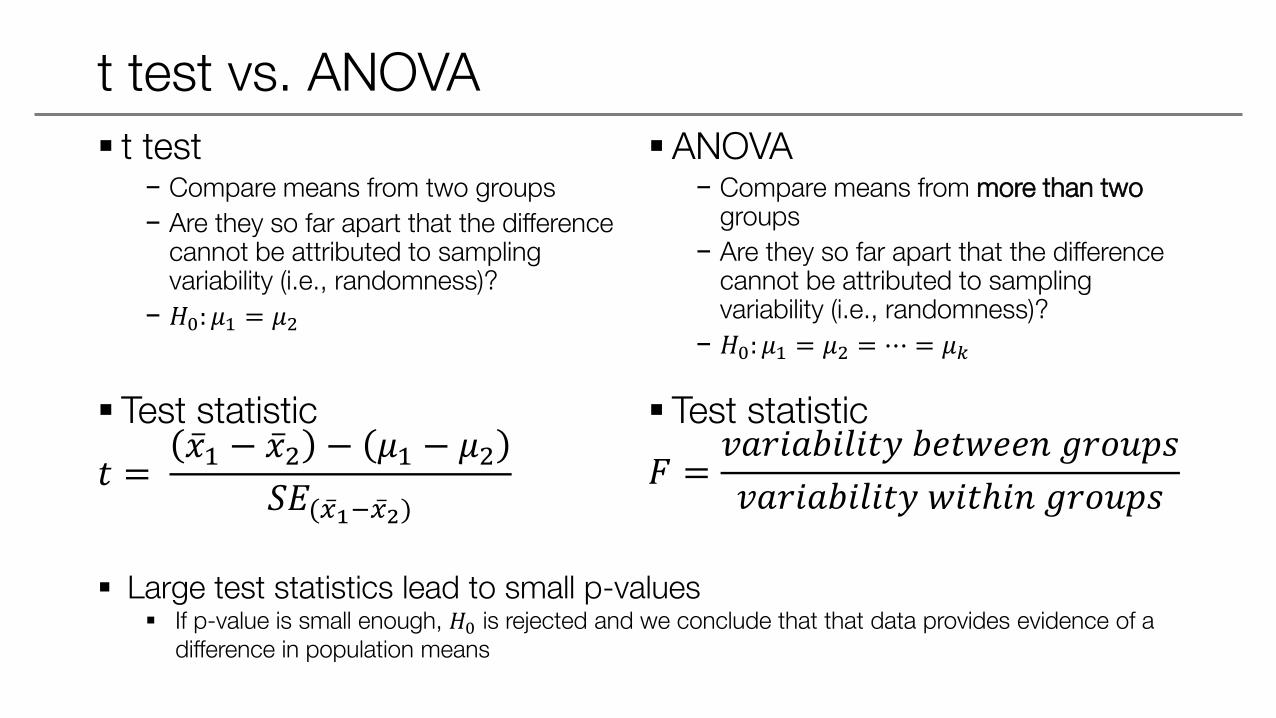
t test− Compare means from two groups
− Are they so far apart that the difference cannot be attributed to sampling variability (i.e., randomness)?
− 𝐻0: 𝜇1 = 𝜇2
Test statistic
𝑡 = 𝑥1 − 𝑥2 − 𝜇1 − 𝜇2
𝑆𝐸( 𝑥1− 𝑥2)
ANOVA− Compare means from more than two
groups
− Are they so far apart that the difference cannot be attributed to sampling variability (i.e., randomness)?
− 𝐻0: 𝜇1 = 𝜇2 = ⋯ = 𝜇𝑘
Test statistic
𝐹 =𝑣𝑎𝑟𝑖𝑎𝑏𝑖𝑙𝑖𝑡𝑦 𝑏𝑒𝑡𝑤𝑒𝑒𝑛 𝑔𝑟𝑜𝑢𝑝𝑠
𝑣𝑎𝑟𝑖𝑎𝑏𝑖𝑙𝑖𝑡𝑦 𝑤𝑖𝑡ℎ𝑖𝑛 𝑔𝑟𝑜𝑢𝑝𝑠
Large test statistics lead to small p-values If p-value is small enough, 𝐻0 is rejected and we conclude that that data provides evidence of a
difference in population means
F Distribution
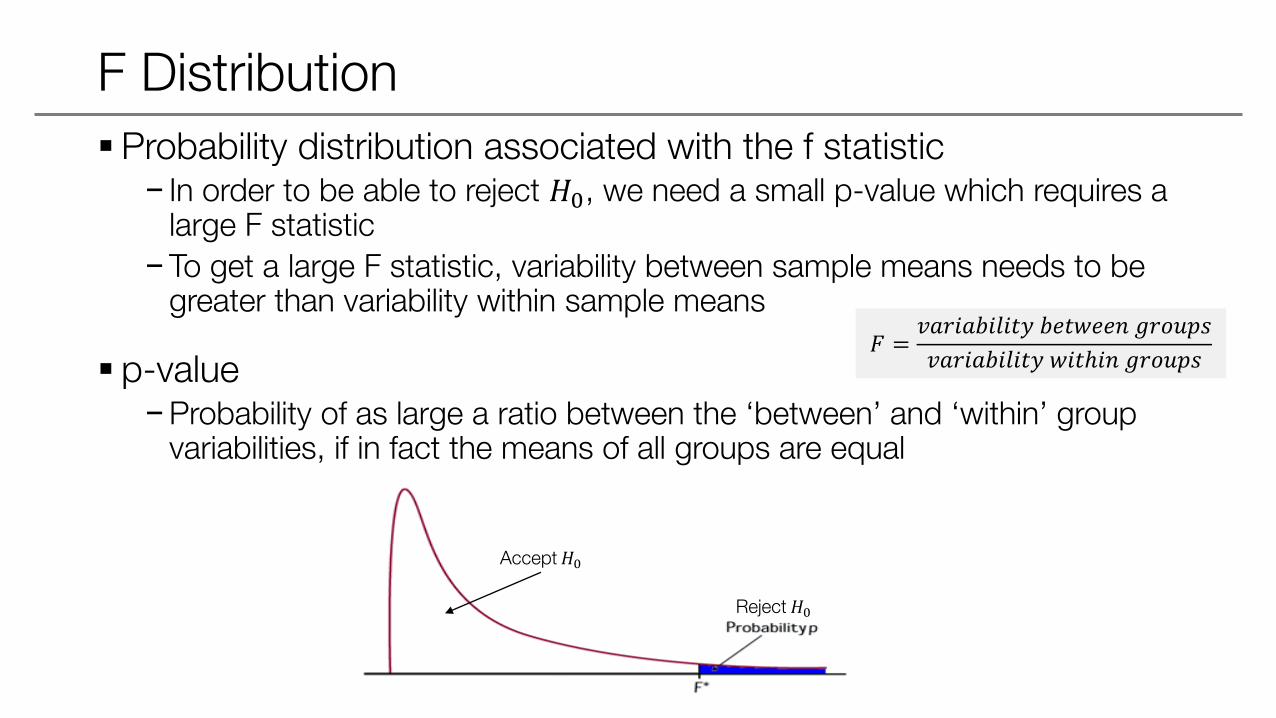
Probability distribution associated with the f statistic− In order to be able to reject 𝐻0, we need a small p-value which requires a
large F statistic
−To get a large F statistic, variability between sample means needs to be greater than variability within sample means
p-value−Probability of as large a ratio between the ‘between’ and ‘within’ group
variabilities, if in fact the means of all groups are equal
Accept𝐻0
Reject𝐻0
𝐹 =𝑣𝑎𝑟𝑖𝑎𝑏𝑖𝑙𝑖𝑡𝑦 𝑏𝑒𝑡𝑤𝑒𝑒𝑛 𝑔𝑟𝑜𝑢𝑝𝑠
𝑣𝑎𝑟𝑖𝑎𝑏𝑖𝑙𝑖𝑡𝑦 𝑤𝑖𝑡ℎ𝑖𝑛 𝑔𝑟𝑜𝑢𝑝𝑠
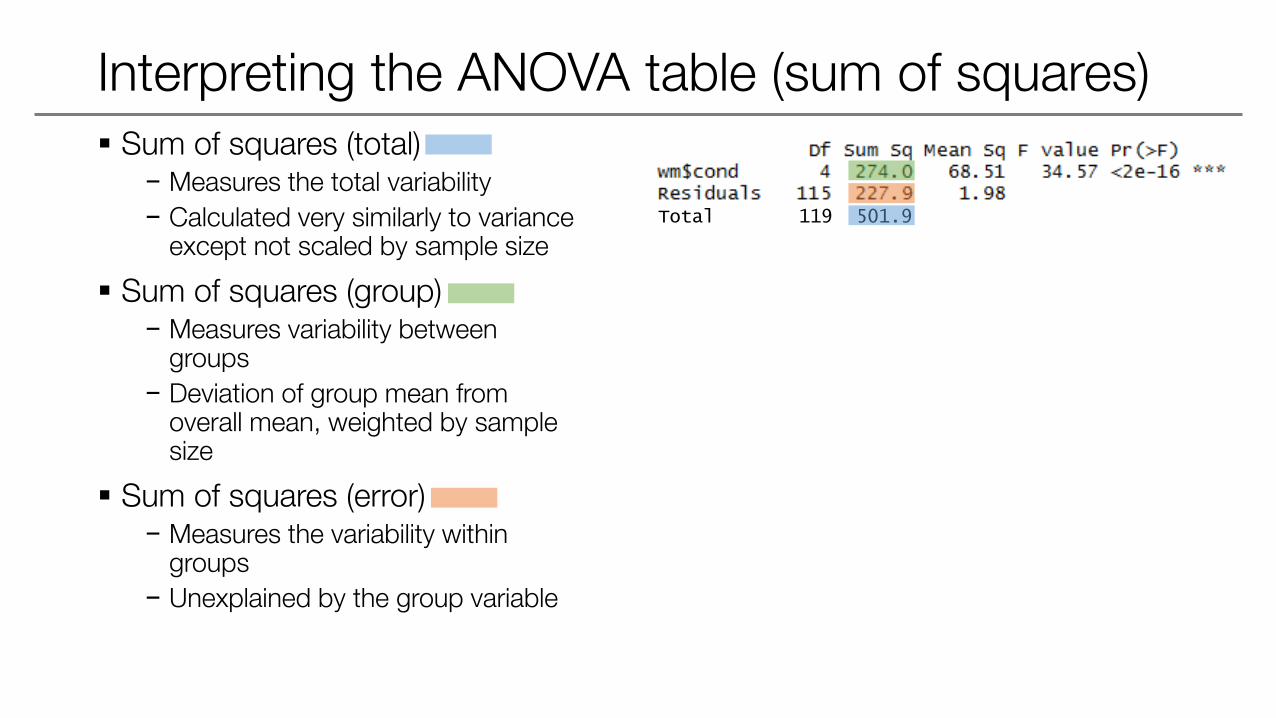
Interpreting the ANOVA table (sum of squares) Sum of squares (total)
− Measures the total variability
− Calculated very similarly to variance except not scaled by sample size
Sum of squares (group)− Measures variability between
groups
− Deviation of group mean from overall mean, weighted by sample size
Sum of squares (error)− Measures the variability within
groups
− Unexplained by the group variable
Total 119 501.9
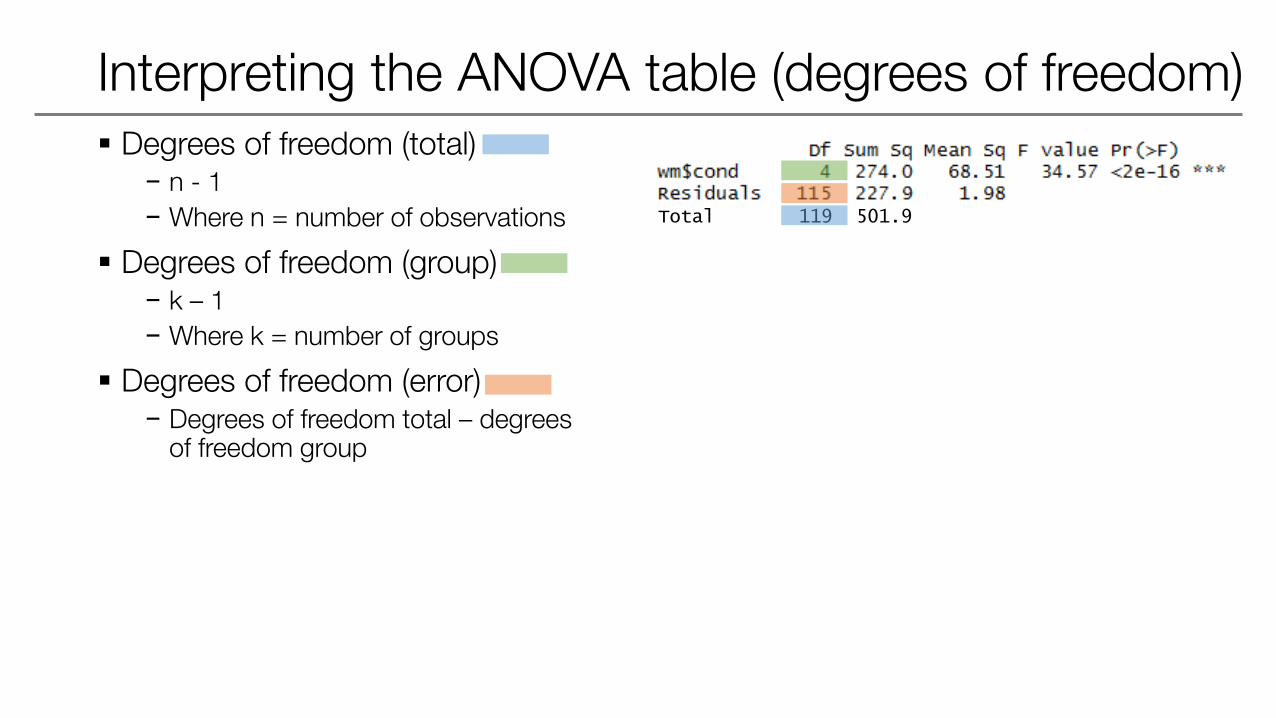
Interpreting the ANOVA table (degrees of freedom) Degrees of freedom (total)
− n - 1
− Where n = number of observations
Degrees of freedom (group) − k – 1
− Where k = number of groups
Degrees of freedom (error)− Degrees of freedom total – degrees
of freedom group
Total 119 501.9
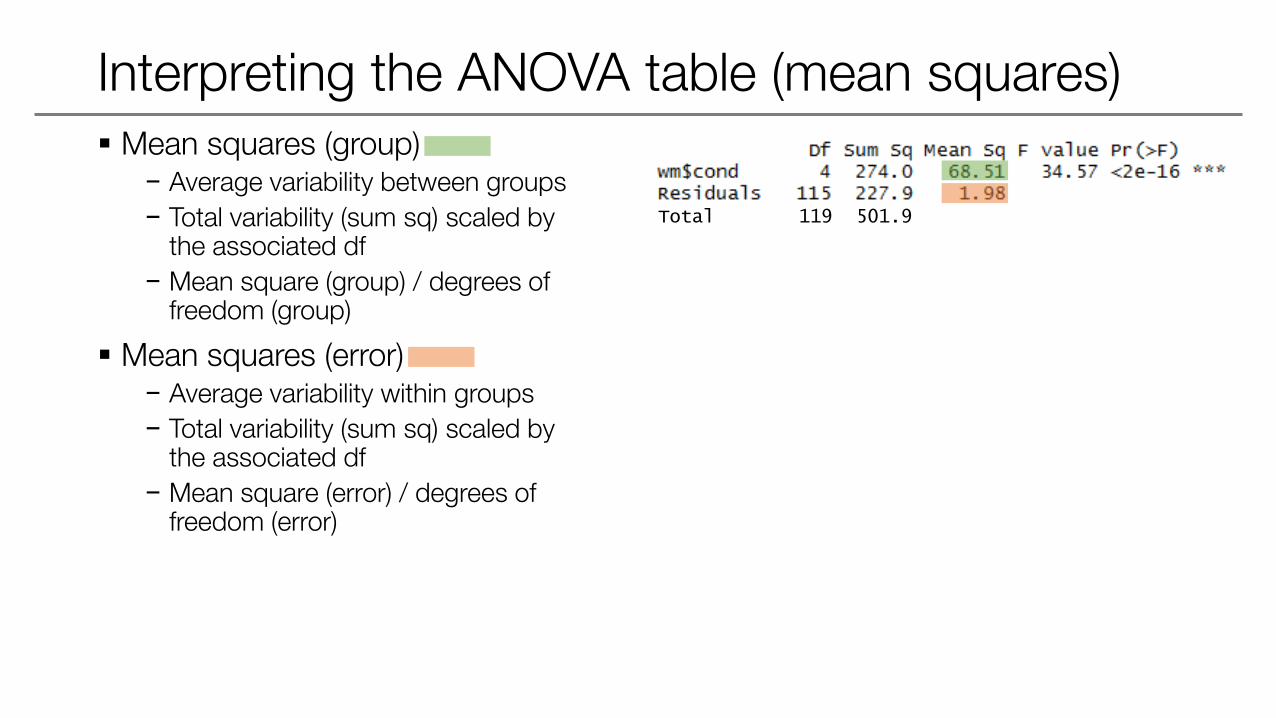
Interpreting the ANOVA table (mean squares) Mean squares (group)
− Average variability between groups
− Total variability (sum sq) scaled by the associated df
− Mean square (group) / degrees of freedom (group)
Mean squares (error)− Average variability within groups
− Total variability (sum sq) scaled by the associated df
− Mean square (error) / degrees of freedom (error)
Total 119 501.9
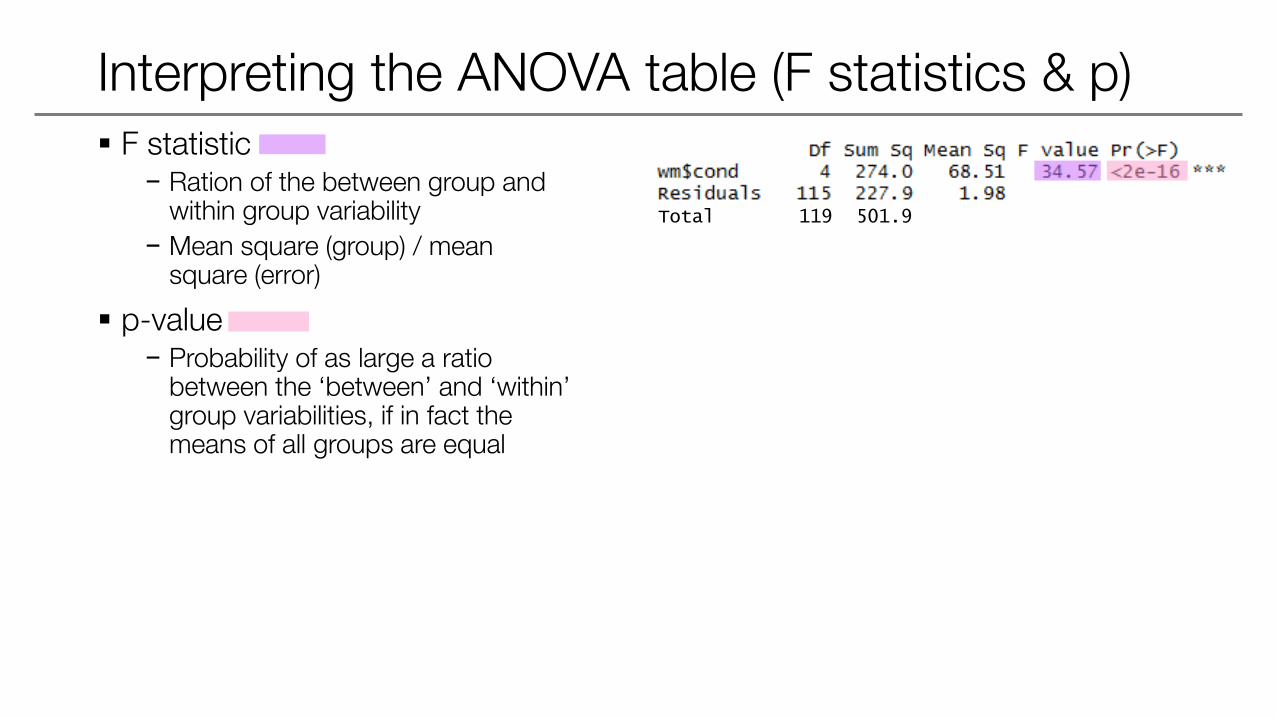
Interpreting the ANOVA table (F statistics & p) F statistic
− Ration of the between group and within group variability
− Mean square (group) / mean square (error)
p-value− Probability of as large a ratio
between the ‘between’ and ‘within’ group variabilities, if in fact the means of all groups are equal
Total 119 501.9
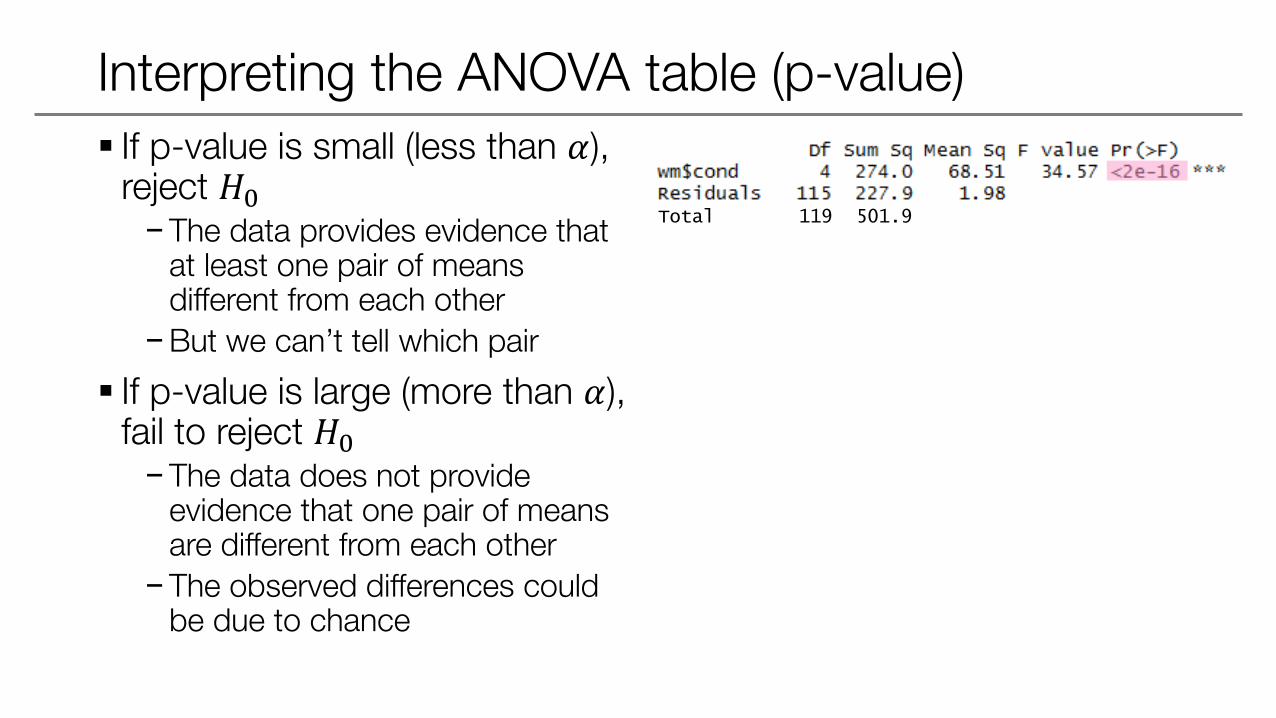
Interpreting the ANOVA table (p-value)
If p-value is small (less than 𝛼), reject 𝐻0−The data provides evidence that
at least one pair of means different from each other
−But we can’t tell which pair
If p-value is large (more than 𝛼), fail to reject 𝐻0−The data does not provide
evidence that one pair of means are different from each other
−The observed differences could be due to chance
Total 119 501.9
Conditions for ANOVA
Independence−Within groups: sampled observations must be independent
−Between groups: groups must be independent of each other
Approximate normality−Within each group, distributions should be nearly normal
Equal variance (homoscedasticity) −Groups should have roughly equal variability
So how do we find out which means differ?
We conduct independent t tests for differences between each possible pair of groups (multiple comparisons)−However, with multiple t test, there could be an inflated Type I error rate
Thus, we use a modified significance level, which ranges from the most liberal to the most conservative−Most liberal: no correction
−Most conservative: Bonferronni correction
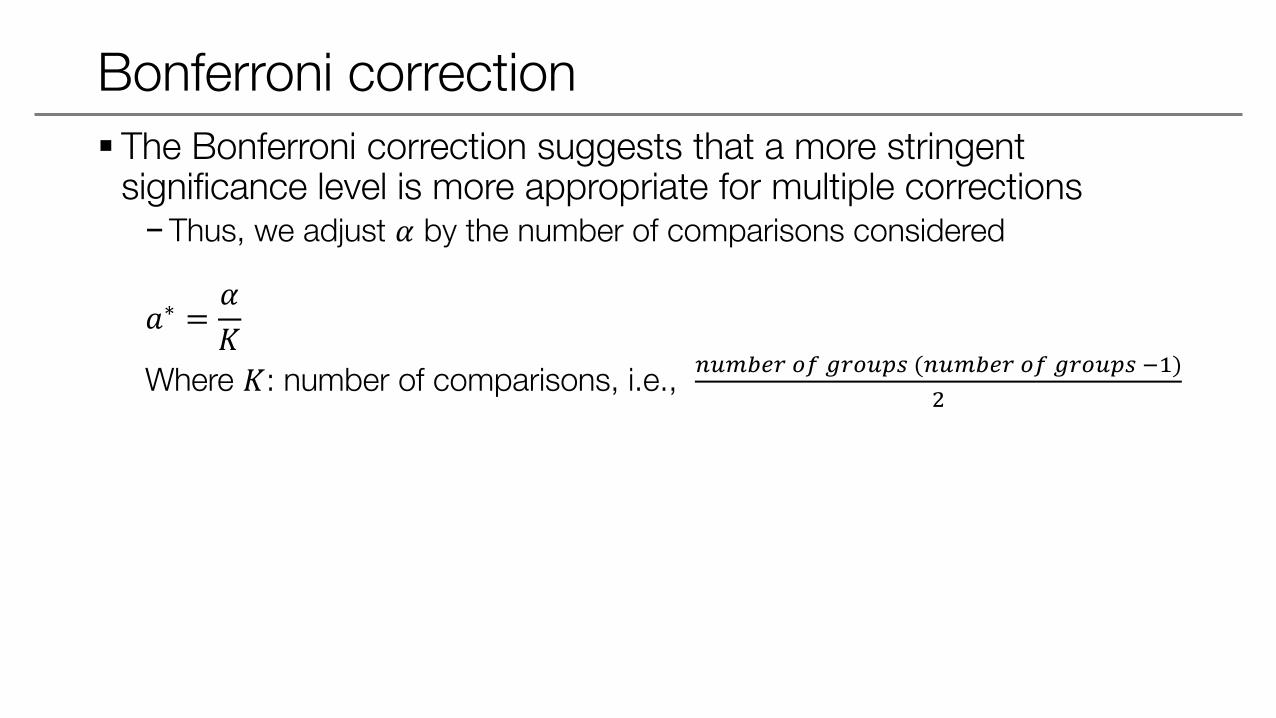
Bonferroni correction
The Bonferroni correction suggests that a more stringent significance level is more appropriate for multiple corrections−Thus, we adjust 𝛼 by the number of comparisons considered
𝑎∗ =𝛼
𝐾
Where 𝐾: number of comparisons, i.e., 𝑛𝑢𝑚𝑏𝑒𝑟 𝑜𝑓 𝑔𝑟𝑜𝑢𝑝𝑠 (𝑛𝑢𝑚𝑏𝑒𝑟 𝑜𝑓 𝑔𝑟𝑜𝑢𝑝𝑠 −1)
2
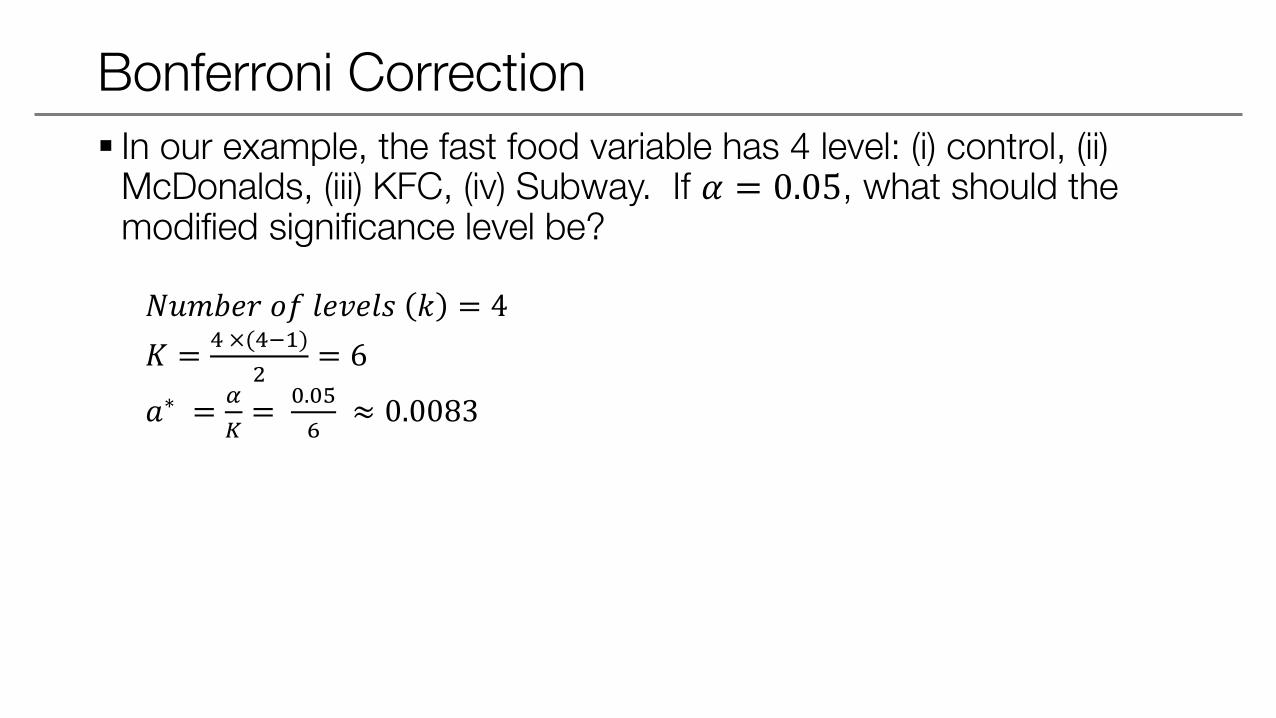
Bonferroni Correction
In our example, the fast food variable has 4 level: (i) control, (ii) McDonalds, (iii) KFC, (iv) Subway. If 𝛼 = 0.05, what should the modified significance level be?
𝑁𝑢𝑚𝑏𝑒𝑟 𝑜𝑓 𝑙𝑒𝑣𝑒𝑙𝑠 𝑘 = 4
𝐾 =4 ×(4−1)
2= 6
𝑎∗ =𝛼
𝐾=
0.05
6≈ 0.0083
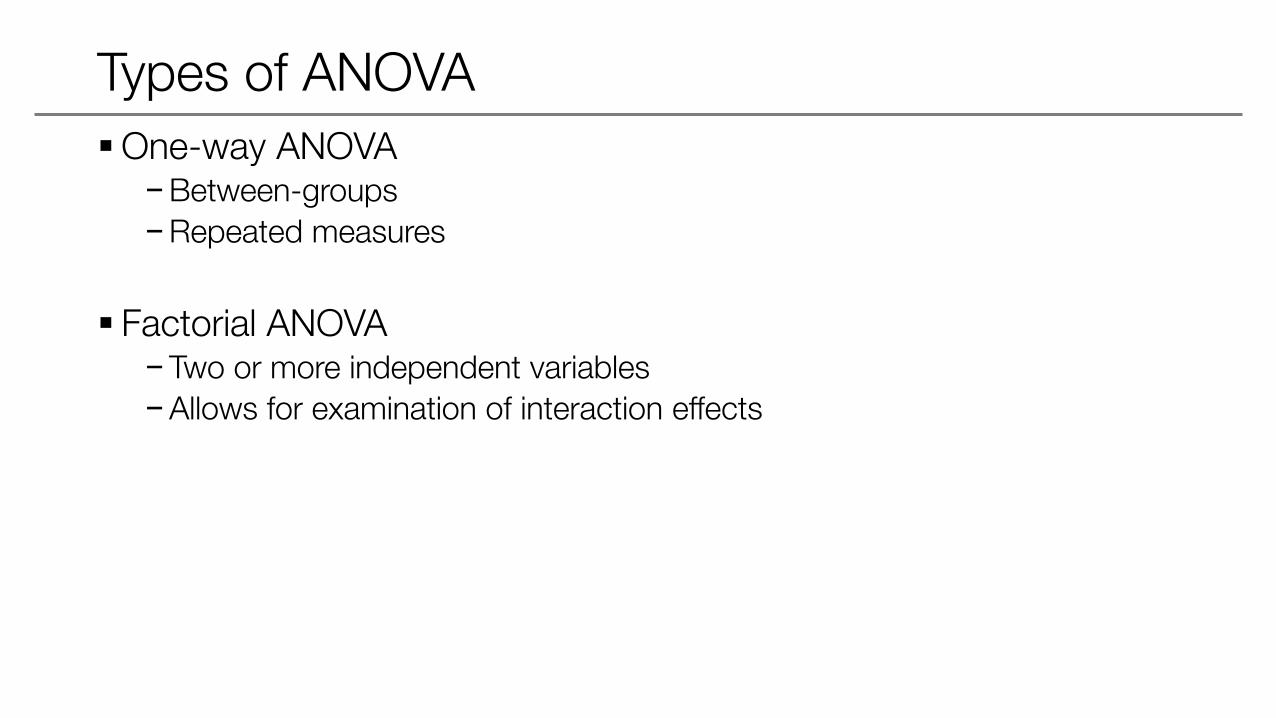
Types of ANOVA
One-way ANOVA−Between-groups
−Repeated measures
Factorial ANOVA−Two or more independent variables
−Allows for examination of interaction effects
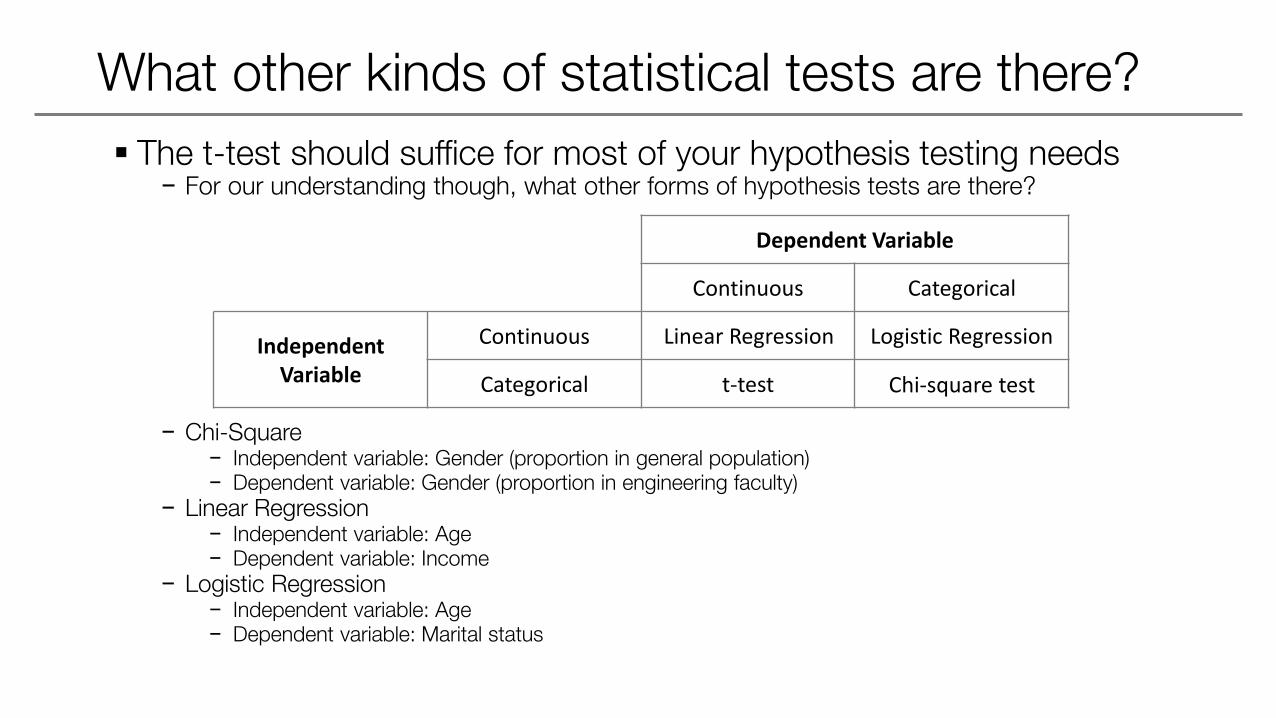
The t-test should suffice for most of your hypothesis testing needs− For our understanding though, what other forms of hypothesis tests are there?
− Chi-Square− Independent variable: Gender (proportion in general population)− Dependent variable: Gender (proportion in engineering faculty)
− Linear Regression− Independent variable: Age− Dependent variable: Income
− Logistic Regression− Independent variable: Age− Dependent variable: Marital status
What other kinds of statistical tests are there?
Dependent Variable
Continuous Categorical
Independent Variable
Continuous
Categorical t-test
Linear Regression Logistic Regression
Chi-square test
Time for practice
In this lab session we will cover:−ANOVA
−Bonferroni Correction
GitHub repository: https://github.com/eugeneyan/Statistical-Inference
Thank you for your attention!Eugene Yan


