36
STATUS OF AGRICULTURE IN ODISHA 2014-15 DIRECTORATE OF AGRICULTURE & FOOD PRODUCTION ODISHA, BHUBANESWAR Government of Odisha As on 31.12.2014
STATUS OF AGRICULTUREIN ODISHA2014-15
DIRECTORATE OF AGRICULTURE & FOOD PRODUCTIONODISHA, BHUBANESWAR
Government of Odisha
As on 31.12.2014

34
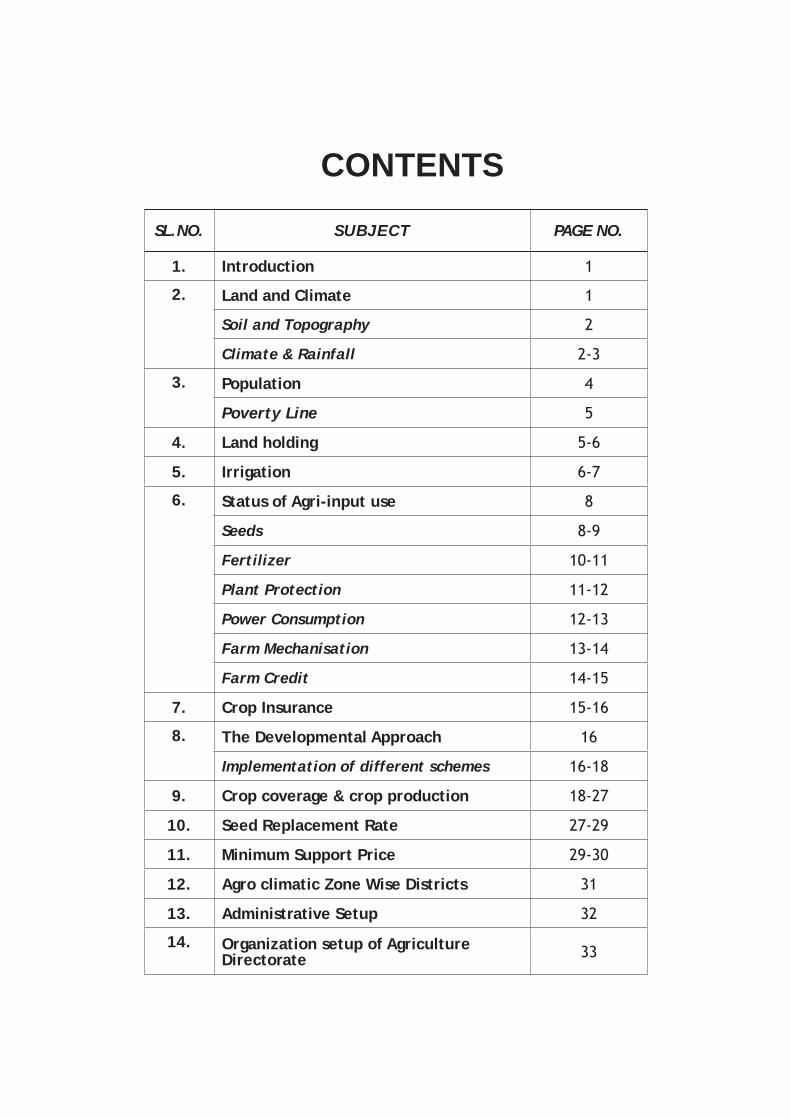
SL.NO. SUBJECT PAGE NO.
1. Introduction 1
2. Land and Climate 1
Soil and Topography 2
Climate & Rainfall 2-3
3. Population 4
Poverty Line 5
4. Land holding 5-6
5. Irrigation 6-7
6. Status of Agri-input use 8
Seeds 8-9
Fertilizer 10-11
Plant Protection 11-12
Power Consumption 12-13
Farm Mechanisation 13-14
Farm Credit 14-15
7. Crop Insurance 15-16
8. The Developmental Approach 16
Implementation of different schemes 16-18
9. Crop coverage & crop production 18-27
10. Seed Replacement Rate 27-29
11. Minimum Support Price 29-30
12. Agro climatic Zone Wise Districts 31
13. Administrative Setup 32
14. Organization setup of Agriculture Directorate 33
CONTENTS
1
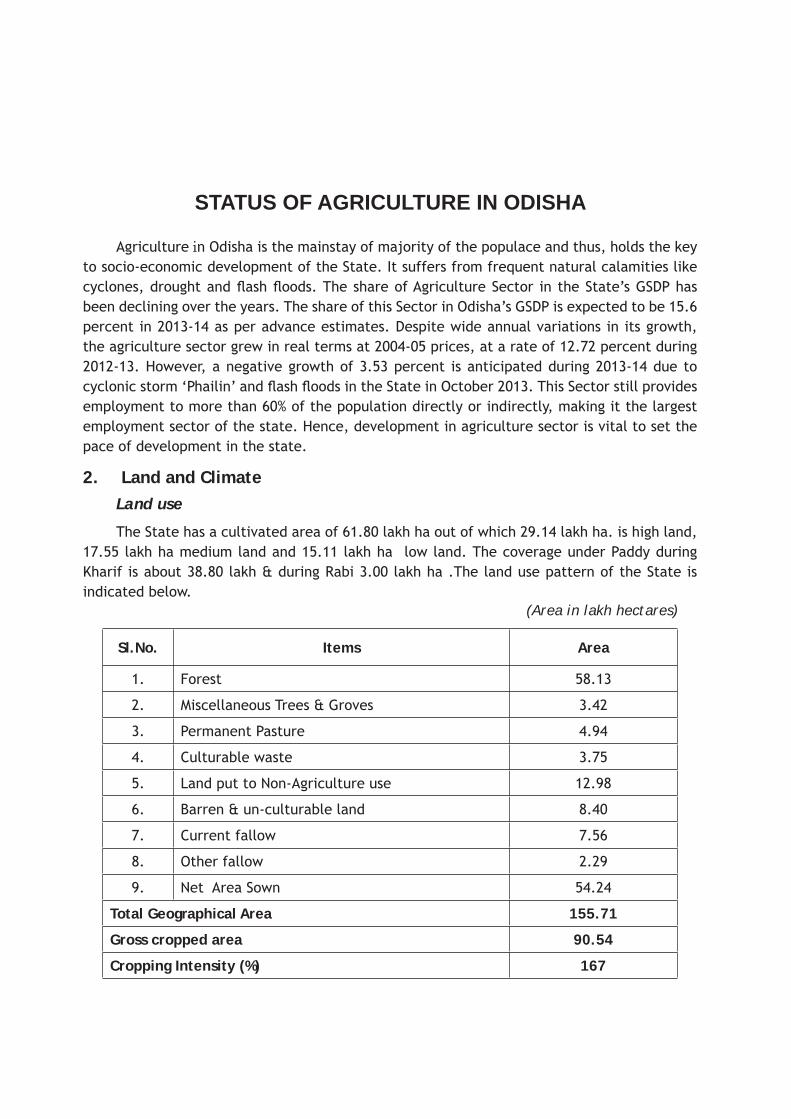
STATUS OF AGRICULTURE IN ODISHA
Agriculture in Odisha is the mainstay of majority of the populace and thus, holds the key to socio-economic development of the State. It suffers from frequent natural calamities like cyclones, drought and fl ash fl oods. The share of Agriculture Sector in the State’s GSDP has been declining over the years. The share of this Sector in Odisha’s GSDP is expected to be 15.6 percent in 2013-14 as per advance estimates. Despite wide annual variations in its growth, the agriculture sector grew in real terms at 2004-05 prices, at a rate of 12.72 percent during 2012-13. However, a negative growth of 3.53 percent is anticipated during 2013-14 due to cyclonic storm ‘Phailin’ and fl ash fl oods in the State in October 2013. This Sector still provides employment to more than 60% of the population directly or indirectly, making it the largest employment sector of the state. Hence, development in agriculture sector is vital to set the pace of development in the state.
2. Land and ClimateLand use
The State has a cultivated area of 61.80 lakh ha out of which 29.14 lakh ha. is high land, 17.55 lakh ha medium land and 15.11 lakh ha low land. The coverage under Paddy during Kharif is about 38.80 lakh & during Rabi 3.00 lakh ha .The land use pattern of the State is indicated below. (Area in lakh hectares)
Sl.No. Items Area
1. Forest 58.13
2. Miscellaneous Trees & Groves 3.42
3. Permanent Pasture 4.94
4. Culturable waste 3.75
5. Land put to Non-Agriculture use 12.98
6. Barren & un-culturable land 8.40
7. Current fallow 7.56
8. Other fallow 2.29
9. Net Area Sown 54.24
Total Geographical Area 155.71
Gross cropped area 90.54
Cropping Intensity (%) 167
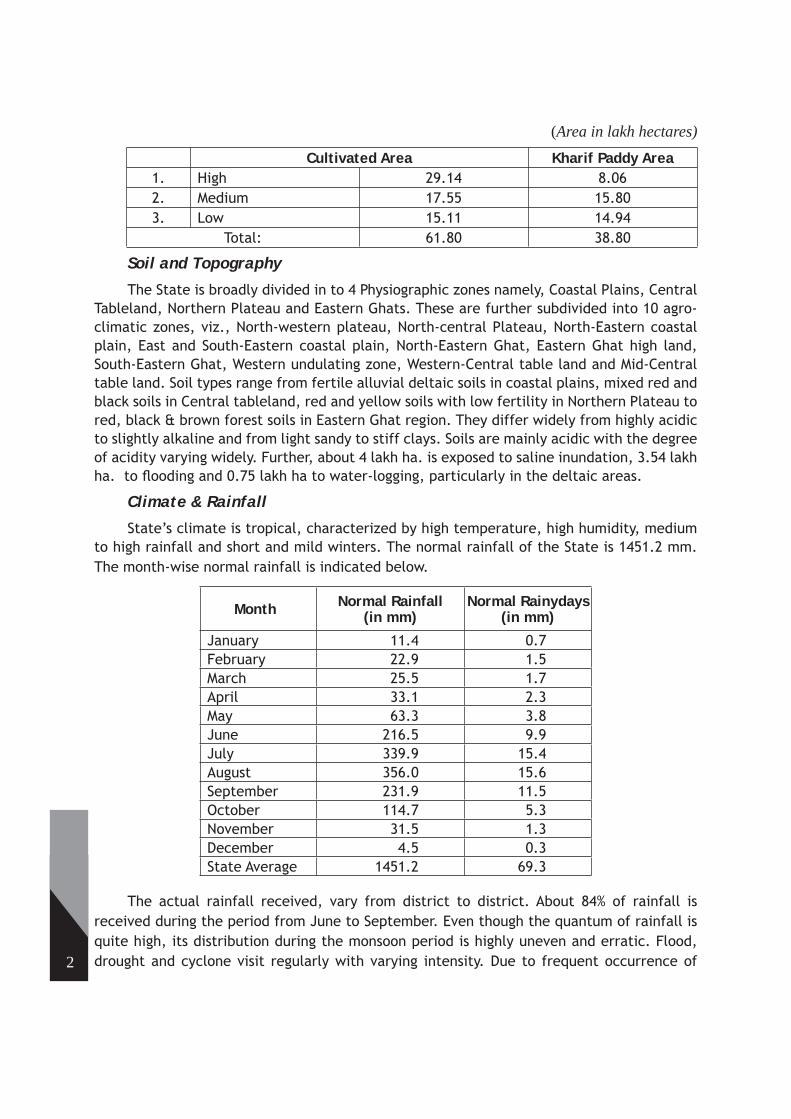
2
(Area in lakh hectares)Cultivated Area Kharif Paddy Area
1. High 29.14 8.062. Medium 17.55 15.803. Low 15.11 14.94
Total: 61.80 38.80
Soil and Topography
The State is broadly divided in to 4 Physiographic zones namely, Coastal Plains, Central Tableland, Northern Plateau and Eastern Ghats. These are further subdivided into 10 agro-climatic zones, viz., North-western plateau, North-central Plateau, North-Eastern coastal plain, East and South-Eastern coastal plain, North-Eastern Ghat, Eastern Ghat high land, South-Eastern Ghat, Western undulating zone, Western-Central table land and Mid-Central table land. Soil types range from fertile alluvial deltaic soils in coastal plains, mixed red and black soils in Central tableland, red and yellow soils with low fertility in Northern Plateau to red, black & brown forest soils in Eastern Ghat region. They differ widely from highly acidic to slightly alkaline and from light sandy to stiff clays. Soils are mainly acidic with the degree of acidity varying widely. Further, about 4 lakh ha. is exposed to saline inundation, 3.54 lakh ha. to fl ooding and 0.75 lakh ha to water-logging, particularly in the deltaic areas.
Climate & Rainfall
State’s climate is tropical, characterized by high temperature, high humidity, medium to high rainfall and short and mild winters. The normal rainfall of the State is 1451.2 mm. The month-wise normal rainfall is indicated below.
Month Normal Rainfall (in mm)
Normal Rainydays (in mm)
January 11.4 0.7February 22.9 1.5March 25.5 1.7April 33.1 2.3May 63.3 3.8June 216.5 9.9July 339.9 15.4August 356.0 15.6September 231.9 11.5October 114.7 5.3November 31.5 1.3December 4.5 0.3State Average 1451.2 69.3
The actual rainfall received, vary from district to district. About 84% of rainfall is received during the period from June to September. Even though the quantum of rainfall is quite high, its distribution during the monsoon period is highly uneven and erratic. Flood, drought and cyclone visit regularly with varying intensity. Due to frequent occurrence of

3
these natural calamities there is always reduction in the yield of Kharif rice, the major crop of the State. Similarly, in drought years, there is considerable loss in production of Pulses and Oilseeds both during Kharif and Rabi. The following table indicates the frequency of natural calamities over the years.
Sl.No. Year
Normal Rainfall (in mm)
Actual rainfall (in
mm)
Kharif Rice Production
(In lakh MTs.)Remarks
1. 1961 1502.5 1262.8 36.992. 1962 1502.5 1169.9 36.323. 1963 1502.5 1467.0 42.474. 1964 1502.5 1414.1 43.595. 1965 1502.5 997.1 31.89 Severe drought6. 1966 1502.5 1134.9 35.37 Drought7. 1967 1502.5 1326.7 34.43 Cyclone & Flood8. 1968 1502.5 1296.1 38.48 Cyclone & Flood9. 1969 1502.5 1802.1 38.39 Flood10 1970 1502.5 1660.2 39.13 Flood11. 1971 1502.5 1791.5 33.76 Flood, Severe Cyclone12. 1972 1502.5 1177.1 37.35 Drought, fl ood13. 1973 1502.5 1360.1 41.91 Flood14. 1974 1502.5 951.2 29.67 Flood, severe drought15. 1975 1502.5 1325.6 42.74 Flood16. 1976 1502.5 1012.5 29.58 Severe drought17. 1977 1502.5 1326.9 40.50 Flood18. 1978 1502.5 1261.3 41.89 Tornados, hail storm19. 1979 1502.5 950.7 27.34 Severe drought20. 1980 1502.5 1321.7 40.31 Flood, drought21. 1981 1502.5 1187.4 36.63 Flood, drought, Tornado22. 1982 1502.5 1179.9 27.07 High fl ood, drought, cyclone23. 1983 1502.5 1374.1 47.6324. 1984 1502.5 1302.8 38.50 Drought25. 1985 1502.5 1606.8 48.80 Flood26. 1986 1502.5 1566.1 44.5627. 1987 1502.5 1040.8 31.03 Severe drought28. 1988 1502.5 1270.5 48.9629. 1989 1502.5 1283.9 58.4030. 1990 1502.5 1865.8 48.42 Flood31. 1991 1502.5 1465.7 60.3032. 1992 1502.5 1344.1 49.76 Flood, drought33. 1993 1502.5 1421.6 61.0234. 1994 1502.5 1700.2 58.3135. 1995 1502.5 1588.0 56.48

4
Sl.No. Year
Normal Rainfall (in mm)
Actual rainfall (in
mm)
Kharif Rice Production
(In lakh MTs.)Remarks
36. 1996 1502.5 990.1 38.27 Severe drought37. 1997 1502.5 1493.0 57.5138. 1998 1502.5 1277.5 48.85 Severe drought39. 1999 1502.5 1435.7 42.75 Severe Cyclone40. 2000 1502.5 1035.1 41.72 Drought & Flood41. 2001 1482.2 1616.2 65.71 Flood42. 2002 1482.2 1007.8 28.26 Severe drought43. 2003 1482.2 1663.5 61.99 Flood44. 2004 1482.2 1273.6 58.84 Moisture stress45. 2005 1451.2 1519.5 62.49 Moisture stress46. 2006 1451.2 1682.8 61.96 Moisture stress/Flood47. 2007 1451.2 1591.5 68.26 Flood48. 2008 1451.2 1523.6 60.92 Flood , Moisture Stress
49. 2009 1451.2 1362.6 62.93 Flood/ Moisture stress/ Pest attack.
50. 2010 1451.2 1293.0 60.51 Drought/ Un-seasonal rain51. 2011 1451.2 1327.8 51.27 Drought & Flood52. 2012 1451.2 1391.3 86.29 Drought in Balasore, Bhad-
rak, Mayurbhanj & Nowapara districts.
53. 2013 1451.2 1627.0 65.85 Flood & Cyclone in 18 dis-tricts due to Phailin.
53 2014 1451.2 1457.4 85.78 (Prov.) Cyclone in 8 districts due to Hud Hud.
3. Population:The population of Odisha has started registering a declining growth rate, as can be seen
from the fi gures given below. (Figures in crores)
CENSUS1971 1981 1991 2001 2011
Population 2.19 2.64 3.17 3.68 4.20Rural 2.01 2.33 2.75 3.13 3.50Urban 0.18 0.31 0.42 0.55 0.70Agril. Workers 0.53 0.64 0.76 0.55 0.57Cultivators 0.34 0.40 0.46 0.34 0.33Agril. Labourers 0.19 0.24 0.30 0.21 0.24% of Rural population 91.6 88.3 86.6 85.0 83.3Decennial population growth rate. 25.1 20.2 20.1 16.25 14.05%

5
Poverty Line
The fi gures relating to the people below the poverty line in Odisha is indicated below.
% of people below poverty line
Expert committee methodology
YearOdisha
IndiaRural Urban Total
1973-74 67.28 55.62 66.18 54.88
1977-78 72.38 50.92 70.07 51.32
1983-84 67.53 49.15 65.29 44.48
1987-88 57.64 41.53 55.58 38.36
1993-94 49.72 41.64 48.56 35.97
1999-00 48.01 42.83 47.15 26.10
2004-05 46.80 44.30 46.40 27.50
Tendulkar committee Methodology
YearOdisha
IndiaRural Urban Total
1993-94 63.00 34.50 59.10 45.30
2004-05 60.80 37.60 57.20 37.20
2009-10 39.20 25.90 37.00 29.80
2011-12 35.69 17.29 32.59 21.92
4. Land holding
The per capita availability of cultivated land was 0.39 hectares in 1950-51, which has declined to 0.15 hectares in 2010-11. During 2010-11 there were 46.67 lakh operational holdings in the state out of which marginal and small holdings account for 91.8%, medium 8.0% and large, less than 1%. The total number of operational holdings registered an increase of 7.14% over 2005-06. The average size of holding during 1970-71 was 1.89 ha which has been decreased to 1.04 ha during 2010-11. The average size of holding in marginal, small, semi-medium, medium and large categories in 2010-11 was 0.57ha, 1.63 ha, 2.95 ha, 5.99 ha and 23.72 ha respectively. The total No. of SC & ST holdings were 7.02 lakh and 14.26 lakh respectively. The average area of holdings operated by SC & ST during 2010-11 were 0.81 ha and 1.13 ha respectively. 96.71% of the total individual holdings correspond to male category, where as female category of holdings accounts for 3.29%. The predominance of small size of operational holdings along with wide spread-poverty poses a big problem in agricultural growth of the State. The details are given below.
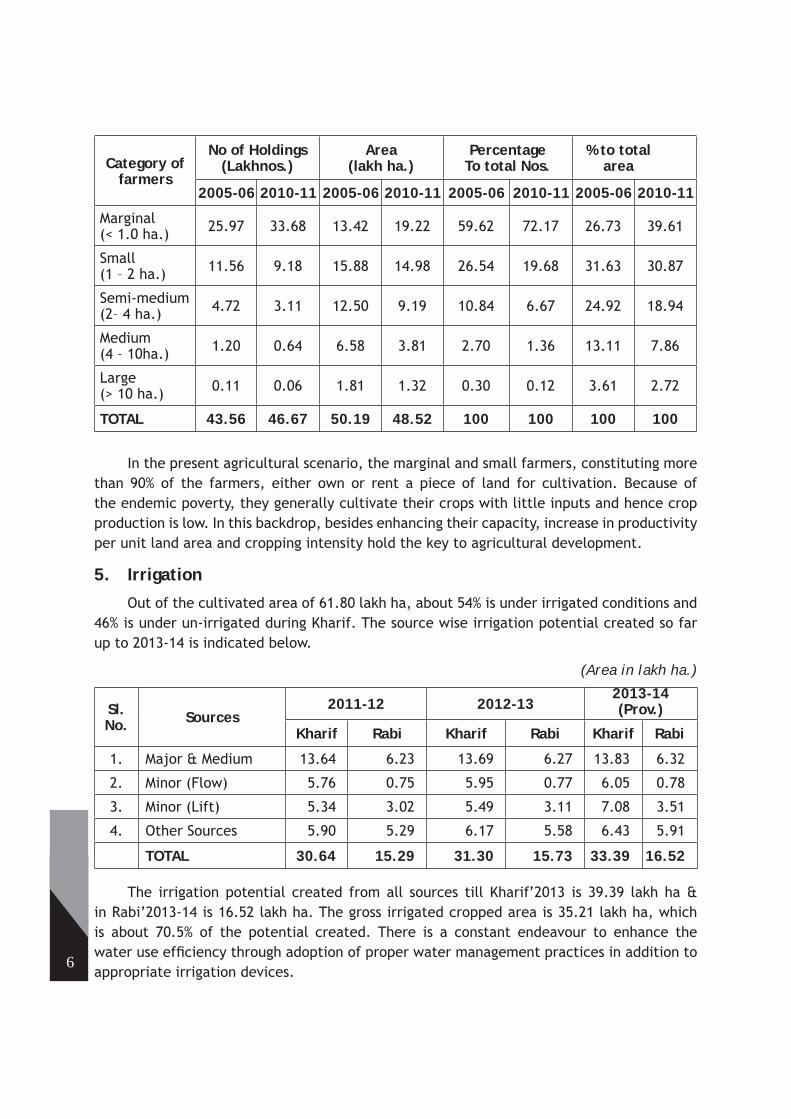
6
Category of farmers
No of Holdings(Lakhnos.)
Area (lakh ha.)
PercentageTo total Nos.
% to total area
2005-06 2010-11 2005-06 2010-11 2005-06 2010-11 2005-06 2010-11
Marginal (< 1.0 ha.) 25.97 33.68 13.42 19.22 59.62 72.17 26.73 39.61
Small (1 – 2 ha.) 11.56 9.18 15.88 14.98 26.54 19.68 31.63 30.87
Semi-medium (2– 4 ha.) 4.72 3.11 12.50 9.19 10.84 6.67 24.92 18.94
Medium (4 – 10ha.) 1.20 0.64 6.58 3.81 2.70 1.36 13.11 7.86
Large (> 10 ha.) 0.11 0.06 1.81 1.32 0.30 0.12 3.61 2.72
TOTAL 43.56 46.67 50.19 48.52 100 100 100 100
In the present agricultural scenario, the marginal and small farmers, constituting more than 90% of the farmers, either own or rent a piece of land for cultivation. Because of the endemic poverty, they generally cultivate their crops with little inputs and hence crop production is low. In this backdrop, besides enhancing their capacity, increase in productivity per unit land area and cropping intensity hold the key to agricultural development.
5. Irrigation
Out of the cultivated area of 61.80 lakh ha, about 54% is under irrigated conditions and 46% is under un-irrigated during Kharif. The source wise irrigation potential created so far up to 2013-14 is indicated below.
(Area in lakh ha.)
Sl.No. Sources
2011-12 2012-132013-14 (Prov.)
Kharif Rabi Kharif Rabi Kharif Rabi
1. Major & Medium 13.64 6.23 13.69 6.27 13.83 6.32
2. Minor (Flow) 5.76 0.75 5.95 0.77 6.05 0.78
3. Minor (Lift) 5.34 3.02 5.49 3.11 7.08 3.51
4. Other Sources 5.90 5.29 6.17 5.58 6.43 5.91
TOTAL 30.64 15.29 31.30 15.73 33.39 16.52
The irrigation potential created from all sources till Kharif’2013 is 39.39 lakh ha & in Rabi’2013-14 is 16.52 lakh ha. The gross irrigated cropped area is 35.21 lakh ha, which is about 70.5% of the potential created. There is a constant endeavour to enhance the water use effi ciency through adoption of proper water management practices in addition to appropriate irrigation devices.
7
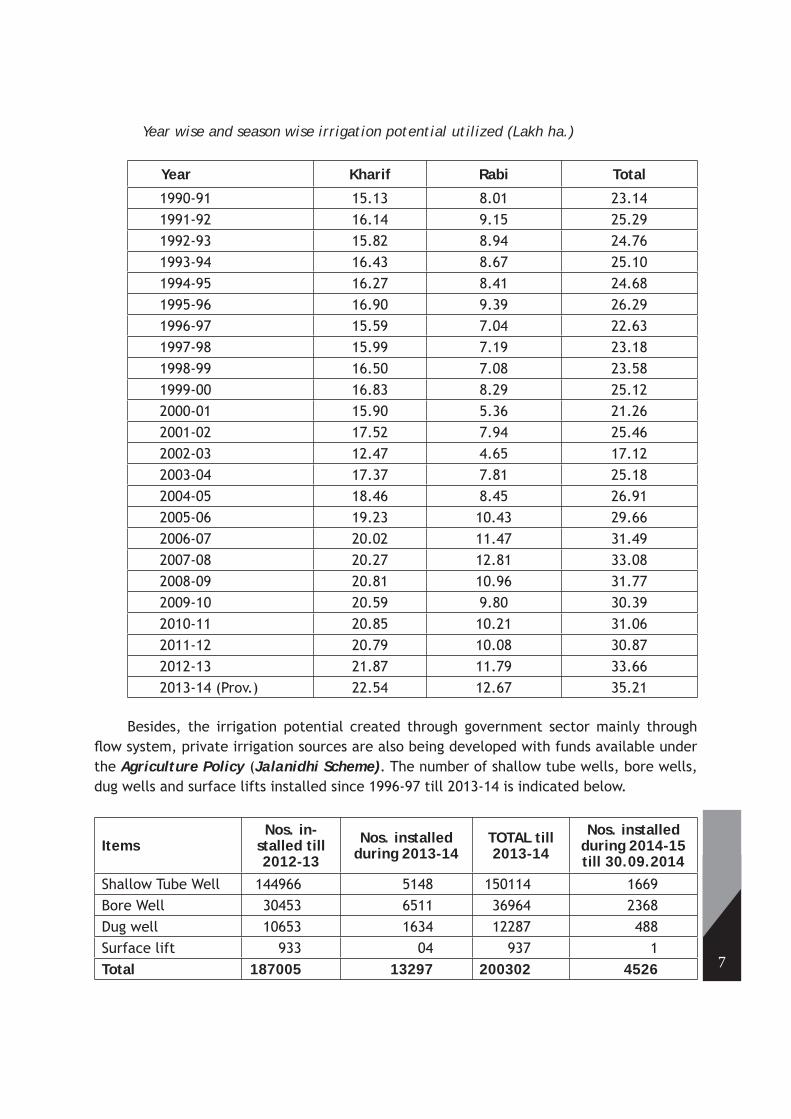
Year wise and season wise irrigation potential utilized (Lakh ha.)
Year Kharif Rabi Total
1990-91 15.13 8.01 23.141991-92 16.14 9.15 25.291992-93 15.82 8.94 24.761993-94 16.43 8.67 25.101994-95 16.27 8.41 24.681995-96 16.90 9.39 26.291996-97 15.59 7.04 22.631997-98 15.99 7.19 23.181998-99 16.50 7.08 23.581999-00 16.83 8.29 25.122000-01 15.90 5.36 21.262001-02 17.52 7.94 25.462002-03 12.47 4.65 17.122003-04 17.37 7.81 25.182004-05 18.46 8.45 26.912005-06 19.23 10.43 29.662006-07 20.02 11.47 31.492007-08 20.27 12.81 33.082008-09 20.81 10.96 31.772009-10 20.59 9.80 30.392010-11 20.85 10.21 31.062011-12 20.79 10.08 30.872012-13 21.87 11.79 33.662013-14 (Prov.) 22.54 12.67 35.21
Besides, the irrigation potential created through government sector mainly through fl ow system, private irrigation sources are also being developed with funds available under the Agriculture Policy (Jalanidhi Scheme). The number of shallow tube wells, bore wells, dug wells and surface lifts installed since 1996-97 till 2013-14 is indicated below.
ItemsNos. in-
stalled till 2012-13
Nos. installed during 2013-14
TOTAL till 2013-14
Nos. installed during 2014-15 till 30.09.2014
Shallow Tube Well 144966 5148 150114 1669Bore Well 30453 6511 36964 2368Dug well 10653 1634 12287 488Surface lift 933 04 937 1Total 187005 13297 200302 4526
8
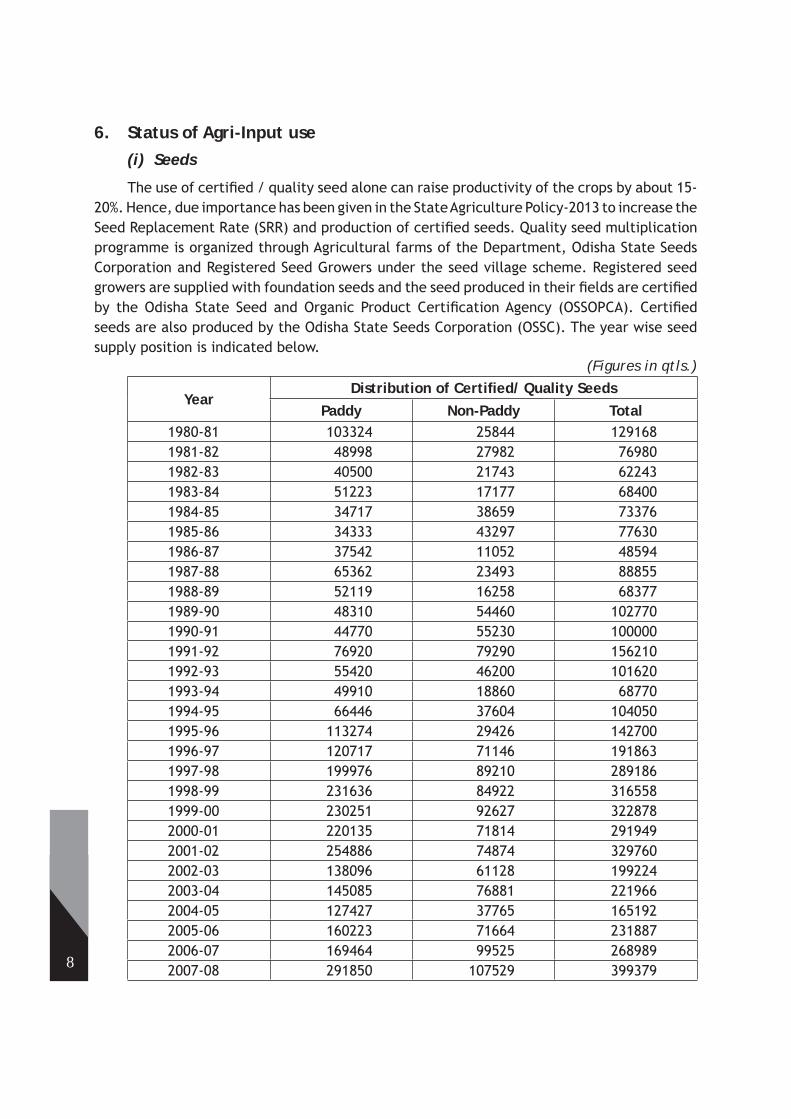
6. Status of Agri-Input use(i) Seeds
The use of certifi ed / quality seed alone can raise productivity of the crops by about 15-20%. Hence, due importance has been given in the State Agriculture Policy-2013 to increase the Seed Replacement Rate (SRR) and production of certifi ed seeds. Quality seed multiplication programme is organized through Agricultural farms of the Department, Odisha State Seeds Corporation and Registered Seed Growers under the seed village scheme. Registered seed growers are supplied with foundation seeds and the seed produced in their fi elds are certifi ed by the Odisha State Seed and Organic Product Certifi cation Agency (OSSOPCA). Certifi ed seeds are also produced by the Odisha State Seeds Corporation (OSSC). The year wise seed supply position is indicated below. (Figures in qtls.)
YearDistribution of Certifi ed/ Quality Seeds
Paddy Non-Paddy Total1980-81 103324 25844 1291681981-82 48998 27982 769801982-83 40500 21743 622431983-84 51223 17177 684001984-85 34717 38659 733761985-86 34333 43297 776301986-87 37542 11052 485941987-88 65362 23493 888551988-89 52119 16258 683771989-90 48310 54460 1027701990-91 44770 55230 1000001991-92 76920 79290 1562101992-93 55420 46200 1016201993-94 49910 18860 687701994-95 66446 37604 1040501995-96 113274 29426 1427001996-97 120717 71146 1918631997-98 199976 89210 2891861998-99 231636 84922 3165581999-00 230251 92627 3228782000-01 220135 71814 2919492001-02 254886 74874 3297602002-03 138096 61128 1992242003-04 145085 76881 2219662004-05 127427 37765 1651922005-06 160223 71664 2318872006-07 169464 99525 2689892007-08 291850 107529 399379
9
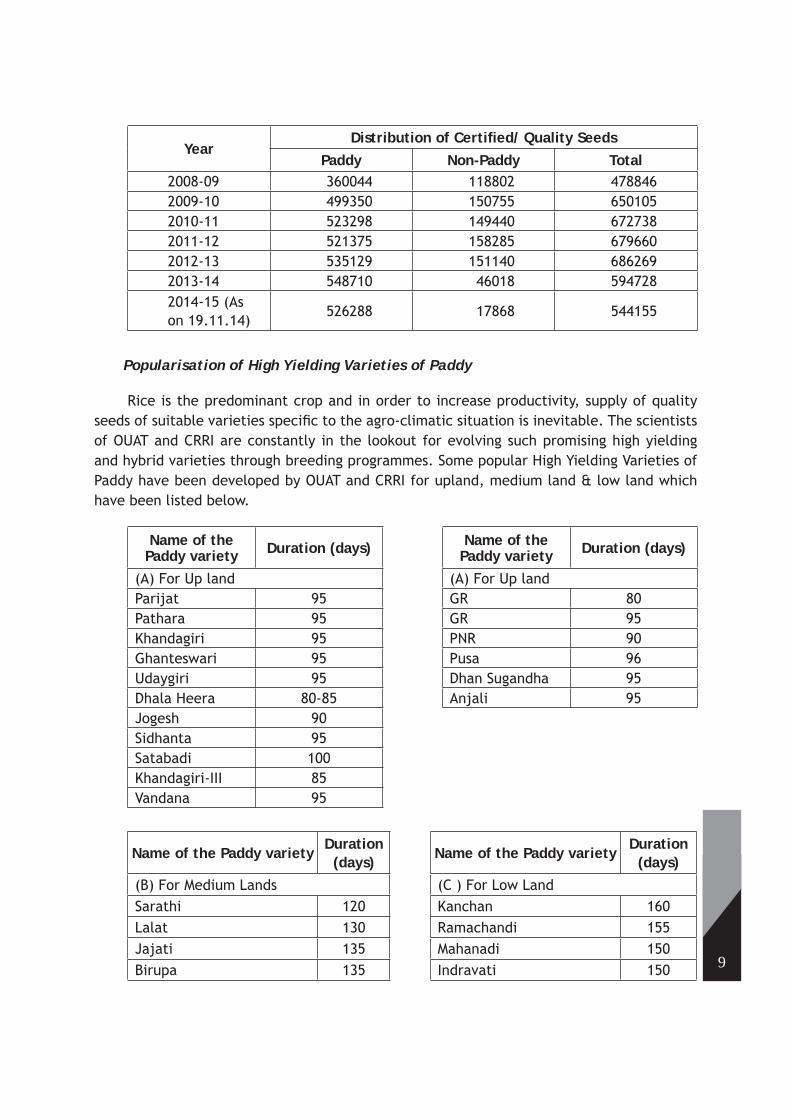
YearDistribution of Certifi ed/ Quality Seeds
Paddy Non-Paddy Total2008-09 360044 118802 4788462009-10 499350 150755 6501052010-11 523298 149440 6727382011-12 521375 158285 6796602012-13 535129 151140 6862692013-14 548710 46018 5947282014-15 (As on 19.11.14)
526288 17868 544155
Popularisation of High Yielding Varieties of Paddy
Rice is the predominant crop and in order to increase productivity, supply of quality seeds of suitable varieties specifi c to the agro-climatic situation is inevitable. The scientists of OUAT and CRRI are constantly in the lookout for evolving such promising high yielding and hybrid varieties through breeding programmes. Some popular High Yielding Varieties of Paddy have been developed by OUAT and CRRI for upland, medium land & low land which have been listed below.
Name of the Paddy variety Duration (days) Name of the
Paddy variety Duration (days)
(A) For Up land (A) For Up landParijat 95 GR 80Pathara 95 GR 95Khandagiri 95 PNR 90Ghanteswari 95 Pusa 96Udaygiri 95 Dhan Sugandha 95Dhala Heera 80-85 Anjali 95Jogesh 90Sidhanta 95Satabadi 100Khandagiri-III 85Vandana 95
Name of the Paddy varietyDuration
(days)Name of the Paddy variety
Duration (days)
(B) For Medium Lands (C ) For Low LandSarathi 120 Kanchan 160Lalat 130 Ramachandi 155Jajati 135 Mahanadi 150Birupa 135 Indravati 150

10
Name of the Paddy varietyDuration
(days)Name of the Paddy variety
Duration (days)
Bhanja 140 Jagabandhu 150Samanta 140 CR-1014 160Meher 140 Pratikhya 145Konark 125 BPT-5204 150Surendra 135 Ketakijoha 150Gajapati 130 Pooja 150Kharavela 125 Sonamani 155MTU -1001 125-130 CR-1017 150MTU-1010 120 Sarala 160RGL-2538 130 Durga 160Navin 120 RGL-2537 160Tapaswini 135 Barshadhan 160Geetanjali 135 Upahar 160KRH-2 135 MTU-7029 140PA 6201 130 CR-1009 155PA 6444 135 CR-1018 160PRH-122(Ganga) 130Suruchi 130Rajalaxmi 130Ajaya 135Naveen 135JKRH-401 140Nidhi 125Satyabhama 110Luna Sankhi (CR Dhan 405) 110Mandakini 110Jyotirmayee 110
The farmers are being motivated by the agriculture extension machinery to cultivate their land, with above suggested varieties and following recommended package of practices to harvest better yield.
(II) Fertiliser
The fertilizer consumption in the state has taken great strides from a meager 0.76 kg/ ha during 1961-62 to 63.78 ha during 2014-15. Still the consumption is much below the national average and thus can be raised to a higher level with availability of the materials in required quantities at affordable price. Fertiliser consumption of the state from 1961-62 to 2014-15 is indicated below.

11
YearFertiliser consumption in nutrient basis
in ‘000 MT Consumption in Kg./haN P K Total
1961-62 4.38 0.49 - 4.87 0.761971-72 37.43 8.38 4.01 49.82 7.251981-82 54.16 17.92 9.91 81.99 9.681991-92 126.22 41.52 28.29 196.03 19.962001-02 221.17 71.95 51.55 344.67 41.002002-03 185.41 62.86 42.29 290.56 39.002003-04 210.07 66.64 49.50 326.21 39.002004-05 223.54 77.99 53.77 355.31 43.002005-06 243.21 91.05 60.62 294.88 46.002006-07 256.54 92.77 53.57 402.88 47.002007-08 273.63 121.48 67.21 462.32 52.102008-09 297.77 147.93 89.17 534.87 61.502009-10 292.29 148.59 78.46 519.34 59.782010-11 294.72 153.97 89.16 537.85 62.852011-12 323.41 135.48 55.80 514.69 62.852012-13 315.04 124.19 50.97 490.20 58.742013-14 (Prov.) 312.99 117.70 56.45 487.14 57.112014-15 (Likely) 324.91 143.76 75.42 544.09 63.78
(iii) Plant Protection
Adoption of Integrated Pest Management (IPM), emphasizing conservation and augmentation of natural enemies of pest such as parasites, predators and pathogens for control of harmful insects and diseases of crops, is being given due thrust for increasing the crop productivity. IPM is organized by use of pest resistant varieties, seed treatment, crop sanitation, use of bio-control agents and conservation of benefi cial insects & pathogens. The increased emphasis on IPM methodologies has led to a slower growth rate in case of chemical pesticide consumption in the state. On the other hand there has been an increasing trend on consumption of bio- pesticides. Seed treatment campaign has been taken up as earnest vigour. During 2013-14, 2716 Nos. of seed treatment camps have been organized. This year it has planned to organize 4710 Nos. of campaigns out of which 3140 Nos. have already been completed.
(Technical Grade in MT)
YearTotal Pesticides consumed
TotalPer hectares consumption(gms of a.i.)Chemical Bio-pesticides
2000-01 780.55 225.00 1005.55 157.002001-02 757.00 261.00 1018.00 159.002002-03 748.00 280.00 1028.00 139.002003-04 710.90 317.60 1028.50 138.00
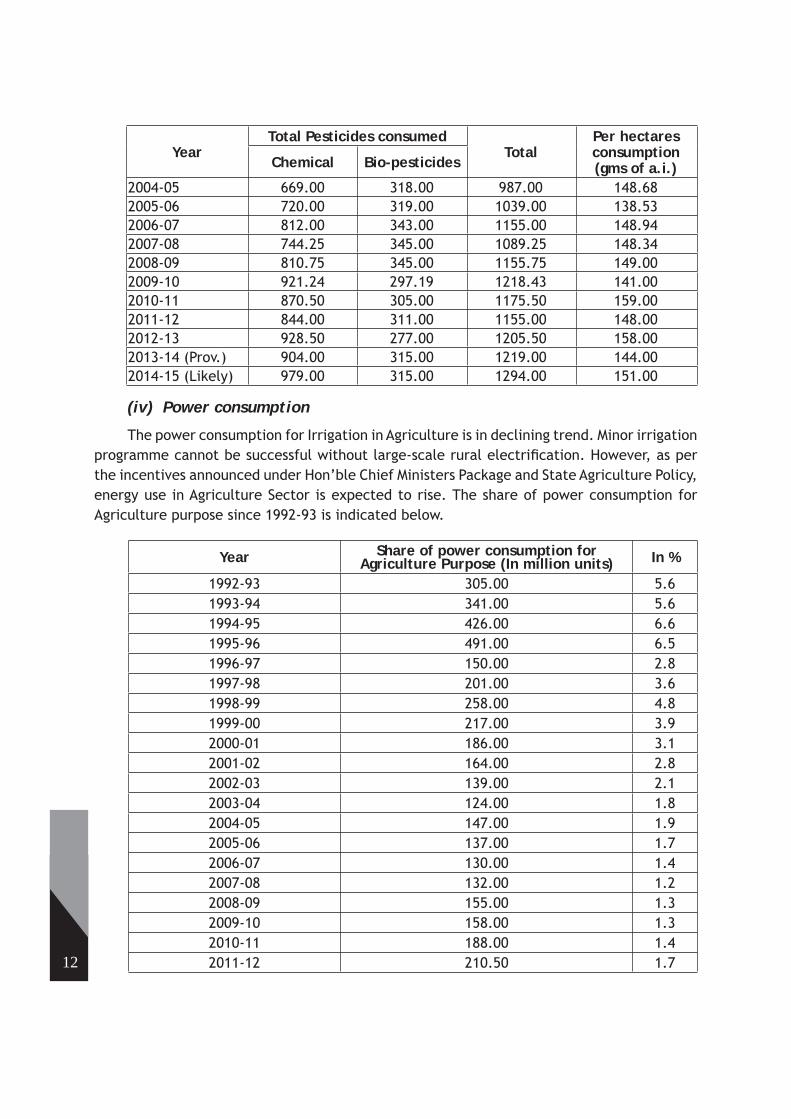
12
YearTotal Pesticides consumed
TotalPer hectares consumption(gms of a.i.)Chemical Bio-pesticides
2004-05 669.00 318.00 987.00 148.682005-06 720.00 319.00 1039.00 138.532006-07 812.00 343.00 1155.00 148.942007-08 744.25 345.00 1089.25 148.342008-09 810.75 345.00 1155.75 149.002009-10 921.24 297.19 1218.43 141.002010-11 870.50 305.00 1175.50 159.002011-12 844.00 311.00 1155.00 148.002012-13 928.50 277.00 1205.50 158.002013-14 (Prov.) 904.00 315.00 1219.00 144.002014-15 (Likely) 979.00 315.00 1294.00 151.00
(iv) Power consumption
The power consumption for Irrigation in Agriculture is in declining trend. Minor irrigation programme cannot be successful without large-scale rural electrifi cation. However, as per the incentives announced under Hon’ble Chief Ministers Package and State Agriculture Policy, energy use in Agriculture Sector is expected to rise. The share of power consumption for Agriculture purpose since 1992-93 is indicated below.
Year Share of power consumption forAgriculture Purpose (In million units) In %
1992-93 305.00 5.61993-94 341.00 5.61994-95 426.00 6.61995-96 491.00 6.51996-97 150.00 2.81997-98 201.00 3.61998-99 258.00 4.81999-00 217.00 3.92000-01 186.00 3.12001-02 164.00 2.82002-03 139.00 2.12003-04 124.00 1.82004-05 147.00 1.92005-06 137.00 1.72006-07 130.00 1.42007-08 132.00 1.22008-09 155.00 1.32009-10 158.00 1.32010-11 188.00 1.42011-12 210.50 1.7
13
Year Share of power consumption forAgriculture Purpose (In million units) In %
2012-13 162.94 1.22013-14 (Prov) 186.14 1.29
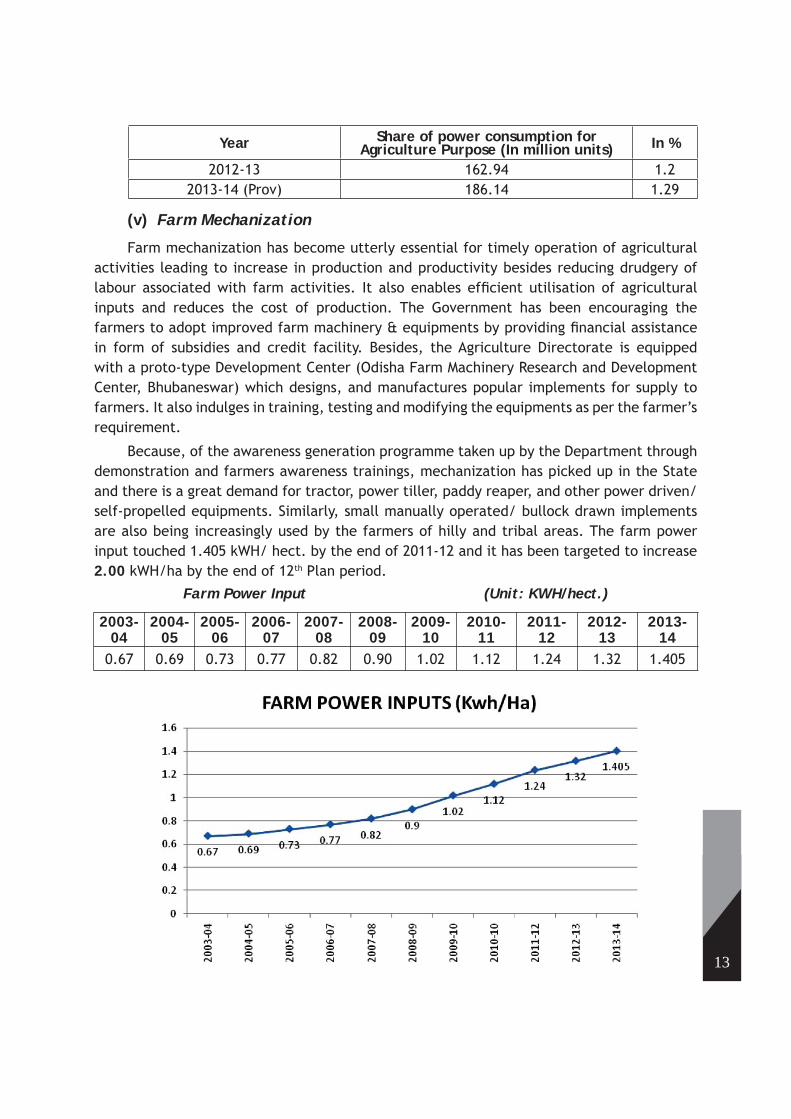
(v) Farm Mechanization
Farm mechanization has become utterly essential for timely operation of agricultural activities leading to increase in production and productivity besides reducing drudgery of labour associated with farm activities. It also enables effi cient utilisation of agricultural inputs and reduces the cost of production. The Government has been encouraging the farmers to adopt improved farm machinery & equipments by providing fi nancial assistance in form of subsidies and credit facility. Besides, the Agriculture Directorate is equipped with a proto-type Development Center (Odisha Farm Machinery Research and Development Center, Bhubaneswar) which designs, and manufactures popular implements for supply to farmers. It also indulges in training, testing and modifying the equipments as per the farmer’s requirement.
Because, of the awareness generation programme taken up by the Department through demonstration and farmers awareness trainings, mechanization has picked up in the State and there is a great demand for tractor, power tiller, paddy reaper, and other power driven/ self-propelled equipments. Similarly, small manually operated/ bullock drawn implements are also being increasingly used by the farmers of hilly and tribal areas. The farm power input touched 1.405 kWH/ hect. by the end of 2011-12 and it has been targeted to increase 2.00 kWH/ha by the end of 12th Plan period.
Farm Power Input (Unit: KWH/hect.)
2003-04
2004-05
2005-06
2006-07
2007-08
2008-09
2009-10
2010-11
2011-12
2012-13
2013-14
0.67 0.69 0.73 0.77 0.82 0.90 1.02 1.12 1.24 1.32 1.405

14
The trend of tractors & power tiller popularised is indicated below.
YearNos supplied
Tractor Power tillers1992-93 76 --1993-94 152 --1994-95 273 --1995-96 103 761996-97 512 3451997-98 774 3931998-99 303 7481999-00 143 7832000-01 168 7752001-02 102 8222002-03 251 12422003-04 585 17342004-05 788 21252005-06 800 16312006-07 1247 29742007-08 705 33642008-09 1500 52802009-10 2325 76152010-11 4750 127422011-12 5317 112572012-13 5977 125032013-14 4534 13032
(vi) Farm Credit
Since modern agriculture is capital intensive, farmer’s access to farm credit is crucial in enhancing crop productivity, especially in Odisha’s context. The crop loan disbursed to farmers exhibits an increasing trend and needs to be greatly increased.
(In crore Rupees)
Year Crop loan disbursed1995-96 252.001996-97 275.001997-98 326.001998-99 463.001999-00 595.002000-01 611.002001-02 754.002002-03 869.002003-04 1107.002004-05 1481.00
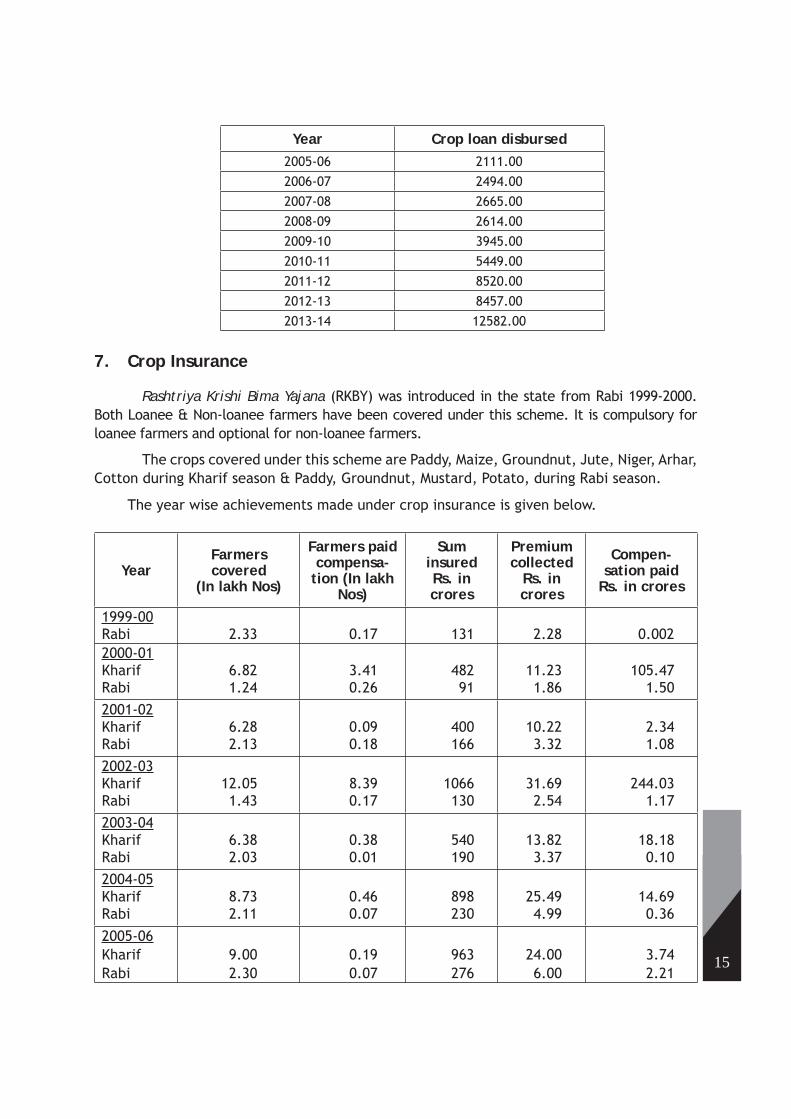
15
Year Crop loan disbursed2005-06 2111.002006-07 2494.002007-08 2665.002008-09 2614.002009-10 3945.002010-11 5449.002011-12 8520.002012-13 8457.002013-14 12582.00
7. Crop Insurance
Rashtriya Krishi Bima Yajana (RKBY) was introduced in the state from Rabi 1999-2000. Both Loanee & Non-loanee farmers have been covered under this scheme. It is compulsory for loanee farmers and optional for non-loanee farmers.
The crops covered under this scheme are Paddy, Maize, Groundnut, Jute, Niger, Arhar, Cotton during Kharif season & Paddy, Groundnut, Mustard, Potato, during Rabi season.
The year wise achievements made under crop insurance is given below.
YearFarmers covered
(In lakh Nos)
Farmers paid compensa-
tion (In lakh Nos)
Sum insuredRs. in crores
Premium collected
Rs. in crores
Compen-sation paid
Rs. in crores
1999-00 Rabi 2.33 0.17 131 2.28 0.0022000-01KharifRabi
6.821.24
3.410.26
48291
11.231.86
105.471.50
2001-02KharifRabi
6.282.13
0.090.18
400166
10.223.32
2.341.08
2002-03 Kharif Rabi
12.051.43
8.390.17
1066130
31.692.54
244.031.17
2003-04Kharif Rabi
6.382.03
0.380.01
540190
13.823.37
18.180.10
2004-05KharifRabi
8.732.11
0.460.07
898230
25.494.99
14.690.36
2005-06 KharifRabi
9.002.30
0.190.07
963276
24.006.00
3.742.21

16
YearFarmers covered
(In lakh Nos)
Farmers paid compensa-
tion (In lakh Nos)
Sum insuredRs. in crores
Premium collected
Rs. in crores
Compen-sation paid
Rs. in crores
2006-07KharifRabi
6.802.00
0.680.13
1071269
27.505.26
27.480.46
2007-08KharifRabi
8.411.32
0.660.01
1118200
28.243.81
24.020.17
2008-09KharifRabi
6.111.62
0.560.44
841252
21.774.98
30.358.37
2009-10KharifRabi
10.691.35
0.990.21
1575259
39.704.65
46.906.50
2010-11KharifRabi
11.830.75
2.270.11
1994.79163.27
59.285.76
138.764.76
2011-12Kharif Rabi
15.560.83
6.741.40
3072241
94.425.38
673.941.40
2012-13KharifRabi
14.780.98
1.150.17
3219.48323.88
85.867.47
63.808.43
2013-14KharifRabi
16.05NA
5.56NA
4054.07NA
109.47NA
60.29NA
8. The Developmental Approach
The Department of Agriculture is always in search of new interventions/ innovations, such as; introduction of new varieties of HYV / Hybrid seeds, increase in seed replacement ratio, fertilizer consumption, Integrated Nurient Management, Integrated Pest Management, Farm Mechanisation, Water management, post-harvest management of agri-produce etc. for maximization of production and productivity of different crops there by enhance farm income through implementation of different schemes assisted by the State and Center . Some of the important schemes implemented through the Directorate of Agriculture are listed below –
A. State Plan Schemes
1. Input Subsidy
2. Promotion of need based plant protection.
3. Subsidy under Agricultural Policy (Capital Investment Subsidy)

17
4. Popularisation of Agricultural Implements, Equipment and Diesel Pump sets.
5. Promotion of SRI.
6. Promotion of Improved Agronomic Package of Practices.
7. Promotion of Integrated Farming.
8. Technology Mission on oilseed and pulses.
9. Technology Mission on Sugarcane development.
10. Technology mission on Jute and Mesta.
11. Management of Acid Soils.
12. Organic Farming.
13. Operationalisation of Soil Testing and Quality Control labs.
14. Establishment of Agro-Industrial Estate.
15. Development of Infrastructure for post-harvest Management.
16. Refreshers training for extension functionaries.
17. Intensive extension campaign on agriculture.
18. Jalanidhi
19. Biju Krushak Kalyan Yojana.
B. Central Sector Plan Schemes
20. National Mission on Oilseeds and Oil palm (NMOOP).
- Mini Mission-I of NMOOP (Cultivation of Vegetable Oilseeds Crops)
21. National Mission for sustainable Agriculture (NMSA).
Soil Health Managementa.
Climate Change & Sustainable Agriculture: Monitoring, Modeling and Net-b. working
22. National Mission on Agriculture Extension and Technology (NMAET).
Sub Mission on Agriculture Mechanization (SMAM).a.
Sub Mission on Agriculture Extension (SMAE).b.
Sub Mission on Seed and Planting Material (SMSP).c.
Sub Mission on Plant Protection and Quarantine (SMPP).d.
C. Other Flagship Programmes
23. National Food Security Mission (NFSM).
NFSM-Rice, a.
NFSM - Pulses, b.

18
NFSM- Commercial crops (Cotton, Jute, Sugarcane) and c.
NFSM- Coarse Cereals.d.
24. Rastriya Krishi Vikas Yojana (RKVY).
e-pest Surveillance and pest management.a.
Seed production of Hybrid paddy and Maize.b.
Supply of POS machine to Input dealers.c.
Incentivizing Hybrid Maize Cultivation in PPP mode.d.
BGREIe.
These schemes are implemented through the departmental fi eld functionaries posted at grass root level and at the higher level in coordination with the Panchayati Raj Institutions.
9. Crop coverage & Crop production(a) Food grains
Food grains consist of cereals and pulses. Rice, Maize, Ragi, Wheat, Jowar, Bajra & Small millets crops grown in the State come under cereals and Arhar, Mung, Biri, Kulthi, Cowpea, Fieldpea, Gram, Lentil crops under Pulses. The crops of Wheat, Bajra, Jowar, Small millets are grown to lesser extent. Mung, Biri and Kulthi crops are mostly grown during Rabi season in the rice fallows with residual moisture. If there is a good rainfall during last part of October, the coverage under pulse crops & production are higher. The area, production & yield rate of food grains since 1950-51 till date is indicated below.
YearArea (in lakh ha.) Production (in lakh MT) Productivity (kgs./ ha.)
Cereals Pulses Total Cereals Pulses Total Cereals Pulses Total
1950-51 40 4 44 21 2 24 510 520 5461960-61 40 5 45 38 2 40 943 443 9061970-71 49 8 57 44 5 49 898 552 8471980-81 52 17 69 51 9 60 982 514 8651990-91 50 21 71 59 11 70 1181 551 9921998-99 49 16 65 58 6 64 1180 391 9891999-00 51 16 67 56 7 63 1108 403 9372000-01 49 14 63 50 5 55 1032 365 8842001-02 49 17 66 75 7 82 1526 400 12322002-03 47 13 60 36 4 40 767 349 6752003-04 49 16 65 71 6 77 1444 379 11782004-05 49 17 66 70 6 76 1414 378 11542005-06 49 19 68 74 8 82 1513 422 12112006-07 49 19 68 74 9 83 1520 444 12132007-08 49 20 69 83 9 92 1702 458 13442008-09 49 20 69 76 10 86 1556 497 12492009-10 48 21 69 77 10 87 1604 460 1258
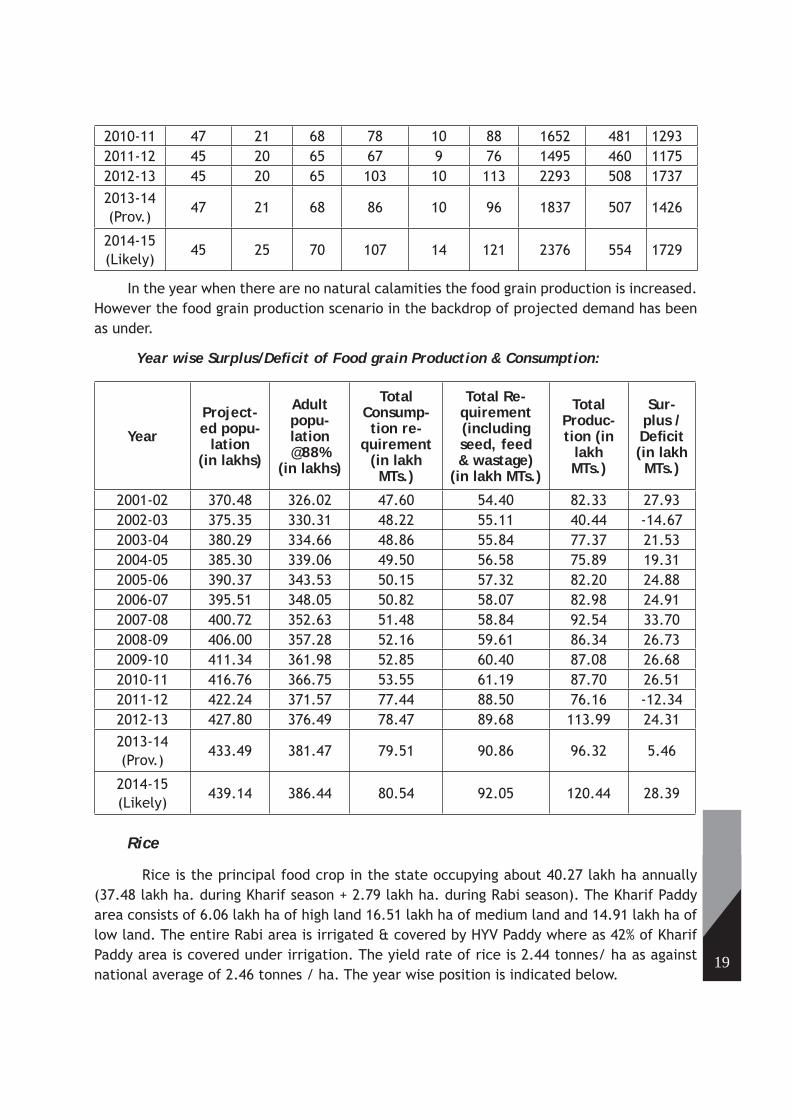
19
2010-11 47 21 68 78 10 88 1652 481 12932011-12 45 20 65 67 9 76 1495 460 11752012-13 45 20 65 103 10 113 2293 508 17372013-14 (Prov.)
47 21 68 86 10 96 1837 507 1426
2014-15 (Likely)
45 25 70 107 14 121 2376 554 1729
In the year when there are no natural calamities the food grain production is increased. However the food grain production scenario in the backdrop of projected demand has been as under.
Year wise Surplus/Defi cit of Food grain Production & Consumption:
Year
Project-ed popu-
lation (in lakhs)
Adultpopu-lation @88%
(in lakhs)
Total Consump-tion re-
quirement (in lakh MTs.)
Total Re-quirement (including seed, feed & wastage)
(in lakh MTs.)
Total Produc-tion (in
lakh MTs.)
Sur-plus / Defi cit (in lakh MTs.)
2001-02 370.48 326.02 47.60 54.40 82.33 27.932002-03 375.35 330.31 48.22 55.11 40.44 -14.672003-04 380.29 334.66 48.86 55.84 77.37 21.532004-05 385.30 339.06 49.50 56.58 75.89 19.312005-06 390.37 343.53 50.15 57.32 82.20 24.882006-07 395.51 348.05 50.82 58.07 82.98 24.912007-08 400.72 352.63 51.48 58.84 92.54 33.702008-09 406.00 357.28 52.16 59.61 86.34 26.732009-10 411.34 361.98 52.85 60.40 87.08 26.682010-11 416.76 366.75 53.55 61.19 87.70 26.512011-12 422.24 371.57 77.44 88.50 76.16 -12.342012-13 427.80 376.49 78.47 89.68 113.99 24.312013-14 (Prov.)
433.49 381.47 79.51 90.86 96.32 5.46
2014-15 (Likely)
439.14 386.44 80.54 92.05 120.44 28.39
Rice
Rice is the principal food crop in the state occupying about 40.27 lakh ha annually (37.48 lakh ha. during Kharif season + 2.79 lakh ha. during Rabi season). The Kharif Paddy area consists of 6.06 lakh ha of high land 16.51 lakh ha of medium land and 14.91 lakh ha of low land. The entire Rabi area is irrigated & covered by HYV Paddy where as 42% of Kharif Paddy area is covered under irrigation. The yield rate of rice is 2.44 tonnes/ ha as against national average of 2.46 tonnes / ha. The year wise position is indicated below.

20
YearArea (in lakh ha.) Production (in lakh MTs) Productivity (kgs./ ha.)
Kharif Rabi Total Kharif Rabi Total Kharif Rabi Total1950-51 38.5 0.1 38.6 20.0 0.1 20.1 520 600 5201960-61 37.7 0.3 38.0 37.2 0.2 37.4 988 697 9861970-71 43.3 1.4 44.7 39.1 1.9 41.0 902 1387 9171980-81 40.2 1.7 41.9 40.3 2.7 43.0 1003 1571 10261990-91 41.9 2.1 44.0 48.4 4.3 52.7 1156 2019 11981998-99 41.8 2.7 44.5 48.9 5.0 53.9 1169 1889 12121999-00 42.2 3.8 46.0 42.8 9.1 51.9 1013 2389 11272000-01 42.3 2.0 44.3 41.7 4.4 46.1 987 2136 10412001-02 42.3 2.7 45.0 65.7 5.8 71.5 1554 2127 15892002-03 40.9 1.8 42.7 28.2 4.2 32.4 690 2352 7592003-04 42.5 2.5 45.0 62.0 5.3 67.3 1459 2112 14962004-05 42.0 2.9 44.9 58.8 6.5 65.3 1401 2230 14552005-06 41.54 3.25 44.79 62.49 7.14 69.63 1504 2193 15542006-07 41.36 3.14 44.50 61.96 7.32 69.28 1498 2328 15572007-08 41.18 3.34 44.52 68.26 8.29 76.55 1658 2484 17202008-09 41.24 3.31 44.55 60.92 8.24 69.16 1477 2488 15532009-10 41.00 2.65 43.65 62.93 7.29 70.22 1535 2754 16092010-11 39.33 2.93 42.26 60.51 8.80 69.31 1539 3004 16402011-12 37.69 2.36 40.05 51.27 7.68 58.95 1360 3262 14722012-13 37.49 2.74 40.23 86.29 8.68 94.97 2302 3165 23612013-14 (Prov.)
38.80 3.00 41.80 65.85 10.28 76.13 1697 3422 1821
2014-15 (Likely)
36.00 3.50 39.50 84.30 11.90 96.50 2350 3400 2443
The scope for increasing Rabi rice area is very limited as it entirely depends upon irrigation. The problems faced in increasing kharif rice productivity and the steps taken to overcome them are as follows.
More & more Kharif rice area is being brought under irrigation.i)
Kharif rice is grown in all types of land, even on sub-marginal lands, with the hope ii) of getting some yield if the rainfall is normal. Due to weak economic condition, especially the tribal farmers in hilly areas, cultivate rice with least / no agri-inputs and obtain low yield, particularly from high lands. In these areas, growing short duration paddy varieties of 70-90 days and mixed cropping are being advocated as an insurance against crop failure. Steps are being taken to divert 2 lakh ha. of paddy land especially high land paddy area to more remunerative crops like cereals, pulses, oilseeds, vegetables, spices, fruit trees, fi bres, fl owers etc.
A good number of High Yielding Varieties have come up for high & medium land, iii) choice for low, water logged and saline inunadated lands is limited. Late varieties like Panidhan, Tulasi, Kanchan, Rambha, Lunisree have been developed by CRRI & OUAT for these lands.

21
Pest built-up due to continuous cloudy weather in Kharif season & loss of nutrients iv) due to leaching have become serious risks, the poor farmer of the state can hardly afford. Besides their resource poorness is one of the main reasons for low fertilizer consumption.
The operational units are small & fragmented. Small, marginal & tribal farmers are v) economically too weak to adopt new technology. Since the situation is changing, a large number of farmers are being brought into the fold of institutional fi nance.
To increase production and productivity of Rice Centrally Sponsored Programme like BGREI, NFSM (Rice) are in operation in the State. Under these schemes interventions like line sowing / line transplanting, use of micronutrients, exposure visit of farmers (outside and inside state), supply of certifi ed seeds based on soil test reports, farm implements, power tillers, tractors at subsidized rates, asset building mainly supply of diesel pump sets etc. are being taken up. Besides, from 2007-08 such developmental activities for enhancement of rice production and productivity are also being taken up under the National Food Security Mission - Rice in 15 low productivity districts in a mission mode. Because of the consistent effort the state has bagged ‘Krishi Karman Award” for the 3rd time in a span of 5 years.
Other cereals
Maize & Ragi are the important coarse cereals. Jowar, Bajra & Small millets are also grown in the state to a lesser extent. These crops are mostly grown in tribal districts during Kharif in un-irrigated uplands with poor management practices and more as subsistence crop. The Area, Production & Yield rate of Ragi & Maize during last few years are given below.
A= Area in lakh hects P= Production in lakh MTs Y= Yield rate in Kgs/hect
YearRagi Maize
A P Y A P Y1950-51 1.21 0.28 235 0.23 0.09 3901960-61 0.67 0.29 431 0.22 0.09 4171970-71 1.56 1.41 901 0.72 0.59 8211980-81 3.36 2.65 786 1.81 1.75 9641990-91 2.48 2.54 1023 1.67 2.07 12381998-99 1.98 1.44 725 1.64 1.83 11171999-00 2.09 1.54 735 1.74 2.17 12482000-01 1.89 1.52 801 1.76 2.17 12352001-02 1.96 1.45 738 1.64 1.85 11282002-03 1.87 1.27 783 1.58 1.77 11232003-04 1.90 1.40 737 1.75 1.96 11162004-05 1.94 1.42 731 1.85 2.44 13222005-06 1.90 1.42 747 1.87 2.80 14962006-07 1.90 1.44 760 1.99 3.19 16022007-08 1.87 1.65 883 2.15 4.82 22452008-09 1.83 1.64 896 2.24 5.14 2291
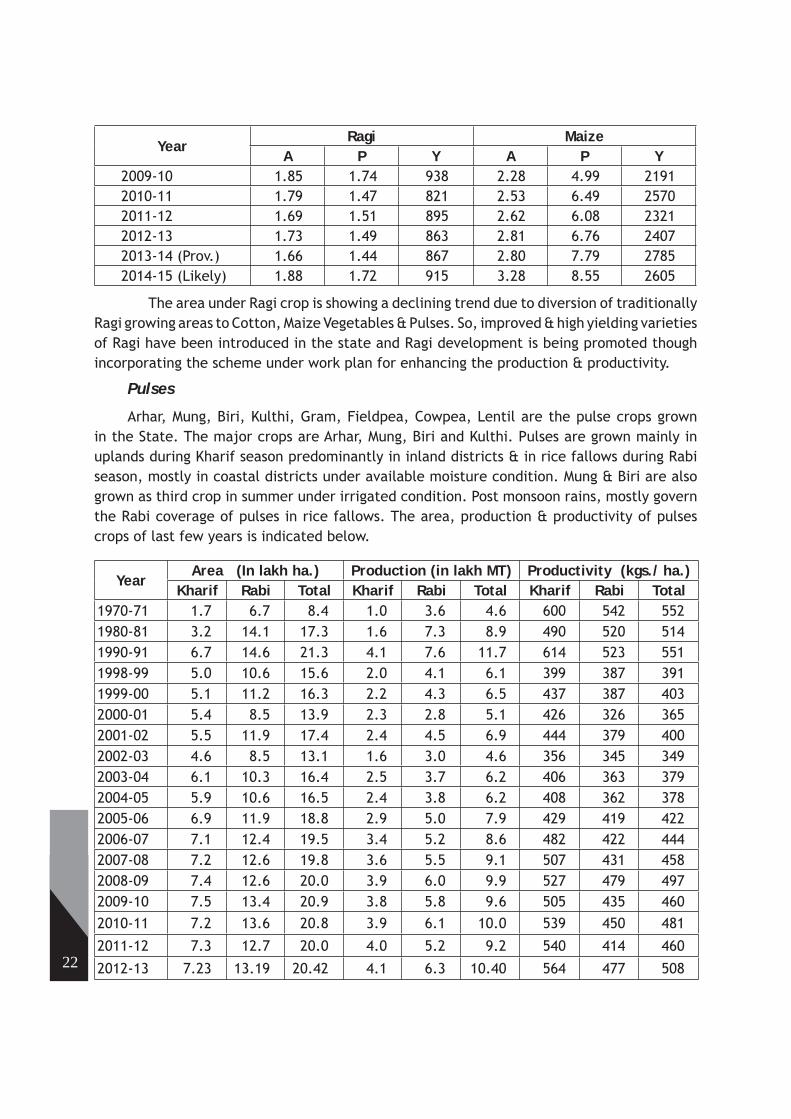
22
YearRagi Maize
A P Y A P Y2009-10 1.85 1.74 938 2.28 4.99 21912010-11 1.79 1.47 821 2.53 6.49 25702011-12 1.69 1.51 895 2.62 6.08 23212012-13 1.73 1.49 863 2.81 6.76 24072013-14 (Prov.) 1.66 1.44 867 2.80 7.79 27852014-15 (Likely) 1.88 1.72 915 3.28 8.55 2605
The area under Ragi crop is showing a declining trend due to diversion of traditionally Ragi growing areas to Cotton, Maize Vegetables & Pulses. So, improved & high yielding varieties of Ragi have been introduced in the state and Ragi development is being promoted though incorporating the scheme under work plan for enhancing the production & productivity.
Pulses
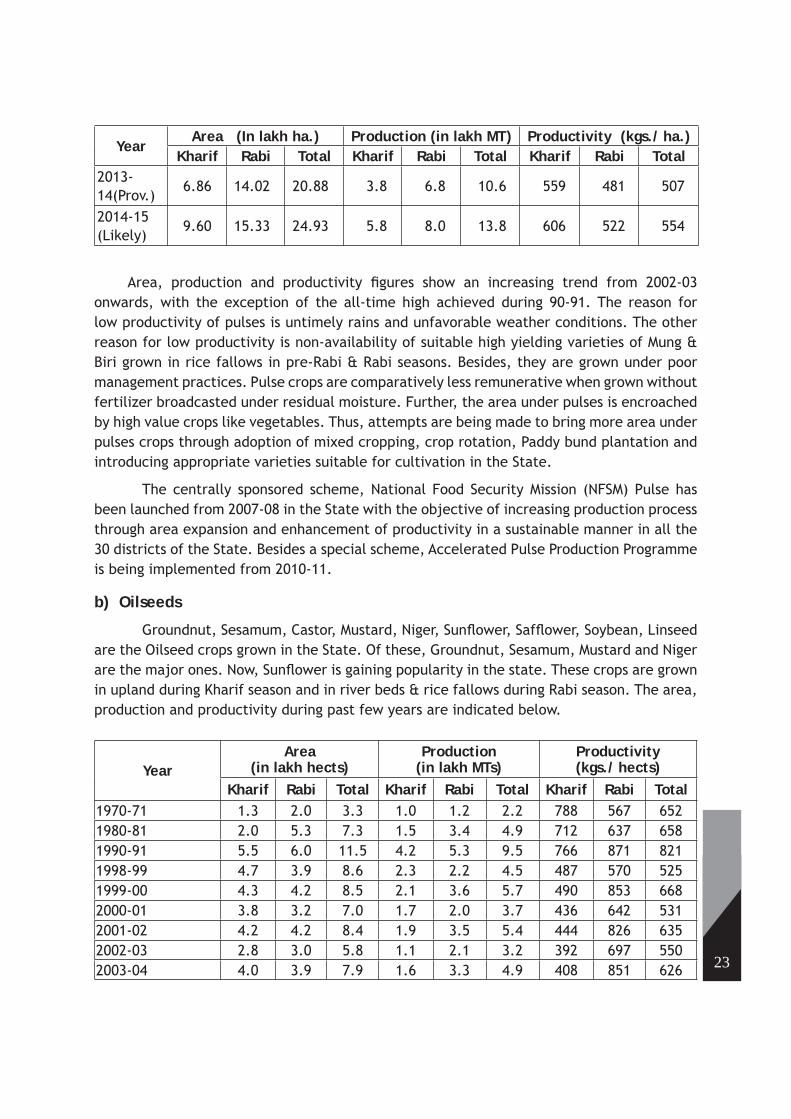
Arhar, Mung, Biri, Kulthi, Gram, Fieldpea, Cowpea, Lentil are the pulse crops grown in the State. The major crops are Arhar, Mung, Biri and Kulthi. Pulses are grown mainly in uplands during Kharif season predominantly in inland districts & in rice fallows during Rabi season, mostly in coastal districts under available moisture condition. Mung & Biri are also grown as third crop in summer under irrigated condition. Post monsoon rains, mostly govern the Rabi coverage of pulses in rice fallows. The area, production & productivity of pulses crops of last few years is indicated below.
YearArea (In lakh ha.) Production (in lakh MT) Productivity (kgs./ ha.)
Kharif Rabi Total Kharif Rabi Total Kharif Rabi Total1970-71 1.7 6.7 8.4 1.0 3.6 4.6 600 542 5521980-81 3.2 14.1 17.3 1.6 7.3 8.9 490 520 5141990-91 6.7 14.6 21.3 4.1 7.6 11.7 614 523 5511998-99 5.0 10.6 15.6 2.0 4.1 6.1 399 387 3911999-00 5.1 11.2 16.3 2.2 4.3 6.5 437 387 4032000-01 5.4 8.5 13.9 2.3 2.8 5.1 426 326 3652001-02 5.5 11.9 17.4 2.4 4.5 6.9 444 379 4002002-03 4.6 8.5 13.1 1.6 3.0 4.6 356 345 3492003-04 6.1 10.3 16.4 2.5 3.7 6.2 406 363 3792004-05 5.9 10.6 16.5 2.4 3.8 6.2 408 362 3782005-06 6.9 11.9 18.8 2.9 5.0 7.9 429 419 4222006-07 7.1 12.4 19.5 3.4 5.2 8.6 482 422 4442007-08 7.2 12.6 19.8 3.6 5.5 9.1 507 431 4582008-09 7.4 12.6 20.0 3.9 6.0 9.9 527 479 4972009-10 7.5 13.4 20.9 3.8 5.8 9.6 505 435 4602010-11 7.2 13.6 20.8 3.9 6.1 10.0 539 450 481
2011-12 7.3 12.7 20.0 4.0 5.2 9.2 540 414 460
2012-13 7.23 13.19 20.42 4.1 6.3 10.40 564 477 508
23
YearArea (In lakh ha.) Production (in lakh MT) Productivity (kgs./ ha.)
Kharif Rabi Total Kharif Rabi Total Kharif Rabi Total2013-14(Prov.)
6.86 14.02 20.88 3.8 6.8 10.6 559 481 507
2014-15 (Likely)
9.60 15.33 24.93 5.8 8.0 13.8 606 522 554
Area, production and productivity fi gures show an increasing trend from 2002-03 onwards, with the exception of the all-time high achieved during 90-91. The reason for low productivity of pulses is untimely rains and unfavorable weather conditions. The other reason for low productivity is non-availability of suitable high yielding varieties of Mung & Biri grown in rice fallows in pre-Rabi & Rabi seasons. Besides, they are grown under poor management practices. Pulse crops are comparatively less remunerative when grown without fertilizer broadcasted under residual moisture. Further, the area under pulses is encroached by high value crops like vegetables. Thus, attempts are being made to bring more area under pulses crops through adoption of mixed cropping, crop rotation, Paddy bund plantation and introducing appropriate varieties suitable for cultivation in the State.
The centrally sponsored scheme, National Food Security Mission (NFSM) Pulse has been launched from 2007-08 in the State with the objective of increasing production process through area expansion and enhancement of productivity in a sustainable manner in all the 30 districts of the State. Besides a special scheme, Accelerated Pulse Production Programme is being implemented from 2010-11.
b) Oilseeds
Groundnut, Sesamum, Castor, Mustard, Niger, Sunfl ower, Saffl ower, Soybean, Linseed are the Oilseed crops grown in the State. Of these, Groundnut, Sesamum, Mustard and Niger are the major ones. Now, Sunfl ower is gaining popularity in the state. These crops are grown in upland during Kharif season and in river beds & rice fallows during Rabi season. The area, production and productivity during past few years are indicated below.
YearArea
(in lakh hects)Production
(in lakh MTs)Productivity(kgs./ hects)
Kharif Rabi Total Kharif Rabi Total Kharif Rabi Total1970-71 1.3 2.0 3.3 1.0 1.2 2.2 788 567 6521980-81 2.0 5.3 7.3 1.5 3.4 4.9 712 637 6581990-91 5.5 6.0 11.5 4.2 5.3 9.5 766 871 8211998-99 4.7 3.9 8.6 2.3 2.2 4.5 487 570 5251999-00 4.3 4.2 8.5 2.1 3.6 5.7 490 853 6682000-01 3.8 3.2 7.0 1.7 2.0 3.7 436 642 5312001-02 4.2 4.2 8.4 1.9 3.5 5.4 444 826 6352002-03 2.8 3.0 5.8 1.1 2.1 3.2 392 697 5502003-04 4.0 3.9 7.9 1.6 3.3 4.9 408 851 626
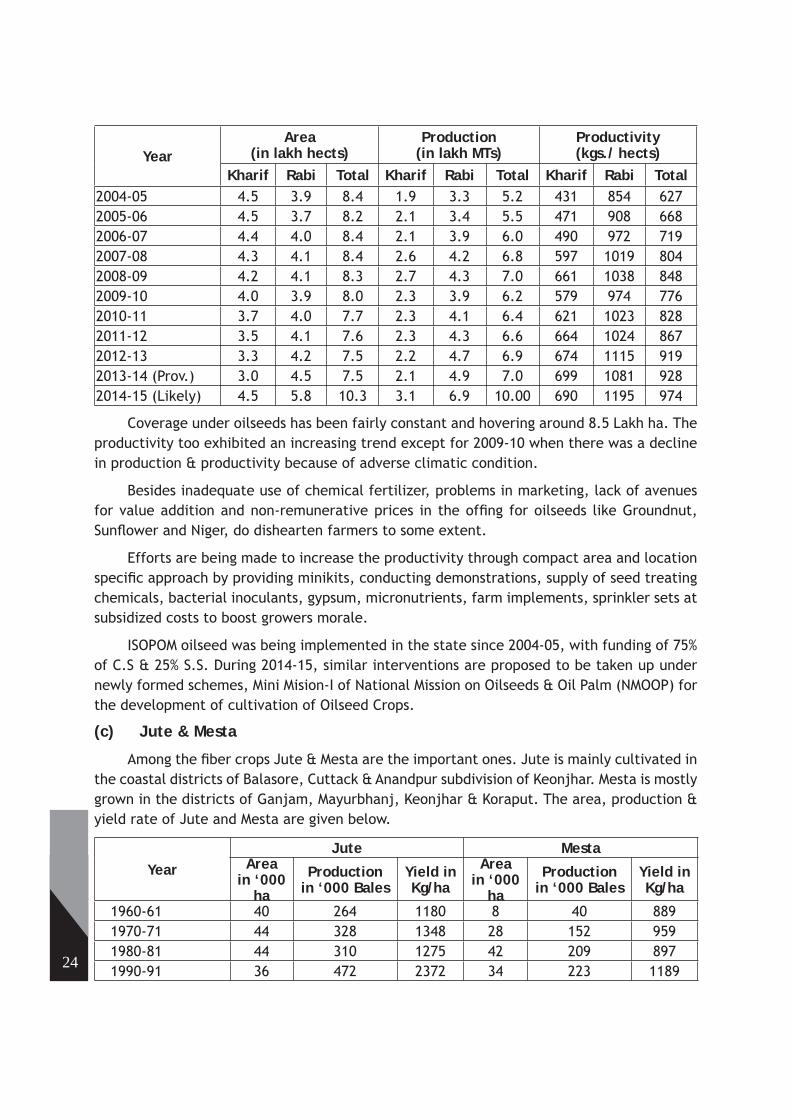
24
YearArea
(in lakh hects)Production
(in lakh MTs)Productivity(kgs./ hects)
Kharif Rabi Total Kharif Rabi Total Kharif Rabi Total2004-05 4.5 3.9 8.4 1.9 3.3 5.2 431 854 6272005-06 4.5 3.7 8.2 2.1 3.4 5.5 471 908 6682006-07 4.4 4.0 8.4 2.1 3.9 6.0 490 972 7192007-08 4.3 4.1 8.4 2.6 4.2 6.8 597 1019 8042008-09 4.2 4.1 8.3 2.7 4.3 7.0 661 1038 8482009-10 4.0 3.9 8.0 2.3 3.9 6.2 579 974 7762010-11 3.7 4.0 7.7 2.3 4.1 6.4 621 1023 8282011-12 3.5 4.1 7.6 2.3 4.3 6.6 664 1024 8672012-13 3.3 4.2 7.5 2.2 4.7 6.9 674 1115 9192013-14 (Prov.) 3.0 4.5 7.5 2.1 4.9 7.0 699 1081 9282014-15 (Likely) 4.5 5.8 10.3 3.1 6.9 10.00 690 1195 974
Coverage under oilseeds has been fairly constant and hovering around 8.5 Lakh ha. The productivity too exhibited an increasing trend except for 2009-10 when there was a decline in production & productivity because of adverse climatic condition.
Besides inadequate use of chemical fertilizer, problems in marketing, lack of avenues for value addition and non-remunerative prices in the offi ng for oilseeds like Groundnut, Sunfl ower and Niger, do dishearten farmers to some extent.
Efforts are being made to increase the productivity through compact area and location specifi c approach by providing minikits, conducting demonstrations, supply of seed treating chemicals, bacterial inoculants, gypsum, micronutrients, farm implements, sprinkler sets at subsidized costs to boost growers morale.
ISOPOM oilseed was being implemented in the state since 2004-05, with funding of 75% of C.S & 25% S.S. During 2014-15, similar interventions are proposed to be taken up under newly formed schemes, Mini Mision-I of National Mission on Oilseeds & Oil Palm (NMOOP) for the development of cultivation of Oilseed Crops.
(c) Jute & Mesta
Among the fi ber crops Jute & Mesta are the important ones. Jute is mainly cultivated in the coastal districts of Balasore, Cuttack & Anandpur subdivision of Keonjhar. Mesta is mostly grown in the districts of Ganjam, Mayurbhanj, Keonjhar & Koraput. The area, production & yield rate of Jute and Mesta are given below.
YearJute Mesta
Area in ‘000
ha
Production in ‘000 Bales
Yield in Kg/ha
Area in ‘000
ha
Production in ‘000 Bales
Yield in Kg/ha
1960-61 40 264 1180 8 40 8891970-71 44 328 1348 28 152 9591980-81 44 310 1275 42 209 8971990-91 36 472 2372 34 223 1189
25
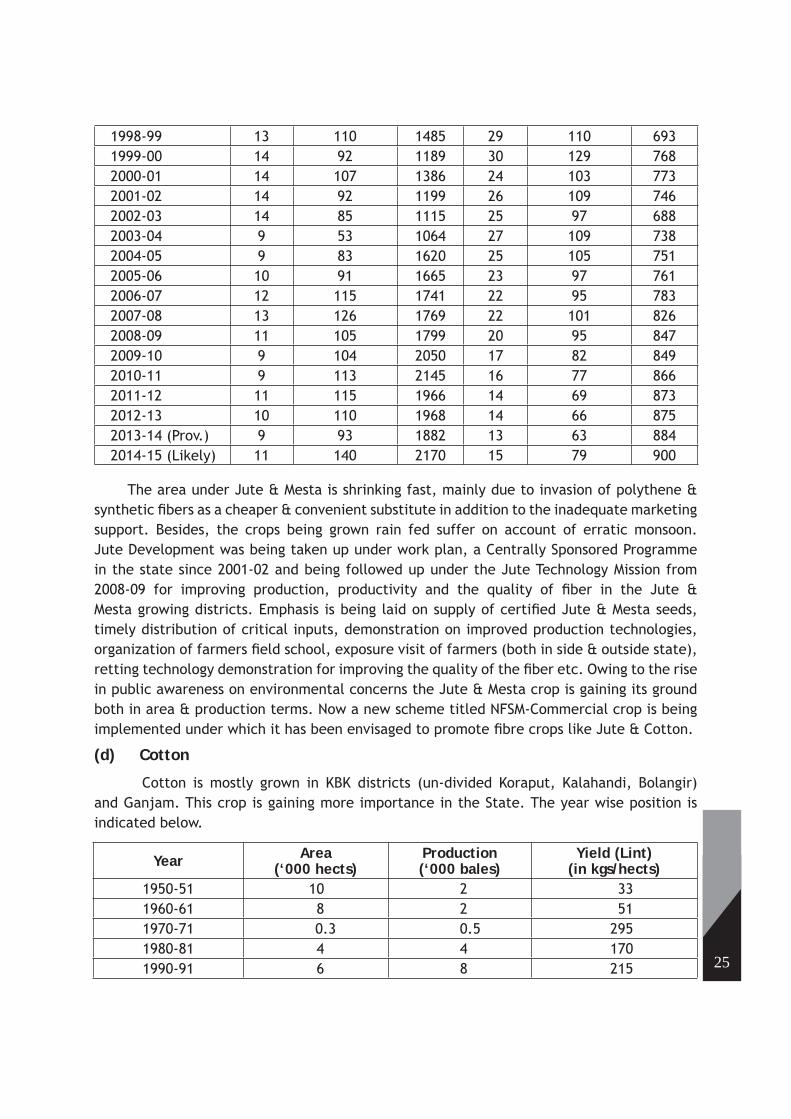
1998-99 13 110 1485 29 110 6931999-00 14 92 1189 30 129 7682000-01 14 107 1386 24 103 7732001-02 14 92 1199 26 109 7462002-03 14 85 1115 25 97 6882003-04 9 53 1064 27 109 7382004-05 9 83 1620 25 105 7512005-06 10 91 1665 23 97 7612006-07 12 115 1741 22 95 7832007-08 13 126 1769 22 101 8262008-09 11 105 1799 20 95 8472009-10 9 104 2050 17 82 8492010-11 9 113 2145 16 77 8662011-12 11 115 1966 14 69 8732012-13 10 110 1968 14 66 8752013-14 (Prov.) 9 93 1882 13 63 8842014-15 (Likely) 11 140 2170 15 79 900
The area under Jute & Mesta is shrinking fast, mainly due to invasion of polythene & synthetic fi bers as a cheaper & convenient substitute in addition to the inadequate marketing support. Besides, the crops being grown rain fed suffer on account of erratic monsoon. Jute Development was being taken up under work plan, a Centrally Sponsored Programme in the state since 2001-02 and being followed up under the Jute Technology Mission from 2008-09 for improving production, productivity and the quality of fi ber in the Jute & Mesta growing districts. Emphasis is being laid on supply of certifi ed Jute & Mesta seeds, timely distribution of critical inputs, demonstration on improved production technologies, organization of farmers fi eld school, exposure visit of farmers (both in side & outside state), retting technology demonstration for improving the quality of the fi ber etc. Owing to the rise in public awareness on environmental concerns the Jute & Mesta crop is gaining its ground both in area & production terms. Now a new scheme titled NFSM-Commercial crop is being implemented under which it has been envisaged to promote fi bre crops like Jute & Cotton.
(d) Cotton
Cotton is mostly grown in KBK districts (un-divided Koraput, Kalahandi, Bolangir) and Ganjam. This crop is gaining more importance in the State. The year wise position is indicated below.
Year Area(‘000 hects)
Production(‘000 bales)
Yield (Lint)(in kgs/hects)
1950-51 10 2 331960-61 8 2 511970-71 0.3 0.5 2951980-81 4 4 1701990-91 6 8 215
26
1998-99 29 53 3061999-00 38 61 2722000-01 39 65 2832001-02 63 55 1472002-03 29 50 2872003-04 37 88 4082004-05 46 111 4122005-06 57 145 4352006-07 60 108 3072007-08 50 125 4232008-09 58 147 4302009-10 54 147 4642010-11 74 241 5502011-12 102 231 3862012-13 119 336 482
2013-14 (Prov.) 124 299 4102014-15 (Likely) 135 382 510
The present aim is to raise the area under cotton to above 134000 ha. by substituting the crop in high land where non-remunerative non-paddy & paddy crops are grown.
Steps are being taken to make available quality hybrid & high yielding seeds to cotton growers in the state. Besides, technical assistance for raising the crop is being rendered through the extension personnel of the department.
(e) Sugarcane
Sugarcane is mostly cultivated in undivided districts of Puri, Cuttack, Ganjam, Koraput, Dhenkanal, Bolangir, Kalahandi & Sambalpur districts. The year wise Area, Production & Productivity is indicated below.
Year Area (‘000 hects) Production (‘000 MTs) Yield (in kgs/hects)1950-51 25 1107 442841960-61 25 744 291791970-71 30 1627 539071980-81 49 3060 624491990-91 49 3549 724291998-99 47 3060 649171999-00 31 1827 589902000-01 31 2103 669512001-02 30 1890 637282002-03 25 1516 601502003-04 29 1810 629082004-05 34 2321 686002005-06 37 2543 69286
27
Year Area (‘000 hects) Production (‘000 MTs) Yield (in kgs/hects)2006-07 41 2836 70008
2007-08 38 2679 70360
2008-09 38 2665 70250
2009-10 37 2612 70852
2010-11 41 2908 71192
2011-12 39 2789 72000
2012-13 39 2604 66500
2013-14 (Prov.) 35 2544 71980
2014-15 (Likely) 50 3700 74000
There are six sugar mills in the state, out of which fi ve mills are in operation & one at Baramba,Cuttack is not functioning for which area and production of sugarcane crop has registered a decline during 2007-08 & 2008-09 but current year production has been increased.
Steps are being taken to revive the above sugarcane mill. Besides this, to improve the productivity, steps are also being taken to provide quality seed materials, conduct farmer fi eld schools, for up gradation of technical skill of farmers, supply of agricultural implements at subsidized rates and demonstration for ratoon management etc. under centrally sponsored plan scheme NFSM (Commercial Crops).
10. Seed Replacement Rate
The Seed Replacement Rate (SRR) of different crops from 2006-07 to 2013-14 is indicated below.
(SRR in %)
Name of the crop
2006-07 2007-08
Kharif Rabi Total Kharif Rabi Total
Paddy 5.87 14.16 6.35 11.25 21.83 12.04Maize 1.15 4.90 1.39 2.01 3.00 2.05Wheat 20.66 20.66 25.85 25.85Moong 2.77 1.89 2.15 1.20 1.43 1.36Urd 0.61 3.76 2.42 1.07 1.98 1.57Gram 13.05 13.05 20.46 20.46Arhar 2.68 5.29 2.68 1.98 1.98F.Pea 8.44 8.44 3.10 3.10G.Nut 6.67 32.28 22.89 7.57 29.89 22.19Mustard 14.45 14.45 12.20 12.20Sunfl ower 100.00 49.87 60.71 100.00 10.83 19.09Castor 10.99 5.74 14.90 7.37Jute 42.86 42.86 46.47 46.47Cotton 3.85 3.85 1.75 1.75

28
(SRR in %)
Name of the crop
2008-09 2009-10Kharif Rabi Total Kharif Rabi Total
Paddy 14.13 24.84 15.05 18.33 30.47 19.07
Maize 1.76 4.04 1.89 3.51 5.93 3.63
Wheat -- 34.22 34.22 -- 41.81 41.81
Moong 0.49 1.63 1.27 2.07 0.79 1.16
Urd 1.34 7.05 4.40 2.34 4.54 3.55
Gram -- 21.53 21.53 -- 30.72 30.72
Arhar 2.40 -- 2.40 2.54 -- 2.54
F.Pea -- 7.59 7.59 -- 17.93 17.93
G.Nut 7.41 32.20 23.53 13.20 41.49 31.28
Mustard - 18.13 18.13 -- 26.81 26.81
Sunfl ower 83.33 13.02 15.86 -- 48.53 48.53
Jute 45.84 - 45.84 39.10 -- 39.10
Cotton 0.60 - 0.60 61.78 -- 61.78
Sesamum 0.21 2.87 0.87
Niger 0.14 -- 0.14
(SRR in %)
Name of the crop
2010-11 2011-12Kharif Rabi Total Kharif Rabi Total
Paddy 19.99 29.37 20.64 21.54 23.37 21.65
Maize 19.21 44.83 20.86 13.20 13.24 13.20
Wheat -- 29.96 29.96 -- 38.95 38.95
Moong 1.56 5.42 4.36 1.88 2.62 2.41
Urd 1.19 5.64 3.64 3.27 3.72 3.52
Gram -- 5.32 5.32 -- 5.67 5.67
Arhar 1.43 -- 1.43 4.75 -- 4.75
F.Pea -- 12.82 12.82 -- 10.94 10.94
G.Nut 14.26 37.36 29.70 10.96 43.47 32.41
Mustard -- 30.03 30.03 -- 32.42 32.42
Sunfl ower 25.27 100.00 100.00 -- 64.03 64.03
Jute 32.85 -- 32.85 28.53 -- 28.53
Cotton 66.80 -- 66.80 65.67 -- 65.67
Sesamum 0.36 3.23 1.06 0.19 0.31 0.22
Niger 0.13 -- 0.13 0.97 -- 0.44
29
(SRR in %)
Name of the crop
2012-13 2013-14Kharif Rabi Total Kharif Rabi Total
Paddy 22.80 16.04 22.19 23.93 42.23 25.23
Ragi 2.71 0.22 2.66
Maize 21.53 - 20.00 19.26 - 17.90
Wheat - 8.76 8.76 - 13.09 13.09
Moong 1.32 2.74 2.35 3.27 8.66 7.32
Urd 2.39 1.21 1.67 1.95 5.28 3.87
Gram - 0.91 0.91 - 6.79 6.79
Arhar 4.14 - 4.14 7.62 - 7.62
F.Pea - 1.42 1.42 - 6.58 6.58
G.Nut 16.65 29.65 25.97 19.52 24.76 23.11
Mustard - 7.42 7.42 - 40.55 40.55
Sunfl ower 100 - 1.23 - 31.50 31.06
Jute 30.76 - 30.76 32.79 - 32.79
Cotton 60.01 - 60.01 68.96 - 68.96
Sesamum - 0.73 0.73 - 0.06 0.02
Niger 0.03 - 0.03 0.82 - 0.82
11. Minimum Support Price
The minimum support price of different Agricultural Products for the year from 2006-07 to 2014-15 fi xed by Govt. of India on the recommendation of Commission for Agriculture Costs and Prices (CACP) for all the States is indicated below.
(Rs. Per Qtls for FAQ
Sl.No Commodity
2006
-07
2007
-08
2008
-09
2009
-10
2010
-11
2011
-12
2012
-13
2013
-14
2014
-15
KHARIF CROPS1 Paddy Common 580μ 645$ 850 € 1000¥ 1000 1080 1250 1310 13602 Paddy (F)/Grade'A' 610μ 675 $ 880 € 1030¥ 1030 1110 1280 1345 14003 Jowar-Hybrid 540 600 840 840 880 980 1500 1500 15304 Jowar-Maldandi 555 620 860 860 900 1000 1520 15505 Bajra 540 600 840 840 880 980 1175 1250 12506 Ragi 540 600 915 915 965 1050 1500 1500 15507 Maize 540 620 840 840 880 980 1175 1310 13108 Tur (Arhar) 1410 1550 2000 2300 3000* 3200* 3850 4300 43509 Moong 1520 1700 2520 2760 3170* 3500* 4400 4500 4600
10 Urad 1520 1700 2520 2520 2900* 3300* 4300 4300 435011 Groundnut 1520 1550 2100 2100 2300 2700 3700 4000 4000

30
12 Sunfl ower Seed 1500 1510 2215 2215 2350 2800 3700 3700 375013 Soyabean Black 900 910 1350 1350 1400 1650 2200 2500 250014 Soyabean Yellow 1020 1050 1390 1390 1440 1690 2560 256015 Sesamum 1560 1580 2750 2850 2900 3400 4200 4500 460016 Nigerseed 1220 1240 2405 2405 2450 2900 3500 3500 360017 Medium Staple Cotton ^ 1770 1800 2500 2500 2500 2800 3600 3700 375018 Long Staple Cotton ^^ 1990 2030 3000 3000 3000 3300 3900 4000 4050
RABI CROPS19 Wheat 750α 1000 1080 1100 1120& 1285 1350 1400 145020 Barley 565 650 680 750 780 980 980 1100 115021 Gram 1445 1600 1730 1760 2100 2800 3000 3100 317522 Lentil (Masur) 1545 1700 1870 1870 2250 2800 2900 2950 307523 Rapeseed/ mustard 1715 1800 1830 1830 1850 2500 3000 3050 310024 Saffl ower 1565 1650 1650 1680 1800 2500 2800 3000 3050
OTHER COMMERCIAL CROPS25 Jute (TD5) 1055 1250 1375 1575 1675 2200 2300 240026 Sugarcane 81.18 81.18 129.84 139.12 145 170 210 22027 Copra (Milling) 3620 3660 4450 4450 4525 5100 5250 525028 Copra (Ball) 3870 3910 4700 4700 4775 5350 5500 5500
©: Additional Rs.10.00 per quintal for paddy may be given to farmers in Punjab and Haryana
μ: An additional incentive bonus of Rs. 40/- per quintal is payable on Procurement between 1.10.2006 to 31.3.2007. This will be subject to the condition that State Government fully exempt this
bonus amount from all state taxes and levies.
$ : Additional bonus of Rs 100 per quintal
€: Additional bonus of Rs 50 per quintal
¥: Additional bonus of Rs 50 per quintal
%: Additional bonus of Rs 40 per quintal
α: Additional bonus of Rs 100 per quintal is subject to the condition that state Government fully exempt this bonus amount from all state taxes and levies
*: Additonal Bonus of Rs 500 per quintal for market arrivals within the fi rst two months of harvesting
^ : Staple length(mm) of 24.5-25.5 and micronaire value of 4.3-5.1
^^: Staple length(mm) of 29.5-30.5 and micronaire value of 3.5-4.3.1
&: Additional bonus of Rs 50 per quintal
£: 10 percent bonus if exports are banned and in a revised reccomendation bonus of Rs 40 per quintal subject to liquidation of 15 million tonnes of Central Pool stocks
§: The nomenclature SMP has been changed to Fair and Remunerative Price (FRP) since 2009-10, based on 9.5 percent recovery ratio.
# Revised later to Rs 3850 per quintal for tur and Rs 4400 per quintal for moong

31
12. Agro climatic Zone Wise Districts
Sl. No Name of the Agro-climatic zone Name of the districts
1. North – Western Plateau Sundargarh, Deogarh
2. North Central Plateau Mayurbhanj, Keonjhar
3. North Eastern Coastal Plain Balasore, Bhadrak, Jajpur
4. East and South Eastern Coastal Plain Cuttack, Jagatsingpur, Kendrapada, Puri, Khurdha, Nayagarh
5. North Eastern Ghat Ganjam, Gajapati, Rayagada, Phulbani
6. Eastern Ghat High Land Koraput, Nowragpur
7. South Eastern Ghat Malkangiri
8. Western Undulating Zone Kalahandi, Nuapada
9. Western Central Table Land Bolangir, Sonepur, Boudh, Sambalpur, Baragarh, Jharsuguda
10. Mid Central Table Land Dhenkanal, Angul

32
13. Administrative Set-up (Odisha)
Sl. No.
District
No of
Block GP VillageSub-
DivisionTaha-sils
Municipality/ Municipal
Corp.NAC
Assembly Constitu-
encies
1 Angul 8 209 1910 4 8 1 2 4
2 Balangir 14 284 1794 3 14 1 3 6
3 Balasore 12 289 2952 2 12 1 3 7
4 Bargarh 12 246 1207 2 12 1 2 5
5 Bhadrak 7 193 1311 1 7 1 1 5
6 Boudh 3 63 1186 1 3 1 1
7 Cuttack 14 342 1950 3 15 2 2 10
8 Deogarh 3 60 875 1 3 1 1
9 Dhenkanal 8 198 1215 3 8 1 2 4
10 Gajapati 7 129 1619 1 7 1 1 3
11 Ganjam 22 475 3212 3 23 1 17 12
12 Jagatsingpur 8 194 1288 1 8 1 1 4
13 Jajpur 10 280 1778 1 10 2 6
14 Jharsuguda 5 78 348 1 5 2 1 3
15 Kalahandi 13 272 2236 2 13 1 2 6
16 Kandhamal 12 153 2546 2 12 2 3
17 Kendrapara 9 230 1540 1 9 1 1 6
18 Keonjhar 13 286 2122 3 13 3 1 6
19 Khurda 10 168 1551 2 10 3 2 6
20 Koraput 14 226 2028 2 14 1 3 4
21 Malkangiri 7 108 1045 1 7 2 2
22 Mayurbhanj 26 382 3950 4 26 1 3 10
23 Nabarangpur 10 169 901 1 10 1 1 4
24 Nayagarh 8 178 1695 1 8 2 4
25 Nuapada 5 108 663 1 5 2 2
26 Puri 11 230 1715 1 11 1 3 6
27 Rayagada 11 171 2667 2 11 1 2 4
28 Sambalpur 9 148 1322 3 9 1 4 3
29 Subarnapur 6 96 959 2 6 1 2 3
30 Sundargarh 17 262 1764 3 18 4 7
ODISHA 314 6227 51349 58 317 35 68 147
33
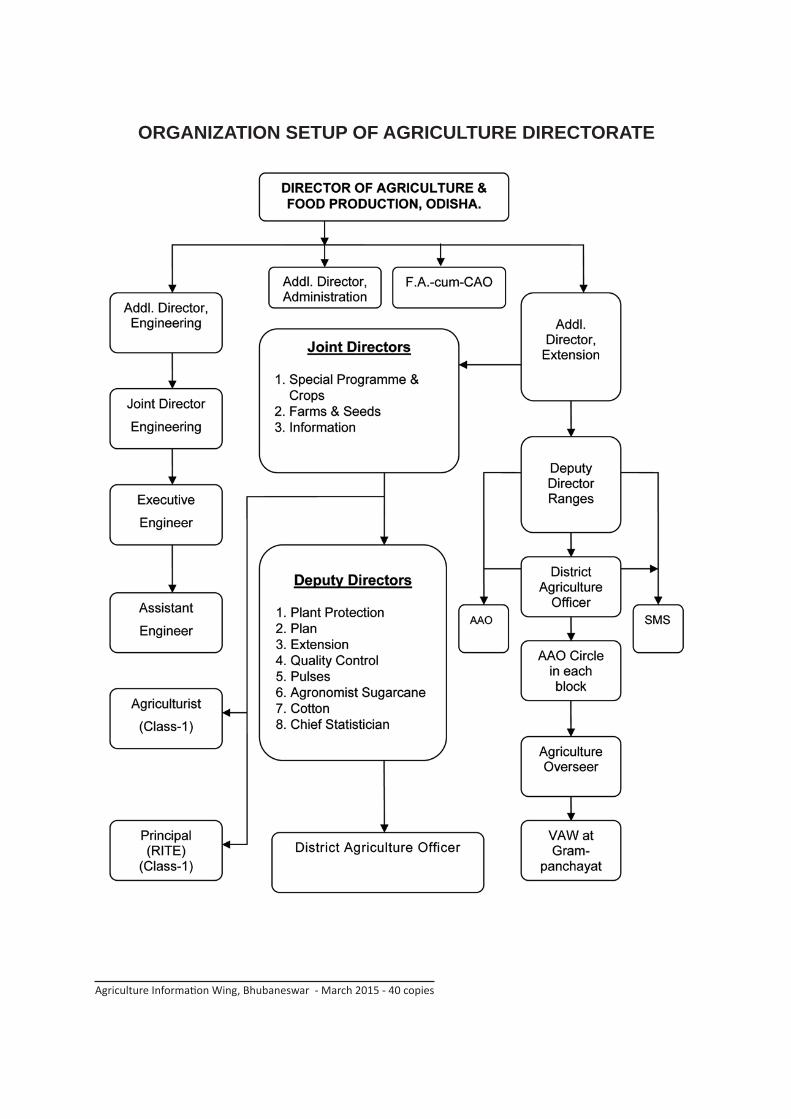
ORGANIZATION SETUP OF AGRICULTURE DIRECTORATE
Agriculture Informati on Wing, Bhubaneswar - March 2015 - 40 copies


![Gsdp all states[1]](https://static.documents.pub/doc/80x56/55d1f1d2bb61eb662c8b45fc/gsdp-all-states1.jpg)


