15

Memorandum
CITY OF DALLASDATE February 2, 2012
TO Trinity River Committee Members:Vonciel Jones Hill (Chair) Scott GriggsLinda Koop (Vice-Chair) Angela HuntMonica Alonzo Delia Jasso
SUBJECT Beckley Ave Closure South of Continental Avenue — Tuesday, February 7, 2012
Due to heavy construction activity at the Margaret Hunt Hill Bridge and safety concerns forthe public commuting on the nearby roadways, the Texas Department of Transportation(TxDOT) will be temporarily closing Beckley Avenue south of Singleton Boulevard andContinental Avenue down to the railroad crossing near Commerce. This closure will beginon February 7, 2012 after the 7:00 a.m. rush hour. The closure will remain in place throughthe completion of all the construction components on the west side of the bridge.
We have already experienced the beauty and excitement of the bridge lighting test and asthe time draws near for the opening of this stunning new icon that crosses the Trinity River,you may get further details about the opening weekend by visitingwww.mhhbridQecelebration.com or contacting the Trinity Trust Foundation at 214-740-1616.
If you have additional questions, please let me know.
Ian, P.E.Assistant City Manager
THE TRINITYDALLAS
c: Honorable Mayor and Members of the City CouncilMary K. Suhm, City ManagerA. C. Gonzalez, First Assistant City ManagerRyan Evans, Assistant City ManagerForest E. Turner, Assistant City ManagerJoey Zapata, Interim Assistant City ManagerJeanne Chipperfield, Chief Financial OfficerRosa A. Rios, Interim City SecretaryThomas P. Perkins, Jr., City AttorneyCraig D. Kinton, City AuditorJudge C. Victor LanderHelena Stevens-Thompson, Asst. to the City ManagerFrank Librio, Director, Public Information OfficeKelly High, Director, Trinity Watershed ManagementRebecca Rasor, P.E., Managing Director, Trinity River Corridor Project
“Dallas, the City that works: diverse, vibrant, and progressive”

newsP.O. Box 133067 Dallas, TX 75313
Phone: 214-320-4480Fax: 214-320-4488
TRAFFIC ADVISORY FOR IMMEDIATE RELEASEFebruary 1,2012
Contact: Michelle Releford Brahama Singh, P.E.TxDOT Public Information Officer TxDOT Construction Engineer214-320-4485/214-317-2422 214.563.7003micheI1c.rc1eford(dtxdot.gov [email protected]
Beckley Avenue to close south of Continental AvenueClosure requiredfor completion of construction
DALLAS — The Texas Department of Transportation (TxDOT) will allow its contractor,J.D. Abrams, to close Beckley Avenue south of Continental Avenue on Tuesday,February 7, 2012 through March 2012. This is necessary to complete the construction ofthe approaches for the Margaret Hunt Hill bridge.
Southbound Canada Drive/North Beckley Avenue traffic will be detoured east ontoContinental Avenue, then south on Riverfront Boulevard, and then west on theCommerce Street bridge back to Beckley. Westbound Continental Avenue traffic with asouthbound Beckley Avenue destination will be detoured west on Singleton Boulevard,then south on Sylvan Avenue and east on Commerce Street back to Beckley.
Northbound Beckley Avenue traffic will be detoured east onto Commerce Street, thennorth on Riverfront Boulevard, and west across the Continental Avenue bridge back toCanada Drive/North Beckley Avenue. Westbound Commerce Street traffic with anorthbound Beckley Avenue! Canada Drive destination will be detoured west onCommerce Street, then north on Sylvan Avenue, and then east on Singleton Boulevardto Canada Drive.
TxDOT strives to minimize construction impacts and maximize safety for the travelingpublic. TxDOT asks motorists to drive carefully through the work zone and appreciatestheir patience during this unique and exciting project.
TxDOT awarded the $47.5 million contract to J.D. Abrams for the Woodall RodgersExtension Project, which is being built in conjunction with the $69.7 million MargaretHunt Hill Bridge over the Trinity River.
For more information about the project please visit www.txdot.gov,www.dailascityhail.com or www.trinityrivercorridor.org.
TexasDepartment
of Transportation
-30-

Memorandum
DATE February 3, 2012 CITY OF DALLAS
TO The Honorable Mayor and Members of the City Council
SUBJECT December 2011 Code Accountability Report Card
“Dallas, the City that Works: Diverse, Vibrant and Progressive”
Attached is the Code Accountability Report Card for December 2011. The report reflects a comparison of December 2010 to December 2011 data and helps identify trends and gauge areas that need improvement between measuring periods. The Community Conduct section of the report card includes an audit of Service Requests for each individual district. The grade for this section gives an indication of the level of citizen outreach and how well districts document the work performed. The District Highlights section provides additional details regarding projects or accomplishments in each district. A Guide to the Code Accountability Report Card is included to provide assistance regarding the details of the Report Card. Code Compliance staff will review the results from the Report Card and take the required actions to adequately address the areas that are trending negatively. Please note that the Report Card grade does not reflect the condition of each code district, but rather the degree of improvement in service request volume as compared to the same time period last fiscal year. Please let me know if you have any additional questions. Joey Zapata Assistant City Manager Attachment cc: Mary K. Suhm, City Manager
Rosa A. Rios, Acting City Secretary Thomas P. Perkins, Jr., City Attorney Craig D. Kinton, City Auditor C. Victor Lander, Administrative Judge Stephanie Cooper, Assistant to the City Manager
A.C. Gonzalez, First Assistant City Manager Ryan S. Evans, Assistant City Manager Jill A. Jordan, P.E., Assistant City Manager Forest E. Turner, Assistant City Manager Jeanne Chipperfield, Chief Financial Officer Frank Librio, Public Information Officer

1
The Overall Average of the quarter’s grades will be updated as each month is added
The Overall Community Grade is the monthly total average of the Service Delivery Grade (50%), Community Code Conduct (10%) and the Service Requests Created by Inspectors (40%)—see below for details
Service Delivery Grade is based on the reduction of Service Requests (SRs) reported through 3-1-1
The goal is to reduce the number of SRs as compared to the same month last year
How much is each grade worth?
5% 5% 5% 5% 5% 5% 5% 5% 5% 5%
10%
40%
A Report Card is issued for each of the seven (7) districts
Service Requests Created by Inspectors indicates the percentage of cases created proactively by inspectors
The goal is to increase the percent of proactive SRs by 10% as compared to
The District Highlights (Comments) box pro-vides an area for addi-tional explanation
The Grading Table is used to determine the Service Delivery Grade
The District Stats box details the total volume of SRs as well as the most Common as compared to the previous fiscal year
Community Code Conduct reflects the results of an audit of services requests from each district
The audit examines activities such as: customer contact, whether the case was closed within the Service Level Agree-ment, and whether all activities were properly completed
Page 2
CCS-FRM-003 Effective Date 02/19/2010 Rev 3
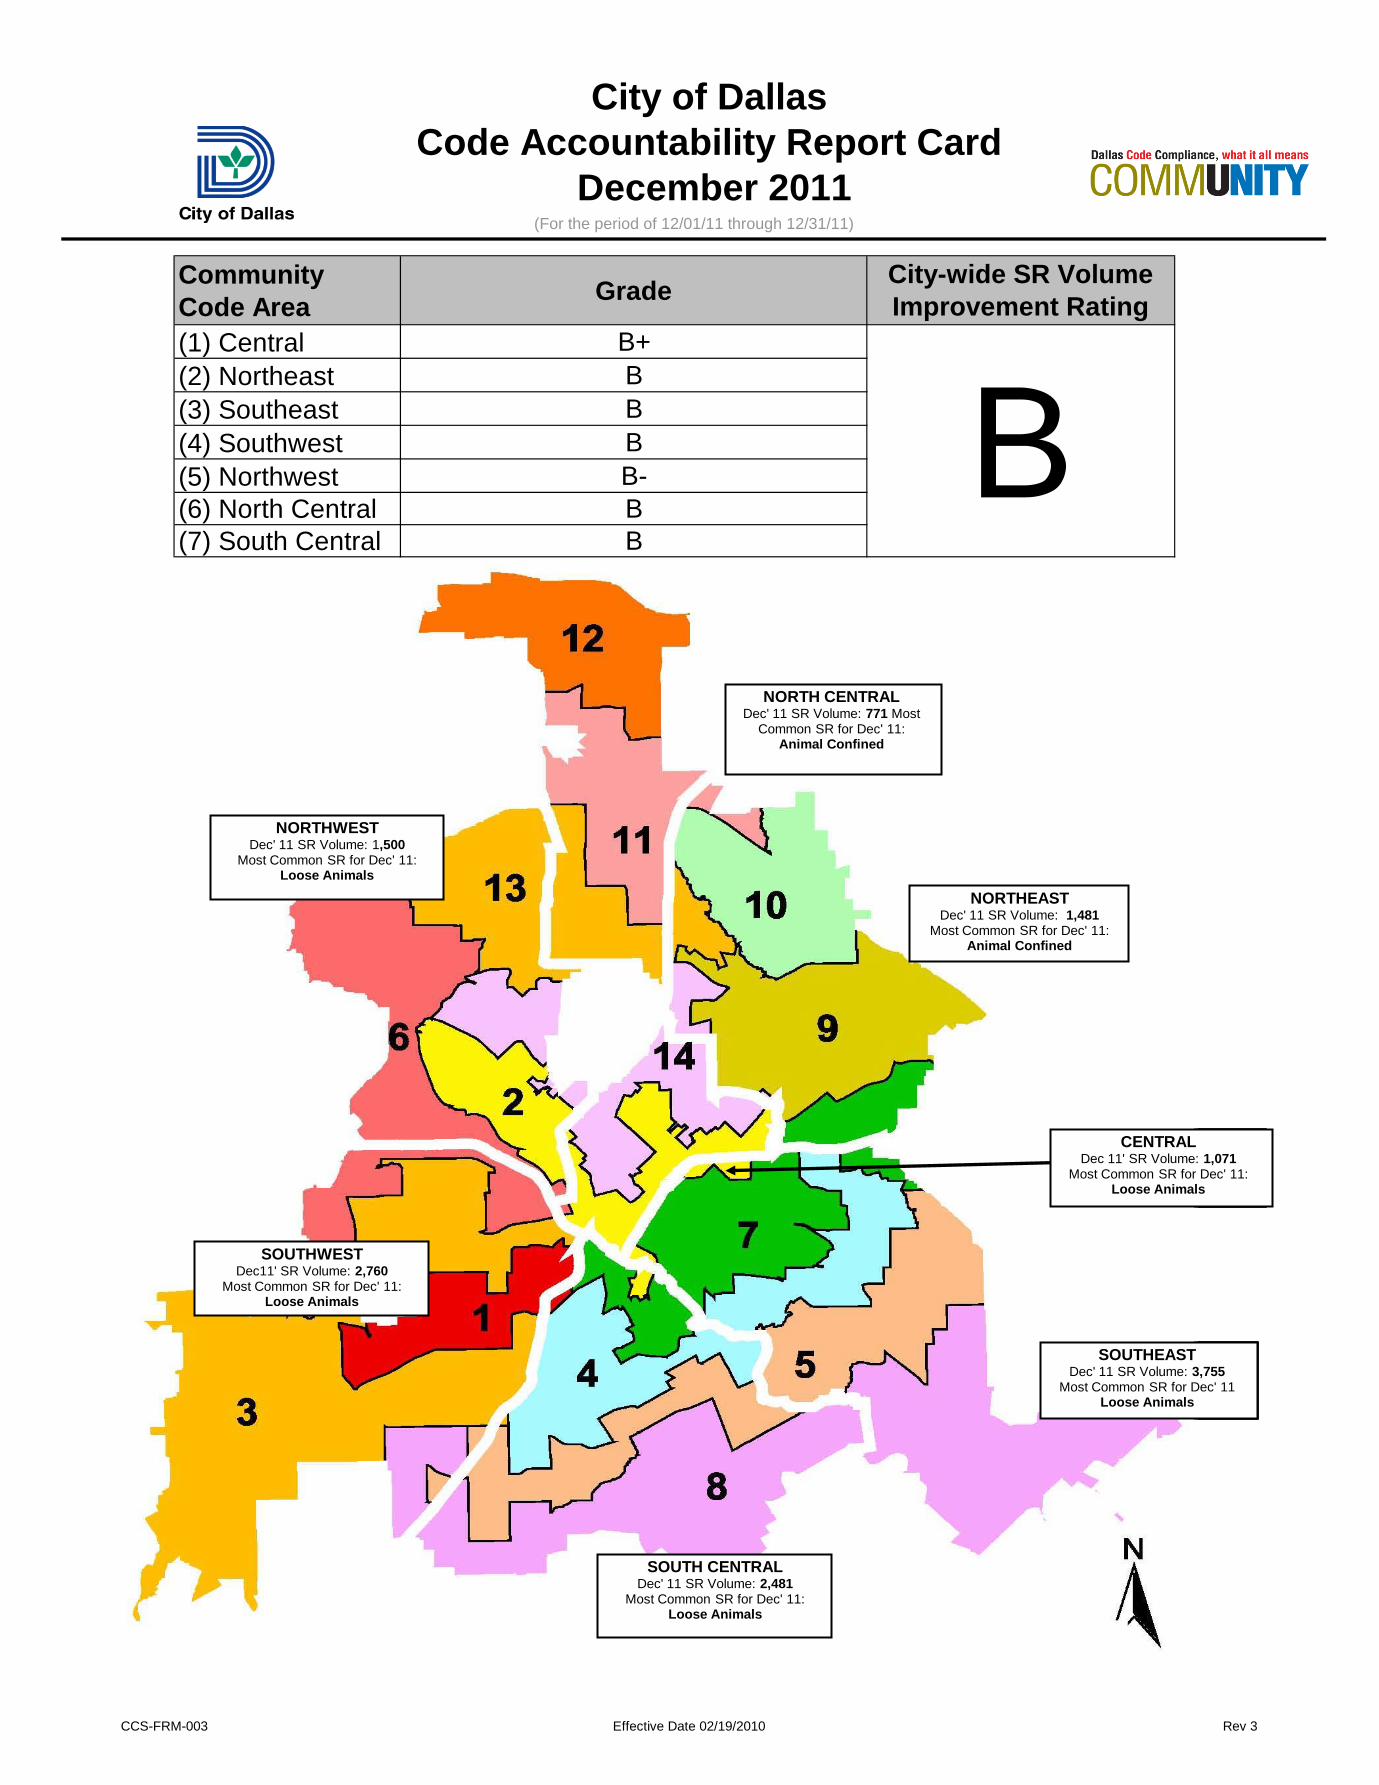
Community Code Area Grade
(1) Central B+(2) Northeast B(3) Southeast B(4) Southwest B(5) Northwest B-(6) North Central B(7) South Central B
38%
B
City of DallasCode Accountability Report Card
December 2011(For the period of 12/01/11 through 12/31/11)
City-wide SR Volume Improvement Rating
NORTHWESTAug 09 SR Volume: 2,817
Most Common SR for Aug 09:High Weeds
SOUTHWESTAug 09 SR Volume: 5,272
Most Common SR for Aug 09:High Weeds
NORTHEASTAug 09 SR Volume: 3,322
Most Common SR for Aug 09:High Weeds
NORTH CENTRALAug 09 SR Volume: 1,404
Most Common SR for Aug 09:High Weeds
SOUTHEASTAug 09 SR Volume: 7,557
Most Common SR for Aug 09:High Weeds
CENTRALAug 09 SR Volume: 2,209
Most Common SR for Aug 09: High Weeds
NORTHWESTJan 10 SR Volume: 1,525
Most Common SR for Jan 10:Loose Animals
SOUTHWESTJan 10 SR Volume: 3,212
Most Common SR for Jan 10:Loose Animals
NORTHEASTJan 10 SR Volume: 1,897
Most Common SR for Jan 10:Loose Animals
NORTH CENTRALJan 10 SR Volume: 1,091
Most Common SR for Jan 10:Animal Confined
SOUTHEASTJan 10 SR Volume: 3,643
Most Common SR for Jan 10:Loose Animals
CENTRALJan 10 SR Volume: 1,370
Most Common SR for Jan 10: Loose Animals
NORTHWESTAug 09 SR Volume: 2,817
Most Common SR for Aug 09:High Weeds
SOUTHWESTAug 09 SR Volume: 5,272
Most Common SR for Aug 09:High Weeds
NORTHEASTAug 09 SR Volume: 3,322
Most Common SR for Aug 09:High Weeds
NORTH CENTRALAug 09 SR Volume: 1,404
Most Common SR for Aug 09:High Weeds
SOUTHEASTAug 09 SR Volume: 7,557
Most Common SR for Aug 09:High Weeds
CENTRALAug 09 SR Volume: 2,209
Most Common SR for Aug 09: High Weeds
NORTHWESTDec' 11 SR Volume: 1,500
Most Common SR for Dec' 11:Loose Animals
SOUTHWESTDec11' SR Volume: 2,760
Most Common SR for Dec' 11:Loose Animals
NORTHEASTDec' 11 SR Volume: 1,481
Most Common SR for Dec' 11:Animal Confined
NORTH CENTRALDec' 11 SR Volume: 771 Most
Common SR for Dec' 11:Animal Confined
SOUTHEASTDec' 11 SR Volume: 3,755
Most Common SR for Dec' 11 Loose Animals
SOUTH CENTRALDec' 11 SR Volume: 2,481
Most Common SR for Dec' 11:Loose Animals
CENTRALDec 11' SR Volume: 1,071
Most Common SR for Dec' 11: Loose Animals

CCS-FRM-003 Effective Date 02/19/2010 Rev 3
Oct '11 Nov '11 Dec '11 Overall Average
Service Delivery Indicators Dec 10 Actual
Dec 11 Actual
% Change Grade
Signs 6 10 67%Animal Loose/Aggressive 75 64 -15%Litter 18 18 0%Junk Motor Vehicle 6 5 -17%Bulky Trash 19 30 58%Substandard Structure 39 24 -38%Animal Confined 50 42 -16%High Weeds 13 13 0%Illegal Dumping 10 10 0%Graffiti 5 8 60%
Grade
Service Delivery Indicators Dec 10 Actual
FY 12 Target
Dec 11 Actual Grade
Percentage of service requests created by inspectors in the field 40% 50% 44% B+
Community Code Conduct (40% of overall)
1st Qtr FY 11 - 12
BB+B-
Central Community Code experienced an increase in Bulky Trash violations in December. Staff will make efforts to educate the public on their correct bulk trash pick up weeks. District efforts include the following: (211) Illegal Signs removed from Public Right of Way ( 30) Illegally Dumped Tires removed from Right of Way (11) Graffiti locations abated by Code Officer The Quality of Service performed by Code Compliance Staff scored well overall this month. Efforts will be made to maintain the level of service demonstrated this month.
A-
Reduction of Top 10 frequent Cases (Acceptable reduction target is 10%)
District Highlights (Comments)
Service Delivery Grade (Each 3% of overall)
Service Requests Created by Inspectors (30% of overall)
Service Request Audit - 45 SRs @ 5% Dec Margin of error
The Audit of Central has shown the following:* 91% of sampled requests contained detailed notes* 96% of sampled requests had all activities properly completed* 93% of sampled requests had details to prove customer contact was made* 88% of sampled requests had all photos and documents attached* 100% of sampled requests were closed within their Service Level Agreement
C
Community Code: (1) Central
City of DallasCode Accountability Report Card
December 2011
B+
(For the period of 12/01/11 through 12/31/11)
B-
Dec '11 Central SR Volume Improvement Rating
Grading Table% Change Grade-27.5% & Below A+-25.0% A-22.5% A--20.0% B+-17.5% B-15.0% B--12.5% C+-10.0% C-7.5% C--5.0% D+-2.5% D0.0% D-+2.5 plus F
Central Stats(Volume numbers include 311 and inspector created Service Requests)
FY2011-2012Total Volume: 1,071Most Common SR: AnimalLoose
FY2010-2011Total Volume: 1,171Most Common SR : Loose Animals

CCS-FRM-003 Effective Date 02/19/2010 Rev 3
(For the period of 12/01/11 through 12/31/11)
Oct '11 Nov '11 Dec '11 Overall Average
Service Delivery Indicators Dec 10 Actual
Dec 11 Actual
% Change Grade
Bulky Trash 115 68 -41%Animal Loose/Aggessive 142 138 -3%Animal Confined 110 139 26%Litter 37 34 -8%Substandard Structure 58 64 10%Parking Unapproved Surface 9 13 44%Obstruction Alley/Sidewalk/Street 8 26 225%Animal Sick/Injured 48 41 -15%Junk Motor Vehicle 25 12 -52%Animal Cruelty 59 40 -32%
Grade
Service Delivery Indicators Dec 10 Actual
FY 12 Target
Dec 10 Actual Grade
Percentage of service requests created by inspectors in the field 59% 60% 62% A+
B
B
Community Code Conduct (40% of overall)
Service Request Audit - 64 SRs @ 5% Dec Margin of error
C-
Service Requests Created by Inspectors (30% of overall)
The Audit of Northeast has shown the following:* 88% of sampled requests contained detailed notes* 81% of sampled requests had all activities properly completed* 70% of sampled requests had details to prove customer contact was made* 85% of sampled requests had all photos and documents attached* 100% of sampled requests were closed within their Service Level Agreement
The top ten most frequently requested code cases for Northeast saw several SR types with increases compared to the same time period last year. Case types with increases will be addressed with sweeps and coordination including Animal Services over the next month.
The level of proactive work performed by Code Compliance Staff came in above target with 62% of Service Requests received created by staff in the field rather than the public. The target was 60%.
Northeast management will work closely with their staff to ensure that staff that are working these cases are taking the proper time to fully document when customer contact is made by request.
District Highlights (Comments)
B
City of DallasCode Accountability Report Card
December 2011
B
Service Delivery Grade (Each 3% of overall)
Reduction of Top 10 frequent Cases (Acceptable reduction target is 10%)
Community Code: (2) Northeast
Dec'11 Northeast SR Volume Improvement Rating
1st Qtr FY 11 - 12
B+ B
Grading Table% Change Grade-27.5% & Below A+-25.0% A-22.5% A--20.0% B+-17.5% B-15.0% B--12.5% C+-10.0% C-7.5% C--5.0% D+-2.5% D0.0% D-+2.5 plus F
Northeast Stats(Volume numbers include 311 and inspector created Service Requests)
FY2011-2012Total Volume: 1,481Most Common SR: AnimalConfined
FY2010-2011Total Volume: 1,712Most Common SR : Loose Animals

CCS-FRM-003 Effective Date 02/19/2010 Rev 3
Oct '11 Nov '11 Dec '11 Overall Average
Service Delivery Indicators Dec 10 Actual
Dec 11 Actual
% Change Grade
Signs 29 42 45%Animal Loose/Aggressive 353 461 31%Litter 55 73 33%Bulky Trash 80 20 -75%Substandart Structure 149 148 -1%High Weeds 48 36 -25%Animal Confined 195 166 -15%Parking Unappproved Surface 27 17 -37%Illegal Dumping 40 36 -10%Animal Sick/Injured 89 104 17%
Grade
Service Delivery Indicators Dec 10 Actual
FY 12 Target
Dec 11 Actual Grade
Percentage of service requests created by inspectors in the field 41% 51% 49% A+
The top ten most frequently requested code cases for Southeast saw several SR types with increases compared to the same time period last year. Case types with increases will be addressed with coordinated sweeps with Nuisance Abatement and Animal Services over the next month.
The level of proactive work performed by Code Compliance Staff came in around target with 49% of Service Requests received created by staff in the field rather than the public. The target was 51%.
The Quality of Service performed by Code Compliance Staff scored well overall this month. Efforts will be made to maintain the level of service demonstrated this month.
Reduction of Top 10 frequent Cases (Acceptable reduction target is 10%)
Community Code: (3) Southeast
C+
Service Delivery Grade (Each 3% of overall)
BB-
Service Requests Created by Inspectors (30% of overall)
Service Request Audit - 98 SRs @ 5% Dec Margin of error
A-
1st Qtr FY 11 - 12
Community Code Conduct (40% of overall)
D
District Highlights (Comments)
The Audit of Southeast has shown the following: *80% of sampled requests contained detailed notes*100% of sampled requests had all activities properly completed*93% of sampled requests had details to prove customer contact was made*75% of sampled requests had all photos and documents attached*100% of sampled requests were closed within their Service Level Agreement
City of DallasCode Accountability Report Card
December 2011
B
(For the period of 12/01/11 through 12/31/11)
Dec '11 Southeast SR Volume Improvement Rating
B-
Grading Table% Change Grade-27.5% & Below A+-25.0% A-22.5% A--20.0% B+-17.5% B-15.0% B--12.5% C+-10.0% C-7.5% C--5.0% D+-2.5% D0.0% D-+2.5 plus F
Southeast Stats(Volume numbers include 311 and inspector created Service Requests)
FY2011-2012Total Volume: 3,755Most Common SR: Loose Animals
FY2010-2011Total Volume: 4,060Most Common SR: Loose Animals
CCS-FRM-003 Effective Date 02/19/2010 Rev 3
Oct '11 Nov '11 Dec '11 Overall Average
Service Delivery Indicators Dec 10 Actual
Dec 11 Actual
% Change Grade
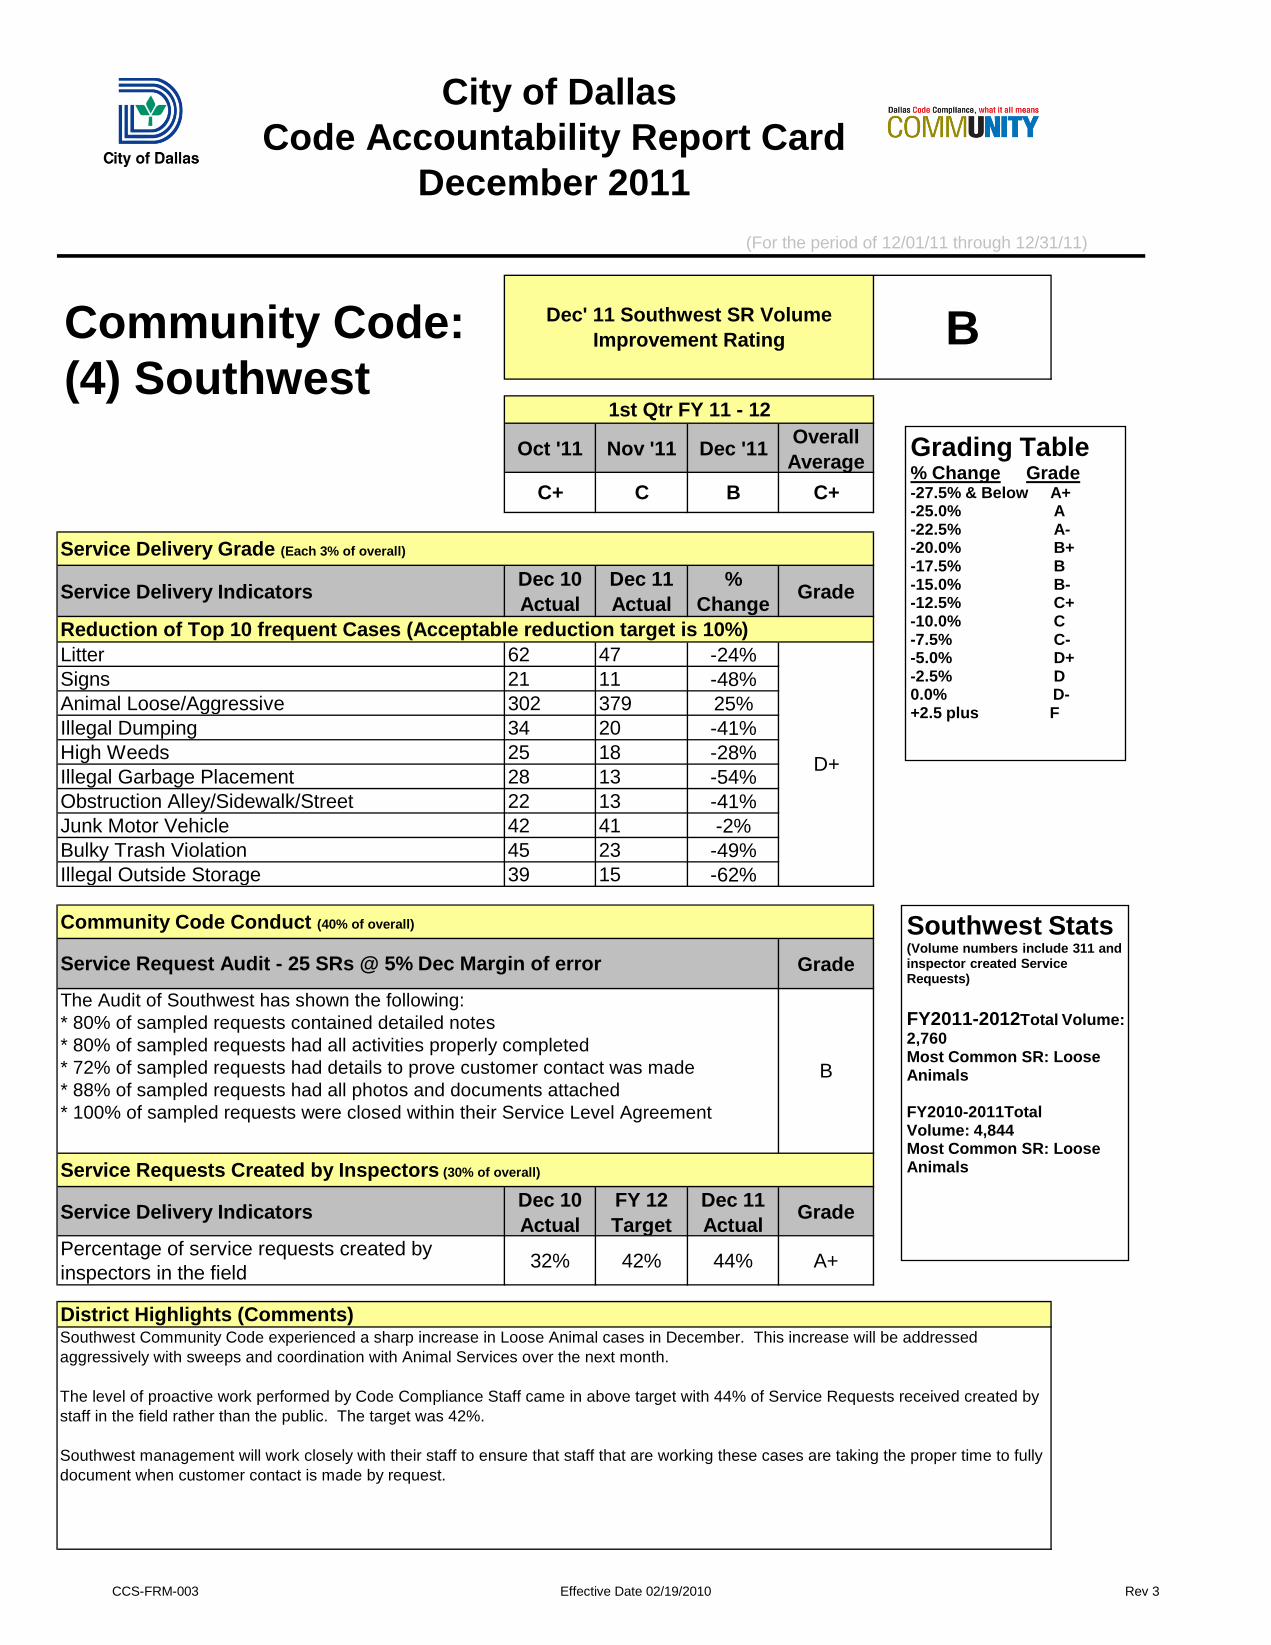
Litter 62 47 -24%Signs 21 11 -48%Animal Loose/Aggressive 302 379 25%Illegal Dumping 34 20 -41%High Weeds 25 18 -28%Illegal Garbage Placement 28 13 -54%Obstruction Alley/Sidewalk/Street 22 13 -41%Junk Motor Vehicle 42 41 -2%Bulky Trash Violation 45 23 -49%Illegal Outside Storage 39 15 -62%
Grade
Service Delivery Indicators Dec 10 Actual
FY 12 Target
Dec 11 Actual Grade
Percentage of service requests created by inspectors in the field 32% 42% 44% A+
(For the period of 12/01/11 through 12/31/11)
Community Code: (4) Southwest
Dec' 11 Southwest SR Volume Improvement Rating
1st Qtr FY 11 - 12
Southwest Community Code experienced a sharp increase in Loose Animal cases in December. This increase will be addressed aggressively with sweeps and coordination with Animal Services over the next month.
The level of proactive work performed by Code Compliance Staff came in above target with 44% of Service Requests received created by staff in the field rather than the public. The target was 42%.
Southwest management will work closely with their staff to ensure that staff that are working these cases are taking the proper time to fully document when customer contact is made by request.
Community Code Conduct (40% of overall)
Service Requests Created by Inspectors (30% of overall)
Service Request Audit - 25 SRs @ 5% Dec Margin of error
District Highlights (Comments)
The Audit of Southwest has shown the following:* 80% of sampled requests contained detailed notes* 80% of sampled requests had all activities properly completed* 72% of sampled requests had details to prove customer contact was made* 88% of sampled requests had all photos and documents attached* 100% of sampled requests were closed within their Service Level Agreement
B
Service Delivery Grade (Each 3% of overall)
Reduction of Top 10 frequent Cases (Acceptable reduction target is 10%)
D+
City of DallasCode Accountability Report Card
December 2011
B
C+ C B C+
Grading Table% Change Grade-27.5% & Below A+-25.0% A-22.5% A--20.0% B+-17.5% B-15.0% B--12.5% C+-10.0% C-7.5% C--5.0% D+-2.5% D0.0% D-+2.5 plus F
Southwest Stats(Volume numbers include 311 and inspector created Service Requests)
FY2011-2012Total Volume: 2,760Most Common SR: Loose Animals
FY2010-2011TotalVolume: 4,844Most Common SR: Loose Animals
CCS-FRM-003 Effective Date 02/19/2010 Rev 3
Oct '11 Nov '11 Dec '11 Overall Average
Service Delivery Indicators Dec 10 Actual
Dec 11 Actual
% Change Grade
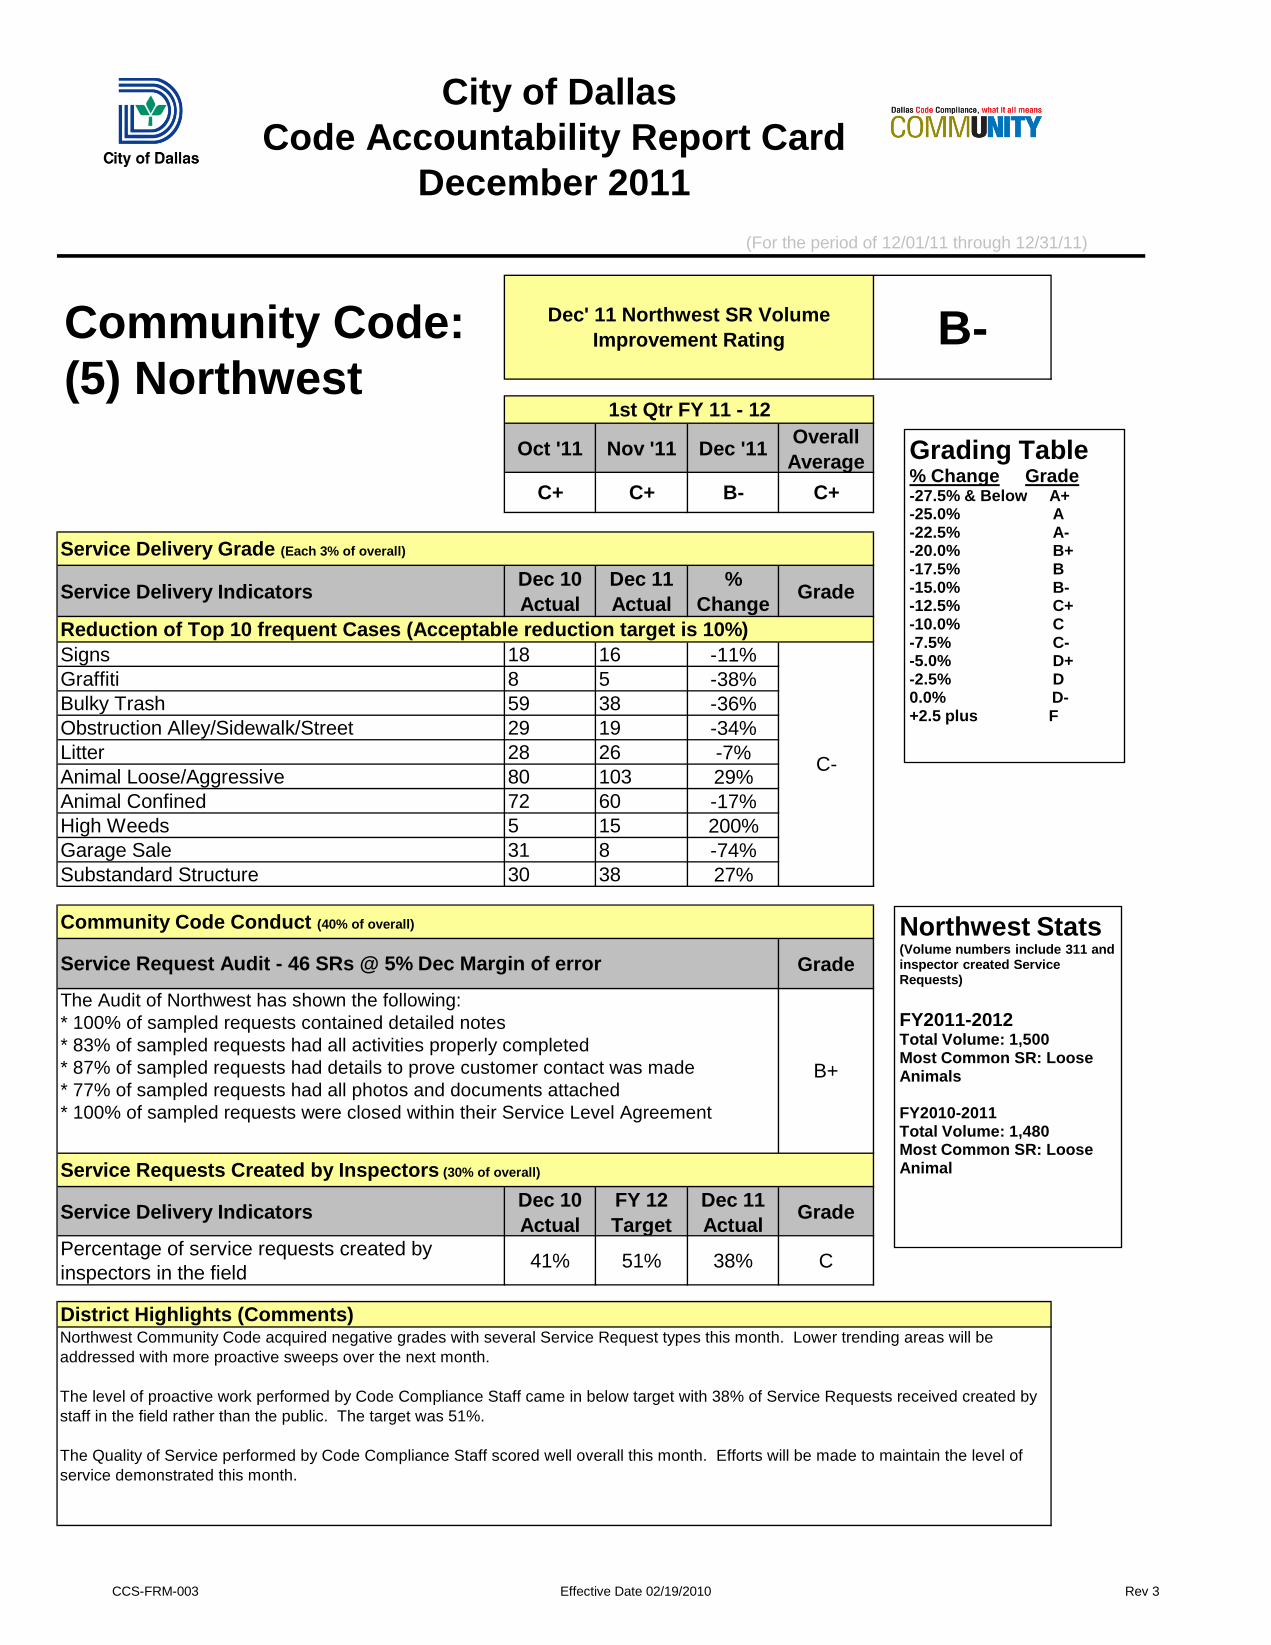
Signs 18 16 -11%Graffiti 8 5 -38%Bulky Trash 59 38 -36%Obstruction Alley/Sidewalk/Street 29 19 -34%Litter 28 26 -7%Animal Loose/Aggressive 80 103 29%Animal Confined 72 60 -17%High Weeds 5 15 200%Garage Sale 31 8 -74%Substandard Structure 30 38 27%
Grade
Service Delivery Indicators Dec 10 Actual
FY 12 Target
Dec 11 Actual Grade
Percentage of service requests created by inspectors in the field 41% 51% 38% C
B+
Northwest Community Code acquired negative grades with several Service Request types this month. Lower trending areas will be addressed with more proactive sweeps over the next month.
The level of proactive work performed by Code Compliance Staff came in below target with 38% of Service Requests received created by staff in the field rather than the public. The target was 51%.
The Quality of Service performed by Code Compliance Staff scored well overall this month. Efforts will be made to maintain the level of service demonstrated this month.
District Highlights (Comments)
C+
Community Code Conduct (40% of overall)
Service Requests Created by Inspectors (30% of overall)
Dec' 11 Northwest SR Volume Improvement Rating
C+ C+
Service Request Audit - 46 SRs @ 5% Dec Margin of error
B-
Service Delivery Grade (Each 3% of overall)
Reduction of Top 10 frequent Cases (Acceptable reduction target is 10%)
The Audit of Northwest has shown the following: * 100% of sampled requests contained detailed notes* 83% of sampled requests had all activities properly completed* 87% of sampled requests had details to prove customer contact was made* 77% of sampled requests had all photos and documents attached* 100% of sampled requests were closed within their Service Level Agreement
1st Qtr FY 11 - 12
City of DallasCode Accountability Report Card
December 2011(For the period of 12/01/11 through 12/31/11)
B-Community Code: (5) Northwest
C-
Grading Table% Change Grade-27.5% & Below A+-25.0% A-22.5% A--20.0% B+-17.5% B-15.0% B--12.5% C+-10.0% C-7.5% C--5.0% D+-2.5% D0.0% D-+2.5 plus F
Northwest Stats(Volume numbers include 311 and inspector created Service Requests)
FY2011-2012Total Volume: 1,500Most Common SR: LooseAnimals
FY2010-2011Total Volume: 1,480Most Common SR: Loose Animal

CCS-FRM-003 Effective Date 02/19/2010 Rev 3
Oct '11 Nov '11 Dec '11 Overall Average
Service Delivery Indicators Dec 10 Actual
Dec 11 Actual
% Change Grade
Signs 26 8 -69%Bulky Trash 65 33 -49%Animal Confined 58 58 0%Litter 21 23 10%Obstructionj Alley/Sidewalk/Street 17 11 -35%Animal Loose 28 34 21%Animal Sick/Injured 20 23 15%Substandard Structure 15 22 47%High Weeds 7 7 0%Animal Noisy 18 21 17%
Grade
Service Delivery Indicators Dec 10 Actual
FY 12 Target
Dec 11 Actual Grade
Percentage of service requests created by inspectors in the field 55% 60% 55% A-
C+C+
(For the period of 12/01/11 through 12/31/11)
Service Request Audit - 26 SRs @ 5% Dec Margin of error
A
The top ten most frequently requested code cases for North Central saw several SR types with increases compared to the same time period last year. Case types with increases will be addressed with educational sweeps over the next month. Neighborhood activities include the following.
• 2 Sweeps- Signs and alley obstruction• 39 Door hangers/Literature• 238 Signs pulled
The Quality of Service performed by Code Compliance Staff scored well overall this month. Efforts will be made to maintain the level of service demonstrated this month.
C
Service Delivery Grade (Each 3% of overall)
District Highlights (Comments)
Service Requests Created by Inspectors (30% of overall)
Reduction of Top 10 frequent Cases (Acceptable reduction target is 10%)
The Audit of North Central has shown the following: * 100% of sampled requests contained detailed notes* 88% of sampled requests had all activities properly completed* 81% of sampled requests had details to prove customer contact was made* 95% of sampled requests had all photos and documents attached* 100% of sampled requests were closed within their Service Level Agreement
City of DallasCode Accountability Report Card
December 2011
BDec '11 North Central SR Volume Improvement Rating
1st Qtr FY 11 - 12
B
Community Code Conduct (40% of overall)
Community Code: (6) North Central
D
Grading Table% Change Grade-27.5% & Below A+-25.0% A-22.5% A--20.0% B+-17.5% B-15.0% B--12.5% C+-10.0% C-7.5% C--5.0% D+-2.5% D0.0% D-+2.5 plus F
North Central Stats(Volume numbers include 311 and inspector created Service Requests)FY2011-2012Total Volume: 771Most Common SR: AnimalConfined
FY2010-2011Total Volume: 862Most Common SR: Bulky Trash

CCS-FRM-003 Effective Date 02/19//2010 Rev 3
Oct '11 Nov'11 Dec '11 Overall Average
Service Delivery Indicators Dec 10 Actual
Dec 11 Actual
% Change Grade
Animal Loose/Aggressive 328 376 15%Obstruction Alley/Sidewalk/Street 27 11 -59%High Weeds 33 87 164%Animal Confined 155 132 -15%Litter 39 67 72%Junk Motor Vehicle 28 10 -64%Illegal Dumping 33 32 -3%Parking Unapproved Surface 48 14 -71%Bulky Trash 43 37 -14%Signs 4 18 350%
Grade
Service Delivery Indicators Dec 10 Actual
FY 12 Target
Dec 11 Actual Grade
Percentage of service requests created by inspectors in the field 50% 60% 62% A+
B+
The top ten most frequently requested code cases for South Central saw several SR types with increases compared to the same time period last year. Case types with increases will be addressed with coordinated sweeps with Nuisance Abatement over the next month.
The level of proactive work performed by Code Compliance Staff came in above target with 62% of Service Requests received created by staff in the field rather than the public. The target was 60%.
The Quality of Service performed by Code Compliance Staff scored well overall, but there is room for improvement in the areas of proving customer contact was made. Code Compliance Management will work closely with their staff to ensure that staff working these cases take the proper time to fully document when customer contact is made by request.
District Highlights (Comments)
B-
Community Code Conduct (40% of overall)
Service Requests Created by Inspectors (30% of overall)
Dec '11 South Central SR Volume Improvement Rating
B- B
Service Request Audit - 55 SRs @ 5% Dec Margin of error
B
Service Delivery Grade (Each 3% of overall)
Reduction of Top 10 frequent Cases (Acceptable reduction target is 10%)
The Audit of South Central has shown the following: * 80% of sampled requests contained detailed notes* 89% of sampled requests had all activities properly completed * 82% of sampled requests had details to prove customer contact was made* 94% of sampled requests had all photos and documents attached* 100% of sampled requests were closed within their Service Level Agreement
1st Qtr FY 11 - 12
City of DallasCode Accountability Report Card
December 2011(For the period of 12/01/11 through 12/31/11)
BCommunity Code: (7) South Central
D
Grading Table% Change Grade-27.5% & Below A+-25.0% A-22.5% A--20.0% B+-17.5% B-15.0% B--12.5% C+-10.0% C-7.5% C--5.0% D+-2.5% D0.0% D-+2.5 plus F
South Central Stats(Volume numbers include 311 and inspector created Service Requests)
FY2011-2012Total Volume: 2,481Most Common SR: Loose Animals
FY2010-2011Total Volume: 2,759Most Common SR: Loose Animals


