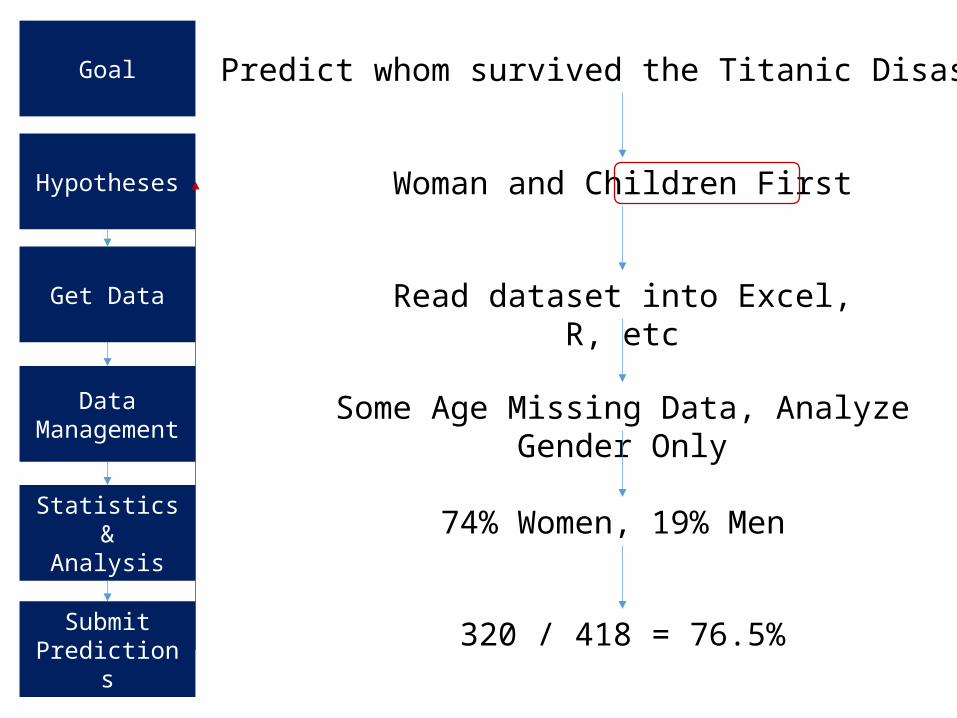
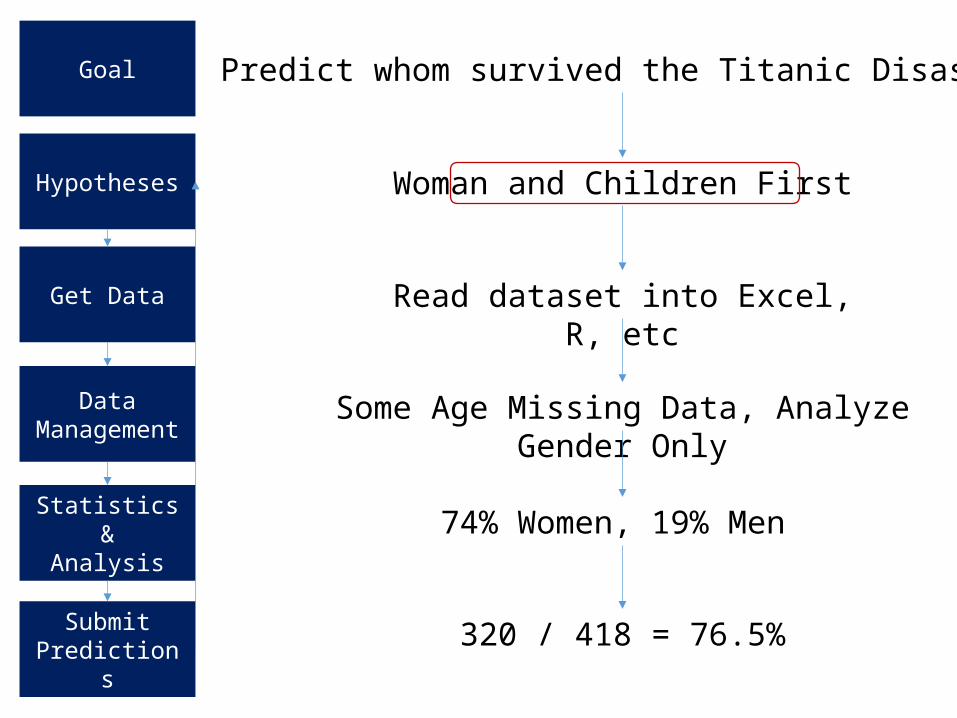
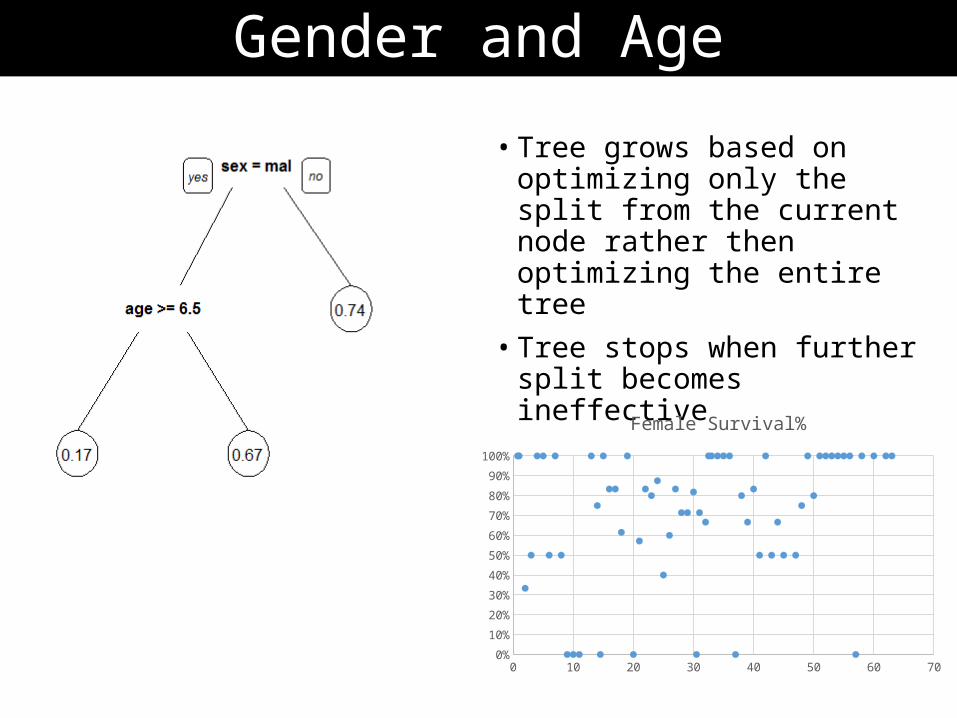
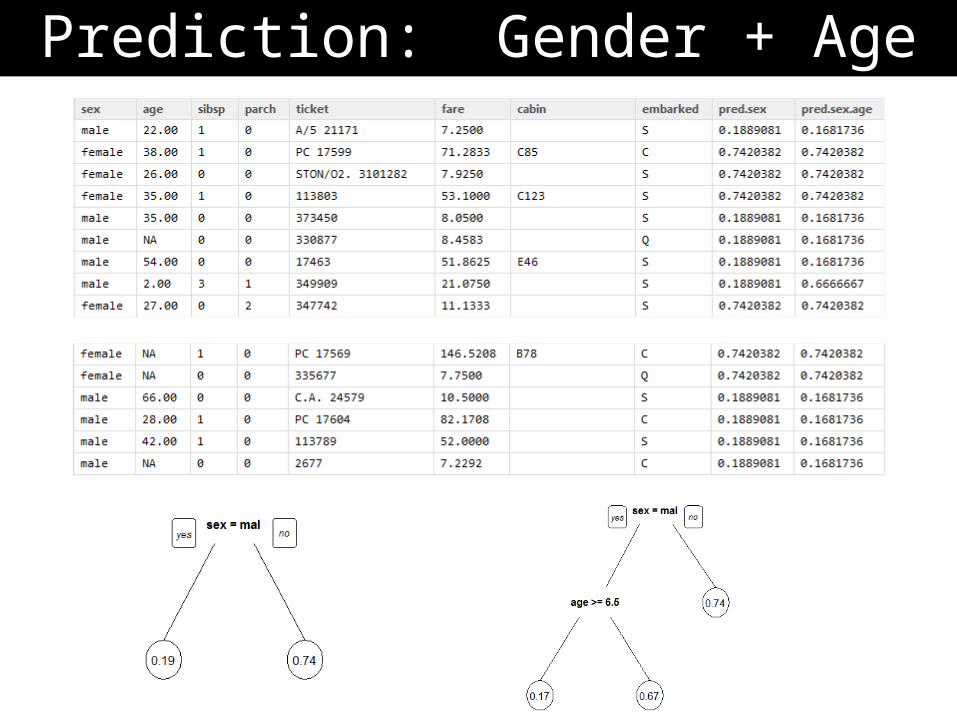
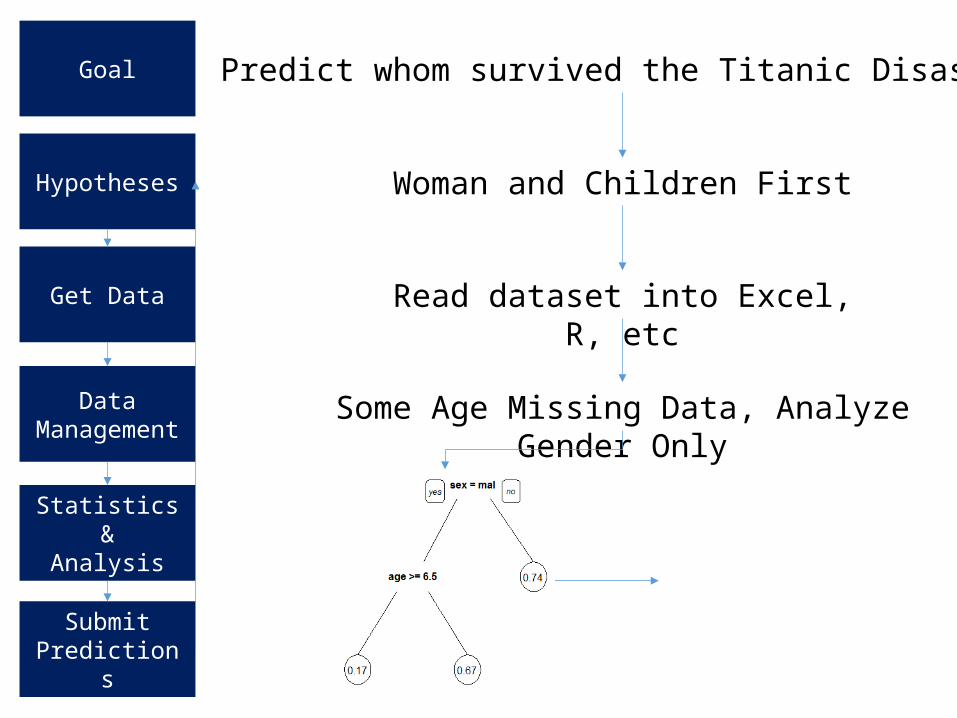
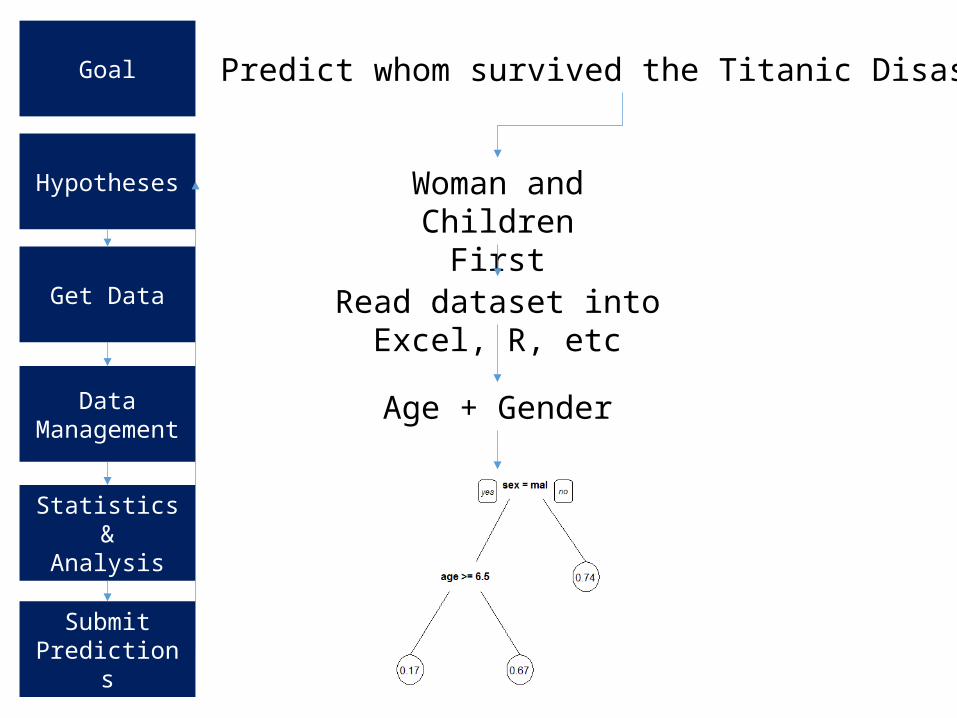
Goal. Predict whom survived the Titanic Disaster. Hypotheses. Woman and Children First. Get Data. Read dataset into Excel, R, etc. Data Management. Some Age Missing Data, Analyze Gender Only. Statistics & Analysis. 74% Women, 19% Men . Submit Predictions. 320 / 418 = 76.5%. - PowerPoint PPT Presentation
Submit Prediction s Statistics & Analysis Data Management Hypotheses Goal Get Data Predict whom survived the Titanic Disas Woman and Children First Read dataset into Excel, R, etc Some Age Missing Data, Analyze Gender Only 74% Women, 19% Men 320 / 418 = 76.5%
Transcript
Submit Predictions
Statistics &Analysis
Data Management
Hypotheses
Goal
Get Data
Predict whom survived the Titanic Disaster
Woman and Children First
Read dataset into Excel, R, etc
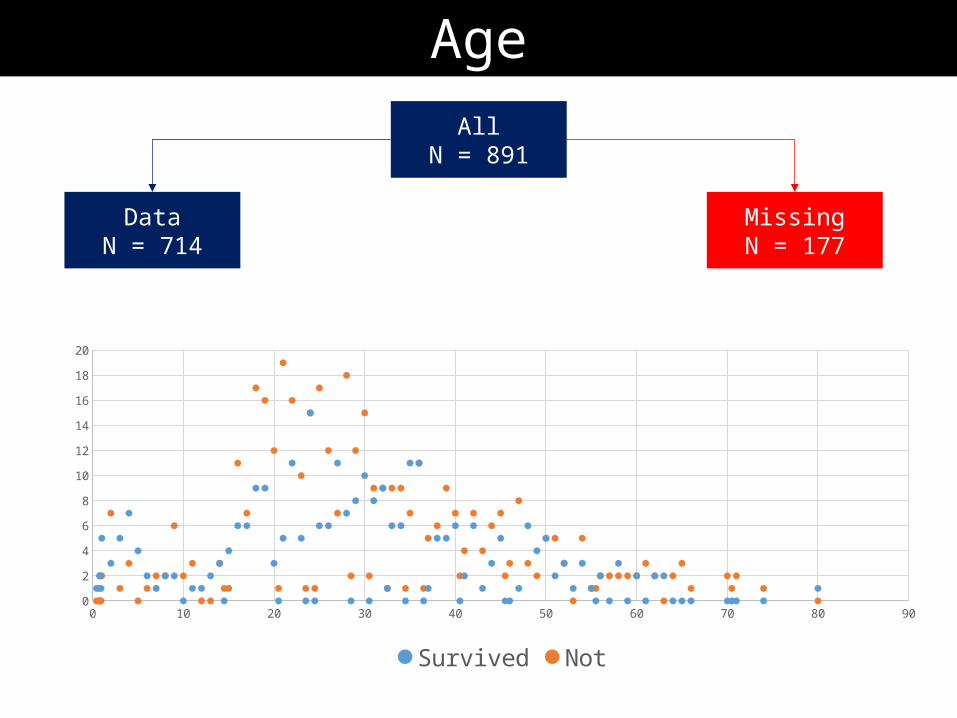
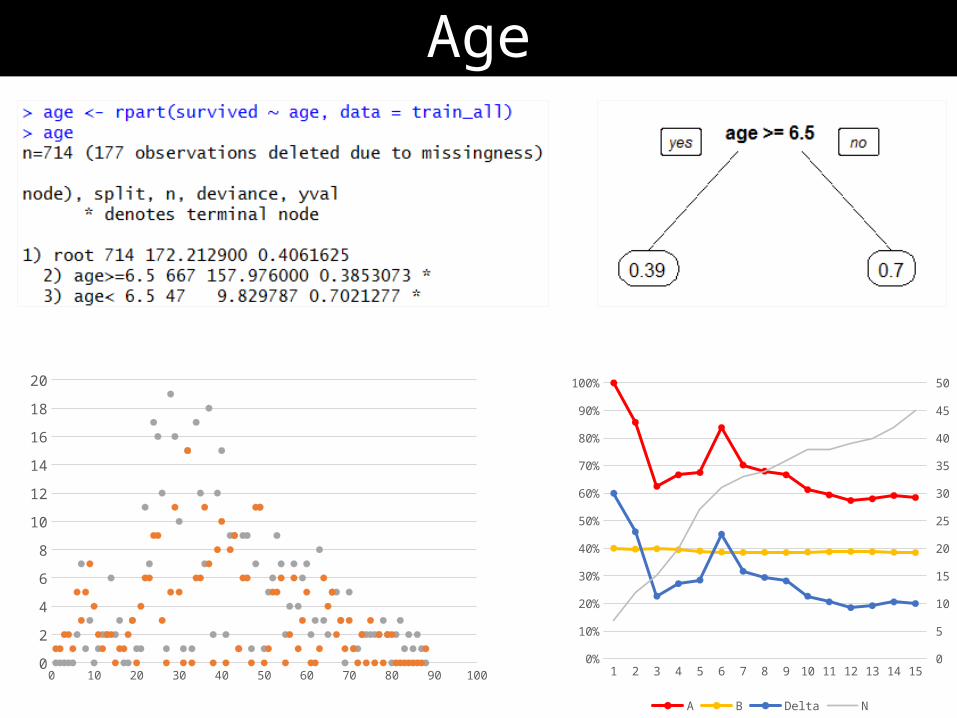
Some Age Missing Data, Analyze Gender Only
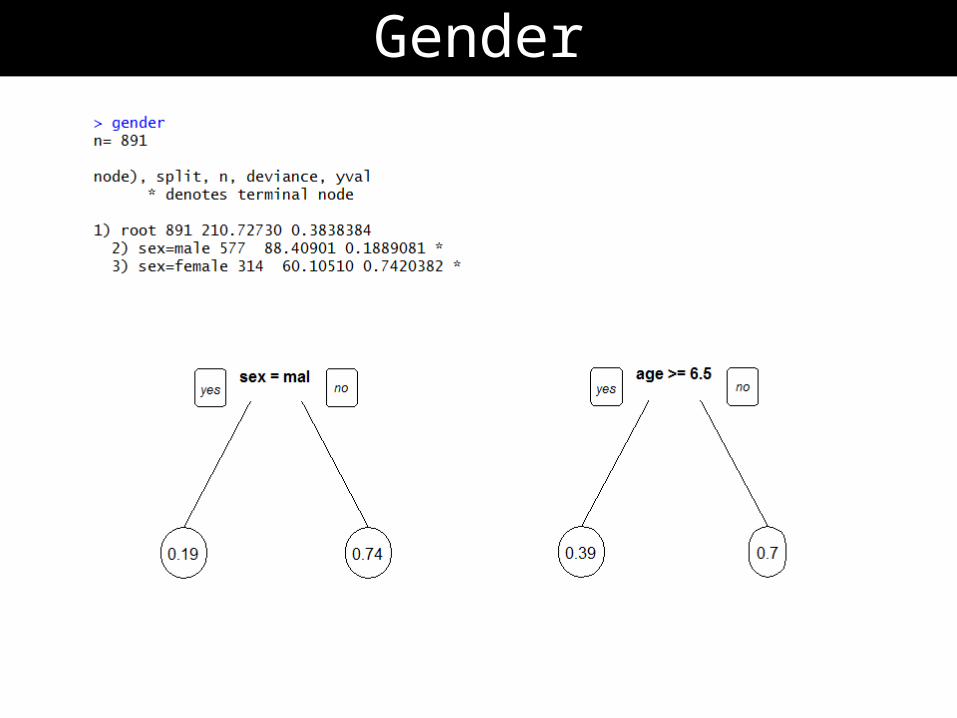
74% Women, 19% Men
320 / 418 = 76.5%
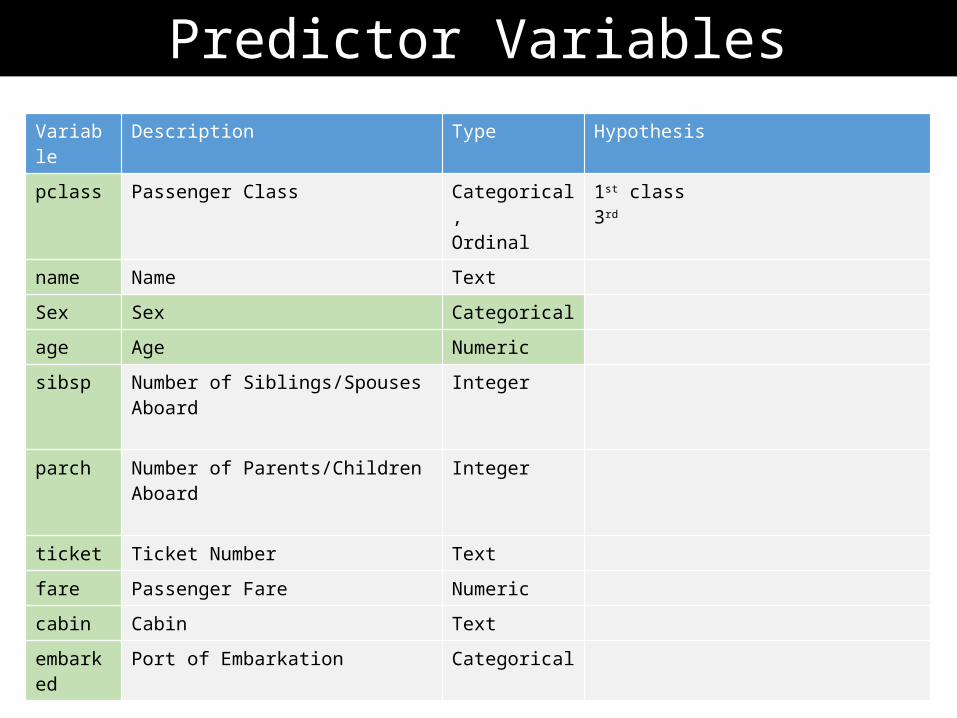
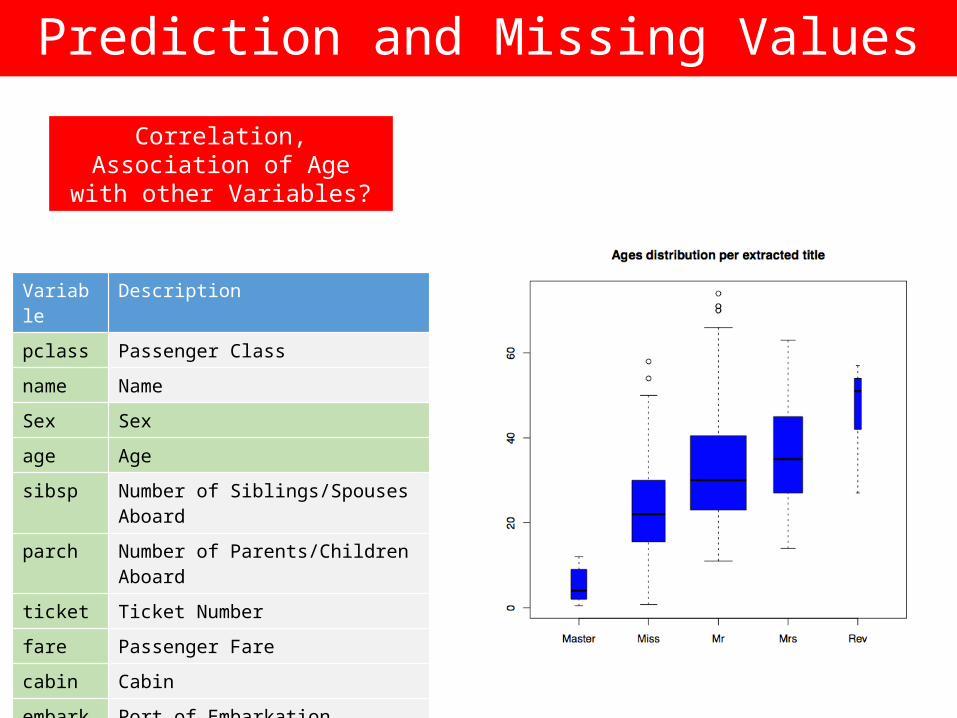
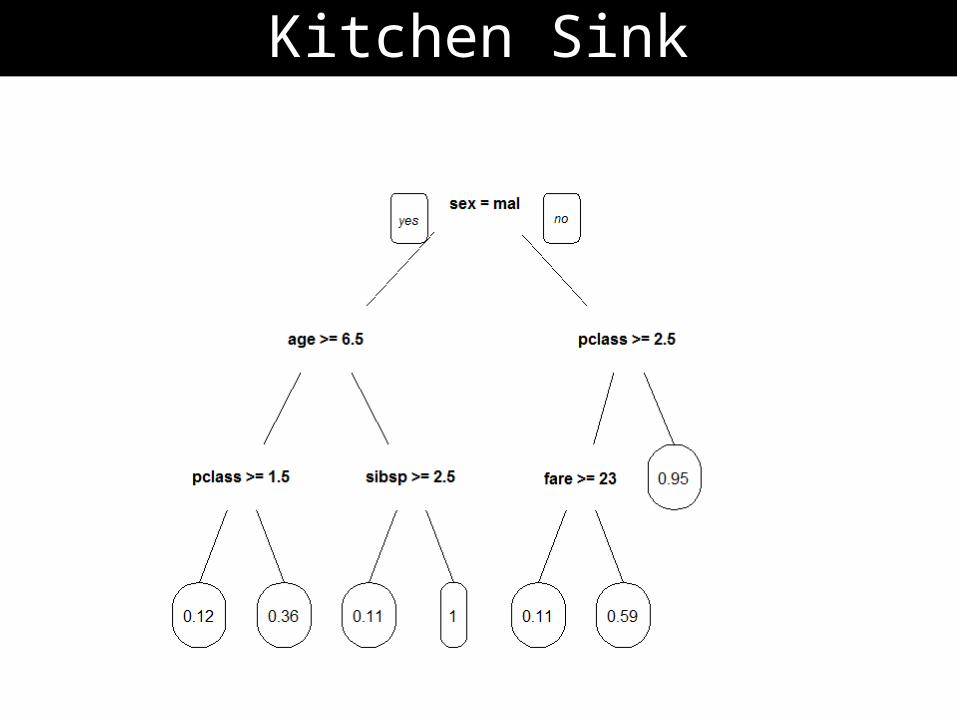
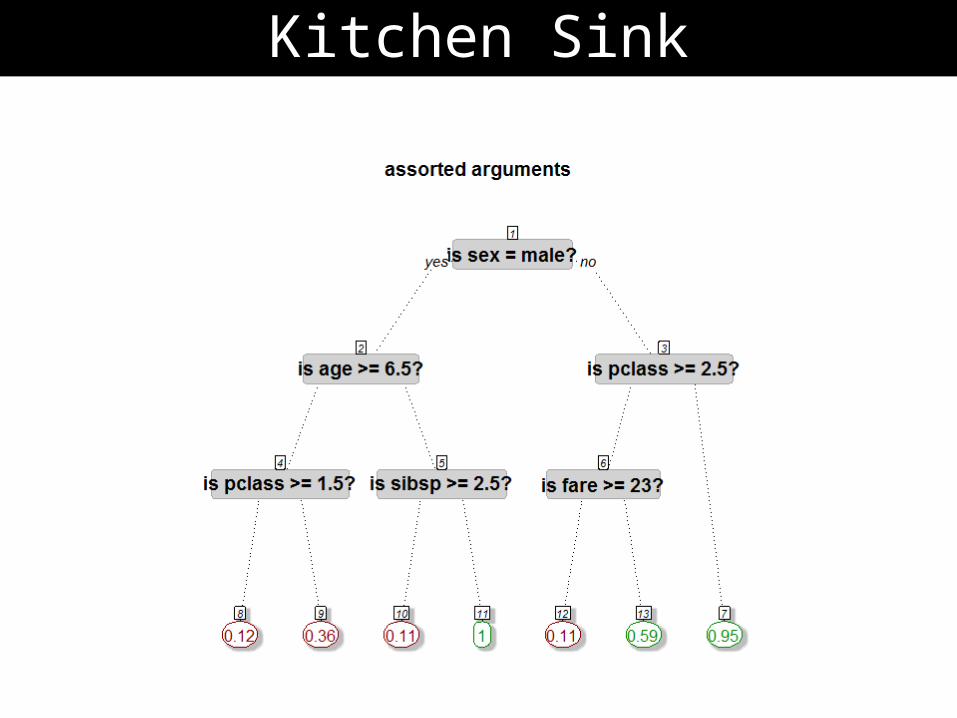
Variable Description Type Hypothesispclass Passenger Class Categorical,
Ordinal1st class 3rd
name Name TextSex Sex Categoricalage Age Numericsibsp Number of Siblings/Spouses Aboard Integer
parch Number of Parents/Children Aboard Integer
ticket Ticket Number Textfare Passenger Fare Numericcabin Cabin Textembarked Port of Embarkation Categorical