PSYCHOSOCIAL BARRIERS TO HEALTH PROMOTION IN AN AMERICAN INDIAN POPULATION Jenifer R. Lightdale, M.D., Emily Oken, M.D., William M. Klein, Ph.D. Philip J. Landrigan, M.D., M.S.C. and Thomas K. Welty, M.D., M.P.H. Abstract: Northern Plains Indians (N = 200) completed the Indian Specific Health Risk Appraisal and measures assessing beliefs about risk factors and personal risk. Participants rated personal risk optimistically, judged their risk factor standing as superior to that of their peers, and neglected to consider risk factor standing when appraising personal risk. Moreover, partic- ipants were often not improving their standing on risk factors they considered relevant to their health. Such biases in health beliefs may prevent health interventions from being successful. American Indians and Alaska Natives experience a disproportion- ate burden of morbidity preventable by lifestyle change for such health problems as atherosclerotic heart disease, chronic liver disease and vehicular trauma. The life expectancy at birth of American Indians is three years less than that of U.S. Whites. This burden is particularly alarming among Northern Plains Indians for whom the overall mortality rate is greater than that of other American Indians and is approximately twice that of all U.S. races ("Trends," 1991; Welty, in press). Conventional public health strategies among American Indians have concentrated on disseminating information about causal relation- ships between health risk factors and disease, yet targeted risk behaviors often persist in spite of "successful" health education (Rhoades, Ham- mond, Welty, Handler, & Amler, 1987; Sullivan, 1990). Clearly, individuals must not only learn the facts, but also believe that they are personally at risk, before they will take steps towards changing their behaviors. Indeed, most health models such as the Health Belief Model and Protection Moti- vation Theory link perceptions of risk and health risk behavior (see Wein- stein, 1993, for review). Eliminating preventable disease necessitates not only educating a population, but also breaking down psychosocial barri- ers that may impede individual improvement. 34 American Indian and Alaska Native Mental Health Research Copyright: Centers for American Indian and Alaska Native Health Colorado School of Public Health/University of Colorado Anschutz Medical Campus (www.ucdenver.edu/caianh )
Transcript
PSYCHOSOCIAL BARRIERS TO HEALTH PROMOTION IN ANAMERICAN INDIAN POPULATION
Jenifer R. Lightdale, M.D., Emily Oken, M.D., William M. Klein, Ph.D.Philip J. Landrigan, M.D., M.S.C. and Thomas K. Welty, M.D., M.P.H.
Abstract: Northern Plains Indians (N = 200) completed theIndian Specific Health Risk Appraisal and measures assessingbeliefs about risk factors and personal risk. Participants ratedpersonal risk optimistically, judged their risk factor standing assuperior to that of their peers, and neglected to consider riskfactor standing when appraising personal risk. Moreover, partic-ipants were often not improving their standing on risk factorsthey considered relevant to their health. Such biases in healthbeliefs may prevent health interventions from being successful.
American Indians and Alaska Natives experience a disproportion-ate burden of morbidity preventable by lifestyle change for such healthproblems as atherosclerotic heart disease, chronic liver disease andvehicular trauma. The life expectancy at birth of American Indians is threeyears less than that of U.S. Whites. This burden is particularly alarmingamong Northern Plains Indians for whom the overall mortality rate isgreater than that of other American Indians and is approximately twicethat of all U.S. races ("Trends," 1991; Welty, in press).
Conventional public health strategies among American Indianshave concentrated on disseminating information about causal relation-ships between health risk factors and disease, yet targeted risk behaviorsoften persist in spite of "successful" health education (Rhoades, Ham-mond, Welty, Handler, & Amler, 1987; Sullivan, 1990). Clearly, individualsmust not only learn the facts, but also believe that they are personally atrisk, before they will take steps towards changing their behaviors. Indeed,most health models such as the Health Belief Model and Protection Moti-vation Theory link perceptions of risk and health risk behavior (see Wein-stein, 1993, for review). Eliminating preventable disease necessitates notonly educating a population, but also breaking down psychosocial barri-ers that may impede individual improvement.
34
American Indian and Alaska Native Mental Health Research Copyright: Centers for American Indian and Alaska Native Health
Colorado School of Public Health/University of Colorado Anschutz Medical Campus (www.ucdenver.edu/caianh)
PSYCHOSOCIAL BARRIERS TO HEALTH PROMOTION 35
The Health Risk Appraisal (HRA), an instrument promoted by theCenters for Disease Control (CDC), has been administered in an Indian-specific version to thousands of American Indians (Welty, in press). Thefeedback of the HRA provides respondents with an estimate of personalhealth risk, along with suggestions for how to decrease this risk. However,numerous studies have shown the HRA to be an ineffective means ofmotivating lifestyle change (Nice & Woodruff, 1990; Schoenbach, 1987;Wagner, Beery, Schoenbach, & Graham, 1982). This investigation elabo-rates upon several elements that may contribute to the psychologicalappraisal of personal health risk among American Indians and may con-sequently undermine the effectiveness of the HRA and other educationalstrategies.
Our first hypothesis is that American Indians tend to underestimatetheir chances of experiencing health problems. In particular, we expectedthat American Indians would believe their risk to be objectively lower thanthat of their peers. Second, we also predicted that individuals perceive theirown behavior as less risky than that of their peers. Third, we hypothesizedthat American Indians do not take their standing on risk factors intoaccount when judging their risk. These three predictions were based inpart upon previous research demonstrating that individuals in non-Indianpopulations tend to believe that their own health risk is objectively lower,and their standing on risk factors objectively better, than that of their peers(Klein & Kunda, 1993; Weinstein, 1984, 1987; Weinstein & Klein, 1995).Additionally, individuals often ignore their risk factor standing when judgingrisk (Weinstein, 1984, 1987). Determining how these biases may influenceAmerican Indian health perceptions and behaviors could help to identifyreasons for the high prevalence of risk behaviors in this population.
Our final hypothesis is that even when American Indians doappreciate the significance of a particular risk factor, their behavior maynot reflect this understanding. No studies to our knowledge haveaddressed this question directly. The notion that such individuals do knowthe risk factors associated with health problems is a novel one, and sug-gests that the HRA is ineffective because it is providing already knowninformation without the tools to take action.
In sum, we conducted this study in order to develop a more theo-retical understanding of why interventions such as the HRA are ineffectiveamong American Indian and Alaska Native populations, by demonstratingthe presence of psychological barriers impinging on the processing of riskinformation. This research is of particular importance because it concernsa group (Northern Plains American Indians) possessing an alarming riskof many health problems. It was predicted that participants would (a)appraise their health risks in an optimistically biased manner, believingtheir own risk to be lower than that of their same-age, same-sex peers, (b)consider their risk factor standing to be superior to that of their peers, (c)not take risk factor standing into account when judging their personal
American Indian and Alaska Native Mental Health Research Copyright: Centers for American Indian and Alaska Native Health
Colorado School of Public Health/University of Colorado Anschutz Medical Campus (www.ucdenver.edu/caianh)
36 VOLUME 7, NUMBER 3
health risk, and (d) not seem to be attempting to improve their standing onrisk factors that they considered to be important and relevant to health risk.
Method
Sample
Questionnaires were collected from a sample of 200 urban dwell-ing Northern Plains Indians (120 women and 80 men) between the agesof 18 and 75. Ten additional participants were excluded because theywere not American Indians. In addition to recruiting a sample that variedacross all conventional demographic dimensions including age, sex, edu-cational level, income, and occupational status, we took several additionalsteps to increase the representativeness of our sample. First, amongthose approached, approximately 75% consented to participate (andthose who consented possessed a similar age and sex profile to thosewho refused). Second, based on past research showing Indian HealthService clinic users to be representative of their local American Indianpopulations (Goldberg et al., 1991), 160 of our participants were recruitedin the outpatient clinic of an IHS hospital in the Northern Plains. Most ofthese were patients waiting for walk-in, appointment, or pharmacy visits.Everyone appearing at the clinic over a two-month period wasapproached for possible participation. Third, we buttressed the clinic sam-ple by including relatives or friends accompanying patients as well asmaintenance, medical records and security workers, and nurses. Thefindings reported were not affected by the inclusion of these additionalclinic participants. Finally, we recruited 50 additional participants outsidethe clinic, a sample that included employees and visitors of several tribaloffices throughout the city serving the American Indian community. Again,the findings were virtually identical whether or not this portion of the sam-ple was included. Consequently, we report analyses conducted on thewhole sample.
Procedure and Materials
Each participant was asked to complete a series of question-naires. Informed consent was obtained, and participants were given theoption of having their completed Health Risk Appraisal (HRA) placed intheir medical records. Respondent anonymity and confidentiality weremaintained in all other ways. Participants were compensated with a healthpromotion t-shirt.
Data were collected in a four-part instrument. The Indian-specificHRA, a form of the Carter Center instrument modified by the IHS in 1987,comprised Part I. The HRA surveyed respondents on forty health risk-related factors, such as exercise, smoking, alcohol consumption, and
American Indian and Alaska Native Mental Health Research Copyright: Centers for American Indian and Alaska Native Health
Colorado School of Public Health/University of Colorado Anschutz Medical Campus (www.ucdenver.edu/caianh)
PSYCHOSOCIAL BARRIERS TO HEALTH PROMOTION 37
family history of diabetes and breast cancer. Additionally, the HRA's pro-tocol included measurement of blood pressure, height, weight, and ran-dom blood glucose and cholesterol levels. Blood was collected by theexperimenter using a finger-stick technique, and analyzed for glucoseand cholesterol levels by Accu-Chek II and ProAct machines, respec-tively. Participants were given the results immediately.
The remainder of the instrument consisted of questionnairesused to elaborate upon factors contributing to perceptions of health risk.Prior to the study, these questionnaires were pilot-tested for length andcomprehensibility and were revised accordingly. Because these mea-sures have been developed and used in other investigations, we do notrehearse their psychometric properties here.
In Part II, participants appraised their perceived risk of developingspecific health problems (relative to the risk of same-age, same-sexAmerican Indian peers in the same town) on a series of seven-pointscales ranging from "much below average" (-3) to "much above average"(+3). This scale assesses bias in risk perceptions at the group level:empirically, if a predominant number of participants rate themselves ashaving a below-average risk, the sample as a whole can be said to beoptimistically biased (e.g., Weinstein, 1984, 1987).
Participants estimated the prevalence of HRA-measured risk fac-tors among peers of their own age and sex in Part III. For example,respondents were asked to estimate what percentage of Northern PlainsIndians of their age and sex are smokers, and how many miles over thespeed limit their peers usually drive. The scales on each question fol-lowed those used on the HRA (for those items on the HRA that hadrequired participants to circle yes or no, participants were asked to esti-mate the percentage of Northern Plains Indians that would circle yes).
In Part IV, respondents indicated the extent to which some of theHRA health risk behaviors were related to health on five-point scalesranging from "not at all related" to "extremely related." Respondents alsoreported, on similar scales, how important it was to them to decrease orincrease the frequency of these behaviors in their everyday life (depend-ing upon whether the behavior was negative or positive, respectively).
As a service to the participants, all answers to the HRA wererecorded on a scanner-ready form which was immediately entered into aportable computer and scored by the HRA Finding the Way program. Aprintout providing a personalized mortality risk, along with recommenda-tions for reducing that risk, was returned and interpreted to the participantby an investigator after all four parts of the questionnaire were completed.Patients with serious health problems identified through the HRA werereferred to their usual health care provider for follow-up.
American Indian and Alaska Native Mental Health Research Copyright: Centers for American Indian and Alaska Native Health
Colorado School of Public Health/University of Colorado Anschutz Medical Campus (www.ucdenver.edu/caianh)
-3 -2.5 -2 -1.5 -0.5 as
Accident-related injury
Alcoholism
Automobile accident
Baby with congenital defect I
"el cancer 2
Dental problems
arDiabetes
High blood pressure
Lung disease
Overweight
Suicide
-0.97."
-0.7
-a7 ".
0.60•••
-0.43."
4339•
VVAW\
-203•••
38 VOLUME 7, NUMBER 3
Results
Perceptions of Future Personal Risk as Compared to That of Others
We first address the participants' responses on each of the com-parative health risk scales (Part II). Recall that these scales ranged from"below average" to "above average," with a zero midpoint. As seen in Fig-ure 1, the mean responses on each of these scales was significantlybelow zero (as assessed by one-sample t-tests at p <.001) for all but onehealth risk (overweight), demonstrating that participants as a grouptended to see their risk as below average. This reflects an optimistic riskbias at the group level because such a disproportionate number of partic-ipants cannot be below average.
***p<.0011 Women less than 45 years of age only.2 Women only
MEI Mean Personal Risk Perception
Note: More negative means reflect greater optimistic bias.
Figure 1Mean ratings of personal health risks compared with estimates of
peers' health risks.
Perceptions of Personal Standing on Risk Factors as Compared toThat of Others
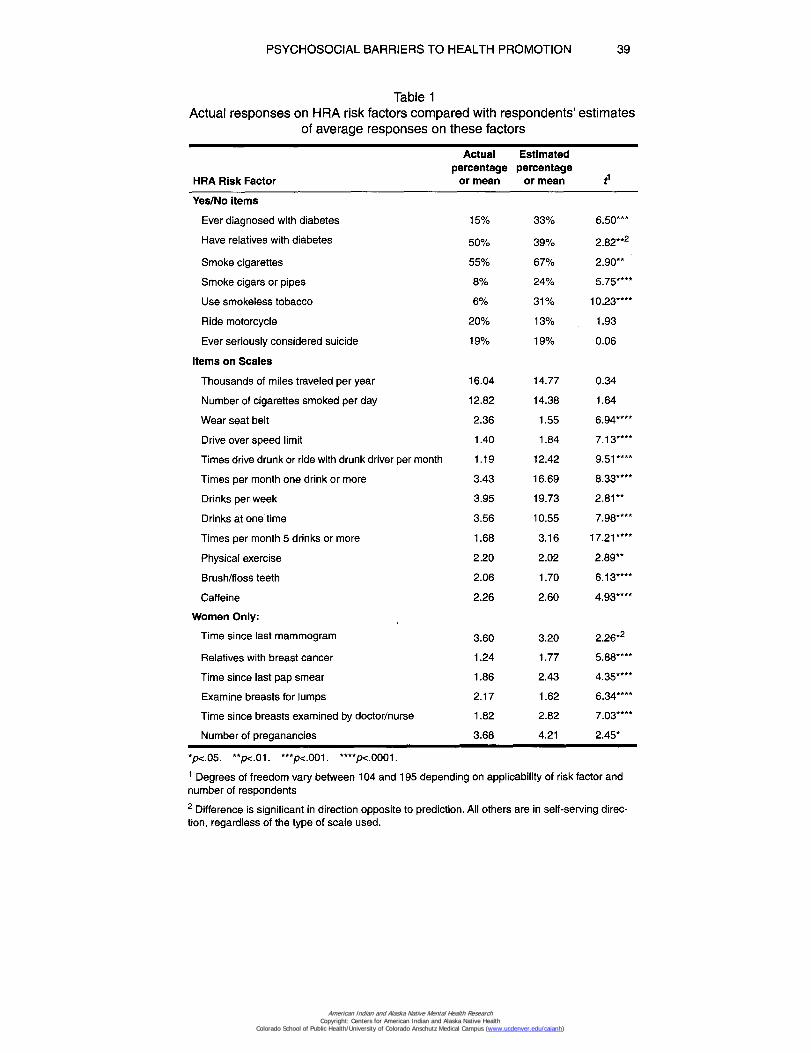
We next compared participants' responses on the HRA risk fac-tors with their estimates of their peers' standing on these same risk fac-tors (Part III). If there is no bias in participants' beliefs, the meanstanding on each of the risk factors should equal participants' estimatesof these means. However, as seen in Table 1, there was a tendency for
American Indian and Alaska Native Mental Health Research Copyright: Centers for American Indian and Alaska Native Health
Colorado School of Public Health/University of Colorado Anschutz Medical Campus (www.ucdenver.edu/caianh)
PSYCHOSOCIAL BARRIERS TO HEALTH PROMOTION 39
Table 1Actual responses on HRA risk factors compared with respondents' estimates
of average responses on these factors
HRA Risk Factor
Actualpercentage
or mean
Estimatedpercentage
or mean
Yes/No items
Ever diagnosed with diabetes 15% 33% 6.50***
Have relatives with diabetes 50% 39% 2.82**2
Smoke cigarettes 55% 67% 2.90**
Smoke cigars or pipes 8% 24% 5.75****
Use smokeless tobacco 6% 31% 10.23****
Ride motorcycle 20% 13% 1.93
Ever seriously considered suicide 19% 19% 0.06
Items on Scales
Thousands of miles traveled per year 16.04 14.77 0.34
Number of cigarettes smoked per day 12.82 14.38 1.64
Wear seat belt 2.36 1.55 6.94****
Drive over speed limit 1.40 1.84 7.13****
Times drive drunk or ride with drunk driver per month 1.19 12.42 9.51*-
Times per month one drink or more 3.43 16.69 8.33****
Drinks per week 3.95 19.73 2.81**
Drinks at one time 3.56 10.55 7.98****
Times per month 5 drinks or more 1.68 3.16 17.21****
Physical exercise 2.20 2.02 2.89**
Brush/floss teeth 2.06 1.70 6.13****
Caffeine 2.26 2.60 4.93****
Women Only:
Time since last mammogram 3.60 3.20 2.26*2
Relatives with breast cancer 1.24 1.77 5.88****
Time since last pap smear 1.86 2.43 4.35****
Examine breasts for lumps 2.17 1.62 6.34****
Time since breasts examined by doctor/nurse 1.82 2.82 7.03****
Number of preganancies 3.68 4.21 2.45*
*p<.05. **p<.01. ***p<.001. ****p<.0001.
1 Degrees of freedom vary between 104 and 195 depending on applicability of risk factor andnumber of respondents
2 Difference is significant in direction opposite to prediction. All others are in self-serving direc-tion, regardless of the type of scale used.
American Indian and Alaska Native Mental Health Research Copyright: Centers for American Indian and Alaska Native Health
Colorado School of Public Health/University of Colorado Anschutz Medical Campus (www.ucdenver.edu/caianh)
40 VOLUME 7, NUMBER 3
respondents to exaggerate the difference between themselves and theirpeers in a self-serving manner. For example, based on self-reports,respondents consumed 3.95 drinks per week but estimated that theirpeers consumed 19.73 drinks per week. Such self-serving biases werefound to be significant (by a series of paired t-tests) for 19 of 25 risk fac-tors, most at p <.01 or better.
Correspondence Between Actual Standing onRisk Factors and Perceptions of Risk
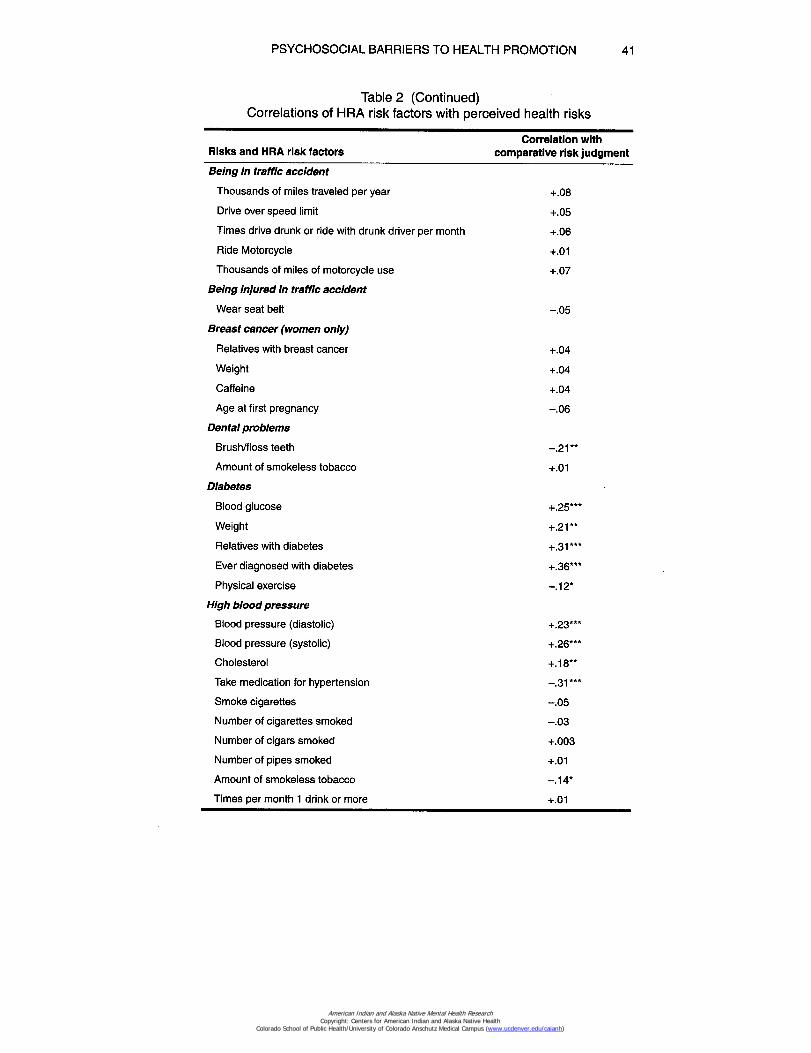
The next question was whether participants rating themselves aslow in risk would be those with the best standing on risk factors, whilethose rating themselves as high in risk would be those with the worststanding. We predicted that this would not hold true; in statistical terms,we predicted low correlations between participants' risk perceptions (PartII) and their actual standing on related risk factors measured on the HRA(Part I). As seen in Table 2, this prediction was confirmed. We found that
Table 2Correlations of HRA risk factors with perceived health risks
Risks and HRA risk factorsCorrelation with
comparative risk judgment
Alcoholism
Times per month one drink or more +.11
Drinks per week +.14*
Drinks at one time +.19**
Times per month 5 drinks or more +.18""
Baby with congenital defect (women only)
Smoke cigarettes —.09
Number of cigarettes smoked per day —.05
Number of cigars smoked —.03
Number of pipes smoked —
Amount of smokeless tobacco —.07
Number of pregnancies +.01
Age at first pregnancy +.12
Times per month one drink or more +.06
Drinks per week +.04
Drinks at one time +.04
Times per month 5 drinks or more +.03
American Indian and Alaska Native Mental Health Research Copyright: Centers for American Indian and Alaska Native Health
Colorado School of Public Health/University of Colorado Anschutz Medical Campus (www.ucdenver.edu/caianh)
PSYCHOSOCIAL BARRIERS TO HEALTH PROMOTION 41
Table 2 (Continued)Correlations of HRA risk factors with perceived health risks
Correlation withRisks and HRA risk factors comparative risk judgment
Being in traffic accident
Thousands of miles traveled per year +.08
Drive over speed limit +.05
Times drive drunk or ride with drunk driver per month +.06
Ride Motorcycle +.01
Thousands of miles of motorcycle use +.07
Being injured in traffic accident
Wear seat belt —.05
Breast cancer (women only)
Relatives with breast cancer +.04
Weight +.04
Caffeine +.04
Age at first pregnancy —.06
Dental problems
Brush/floss teeth —.21 **
Amount of smokeless tobacco +.01
Diabetes
Blood glucose +.25***
Weight +.21**
Relatives with diabetes +.31***
Ever diagnosed with diabetes +.36***
Physical exercise —.12*
High blood pressure
Blood pressure (diastolic) +.23***
Blood pressure (systolic) +.26*"*
Cholesterol +.18**
Take medication for hypertension —.31***
Smoke cigarettes —.05
Number of cigarettes smoked —.03
Number of cigars smoked +.003
Number of pipes smoked +.01
Amount of smokeless tobacco —.14*
Times per month 1 drink or more +.01
American Indian and Alaska Native Mental Health Research Copyright: Centers for American Indian and Alaska Native Health
Colorado School of Public Health/University of Colorado Anschutz Medical Campus (www.ucdenver.edu/caianh)
42 VOLUME 7, NUMBER 3
Table 2 (Continued)Correlations of HRA risk factors with perceived health risks
Correlation withRisks and HRA risk factors comparative risk judgment
High blood pressure (Continued)
Drinks per week +.05
Drinks at one time +.04
Times per month 5 drinks or more —.01
Caffeine +.09
Weight +.16*
Physical exercise —.18**
Lung Cancer
Smoke cigarettes +.25***
Number of cigarettes smoked +.20*"
Number of cigars smoked +.05
Number of pipes smoked +.02
Amount of smokeless tobacco —.14*
Obesity
Weight +.38***
Physical exercise —.04
Suicide
Ever seriously considered suicide +.10
"p<.05. **p<.01. ***p<.001.
Note: A significant correlation indicates that respondents' risk factor standing on the HRA(e.g., smoking) was correlated with their perceived risk of having an associated health prob-lem (e.g., lung cancer). Non-significant correlations indicate no perceived relationshipbetween the risk factor and the health problem under which it is listed.
36 of 55 medically established and popularly known correlations betweenrisk factors and health hazards were not significant in this sample. Thus,for example, respondents rating themselves low in risk for being in a trafficaccident were no less likely to speed, drive drunk, or drive long distancesthan those rating themselves higher in risk. These findings suggest thatrespondents either do not appreciate the relationship between their riskfactor standing and their personal health risk or are not applying thisunderstanding to themselves.
An unexpected finding was that risk perceptions were more likelyto be correlated with the physiological measures (weight, blood pressure,serum cholesterol and blood glucose), than with self-reported family his-tory and behavioral measures.
American Indian and Alaska Native Mental Health Research Copyright: Centers for American Indian and Alaska Native Health
Colorado School of Public Health/University of Colorado Anschutz Medical Campus (www.ucdenver.edu/caianh)
PSYCHOSOCIAL BARRIERS TO HEALTH PROMOTION 43
Correspondence of Perceived Relevance andImportance of Risk Factors With Actual Standing
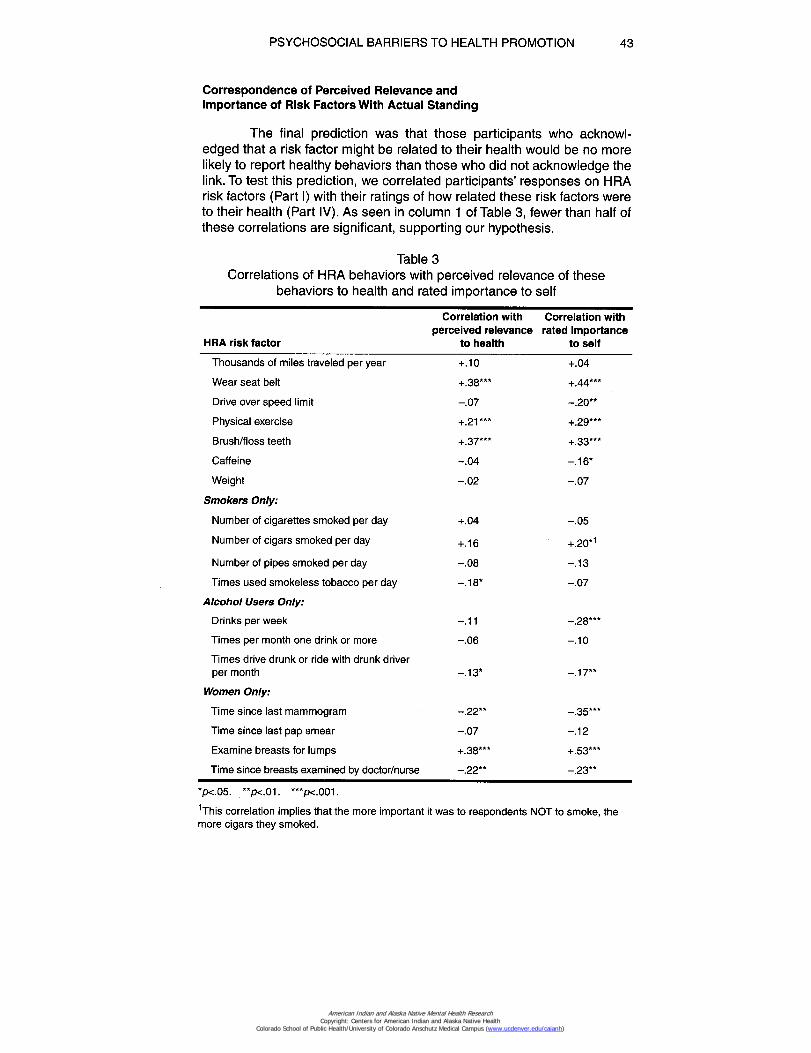
The final prediction was that those participants who acknowl-edged that a risk factor might be related to their health would be no morelikely to report healthy behaviors than those who did not acknowledge thelink. To test this prediction, we correlated participants' responses on HRArisk factors (Part I) with their ratings of how related these risk factors wereto their health (Part IV). As seen in column 1 of Table 3, fewer than half ofthese correlations are significant, supporting our hypothesis.
Table 3Correlations of HRA behaviors with perceived relevance of these
behaviors to health and rated importance to self
HRA risk factor
Correlation withperceived relevance
to health
Correlation withrated importance
to self
Thousands of miles traveled per year +.10 +.04
Wear seat belt +.38*** +.44***
Drive over speed limit -.07 -.20**
Physical exercise +.21*** +.29***
Brush/floss teeth +.37*** +.33***
Caffeine -.04 -.16*
Weight -.02 -.07
Smokers Only:
Number of cigarettes smoked per day +.04 -.05
Number of cigars smoked per day +.16 +.20*1
Number of pipes smoked per day -.08 -.13
Times used smokeless tobacco per day -.18* -.07
Alcohol Users Only:
Drinks per week -.11 -.28*"*
Times per month one drink or more -.06 -.10
Times drive drunk or ride with drunk driverper month -.13* -.17**
Women Only:
Time since last mammogram -.22"* -.35***
Time since last pap smear -.07 -.12
Examine breasts for lumps +.38*** +.53***
Time since breasts examined by doctor/nurse -.22** -.23**
*p<.05. **p<.01. ***p<001.
This correlation implies that the more important it was to respondents NOT to smoke, themore cigars they smoked.
American Indian and Alaska Native Mental Health Research Copyright: Centers for American Indian and Alaska Native Health
Colorado School of Public Health/University of Colorado Anschutz Medical Campus (www.ucdenver.edu/caianh)
44 VOLUME 7, NUMBER 3
Similar analyses were conducted to determine whether respon-dents reported healthier behaviors on HRA items that were important tothem. Correlations between HRA risk factors and importance ratings maybe found in column 2 of Table 3. In this case, 10 of 18 correlations are sig-nificant, and tend to be stronger than the correlations in column 1. Thisimplies that perceived relatedness and importance are not redundantconstructs. Once again, however, there are several factors for which thecorrelation between rated importance and actual behavior was surpris-ingly low, suggesting that even when participants understood the rele-vance and importance of a risk factor, they were not necessarily morelikely to be taking measures to improve their standing on that factor. Forexample, participants who felt it was important to smoke less, watch theirweight, and get annual pap smears were no more likely to be taking theseprecautions than those who did not feel such precautions to be important.
Discussion
This study assessed some of the psychosocial factors underlyingAmerican Indian perceptions of their own health risks. Our findings showthat our American Indian participants optimistically appraised theirchances of evading preventable disease, magnified differences betweentheir own standing on risk factors and the standing of their peers (therebymaking themselves appear relatively lower in risk), often neglected to taketheir own standing on risk factors into account when appraising their over-all risk of experiencing preventable illness, and still were no more likely tobe taking steps to improve their standing on risk factors they consideredimportant and relevant to their health. These biases may hinder the effec-tiveness of health interventions such as the HRA, and generally may actas barriers to behavioral change.
Our first two findings are consistent with research on non-Indiansshowing that people justify their lifestyles by perceiving their own behav-iors to be more healthful than those of their peers. For example, peoplepracticing AIDS-risk behaviors underestimate their risk of contracting HIVbecause they deem their own habits to be safer than those of their high-risk peers (Bauman & Siegel, 1987). Recent evidence suggests thatsocial comparison plays an important role in judgments of risk (for review,see Klein & Weinstein, in press). In one study, for example, participantswho imagined that their risk of experiencing a health problem was 60%,yet below the average risk of their peers, anticipated being less worriedabout this risk level than did participants asked to imagine that their riskwas 30% but above average (Klein, in press).
Furthermore, when individuals are given social comparison infor-mation, it is often processed in a self-enhancing manner. Upon hearingthat a similar other is HIV-positive, people may reduce perceptions of sim-ilarity to that individual (Gump & Kulik, 1995). Moreover, upon learning
American Indian and Alaska Native Mental Health Research Copyright: Centers for American Indian and Alaska Native Health
Colorado School of Public Health/University of Colorado Anschutz Medical Campus (www.ucdenver.edu/caianh)
PSYCHOSOCIAL BARRIERS TO HEALTH PROMOTION 45
that their own behavioral profiles compare unfavorably with those of oth-ers, they may discount the relevance of these behaviors to health prob-lems (Klein, 1996). In some cases, social comparisons with others mayeven exacerbate risk biases (Weinstein & Klein, 1995). Consequently, it isessential to employ social comparison information very carefully whendesigning interventions. Currently, HRA feedback provides participantsnot only with a calculation of their own chances of developing a number ofhealth problems, but also with the average risk of their peers. If respon-dents are engaging in self-enhancing strategies when receiving this infor-mation, the ineffectiveness of HRA as a behavior change tool may bemore understandable. Recent research suggests that optimism biasesare less likely to result when making comparisons with live, physicallypresent individuals who are similar on several demographic attributes(e.g., Alicke, Klotz, Breitenbecher, Yurak, & Vredenburg, 1995), suggest-ing that using such targets would be more effective than providing statisti-cal social comparison information.
Of course, these conclusions may hinge to a large degree on thepopulation being studied. In cultures exhibiting an interdependent orienta-tion, such as the Japanese, the tendency to see oneself as different (andbetter) than others is less prevalent (Heine & Lehman, 1995), suggestingthat interventions inclusive of carefully selected social comparison targetsmay still be ineffective. The question of how much American Indians relyon social comparisons when judging their risk awaits further research.
Our third finding was that respondents rating themselves as lowin risk to develop future health problems were no more or less likely thanother respondents to exhibit healthy behavior. Interestingly, all physiologi-cal values, but very few self-reported behaviors, were highly correlatedwith associated health risks. For example, weight, current blood pressure,and cholesterol (all measured in the protocol) were significantly correlatedwith the perceived risk of having high blood pressure, but cigarette smok-ing, alcohol use, and caffeine consumption (all self-reported) were not.People's health risk perceptions may be more affected by their standingon their physiological as opposed to behavioral risk factors. Futureresearch might consider explanations and implications of this finding.
Finally, even when participants acknowledged that a risk behaviorwas related to health, they still did not appear to be trying to improve theirstanding on that factor. For example, participants who indicated that ciga-rette smoking was related to health did not necessarily smoke less.Respondents' rated importance of avoiding health-threatening activitiesor engaging in health promotion behavior was also a poor predictor ofactual health habits. These findings suggest that the provision of risk fac-tor information such as that appearing on the HRA feedback form may noteffect behavioral change because the information is already known, andknowledge alone does not necessarily lead to behavior change.
American Indian and Alaska Native Mental Health Research Copyright: Centers for American Indian and Alaska Native Health
Colorado School of Public Health/University of Colorado Anschutz Medical Campus (www.ucdenver.edu/caianh)
46 VOLUME 7, NUMBER 3
Indeed, two previous studies examining the psychological effectsof health promotion through education have shown no impact on individu-als' attitudes toward disease susceptibility, or their perceptions of the ben-efits of preventive action (Cioffi, 1979; Stiles, 1987). However, researchhas shown that people accurately retain information obtained from theHRA (Kellerman, Felts, & Chenier, 1992). The acquisition of health infor-mation during health promotion sessions may mask a failure to change:on follow-up surveys to the HRA, respondents have reported behavioralchanges not substantiated by improvements in health status (Nice &Woodruff, 1990). Just because people remember the right answer doesnot mean that they adopt healthier lifestyles.
Because some of our results assume that our respondents weretypical of the Northern Plains Indian community as a whole, we took sev-eral measures to increase our confidence in the representativeness of oursample. Our respondents were diverse in age, sex, educational back-ground, employment status and in risk behaviors, yet characteristicallysimilar to participants in other HRA screenings conducted during thesame time period. Approximately 75% of those approached participated,and our analyses were not affected by the inclusion of non-patients andnon-clinic users. Moreover, past research at other IHS sites has sup-ported the generalizability of clinic samples such as ours (Goldberg et al.,1991).
The findings here illustrate the strategies that enable individuals toview their health positively—they can underestimate their future risk, per-ceive their risk factor standing as better than average, or ignore the rela-tionship between their risk factor standing and their actual health risks.Furthermore, even when people do acknowledge the importance of a riskfactor, they may not take steps to improve their standing on that factor.Effective interventions must take all of these factors into account if they areto be successful. If people are taught to appraise their objective risk moreaccurately, in a way that does not eliminate the psychological benefit of apositive outlook, they may engage in more healthful behaviors.
Of course, even if people do hold accurate health perceptions, itdoes not necessarily follow that their behavior will be consistent withthese perceptions. In daily life, an individual must not only have the knowl-edge and the will (Carter, 1985), but also the means to achieve a healthylifestyle. Greater than 60% of residents in one Northern Plains Indian res-ervation lived below the poverty level in 1989, creating the poorest countyin the U.S. (Kilborn, 1992). American Indians overall have higher rates ofunemployment, and receive less education and income, than all otherAmericans ("Trends," 1991). Consequently, such individuals may not havethe necessary resources to effect behavioral changes. For example, if noother transportation is available or affordable, riding with intoxicated driv-ers may be inevitable (Oken, Lightdale, & Welty, 1995). More nutritiousfoods may also prove more expensive and unattainable. Providing a
American Indian and Alaska Native Mental Health Research Copyright: Centers for American Indian and Alaska Native Health
Colorado School of Public Health/University of Colorado Anschutz Medical Campus (www.ucdenver.edu/caianh)
PSYCHOSOCIAL BARRIERS TO HEALTH PROMOTION 47
sense of self-efficacy, as well as real power to effect personal change, isof utmost importance in any Indian health promotion program. Because ofthese realities, improving the HRA questionnaire and similar health edu-cation devices to minimize psychological barriers may not eliminate pre-ventable illness, but does provide a workable first step.
Alicke, M. D., Klotz, M. L., Breitenbecher, D. L., Yurak, T. J., & Vredenburg, D. S.(1995). Personal contact, individuation, and the better-than-average effect.Journal of Personality and Social Psychology, 68, 804-825.
Bauman, L. J., & Siegel, K. (1987). Misperception among gay men of the risk forAIDS associated with their sexual behavior. Journal of Applied Social Psy-chology, 17, 329-350.
Carter, J. (1985). Closing the gap: The burden of unnecessary illness. Journal ofthe American Medical Association, 254(10), 1359-1360.
Cioffi, J. P. (1979). Effects of health status feedback on health beliefs. In Proceed-ings of the 15th Annual Meeting of the Society of Prospective Medicine (pp.41-47).
Goldberg, H. I., Warren, C.W., Oge, L. L., Helgerson, S. D., Pepion, D. D., LaMere,E., & Friedman, J. S. (1991). Prevalence of behavioral risk factors in twoAmerican Indian populations in Montana. American Journal of PreventiveMedicine, 3,155-160.
Gump, B. B., & Kulik, J. A. (1995). The effect of a model's HIV status on self-per-ceptions: A self-protective similarity bias. Personality and Social PsychologyBulletin, 21, 827-833.
Heine, S. J., & Lehman, D. R. (1995). Cultural variation in unrealistic optimism:Does the West feel more vulnerable than the East? Journal of Personality andSocial Psychology, 68, 595-607.
Kellerman, S. T., Felts, W. M., & Chenier, T. C. (1992). The impact on factory work-ers of Health Risk Appraisal and counseling in health promotion. AmericanJournal of Preventive Medicine, 8(1), 37-41.
Kilborn, P. T. (1992, September 20). Sad distinction for the Sioux: Homeland is No.1 in poverty. New York Times, p. 1, col. 6.
Klein, W. M. (in press). Objective standards are not enough: Affective, self-evalua-tive, and behavioral responses to social comparison information. Journal ofPersonality and Social Psychology.
American Indian and Alaska Native Mental Health Research Copyright: Centers for American Indian and Alaska Native Health
Colorado School of Public Health/University of Colorado Anschutz Medical Campus (www.ucdenver.edu/caianh)
48 VOLUME 7, NUMBER 3
Klein, W. M. (1996). Maintaining self-serving social comparisons: Attenuating theperceived significance of risk-increasing behaviors. Journal of Social andClinical Psychology, 15, 120-142.
Klein, W. M., & Kunda, Z. (1993). Maintaining self-serving social comparisons:Biased reconstruction of one's past behaviors. Personality and Social Psy-chology Bulletin, 19, 732-739.
Klein, W. M., & Weinstein, N. D. (in press). Social comparison and unrealistic opti-mism about personal risk. In B. P. Buunk & F. X. Gibbons (Eds.), Health, cop-ing, and well-being: Perspectives from social comparison theory. Hillsdale,NJ: Lawrence Erlbaum.
Nice, D. S., & Woodruff, S. I. (1990). Self-selection in responding to a Health RiskAppraisal: Are we preaching to the choir? American Journal of Health Promo-tion, 4(5), 367-372.
Oken, E., Lightdale, J. R., & Welty, T. K. (1995). Along for the ride: The prevalenceof motor vehicle passengers riding with drivers who have been drinking in anAmerican Indian population. American Journal of Preventive Medicine, 11(6),375-380.
Rhoades, E. R., Hammond, J., Welty, T.K., Handler, A. D., & Amler, R. W. (1987).The Indian burden of illness and future health interventions. Public HealthReports, 102(4), 361-368.
Schoenbach, V. J. (1987). Appraising the Health Risk Appraisal. American Journalof Public Health, 77,409-410.
Stiles, C. A. (1987). Impact of the Health Risk Appraisal process on health behav-iors and beliefs of college freshmen. In Proceedings of the 23rd and 24thAnnual Meetings of the Society of Prospective Medicine (pp. 337-344).
Sullivan, L. W. (1990). Healthy People 2000: National Health Promotion and Dis-ease Prevention Objectives (DHHS Publication No. PHS 91-50213). Wash-ington, DC: U.S. Government Printing Office.
Trends in Indian Health (1991). (DHHS Pub. No. PHS 300-165/50070). Washing-ton, DC: U.S. Government Printing Office.
Wagner, E. H., Beery, W. L., Schoenbach V. J., & Graham, R. M. (1982). Anassessment of Health Hazard/Health Risk Appraisal. American Journal ofPublic Health, 72, 347-352.
Weinstein, N. D. (1984). Why it won't happen to me: Perceptions of risk factors andsusceptibility. Health Psychology, 3,431-457.
Weinstein, N. D. (1987). Unrealistic optimism about susceptibility to health prob-lems: Conclusions from a community-wide sample. Journal of BehavioralMedicine, 10(5), 481-500.
Weinstein, N. D. (1993). Testing four competing theories of health protectivebehavior. Health Psychology, 12, 324-333.
Weinstein, N. D., & Klein, W. M. (1995). Resistance of personal risk perceptions todebiasing interventions. Health Psychology, 14, 132-140.
American Indian and Alaska Native Mental Health Research Copyright: Centers for American Indian and Alaska Native Health
Colorado School of Public Health/University of Colorado Anschutz Medical Campus (www.ucdenver.edu/caianh)
PSYCHOSOCIAL BARRIERS TO HEALTH PROMOTION 49
Welty, T. K. (in press). Cancer and cancer prevention and control programs in theAberdeen Area Indian Health Service. American Indian Culture and ResearchJournal.
Author Note
This research was funded by the National Institute of Arthritis, Diabetes,Digestive and Kidney Diseases—NAID (#5T35DK07420); the AberdeenArea Indian Health Service; and Colby College Social Science Grants 01-2289, 01-2207, and 01-2230. We are grateful to the Rapid City IndianHealth Advisory Board and the Public Health Service Indian Hospital inRapid City for their assistance in data collection, and to Linda Oken forher technical expertise.
1
American Indian and Alaska Native Mental Health Research Copyright: Centers for American Indian and Alaska Native Health
Colorado School of Public Health/University of Colorado Anschutz Medical Campus (www.ucdenver.edu/caianh)