60
2035 2040 2045 2050 Technology Roadmap Energy and GHG Reductions in the Chemical Industry via Catalytic Processes E n e r g y T e c h n o l o g y P e r s p e c t i v e s

2035 2040
2045
2050
DECHEMA Gesellschaft für Chemische Technik und Biotechnologie e. V. Theodor-Heuss Allee 25, 60486 Frankfurt am Main, GermanyTel: +49 (0)69 7564 0Fax: +49 (0)69 7564 201Email: [email protected], Web: www.dechema.de
Technology RoadmapEnergy and GHG Reductions in the Chemical Industry via Catalytic Processes
En
erg y Technolog y Perspecti
ves
INTERNATIONAL ENERGY AGENCY
The International Energy Agency (IEA), an autonomous agency, was established in November 1974. Its primary mandate was – and is – two-fold: to promote energy security amongst its member countries through collective response to physical disruptions in oil supply, and provide authoritative research and analysis on ways to ensure reliable, affordable and clean energy for its 28 member countries and beyond. The IEA carries out a comprehensive programme of energy co-operation among its member countries, each of which is obliged to hold oil stocks equivalent to 90 days of its net imports.
INTERNATIONAL COUNCIL OF CHEMICAL ASSOCIATIONS
The International Council of Chemical Associations (ICCA) serves as the worldwide voice of the chemical industry and promotes adoption of best practices such as Responsible Care across the industry. The ICCA goals include reducing energy use and greenhouse-gas (GHG) emissions globally from production of chemicals and increasing the positive impact of its products in reducing emissions along the value chain.
DECHEMA GESELLSCHAFT FÜR CHEMISCHE TECHNIK UND BIOTECHNOLOGIE E. V.
DECHEMA Gesellschaft für Chemische Technik und Biotechnologie e. V. (Society for Chemical Engineering and Biotechnology) is a non-profit scientific and technical society based in Frankfurt am Main, Germany. It has more than 5 500 private and institutional members, among them scientists, engineers, companies, organisations and institutes. DECHEMA aims at the promotion and support of research and technological progress in Chemical Technology and Biotechnology. DECHEMA regards itself as interface between science, economy, state and public.
Copyright © 2013No reproduction, transmission or translation of this publication may be made without prior written permission.
Applications should be sent to: [email protected]

1Foreword
Current trends in energy supply and use are unsustainable – economically, environmentally and socially. Without decisive action, energy-related emissions of carbon dioxide (CO2) will more than double by 2050 and increased fossil energy demand will heighten concerns over the security of supplies. We can and must change our current path, but this will take an energy revolution and low-carbon energy technologies will have a crucial role to play. Energy efficiency, many types of renewable energy, carbon capture and storage (CCS), nuclear power and new transport technologies will all require widespread deployment if we are to reach our goals to reduce greenhouse-gas (GHG) emissions. Every major country and sector of the economy must be involved. The task is urgent if we are to make sure that investment decisions taken now represent the long-term optimum for energy efficiency and GHG reduction. The role of developing countries, which are driving future growth, warrants particular focus in any future roadmap.
Awareness is growing on the need to turn political statements and analytical work into concrete action. To spark this movement, at the request of the G8, the International Energy Agency (IEA) is leading the development of a series of roadmaps for some of the most important technologies. By identifying the steps needed to accelerate the implementation of radical technology changes, these roadmaps will enable governments, industry and financial partners to make the right choices. This will, in turn, help societies make the right decisions.
The chemical industry is a large energy user; but chemical products and technologies also are used in a wide array of energy saving and/or renewable energy applications so the industry has also an energy saving role. The chemical and petrochemical sector is by far the largest industrial energy user, accounting for roughly 10% of total worldwide final energy demand and 7% of global GHG emissions. The International Council of Chemical Associations (ICCA) has partnered with the IEA
and DECHEMA (Society for Chemical Engineering and Biotechnology) to describe the path toward further improvements in energy efficiency and GHG reductions in the chemical sector.
This roadmap focuses on the role of catalytic processes in reducing energy use and GHG emissions in the chemical sector. Around 90% of chemical processes use catalysts for efficient production. Catalysis is an important source of technology-based efficiency improvement potential; indeed, this work shows an energy savings potential approaching 13 exajoules (EJ) by 2050 – equivalent to the current annual primary energy use of Germany.
Concerted, long-term action by all stakeholders is critical to realising the vision and impacts described in this roadmap. Governments can help create a favourable environment that encourages additional gains in energy efficiency and lowers energy-related emissions. Industry can provide the focus on top opportunities, highlight priorities for support, accelerate both capital investments and research and development (R&D), and prompt further focused collaborations with academia and research institutions on these industrially relevant challenges. We hope this roadmap encourages both governments and industry to take these steps, working together to achieve these goals.
Maria van der HoevenExecutive Director
International Energy Agency (IEA)
Yoshimitsu Kobayashi CEO sponsor of Energy and Climate Change, International Council of Chemical Associations (ICCA)
Rainer Diercks Chairman DECHEMA Board
Foreword
This report is the result of a collaborative effort between the IEA, its member countries, and various consultants and experts worldwide. Users of this report shall make their own independent business decisions at their own risk and, in particular, without undue reliance on this report. Nothing in this report shall constitute professional advice, and no representation or warranty, express or implied, is made in respect of the completeness or accuracy of the contents of this report. The IEA, ICCA and DECHEMA accepts no liability whatsoever for any direct or indirect damages resulting from any use of this report or its contents. A wide range of experts reviewed drafts. However, the views expressed do not necessarily represent the views or policy of the IEA or its individual member countries.

2 Technology Roadmap Energy and GHG reductions in the chemical industry via catalytic processes
Foreword 1
Acknowledgements 4
Key findings 5
Key actions in the next ten years 5
Introduction 6
Status of current energy use and GHG emissions 12
Technology opportunities 17
Incremental improvements 19
Deployment of best practice technologies 19
Emerging technologies 20
Game changers 22
Technology actions and milestones 29
Vision for advances in catalytic and related process improvements for the chemicals industry 31
IEA scenarios: catalysis and beyond... 32
DECHEMA scenarios 36
Resource needs 40
Other catalytic process-related areas 42
Avoided emissions in the use phase 44
Policy, finance and international collaboration: actions and milestones 46
Policy support for research and development 46
Securing financing, including through timely incentives 47
Policies to promote international collaboration and sharing of data, information, best practice and R&D 47
Policies for regulation 48
Stakeholder collaboration, including public-private partnerships 48
Conclusion: near-term actions for stakeholders 50
Annexes 51
Glossary 52
References 55
List of figures
Figure 1. Comparison of approach, boundaries and process coverage of IEA and DECHEMA models 9
Figure 2. Global energy consumption versus production volumes of top 18 large-volume chemicals, 2010 13
Figure 3. Global GHG emissions versus production volumes of top 18 large-volume chemicals, 2010 14
Figure 4. Ammonia synthesis: a simplified schematic 14
Figure 5. Ammonia synthesis breakthrough and energy efficiency 16
Figure 6. Evolution of energy intensity for incremental improvements and deployment of BPTs 17
Figure 7. Energy impact of improvement options for the top 18 chemical products to 2050 18
Figure 8. GHG impact of improvement options for the top 18 chemical products to 2050 18
Table of contents

3Table of contents
Figure 9. Process steps involved in hydrogen from the water cleavage option 23
Figure 10. Additional energy demand versus fossil energy savings for replacement of current ammonia and methanol processes by hydrogen-based routes 24
Figure 11. GHG savings enabled by production of hydrogen-based ammonia and methanol 25
Figure 12. Energy use for biomass versus fossil routes to HVC, including the total process chain 26
Figure 13. Biomass based versus fossil energy use of the routes compared in Figure 12 27
Figure 14. Impact of biomass-to-olefin routes on energy consumption of the chemical industry 27
Figure 15. GHG emissions for biomass versus fossil routes to HVC, including total process chain 28
Figure 16. Forecast of chemical production volumes between 2010 and 2050 31
Figure 17. Current energy savings potential for chemicals and petrochemicals, based on BPT deployment 33
Figure 18. Potential impact of technologies to reduce direct CO2 emissions, 2DS versus 6DS 34
Figure 19. Energy savings by region in the Low-Demand Case 36
Figure 20. Energy savings potential of catalyst and related process advances from all categories 37
Figure 21. GHG emissions avoidance potential of catalyst and related process advances from all categories compared to BAU 37
Figure 22. Regional impact of incremental, BPT optimistic and emerging technologies DECHEMA scenarios compared to BAU 38
Figure 23. Energy consumption by scenario for four different world regions 39
Figure 24. Potential GHG use-phase impact, using BAU direct emissions impact from this work and the McKinsey impact ratio of 2.1 t of GHGs saved/ tproduction 44
Figure 25. Collaborators with closest ties to catalysis and related processes development 49
List of tables
Table 1. Summary of assumptions for BPT deployment scenarios in the chemical industry 19
Table 2. Summary of potential catalyst impact on energy and GHG in chemical product-type scenarios 20
Table 3. Top catalyst/process development opportunities and technology needs 29
Table 4. Milestones for technology improvements for top processes 30
Table 5. Energy savings and emissions reduction projected in 2050 by the two models 32
Table 6. High-value chemicals, ammonia and methanol production by scenario, 2050 (Mt) 34
Table 7. Key hurdles 46
List of boxes
Box 1. Catalysts in the chemical industry: a target for transformation 7
Box 2. IEA Energy Technology Perspectives 2DS 10
Box 3. DECHEMA scenarios 11
Box 4. Historic example: Haber-Bosch changed the game for ammonia synthesis 15
Box 5. Gas-to-liquid from shale gas 22
Box 6. IEA Low- and High-Demand Cases for chemicals 33
Box 7. Carbon capture and storage (CCS) 35
4 Technology Roadmap Energy and GHG reductions in the chemical industry via catalytic processes
Chemical Manufactures (AICM) and the China Business Council for Sustainable Development (CBCSD) for their numerous contributions and collaboration.
Several Licensors provided input and we would especially like to thank Bernd Langanke and colleagues at Uhde and Florian Pontzen at Air Liquide for their helpful input and comments. Russel Heinen at SRI (now IHS) provided invaluable input; we thank him and his colleagues for the fruitful discussions and many data inputs. We would like to thank contacts at member associations for their input, especially the American Chemistry Council (ACC), the Conseil Européen de l’Industrie Chimique (CEFIC) and the Japanese Chemical Industry Association (JCIA). Kevin Swift (ACC) and Moncef Hadhri (CEFIC) in particular provided useful information on economic impact and energy intensity history. Several colleagues of Core Team members (see below) provided input, early reviews and considerable help in organising the workshops. Again, we would like to thank them for their generous contributions.
Several other IEA staff members provided thoughtful comments and support including Araceli Fernandez Pales, Laszlo Varro and former IEA colleague Jayen Veerapen. The authors would also like to thank Marilyn Smith for editing the manuscript, Annette Hardcastle who helped prepare the manuscript, as well as the IEA Publication Unit, in particular Muriel Custodio, Astrid Dumond, Rebecca Gaghen, Cheryl Haines and Bertrand Sadin for their assistance in additional editing, layout and production.
This Roadmap gathers input from multiple sources; thus, the authors would like to thank those who contributed generously of their expertise, experience and viewpoints. The early input of catalyst experts from companies and academia, who responded to the questionnaires, provided a solid foundation with real industrial input and thanks to those who contributed is warranted.
The authors were fortunate to have the input of 19 experts from industry and non-governmental organisations (NGOs) at the Catalyst Experts Workshop (7 to 9 September 2011, Paris). Several of these experts continued to provide advice and help in tracking down information during the generation of this roadmap, which is greatly appreciated. The list of participants for this and other workshops can be found in Annex 11.1
Several policy makers graciously gave early input on the catalyst roadmap at the Policy Workshop (23 January 2012, Brussels). This helped to understand the current improvement efforts and leverage opportunities in other industries, the context of support and the need for finance options/framework. It was also an occasion to have a frank discussion on realistic routes and targets to energy and GHG reductions.
At a third event, the Chemical Sector Energy Efficiency Improvements: Technology Roadmap and Policy Options Workshop (8 May 2012, Beijing), the work benefitted from the input of more than 120 participants. We would like to thank our co-organisers China Petroleum and Chemical Industry Federation (CPCIF), the Association of International
1. Extensive annexes to this roadmap are available online at: http://iea.org/media/freepublications/technologyroadmaps/TechnologyRoadmapCatalyticProcessesAnnexes.pdf www.icca-chem.org/en/Home/ICCA-initiatives/Energy--Climate-Change-/ http://www.dechema.de/industrialcatalysis
Acknowledgements
Finally, many thanks to the Core Team for their leadership, dedication, and persistence:
Florian Ausfelder, DECHEMA Russel Mills*, Dow Chemical
Alexis Bazzanella, DECHEMA Ed Rightor*, Dow Chemical
Hans VanBrackle, ExxonMobil Cecilia Tam, IEA
Regina Wilde*, BASFClaus Beckmann* BASF
Nathalie Trudeau, IEAPeter Botschek, CEFIC
* Co-chair

5Key findings
z The manufacture of 18 products (among thousands) from the chemical industry account for 80% of energy demand in the chemical industry and 75% of greenhouse gas (GHG) emissions.
z Catalyst and related process improvements could reduce energy intensity2 for these products by 20% to 40% as a whole by 2050 combining all scenarios. In absolute terms, such improvements could save as much as 13 exajoules (EJ) and 1 gigatonne (Gt) of carbon dioxide equivalent (CO2-eq) per year by 2050 versus a “business-as-usual” scenario.3
z In the short to medium term (to 2025), steady progress in implementing incremental improvements and deploying best practice technologies (BPT) could provide substantial energy savings and emissions reductions compared to business as usual.
z Achieving deeper energy and emissions cuts will require development and deployment of emerging technologies that exceed the capacity of current BPTs.
z A step change in the sector’s energy consumption and GHG emissions would require the development of “game changer” technologies, such as sustainable biomass feedstocks and hydrogen from renewable energy sources which have not yet reached commercial maturity.
z Therefore, long-term investment and support for research and development (R&D) to enable innovation is warranted to continue advances in new technologies.
Key actions in the next ten yearsGetting onto the right path to achieve the goals of this roadmap requires immediate effort by all stakeholders, both individually and jointly, to develop long-term strategies and corresponding mechanisms to prompt action and measure progress.
Policymakers
z Develop and implement policies that more highly reward energy efficiency investments and remove barriers for new investments.
2. Energy used per unit of product produced.
3. An exajoule is 1018 joules. In 2010, the United States used 93 EJ of primary energy and Germany 13.7 EJ.
z Create a long-term policy framework that encourages investments to reinvigorate catalyst/process improvement and R&D for high-energy-consuming processes.
z Introduce enabling policies for best practices in regions where new facilities are built, especially in developing countries.
z Eliminate energy subsidies that are barriers to the use of more energy efficient technology. In the case of BPTs, policy measures may be needed to overcome barriers to deployment, including high capital costs, replacement challenges and competing investments.
Chemical industry
z Identify top catalyst/process-related opportunities; accelerate R&D and capital investments that improve energy efficiency.
z Facilitate R&D on game changers with partners to lower barriers and operating costs.
z Promote global and regional co-operation on reducing energy and/or emissions via industry associations.
Academia and research organisations
z Undertake or stimulate academic and national laboratory research on large-volume/high-energy use processes.
z Take action with industry leaders to identify top prospects for reducing technical barriers.
Financial institutions
z Work together with the chemical industry to better understand changes in funding requirements of a low-carbon chemical sector and funding opportunities of such a transition.
Key findings

6 Technology Roadmap Energy and GHG reductions in the chemical industry via catalytic processes
IntroductionMore than 95% of all manufactured products rely on chemistry (ICCA, 2010). Chemistry provides solutions in areas as diverse as alternative energy, transportation, communications, buildings, pharmaceuticals and information technology. Output from the chemical industry covers three wide ranges of products: base chemicals, speciality chemicals and consumer chemicals. These three product ranges provide benefits to consumers and a multitude of industries, including a strategic role in the generation, usage and storage of energy. The chemical sector is an enabler for growth in the global economy and development in emerging countries.
With global sales of USD 3 trillion and over seven million people employed in 2010, the chemical industry is one of the largest in the world. Not surprisingly, the chemical industry is also a large energy consumer. Around 90% of chemical processes involve the use of catalysts – i.e. added substances that increase the rate of reaction generally without being consumed by it – and related processes to enhance production efficiency and reduce energy use, thereby curtailing GHG emission levels.
In the face of sustainability concerns, rising energy costs and competitive pressures, this roadmap for the chemical and petrochemical industry (hereafter referred to as “the chemical industry”) investigates how advances in catalytic processes can contribute to further increasing the sector’s efficient use of energy and reducing emissions of GHGs.
At present, global energy demand for the chemical industry is 15 EJ per year (EJ/yr) excluding feedstock; including feedstock, the industry uses 42 EJ/yr and accounts for approximately 10% of the global energy demand or 30% of the total industrial energy demand worldwide (IEA, 2012). Furthermore, the chemical industry generates 5.5% of CO2 emissions (7% of global GHG emissions) and is responsible for 17% of industrial CO2 emissions (20% of the industrial GHG emissions). Energy consumption and GHG emissions associated with the manufacture of products are a major focus. In 2005, global GHG emissions across the chemical industry were 3.3 GtCO2-eq (+/- 25%), with 2.1 Gt from the manufacture of products and 1.2 Gt from extraction of feedstock/fuel and disposal phases (ICCA, 2009).
Despite these negative impacts, widespread use of many products (e.g. insulation, efficient lighting, lighter materials for automobiles and advanced materials for renewable technologies) has already made substantial contributions to reducing energy demand and emissions across many sectors. A study
compiling several life-cycle analyses (LCAs) showed that for every unit of carbon it emitted in 2005, the industry’s products and technologies enabled 2.1 units to 2.6 units of CO2-eq savings (compared to non-chemical alternatives) (ICCA, 2009).
The industry has a long history of reducing energy consumption and emissions while also providing innovative solutions. Since 1974, the chemical industry in the United States has improved its energy intensity (energy consumption per unit of production) by 50%; since 1990, the absolute level of GHG emissions has decreased by 13% (ACC, 2012). In Europe, energy intensity in 2010 in the chemical industry was 53.4 % lower than in 1990 (CEFIC, 2012).
While the sector is energy-intense, its very scope and scale (including in many cases large-scale production facilities) suggests that small changes in energy consumption and GHG emissions associated with particular chemical processes can have substantial impacts.
When investigating ways to reduce both energy consumption and emissions in the industry, stakeholders identified one area of significant potential: catalytic process advances, which refers to efforts to stimulate the chemical reactions across the full production chain of a given product such that the desired result is achieved with lower energy inputs and fewer GHG emissions (Box 1). This roadmap focuses on this substantial potential. Given the complexity of the industry, the roadmap will examine both a target-driven approach (based on the IEA model) and one that reflects expected evolution of industry from the technology perspective (the DECHEMA model), under different scenarios.
While catalysts play a vital role in chemical processes, they are not an isolated technology, as is the case for many technologies within other IEA technology roadmaps. Where a new catalyst is used to improve energy efficiency and reduce GHG emissions, it is usually not implemented in an isolated manner, but is combined with corresponding process technology advances, such as a new reactor design. Moreover, large-volume processes tend to be highly integrated, making it difficult to pinpoint the impact of the catalyst/catalytic step(s) on the energy use and emissions of the entire process. For this reason, the roadmap makes no attempt to separate the catalysis impact on specific units in a specific process chain. Instead, the roadmap considers the improvement in specific energy consumption (SEC) for the process enabled by catalyst improvement and the subsequent improvements in associated steps.

7Introduction
Objectives and scopeTo investigate the degree to which improved catalytic processes might reduce energy consumption and GHG emissions in the chemical industry, a partnership was formed between the IEA, the ICCA and DECHEMA to develop a roadmap that would:
z provide credible information on the potential to reduce energy consumption and GHG emissions through improved catalytic processes;
z identify process-related technology improvements and breakthroughs, as well as the paths to achieve them;
z identify hurdles and means to lower or overcome them;
z provide responsible advice for policy makers and industry on how to enable the desired results.
This roadmap provides a quantitative assessment of the main catalytic processes in the chemical sector and their impact on the top (i.e. largest volume) 18 chemical products. It also describes some impacts on other catalytic processes using rough estimates based on publicly available information. The impact of a small number of in-use products is highlighted qualitatively or using illustrative examples.
ApproachTwo key challenges arise when attempting to identify opportunities to reduce future energy consumption and GHG emissions in the chemical industry. First, many chemical products are not produced by a single production process, but by a number of different processes that employ different reaction pathways (catalytic and non-catalytic). Often, the production process also
The Chinese character for catalyst is the same as that for “marriage broker”; this is an apt description of the function a catalyst assumes for the partners in a reaction.
The input of a substance called a catalyst, stimulates an increase in the rate of a chemical reaction – usually by facilitating an alternative reaction pathway with lower activation energy. Unlike other reagents that participate in a reaction, catalysts are generally not consumed in the process. In some cases, they may participate in multiple reactions.
Catalysts steer chemical reactions towards a specific outcome and generally allow for easier-to-control process conditions, such as lower temperatures and pressures or increased yield. They are essential to efficient production across many industrial sectors: some 90% of chemical processes employ catalysts, as do nearly all petroleum refining processes (Yoneyama, 2010).
The global market for catalysts within these sectors was expected to reach USD 16.3 billion in 2012 (Freedonia Research), with those used in chemical processing accounting for about 75% of the market and those for petroleum refining the other 25%.
But the value of catalysis extends beyond chemical or refinery processes. Catalysts are used in many other industrial applications, e.g. for reducing emission of air pollutants from flue gas at power or other industrial plants. Moreover, catalysis underpins equipment and products used in daily life in a variety of applications such as catalytic converters in cars, self-cleaning surfaces, indoor air control and laundry detergents that are effective in colder water.
Catalysts can be either compounds dissolved in the reaction mixture (homogenous catalysis) or solids dispersed in the reaction mixture or provided on the reactor walls as a coating (heterogeneous catalysis). The use of enzymes for chemical transformations is referred to as biocatalysis.
Not all applications of catalysis target energy savings or GHG reductions, and some have only indirect impacts on these criteria. This roadmap focuses primarily on areas with the most direct energy and GHG impact for the chemical sector, but of course other areas have potential for improved catalysis and additional impact.
Box 1: Catalysts in the chemical industry: a target for transformation
8 Technology Roadmap Energy and GHG reductions in the chemical industry via catalytic processes
requires a combination of technologies, some of which may be integral to a catalytic process. Thus, it is difficult to quantify precisely the degree to which a single reaction or technology contributes to improved efficiency, or at which stage. The second challenge is that the industry is constantly evolving, often with the aim of improving efficiency. Historically, small improvements were achieved on a regular basis; because of the scale of the industry, some have had substantial impacts. Other reaction or technology improvements are more significant and, on occasion, a radical breakthrough in the catalyst or the technology occurs that essentially “changes the game”.
This roadmap examines two approaches for projecting into the future: both use modelling technologies and are based on current knowledge. Both models use the same data on current production volumes as well as on current levels of energy consumption and CO2 emissions for the products analysed. But the IEA and DECHEMA modelling exercises follow different approaches to project the future impact, and use available data and information in two different ways.
z The IEA model is target-oriented, following the approach used for its publication Energy Technology Perspectives 2012 (ETP 2012), which aims to achieve a global scenario in which average temperature increase is limited to 2°C. Globally, this requires a 50% reduction in energy-related CO2 emissions across the energy sector in 2050 compared to 2009 levels. The IEA model assesses the current share of the chemical industry in global energy demand and emissions, and explores the technology pathway required to achieve the level of reduction needed such that the industry as a whole makes its fair contribution to the global goal. As in its modelling of other sectors, the ETP approach considers a wide range of technologies that can influence a given sector. In the case of the chemical industry, technologies considered include deploying BPTs, improving membranes and separation processes, using bio-based fuels and integrating carbon capture and storage (CCS) facilities in chemical plants. The IEA then considers how policy can stimulate the necessary action on the part of all industry stakeholders.
z The DECHEMA approach is more reflective of the industry perspective of identifying opportunities to improve specific processes to
reduce the energy and emissions impacts of individual chemical products. Thus, the starting point for the DECHEMA scenarios is the analysis of “energetics”, which concerns the gap between what is “theoretically optimal” in a particular process and current realities. To a large degree, the DECHEMA model extends past trends into the future, acknowledging that the combination of catalysts and technological advances will deliver four types of progress, each with greater capacity to close the gap: incremental improvements, BPT, emerging technologies and game changers.
This model identifies the largest gaps, which reflect the best opportunities for radical improvement (game changers). But it also acknowledges that closing such gaps typically requires years of R&D, and substantial financial investment. At the other extreme – i.e. where processes are already close to the theoretical limits for efficiency and emissions reduction – future advances are likely limited to incremental improvements. In this case, it becomes more valid to ask “How much gain, at what cost?” A challenge inherent within the industry perspective is that energy efficiency and – with the introduction of carbon markets – emissions reduction have a monetary value that not only contributes to project justification but can also affect competitiveness. Gains made by one company can be protected by intellectual property rights and may not be deployed to the same degree as gains achieved by academia or public research institutions.
Importantly, while the IEA and DECHEMA models take different approaches and measure somewhat different things, they arrive at a similar conclusion: the potential to improve energy efficiency and reduce emissions in the chemical industry is substantial – and collective effort by all stakeholders is needed to achieve them.
This roadmap focuses quite narrowly on catalytic processes within the chemical and petrochemical industry. It presents the IEA approach first, followed by an extensive section highlighting the potential impact of the technology advances reflected in the DECHEMA model. The visioning section compares the results and sets out actions and milestones to achieve stated goals. While significant energy and emissions reductions are possible from other catalytic processes and in-use products, these are not treated quantitatively, but rather qualitatively in this roadmap.
9Introduction
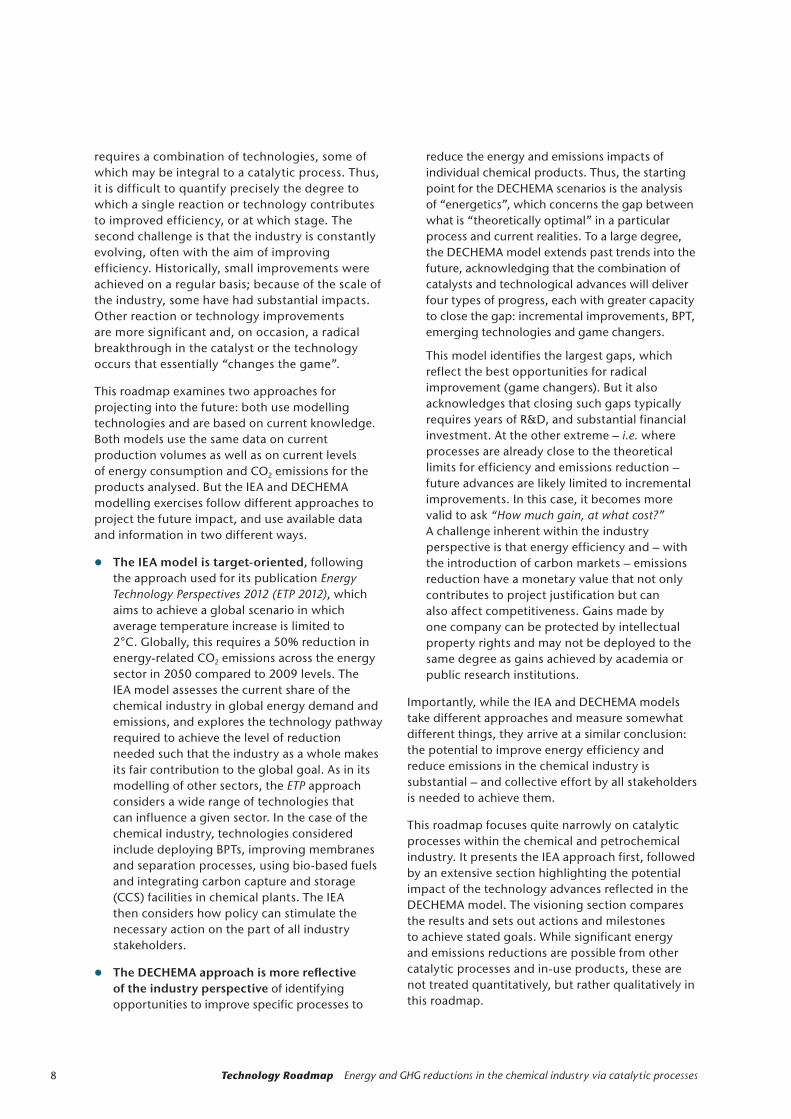
Figure 1: Comparison of approach, boundaries and process coverage of IEA and DECHEMA models
Combustion-related CO emissions2
Inp
uts
Mod
ellin
gR
esu
lts
2010 (SRI, USGS) Production volume 2010-50 (SRI)
Overall chemical sector analysis with Specific energy consumption (SEC) 18 products, 130 catalytic processesdetailed modelling of top five productsproduction routes
Specific GHG emissions GHG by process and energy consumption
Country and region specific Fuel mix Regional
Within framework of climate goals:
� Production development based oneconomic growth and population
� SEC improvement through BPTadoption and tech. development
� Production, energy consumption,CO emissions2
� Part of global IEA energy model
� Contribution of energy efficiencyand recovery, CCS, fuel switching
� Technology targetsfor energy andemission reductions
� R&D/innovation areas
� Needs for technologyimplementation
IEA DECHEMA
Refineries other catalyst in-use impact
Quantitative assessment
Qualitative
Quantitative assessment
Technologydeployment
and policy support
SEC and GHG developmentdepending on technology options:� Incremental improvements� Best practice technology� Emerging technologies� Game changers
� Energy consumption and GHGemissions
� Impact of biomass and hydrogen
As illustrated in Figure 1, the two models use the same assumptions over the period 2010-50 regarding projected production volumes, SEC and the future fuel mix. They differ, however, in some other aspects. The IEA approaches (green) the overall chemical sector with detailed modelling by production routes for the top five products in terms of energy consumption and CO2 emissions.4 Both approaches examine regional differences expected to arise within the chemical industry. Using data from SRI, the DECHEMA approach (blue) analyses 18 chemical products, for which there are 130 catalytic processes, to assess energy consumption and emissions by process. It focuses on technology improvements, which are described below.
4. The IEA numbers do not include indirect CO2 emissions attributed to electricity use, whereas the numbers for the 18 chemical products include both direct and indirect emissions.
IEA global scenarios The IEA ETP model (Box 2) analyses the energy and CO2 emissions savings needed across all sectors to reach levels that climate science research indicates would give an 80% chance of limiting average global temperature increase to 2°C. Starting from current performance, it seeks to identify the least-cost combination of technology, policy and pricing to achieve that goal, balancing out the current impacts and possible contributions of each major sector. The analysis in this roadmap focuses on core processes in the chemicals sector. To this end, the model assesses the energy and CO2 reduction potentials of key activities such as penetration of BPT-process heat savings, process integration, co-generation,5 recycling, energy recovery, fuel switching, new technologies and electricity
5. Co-generation refers to the combined production of heat and power.
KEY POINT: The IEA model examines the chemical sector with detailed modelling of the top five products while the DECHEMA model examines more closely how catalysis and technology might advance in parallel. The two scenarios are complementary while providing different views.

10 Technology Roadmap Energy and GHG reductions in the chemical industry via catalytic processes
savings. BPT, in the IEA model, represents the most advanced technologies currently in use at industrial scale (Saygin et al, 2009).
DECHEMA scenarios of technical improvement potentials for catalytic processesAt the outset, DECHEMA recognised that publicly available information of catalyst impacts on process efficiency is limited and quantifying the impact would depend on the ability to obtain credible information from industry and other sources (Box 3). To achieve the desired quantitative assessment of impact within the chemical industry, the study combines findings from three complementary approaches. The most relevant potential improvement data were obtained by:
z Sending questionnaires on the top 40 energy-using catalytically relevant industrial processes to:
z Chemical manufacturers were asked to report on production volumes, energy consumption and GHG emissions, historical improvement rates and future potential improvements. DECHEMA received 92 reports on individual processes from 28 companies; 73 of those reports included energy data for defined processes.
z Catalyst manufacturers were surveyed regarding past and future potential improvements and major R&D areas.
z Academic experts were asked to identify future research developments and ideas.
z Augmenting/verifying the survey information via complementary data on individual processes as supplied by SRI Consulting (now IHS). Values were discussed with industrial experts during two meetings and information for several processes checked with licensors.
z Consulting open literature to provide a broad perspective.
The ETP 2°C Scenario (2DS) examines the implications of a policy objective to achieve the required emissions reduction that climate science research indicates would give an 80% chance of limiting average global temperature increase to 2°C. In this scenario, global energy-related CO2 emissions in 2050 are half the current level.
This does not mean that each industrial segment needs to reduce its emissions by 50%. Reaching the global CO2 emissions objectives in the most cost-effective way does require each sector to make a contribution, based on its cost of abatement. Under the 2DS, the goal for the chemical and petrochemical sector would be to reduce CO2 emissions by 1.3 GtCO2 by 2050, about 20% less than current levels.
The 6°C Scenario (6DS), serves as the ETP baseline (or business-as-usual) scenario: it assumes that no major new policies to reduce emissions will be introduced in the coming decades and technologies will be developed
and deployed at a rate similar to that in the past. The 2DS asks what policies are needed to promote the broad deployment of BPTs in order to achieve the energy and emissions reduction goals required to limit global temperature increase.
Results confirm that achieving the 2DS will be difficult; some of its assumed rates of change (e.g. annual change in sales of new technologies) are unprecedented. To achieve such a scenario, strong policies will be needed from governments around the world.
The ETP model is based on a TIMES model (www.iea.org/etp/methodology/) that uses cost optimisation to identify least-cost mixes of energy technologies and fuels to meet energy demand, given constraints such as availability of natural resources. In this study, it was used to provide a CO2 avoidance estimate using preferred technologies of lowest potential abatement cost.
Box 2: IEA Energy Technology Perspectives 2DS

11Introduction
DECHEMA used information from the above sources as inputs to model five scenarios. Each scenario reflects a more substantial improvement, which typically puts the categories of improvement further “out” on the development timeline.
Business-as-usual (BAU) assumes that today’s technology level – and hence the level of energy consumption and GHG emission of chemical processes – remains constant, i.e. without any further improvements. BAU is the baseline used for comparison in the improvement options described below.
Incremental improvement, a scenario that reflects relatively small and anticipated technological advances in the “normal course of business”. Examples include more selective, active and/or durable catalyst systems, optimised reactor performance, higher levels of heat integration, improved operating conditions, etc. Many such improvements are retrofits to already existing plants.
Best practice technology (BPT) refers to widespread deployment of best practice/established technologies in existing plants or new facilities.* Two scenarios are presented, one with conservative assumptions, the other being more optimistic. BPT implementation typically requires larger investments than incremental improvements, and is more likely to be part of new builds than retrofit initiatives. An example to illustrate the average SEC versus BPT is given in Annex 4.
Emerging technologies are characterised by step-change advances via new technology that is currently in later R&D stages, in demonstration or could realistically be commercialised. Two examples include: the replacement of the steam cracking process (currently run non-catalytically) by a catalytic process; and the methanol-to-olefin (MTO) process. Emerging technologies are usually applied in new plants/facilities.
Game changers prompt a paradigm shift by significantly changing the process: they might include finding direct production routes that omit intermediate processes, using alternative feedstock, changing basic mechanisms, etc. Game changer process options are typically far from commercialisation and face high economic and technical hurdles; thus, they are relatively high risk. If they become viable, they would be applied in new plants/facilities.
The degree of uncertainty increases with each category, so cases were developed with either optimistic or conservative assumptions concerning the rate of technology deployment. This allowed consideration of energy use and GHG reduction in areas with different improvement rates, development timelines and investment levels. Additional explanation can be found in the glossary (Annex 10).
*Note: in the chemical and petrochemical industry, given the scale of most plants, it is more appropriate to analyse potentials by reference to the most advanced technologies that are currently in use at industrial scale. Hence best practice technology (BPT) versus best available technology (BAT) where the latter are technologies which may be in operation in some plants, but are not yet widely proven at industrial scale either technologically or economically.
Box 3: DECHEMA scenarios

12 Technology Roadmap Energy and GHG reductions in the chemical industry via catalytic processes
The research carried out for this roadmap examines the energy use and GHG emission associated with the top 18 chemical products6 on the global scale. To help stakeholders target the most effective actions, the focus of the roadmap is narrowed to four product groups that have the highest energy and emission impacts. All four are, or can be, produced through catalytic processes:7
z Olefins (ethylene and propylene) are relatively stable compounds that contain one or more pairs of carbon atoms linked by a double bond. When the bond is broken, the molecules can quickly form two new single bonds, stimulating a variety of reactions. Olefins are formed in large quantities during the “cracking process” (breaking down of large molecules) by which petroleum oils are transformed into gasoline. At present, the most common process for producing olefins is “steam cracking” of naphtha, which is non-catalytic. They can also be produced by catalytic cracking of naphtha or by catalytic dehydration of methanol (MTOs), but these processes are much less common. Olefins, particularly ethylene and propylene, are widely used in the petrochemical industry, for example in the production of polymers used to manufacture synthetic rubber and other plastics. Global ethylene and propylene production in 2012 was 220 million tonnes (Mt).
z Ammonia is a compound of nitrogen and hydrogen with the formula NH3; it is a colourless gas with a pungent smell. It is used extensively in agriculture as a fertiliser, and serves as a building block in many pharmaceuticals and in cleaning products, as well as an anti-microbial agent in food processing. Global ammonia production in 2012 was estimated at 198 Mt.8
z BTX aromatics (benzene, toluene, xylenes) are also characterised by double-bonded carbon molecules that can be modified easily, and by a specific smell that prompted the use of “aromatics” as a group name. They are most commonly formed by catalytic reforming of naphtha in petrochemical refining. The BTX aromatics are vital to petroleum refining and petrochemical industries; demand for all three has risen rapidly in recent years. Global production of benzene in 2012, for example, was 43 Mt – an increase of 2 Mt over the previous year. They are also used in health and hygiene,
6. The products are listed in Annex 4, Table 5.
7. Detailed information on the remaining 14 products can be found in Annex 4, Table 5.
8. Ceresana, “Market Study Ammonia”, Ceresana, retrieved 7 November 2012.
food production and processing, transportation, information technology and other sectors.
z Methanol (also known as methyl alcohol) is a light, colourless and odourless liquid that is highly flammable. It is catalytically produced from carbon monoxide, carbon dioxide and hydrogen. Methanol is most commonly used to make other chemicals; about 40% is converted to formaldehyde, and further processed into plastics, plywood, paints, explosives and textiles. It is also used in anti-freeze, solvents, and fuels for vehicles (including recent biofuels) and can serve as energy carrier. Global methanol production in 2012 was estimated at 58 Mt.
When speaking of the chemical industry, it is important to distinguish between “processes” and “products”. The process refers to all steps – which may be many, both catalytic and non-catalytic, and involve a wide range of technologies – by which feedstock is transformed into products (ethylene, propylene, ammonia, methanol, etc.). The process typically involves a wide range of stages and technologies, many or all of which require energy inputs and may result in GHG emissions.
Considering only process-related energy for the manufacture of products from feedstocks, total world energy consumption of the chemical and petrochemical industry is estimated at 15 EJ/yr (IEA, 2012). It is important to note that this measure excludes the energy used to produce feedstocks and the energy content of the feedstocks used in the process.9 Together, the four products described above use 7.1 EJ/yr, or 47% of total energy demand for the sector. Expanding the product group to the 18 largest-volume chemicals (excluding chemicals made by electrochemical reactions) boosts the energy consumption figure to around 9.4 EJ/yr, or 63% of the total process-related energy, compared to much lower energy use by a huge number of small-volume products10 (Figure 2).11
Thus, within the category of large-volume chemicals, olefins, ammonia, BTX aromatics and methanol represent about 80% of the energy demand, which is why they are specifically targeted in this roadmap.
9. Calculations are based on the sum of all production routes. For each route, the average SEC worldwide has been multiplied by the production volume for the given route. The average SECs are in Annex 4.
10. Figure 3 in Annex 4 shows the raw materials, major process and primary products typical of the chemical industry.
11. For reference, the United States uses 93 EJ of primary energy and Germany used 13.7 EJ in 2010 (IEA statistics).
Status of current energy use and GHG emissions

13Status of current energy use and GHG emissions
Figure 2: Global energy consumption versus production volumes of top 18 large-volume chemicals, 2010
Note: Energy consumption for olefins in this figure represents that of the steam cracking process.Source: DECHEMA
The world total GHG emissions attributed to chemical and petrochemical processes amounts to 1.24 GtCO2-eq annually. GHG emissions of the 18 largest volume chemicals are 960 MtCO2-eq/yr, or more than 75% of the total (Figure 3).
Thus, addressing the energy intensity and GHG emissions12 of these large-volume chemicals, and the top 18 chemicals specifically, hold potential for substantial impacts on the global scale.13 Yet to grasp the complexity of the industry as a whole, it must be noted that some 130 different industrial processes can be used to manufacture the 18 products listed above – and that such processes are often specific to a particular company. Access to data and information about processes and products is often protected for proprietary purposes. As a result, identifying and promoting broad deployment of the most efficient and lowest emission processes is particularly challenging.
12. Average SECs and GHG emissions of existing plants are listedin Annex 4.
13. Production volumes, energy intensity and GHG emission intensity for the top 18 process-specific products are listed in Annex 4.
Another important factor affects both energy demand and emissions in the chemical industry. It is quite common that a variety of process steps – using several reactors and catalysts – must be carried out to deliver a particular product. Ammonia synthesis is a typical example, as seen in a simplified flow scheme that shows only the main process steps (Figure 4). Using mostly coal or natural gas as feedstock, the first reactor of an ammonia plant (the reformer) produces hydrogen and carbon monoxide to create a synthetic gas (syngas), but also resulting in CO2 emissions. A second reactor (the shift converter) uses water to convert the carbon monoxide into carbon dioxide and more hydrogen. Both of these first steps use catalysts for maximum efficiency. Following the removal of acid gas, the actual ammonia synthesis is performed by hydrogen reacting with nitrogen separated from air, using another catalyst.
KEY POINT: Five large-volume products (shown in red) dominate energy consumption of chemical processes.

14 Technology Roadmap Energy and GHG reductions in the chemical industry via catalytic processes
Figure 3: Global GHG emissions versus production volumes of top 18 large-volume chemicals, 2010
Note: GHG emissions for olefins in this figure represent that of the steam cracking process. Ammonia is presented on a different axis on the right.
Source: DECHEMA
Figure 4: Ammonia synthesis: a simplified schematic
BTX
Ethylene
Methanol
Propylene
Ammonia
0
20
40
60
80
100
120
140
160
0 50 000 100 000 150 000 200 000
Production volume (kt)
GH
Gem
issi
ons
(MtC
O-e
q)
2
0
50
100
150
200
250
300
350
Am
monia
:GH
Gem
issi
ons
(MtC
O-e
q)
2
Acrylonitrile Caprolactam Cumene
Para-Xylene
Polyethylene
Propylene Oxide Polypropylene Terephthalic AcidStyrene
Phenol
Vinylchloride
Ethylene OxideEthylene Glycol
Feed
Fuel
CO2 CO2
Acid gasremoval
Syngas H +CO2 2 H2
N2
CO shiftconverterCO+H O
H +CO2
2 2
NH3
Flue gas
CatalystCatalyst Catalyst
Synthesissection
Reformer
KEY POINT: GHG emissions of catalytic chemical processes are dominated by the top large-volume products.
KEY POINT: Catalysis is integral to ammonia production, playing a role at several points in the process.

15Status of current energy use and GHG emissions
At a simplistic level, virtually all producers of ammonia would look for opportunities to reduce energy demand and emissions by applying incremental improvements (better heat integration, catalyst tweaks, etc.) in each of these steps and, when economically viable, by adopting BPTs (state- of-the-art equipment, better catalysts, separations, etc.). As more producers take such steps, the global energy demand and emissions can be reduced substantially. Development and implementation of the ammonia synthesis scheme depicted above, called the Haber-Bosch synthesis, is a historic example of a catalysis breakthrough that became a game changer in ammonia synthesis (Box 4). The Haber-Bosch synthesis is also a good example of how catalysts and other process technologies often evolve in parallel. As the process requires the safe handling and processing of hydrogen at high pressure, several technical advances were required before an industrial scale process could be realised.
The efficiency of most chemical processing improves over time because of factors such as technology improvements, competition, need to reduce energy consumption and/or emissions, etc. As processes mature and approach their thermodynamic limit, the opportunity of radical improvements diminishes. Still, small changes across a large-volume chemical have a substantial global impact. Decades of innovation, energy integration and rising energy costs have captured most of the easily achieved energy intensity improvements. Yet, opportunities still exist compared to the theoretical energy use for some processes (see Annex 3).
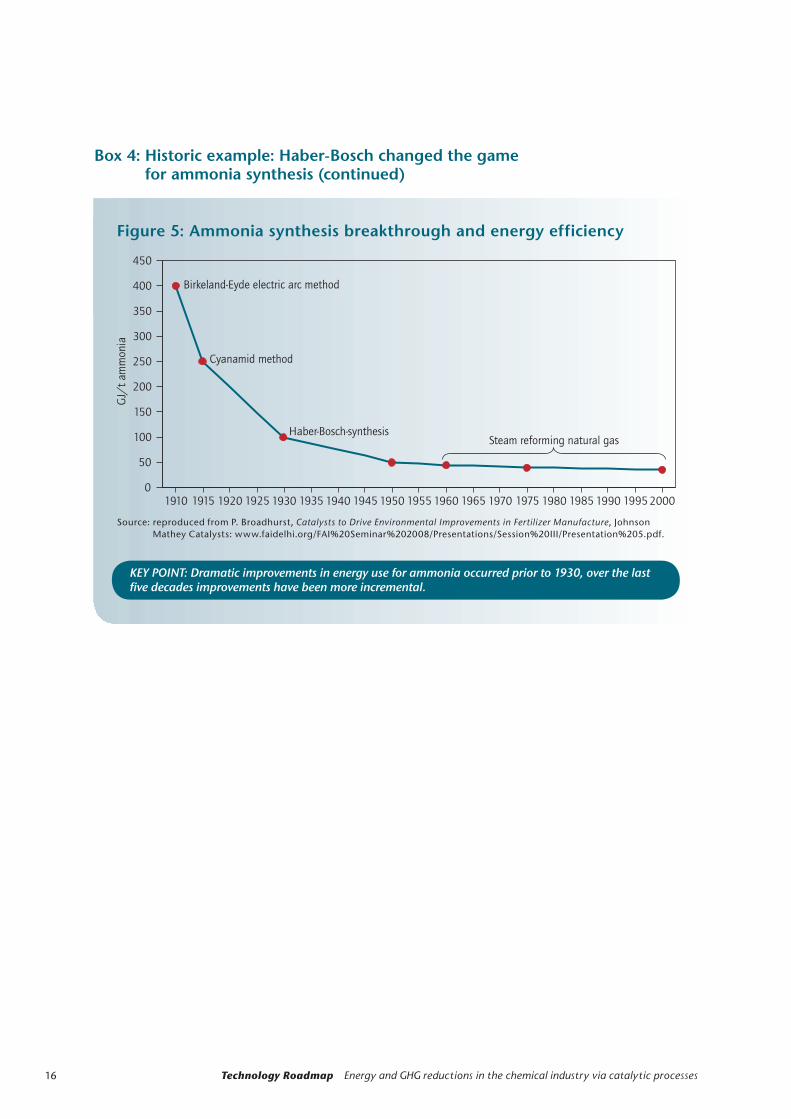
In the 1920s, Europe faced a potential food crisis: soils had been depleted of nitrogen, the key nutrient for plants. Although molecular nitrogen accounts for 78% of the atmosphere, it is in this form unavailable to plants. However, it was known that ammonia-derived fertilisers would break down in soil to release their constituent components of nitrogen (which plants could absorb).
At the time, ammonia was not available on an industrial scale, and could be made only by energy-consuming processes such as the electric arc process and the cyanamid process. Development of the Haber-Bosch synthesis not only delivered a real breakthrough in energy efficiency but was a prerequisite for industrial-scale ammonia production.
The name of this process reflects the important link between chemistry and technology. Chemist Fritz Haber first developed a method to convert nitrogen and hydrogen into ammonia. A key to this process was the introduction of an iron catalyst that was able to bind (adsorb) at its
surface both nitrogen and hydrogen molecules. Under a release of energy, the iron catalyst splits the bonded molecules into nitrogen and hydrogen atoms, which subsequently combine to form ammonia. The ammonia was then released (desorbed) into the gas phase.
Working for BASF, Carl Bosch developed the technology needed to carry out large-scale industrial production of ammonia. All of these steps are characterised by relatively low activation energy (the energy “hill” that needs to be mounted before the reaction takes place), thereby allowing the synthesis to proceed at a technically acceptable rate (Figure 5).
Both men received Nobel Prizes for the chemical and engineering achievements that averted a crisis in nitrogen-depleted soils: Haber in 1918 and Bosch in 1931. Today, ammonia synthesis is one of the most important catalytic process discoveries of mankind: about 50% of the world’s food production relies on ammonia-based fertilisers (Erismann, 2008).
Box 4: Historic example: Haber-Bosch changed the game for ammonia synthesis
16 Technology Roadmap Energy and GHG reductions in the chemical industry via catalytic processes
Box 4: Historic example: Haber-Bosch changed the game for ammonia synthesis (continued)
Figure 5: Ammonia synthesis breakthrough and energy efficiency
Source: reproduced from P. Broadhurst, Catalysts to Drive Environmental Improvements in Fertilizer Manufacture, Johnson Mathey Catalysts: www.faidelhi.org/FAI%20Seminar%202008/Presentations/Session%20III/Presentation%205.pdf.
0
50
100
150
200
250
300
350
400
450
Birkeland-Eyde electric arc method
Cyanamid method
1910 1915 1920 1925 1930 1935 1940 1945 1950 1955 1960 1965 1970 1975 1980 1985 1990 1995 2000
KEY POINT: Dramatic improvements in energy use for ammonia occurred prior to 1930, over the last five decades improvements have been more incremental.
17Technology opportunities
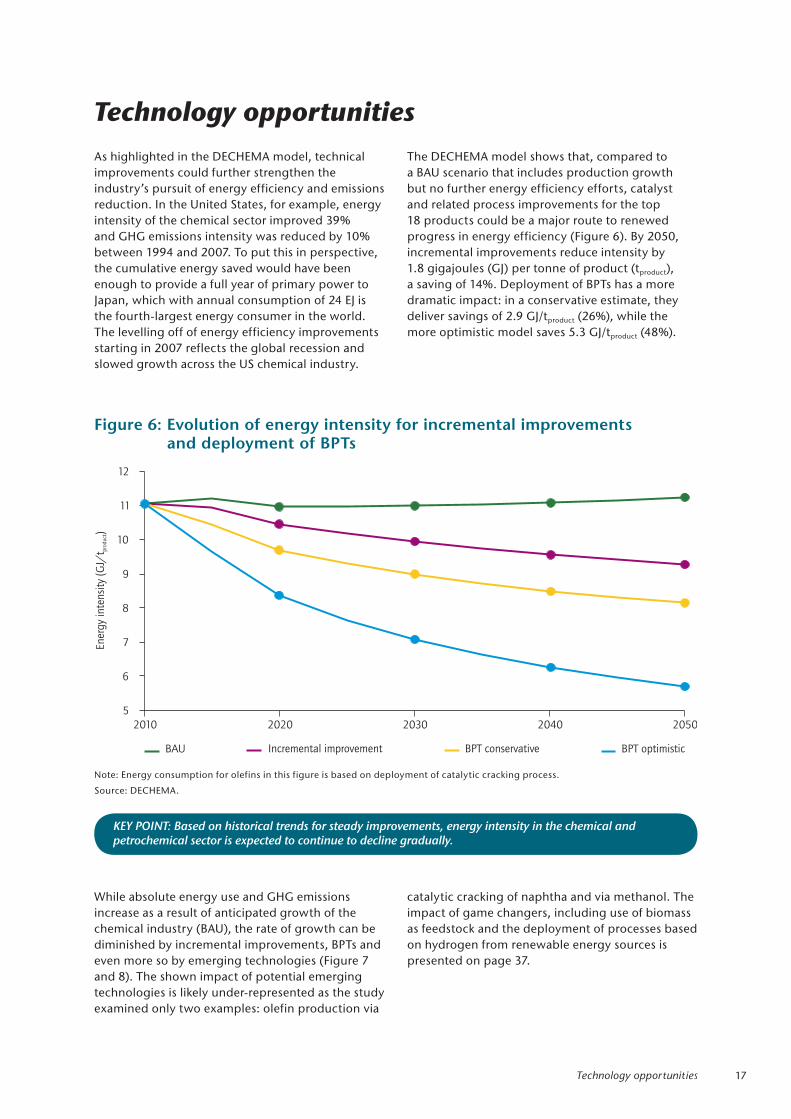
As highlighted in the DECHEMA model, technical improvements could further strengthen the industry’s pursuit of energy efficiency and emissions reduction. In the United States, for example, energy intensity of the chemical sector improved 39% and GHG emissions intensity was reduced by 10% between 1994 and 2007. To put this in perspective, the cumulative energy saved would have been enough to provide a full year of primary power to Japan, which with annual consumption of 24 EJ is the fourth-largest energy consumer in the world. The levelling off of energy efficiency improvements starting in 2007 reflects the global recession and slowed growth across the US chemical industry.
The DECHEMA model shows that, compared to a BAU scenario that includes production growth but no further energy efficiency efforts, catalyst and related process improvements for the top 18 products could be a major route to renewed progress in energy efficiency (Figure 6). By 2050, incremental improvements reduce intensity by 1.8 gigajoules (GJ) per tonne of product (tproduct), a saving of 14%. Deployment of BPTs has a more dramatic impact: in a conservative estimate, they deliver savings of 2.9 GJ/tproduct (26%), while the more optimistic model saves 5.3 GJ/tproduct (48%).
Figure 6: Evolution of energy intensity for incremental improvements and deployment of BPTs
Note: Energy consumption for olefins in this figure is based on deployment of catalytic cracking process.
Source: DECHEMA.
5
6
7
8
9
10
11
12
2010 2020 2030 2040 2050
Ener
gy
inte
nsi
ty(G
J/t
)pro
duct
BAU Incremental improvement BPT conservative BPT optimistic
KEY POINT: Based on historical trends for steady improvements, energy intensity in the chemical and petrochemical sector is expected to continue to decline gradually.
Technology opportunities
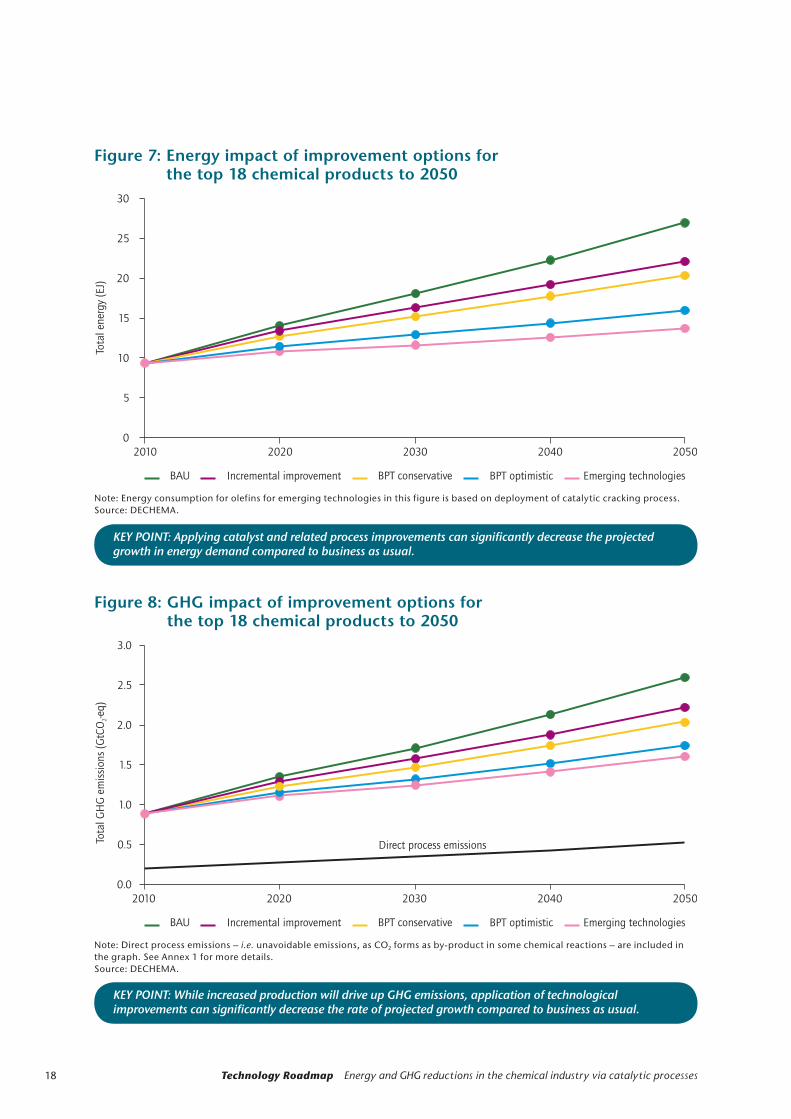
While absolute energy use and GHG emissions increase as a result of anticipated growth of the chemical industry (BAU), the rate of growth can be diminished by incremental improvements, BPTs and even more so by emerging technologies (Figure 7 and 8). The shown impact of potential emerging technologies is likely under-represented as the study examined only two examples: olefin production via
catalytic cracking of naphtha and via methanol. The impact of game changers, including use of biomass as feedstock and the deployment of processes based on hydrogen from renewable energy sources is presented on page 37.
18 Technology Roadmap Energy and GHG reductions in the chemical industry via catalytic processes
Figure 7: Energy impact of improvement options for the top 18 chemical products to 2050
Note: Energy consumption for olefins for emerging technologies in this figure is based on deployment of catalytic cracking process. Source: DECHEMA.
Figure 8: GHG impact of improvement options for the top 18 chemical products to 2050
Note: Direct process emissions – i.e. unavoidable emissions, as CO2 forms as by-product in some chemical reactions – are included in the graph. See Annex 1 for more details. Source: DECHEMA.
0
5
10
15
20
25
30
2010 2020 2030 2040 2050
Tota
len
ergy
(EJ)
BAU Incremental improvement BPT conservative BPT optimistic Emerging technologies
KEY POINT: Applying catalyst and related process improvements can significantly decrease the projected growth in energy demand compared to business as usual.
KEY POINT: While increased production will drive up GHG emissions, application of technological improvements can significantly decrease the rate of projected growth compared to business as usual.

19Technology opportunities
Incremental improvementsBased on data received from the survey of chemical manufacturers and feedback from other industrial experts, the DECHEMA model indicates that incremental improvements for specific processes can yield improvement (i.e. cause a decrease) of energy intensity in the range of 0.2%/yr to 1.0%/ yr.14 On a global scale, these improvements become significant and should be encouraged. In some cases, e.g. for caprolactam, much larger improvements in the range of 2.5%/yr to 3.0%/yr appear to be possible.
The purple lines in Figures 7 and 8 show the impact of incremental improvements for the top 18 products on energy consumption and GHG emissions. Against the BAU baseline (i.e. no further technological improvement takes place) in which energy consumption rises by 17.5 EJ (186%) and GHG emissions by 1.7 GtCO2-eq (194%) between 2010 and 2050, incremental improvements may reduce by 20% (5.3 EJ) the BAU energy projection and that of GHG emissions by 15% (384 MtCO2-eq) by 2050.
It should be noted that a number of chemical processes intrinsically generate GHGs as by-products. These direct non-energy-related process emissions are unavoidable.15 For the 18 chemicals analysed in the DECHEMA scenario, these emissions amount to 193 MtCO2-eq in 2010 and increase to 527 MtCO2-eq in 2050. As a result, developments in GHG emissions do not fully correlate with energy reduction.
14. Improvement factors of various processes are shown in Table 5 of Annex 4.
15. An example is the stoichiometric CO2 generation in ammonia production from gas (1 tCO2/t ammonia), or coal (2 tCO2/t ammonia).
Deployment of best practice technologiesAccelerated development and deployment of BPTs represent the best opportunity to reduce energy consumption and emissions over the next 20 years to 40 years, particularly as new plants are built in emerging and other economies. But decisions regarding the capital required for investments in new plant capacities are driven by a number of economic factors including energy and other utility costs, total investment costs, availability and prices of raw materials, licensing constraints and competitive conditions. These factors depend on the respective region and the chemical process, which makes it challenging to give a realistic assessment of the global BPT deployment rate. However, some simplified assumptions about retrofits of existing plants and deployment of new plants can be presented (Table 1).
The risk here, particularly in the current global economic conditions, is that producers will measure the economic viability of plants based solely on investment costs. This mentality of “shutdown economics” supports the argument for continuing to operate old plants that have already amortised their capital investment costs, even though they have outdated equipment and technologies. It also makes it difficult for state-of-the-art plants, which are still amortising capital costs and may have higher operational costs, to be competitive.
Widespread deployment of available BPT, through the replacement and refurbishment of existing plants and building of new plants at BPT efficiency level, could deliver important savings by 2050. In the BPT conservative scenario (yellow line in Figures 7 and 8), energy saving is 6.6 EJ and
Table 1: Summary of assumptions for BPT deployment scenarios in the chemical industry
Notes: SEC = specific energy consumption, BPT= best practice technology.
Facility BPT Conservative BPT Optimistic
Retrofits of existing plants 70% at SEC average level, 30% at BPT level All have SEC at BPT level
New plant deployment 50% at SEC average level, 50% at BPT level All have SEC at BPT level
Continued energy efficiency improvement per year 0.55% 1.1%
20 Technology Roadmap Energy and GHG reductions in the chemical industry via catalytic processes
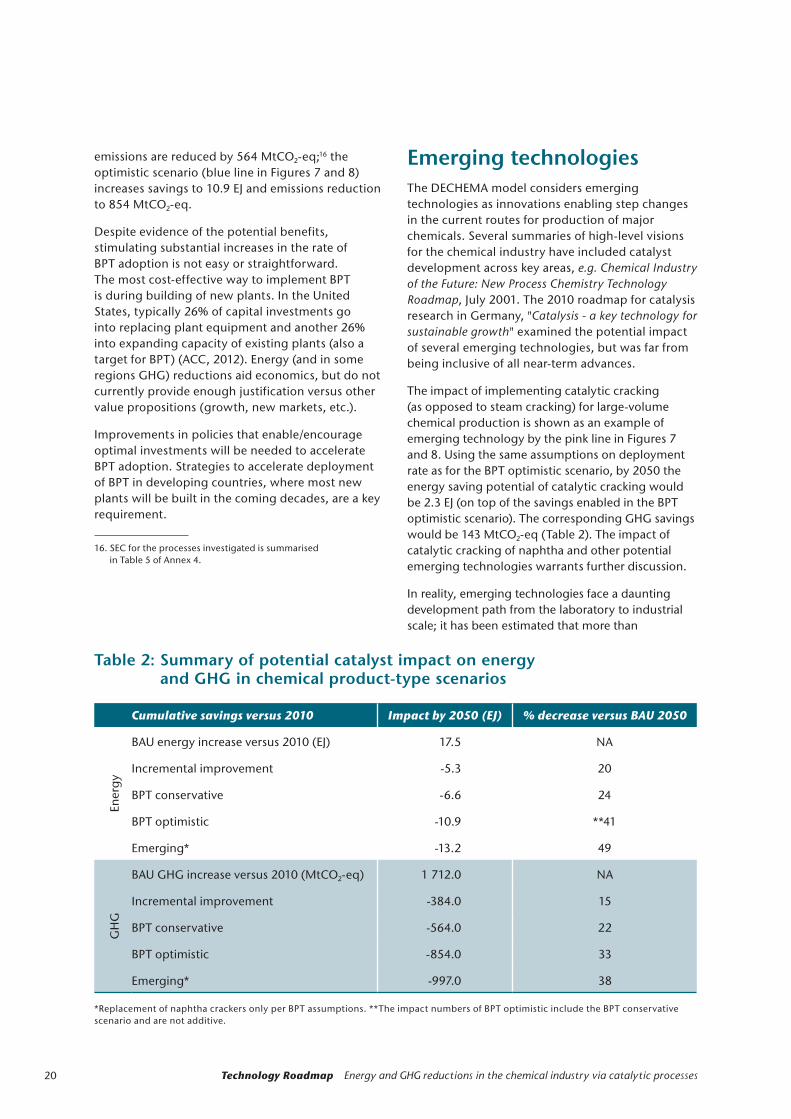
emissions are reduced by 564 MtCO2-eq;16 the optimistic scenario (blue line in Figures 7 and 8) increases savings to 10.9 EJ and emissions reduction to 854 MtCO2-eq.
Despite evidence of the potential benefits, stimulating substantial increases in the rate of BPT adoption is not easy or straightforward. The most cost-effective way to implement BPT is during building of new plants. In the United States, typically 26% of capital investments go into replacing plant equipment and another 26% into expanding capacity of existing plants (also a target for BPT) (ACC, 2012). Energy (and in some regions GHG) reductions aid economics, but do not currently provide enough justification versus other value propositions (growth, new markets, etc.).
Improvements in policies that enable/encourage optimal investments will be needed to accelerate BPT adoption. Strategies to accelerate deployment of BPT in developing countries, where most new plants will be built in the coming decades, are a key requirement.
16. SEC for the processes investigated is summarised in Table 5 of Annex 4.
Emerging technologiesThe DECHEMA model considers emerging technologies as innovations enabling step changes in the current routes for production of major chemicals. Several summaries of high-level visions for the chemical industry have included catalyst development across key areas, e.g. Chemical Industry of the Future: New Process Chemistry Technology Roadmap, July 2001. The 2010 roadmap for catalysis research in Germany, "Catalysis - a key technology for sustainable growth" examined the potential impact of several emerging technologies, but was far from being inclusive of all near-term advances.
The impact of implementing catalytic cracking (as opposed to steam cracking) for large-volume chemical production is shown as an example of emerging technology by the pink line in Figures 7 and 8. Using the same assumptions on deployment rate as for the BPT optimistic scenario, by 2050 the energy saving potential of catalytic cracking would be 2.3 EJ (on top of the savings enabled in the BPT optimistic scenario). The corresponding GHG savings would be 143 MtCO2-eq (Table 2). The impact of catalytic cracking of naphtha and other potential emerging technologies warrants further discussion.
In reality, emerging technologies face a daunting development path from the laboratory to industrial scale; it has been estimated that more than
Table 2: Summary of potential catalyst impact on energy and GHG in chemical product-type scenarios
Cumulative savings versus 2010 Impact by 2050 (EJ) % decrease versus BAU 2050
Ener
gy
BAU energy increase versus 2010 (EJ) 17.5 NA
Incremental improvement -5.3 20
BPT conservative -6.6 24
BPT optimistic -10.9 **41
Emerging* -13.2 49
GH
G
BAU GHG increase versus 2010 (MtCO2-eq) 1 712.0 NA
Incremental improvement -384.0 15
BPT conservative -564.0 22
BPT optimistic -854.0 33
Emerging* -997.0 38
*Replacement of naphtha crackers only per BPT assumptions. **The impact numbers of BPT optimistic include the BPT conservative scenario and are not additive.
21Technology opportunities
3 000 good ideas must be tested in the laboratory to produce one commercial success (Stevens and Burley, 1997). Developing policies to provide financial incentives for top candidate processes that positively impact energy and GHG emissions would be one way to help companies pursue development so that more promising solutions survive this selection process. Consistent funding of developments over a long period is required to deliver steady progress, improve reliability and economics, and to keep knowledge workers in the field.
Olefin production via catalytic cracking of naphtha or via methanol
Steam cracking, which converts hydrocarbon feedstocks (naphtha, ethane, etc.) to olefins (such as ethylene and propylene, which are major feedstocks for a variety of chemical products) and other products, is currently the major process route for olefin production. It is, however, a highly energy-consuming non-catalytic process. Due to the very high production volumes and high-energy demand even when using state-of-the-art processes, DECHEMA considers emerging technologies for olefin production to be those with the largest potential energy saving impact. Several advanced olefin technologies could allow for substantial reductions in energy consumption, with two showing the greatest potential.
Olefin production via catalytic cracking of naphtha: A recent comparison of the SEC of steam cracking against innovative olefin technologies showed that catalytic olefin technologies using naphtha could deliver energy savings of 10% to 20% (Ren, Patel and Blok, 2006). Technologies for catalytic naphtha cracking have been developed by different research institutes and companies, such as the Korean Research Institute of Chemical Technologies (KRICT), LG (Chemical Week, 2002) or Asahi Kasei. A pilot plant run by KRICT required approximately 10 GJ to 11 GJ of energy per tonne of high-value chemicals17 (GJ/tHVC) (Han, 2002), compared to the value of BPT plants for traditional steam cracking (12 GJ/tHVC). KRICT has now implemented the technology as a first commercial catalytic cracking plant in China. As state-of-the-art
17. High-value chemicals (HVC) refers to products from naphtha cracking. This process delivers ethylene and propylene as main products, but also forms a number of other valuable by-products. Hence, energy consumption is allocated to the whole range of HVC products. For details see Annex 1: Boundary conditions for the DECHEMA model.
naphtha cracking consumes approximately 20% less energy than the current world average for simple steam cracking, replacing some of the older existing crackers with catalytic olefin technologies could lead to overall energy savings of 30% to 40%.
Olefin production via methanol: Methanol is a platform chemical enabling an alternative pathway to produce small olefins, in particular ethylene and propylene. The so-called MTO process circumvents steam cracking of naphtha or ethane, and allows producing olefins from gas or coal instead of oil. MTO technologies licensed by UOP/Norsk Hydro, SYN Energy Technology Co. Ltd./Lummus Technology and others have entered commercialisation (Barger, 2003). Using the DECHEMA model, analysis of MTO as an emerging technology does not show energy saving potential compared with naphtha cracking (details in Annex 4). Methanol production as part of the process chain leading to olefins clearly dominates the energy consumption for the gas-based route via methanol and MTO; in fact, nearly a doubling of the energy for steam cracking is required for this process chain.18 DECHEMA therefore does not consider MTO as belonging in the emerging technology scenario targeting a reduction of energy consumption and GHG emissions.
Other emerging technologies
Several other chemicals from the top 18 could benefit from further development of emerging technologies. For example, among different synthetic pathways to produce propylene oxide (PO), the hydrogen peroxide propylene oxide (HPPO) process is an emerging technology.19 The HPPO process is a single-product PO process (the co-product being water) that oxidises propylene with hydrogen peroxide. Its energy consumption is about 35% lower than the conventional process. However, energy is required to produce the hydrogen peroxide, so accounting for that, the energy reduction of the entire process chain would be around 10% to 12%. At present, three commercial plants are on stream: a 100 kilotonnes (kt) plant in Ulsan, Korea based on Evonik/Uhde technology; a 300 kt plant in Antwerp, Belgium; and a 390 kt plant in Thailand. The latter two are based on BASF/Dow Chemical technology.
18. The energy required for production of methanol as feedstock for the MTO process was included in the battery limit for the olefin production (see discussion of SEC definition in Annex 1 and Annex 4).
19. Other pathways for propylene oxide are listed in Annex 2.Other pathways for propylene oxide are listed in Annex 2.Annex 2.

22 Technology Roadmap Energy and GHG reductions in the chemical industry via catalytic processes
Game changersGame changers essentially re-invent the way something is done. They follow an even more circuitous and difficult path to development than emerging technologies, often requiring advances on multiple technology fronts. Being of much larger scale and entailing much greater risk, game changers can have development periods stretching across the professional careers of many scientists and engineers. These legitimate pursuits require programmes that are tailored to the specific challenges and needs of extensive R&D and subsequent deployment. They also require substantial long-term funding.
Re-invention of the way that selected large-volume chemicals are made could bring an even larger potential improvement than incremental implementation, BPT or emerging technology for GHG reductions. Compared to BPT, however, they may result in higher energy use (considering the entire scope of energy required to run these processes in the future).
Catalysis can play a key role in enabling game changers to uncover alternative reaction pathways, as shown with the historic example of the Haber-Bosch ammonia process (see Box 4). More recent efforts include improved hydrogen generation for
steam methane reformers or upgrading of bio-oils (Jones and Elliott, 2011), as well as light alkane upgrading (direct route for methane to methanol, propanol, etc.) (TOPCOMBI, 2007). Other areas include: synthesis of aromatics from lignin, ethanol or methane; direct synthesis of hydrogen peroxide from hydrogen and oxygen; or direct epoxidation of propylene with oxygen. The list of such potential “dream reactions” is long, and catalysis will play a key role in enabling such new reaction pathways.20 This roadmap considers two potential game changers as warranting specific mention:
z use of hydrogen from renewable energy sources to produce ammonia and methanol;
z use of biomass as feedstock.
Hydrogen-based production of ammonia and methanol
Generation of hydrogen is one of the largest energy-consuming steps in the production of the crucial chemical precursors ammonia and methanol. The possibility of using hydrogen from renewable energy sources could significantly reduce
20. Note that catalysis does not overcome intrinsic thermodynamic limitations, which in some cases can result in low conversion, difficult (energy-intense separation) and large (energy intense) recycle streams or make a given reaction impossible under technically accessible process conditions.
Shale gas has become an increasingly important source of natural gas in the United States and interest has spread to potential gas shales in Canada, Europe, Asia and Australia. The arrival of shale gas, its impact globally and the need to follow “rules” allowing continued development were recently described in “Golden Rules for a Golden Age of Gas” (IEA, 2012).
The recent uptake of shale gas production has considerably changed the feedstock situation in several world regions, and therefore warrants mention, as significant opportunities are evident for catalyst and related process improvements. Small-scale, catalytic gas-to-liquid (GTL) facilities are key to economically viable exploitation of remote and unconventional gas reservoirs. Being transportable, such facilities can be used close to
the production site (both onshore and offshore) to convert shale gas, stranded gas or associated gas into liquid fuels via Fischer-Tropsch synthe-sis. Catalysts also play a key role in helping to make the transformation of natural gas-to-chem-ical products as energy efficient as possible. The use of ethane and propane from shale gas has already stimulated several producers to an-nounce the building of new ethane crackers for ethylene production and propane dehydrogena-tion plants for making propylene.
These developments provide excellent opportu-nities for the deployment of emerging catalytic olefin technologies. In addition to olefins, routes from low-cost gas-to-aromatics (BTX) are also of interest. This last area is still in the early stage and requires intense R&D efforts.
Box 5: Gas-to-liquids from shale gas

23Technology opportunities
the fossil-fuel use and GHG footprint of these processes. Catalysis could be an enabler for efficient hydrogen generation, particularly in areas such as photocatalysis or photovoltaic-assisted water electrolysis (using solar energy to help split water). This option warrants further investigation along three lines:
z production of H2 from electrolytic water cleavage using electricity from renewable sources;
z ammonia synthesis from H2 and nitrogen gas (N2), omitting steam reforming and/or water-gas shift from gas or coal;
z methanol synthesis from H2 and either coal or CO2 as the carbon source.
One of the key process steps to produce hydrogen today is electrolytic water cleavage, which is a highly energy-intensive process. In fact, the energy required to prepare the hydrogen must be considered at several levels (Figure 9).21
21. Details on the analysis performed can be found in Annex 5.
Figure 9: Process steps involved in hydrogen from the water cleavage option
Electr. watercleavage
MeOH
Water
NH3
Air separation unitNH synthesis3
Air
MeOH synthesisPartial oxidationCoal
H2
CO
CO2
Reversewater-gas shift
H O2
H2
H2
N2
H compression2
KEY POINT: Renewable hydrogen production is currently very energy intensive.
Compared to BPT energy consumption for ammonia production from gas, ammonia synthesis based on hydrogen from renewable energy sources requires roughly 26 GJ/tammonia (NH3) more energy. For methanol (MeOH) from hydrogen and coal, an additional 15.7 GJ/tMeOH are required compared to the gas steam reforming route and additional 5.6 GJ/tMeOH compared to the coal partial oxidation route. The methanol route from hydrogen and CO2 requires the most energy due to its high stoichiometric hydrogen demand. This route is, however, interesting from a GHG-saving perspective.
Assuming a 30% implementation rate for hydrogen-based routes for methanol and ammonia by 2050, the energy consumption would increase by 2.4 EJ (total energy bars in Figure 10). Hence, the total energy required to produce methanol and ammonia using hydrogen from renewable energy sources would be higher (1.16 EJ), albeit with lower fossil fuel use (fossil energy saving bars in Figure 10).
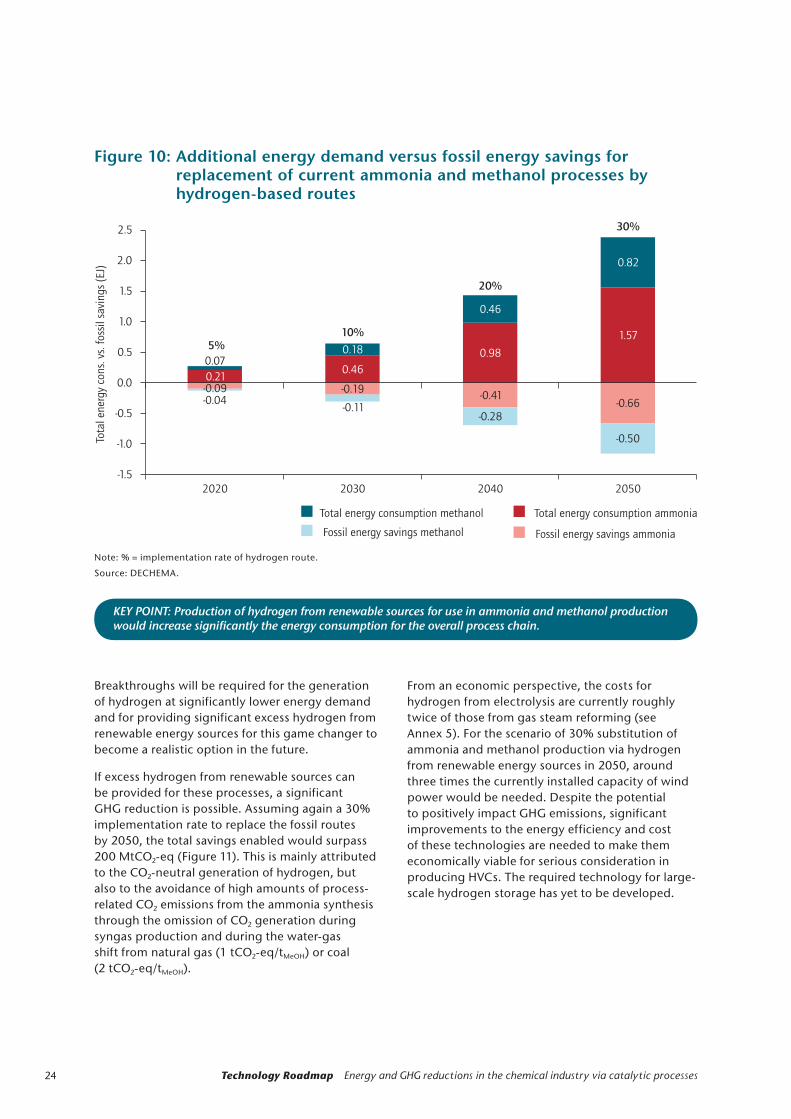
24 Technology Roadmap Energy and GHG reductions in the chemical industry via catalytic processes
Breakthroughs will be required for the generation of hydrogen at significantly lower energy demand and for providing significant excess hydrogen from renewable energy sources for this game changer to become a realistic option in the future.
If excess hydrogen from renewable sources can be provided for these processes, a significant GHG reduction is possible. Assuming again a 30% implementation rate to replace the fossil routes by 2050, the total savings enabled would surpass 200 MtCO2-eq (Figure 11). This is mainly attributed to the CO2-neutral generation of hydrogen, but also to the avoidance of high amounts of process-related CO2 emissions from the ammonia synthesis through the omission of CO2 generation during syngas production and during the water-gas shift from natural gas (1 tCO2-eq/tMeOH) or coal (2 tCO2- eq/ tMeOH).
From an economic perspective, the costs for hydrogen from electrolysis are currently roughly twice of those from gas steam reforming (see Annex 5). For the scenario of 30% substitution of ammonia and methanol production via hydrogen from renewable energy sources in 2050, around three times the currently installed capacity of wind power would be needed. Despite the potential to positively impact GHG emissions, significant improvements to the energy efficiency and cost of these technologies are needed to make them economically viable for serious consideration in producing HVCs. The required technology for large-scale hydrogen storage has yet to be developed.
Figure 10: Additional energy demand versus fossil energy savings for replacement of current ammonia and methanol processes by hydrogen-based routes
Note: % = implementation rate of hydrogen route.
Source: DECHEMA.
KEY POINT: Production of hydrogen from renewable sources for use in ammonia and methanol production would increase significantly the energy consumption for the overall process chain.
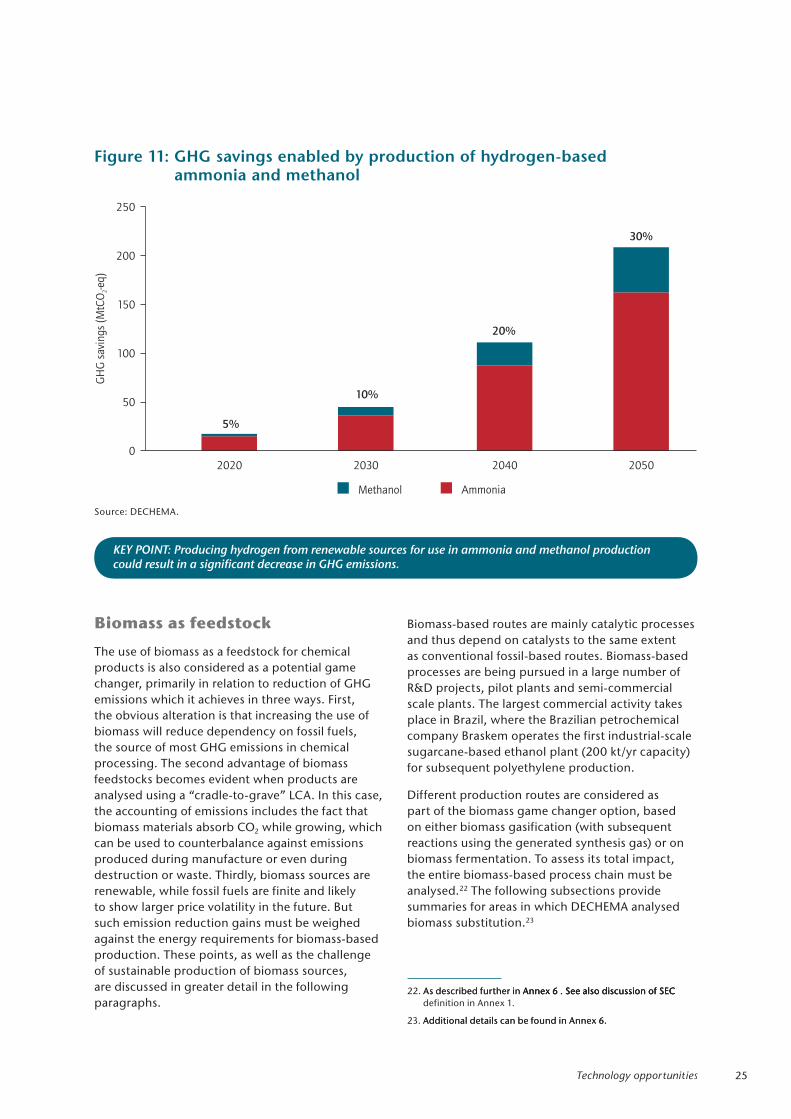
25Technology opportunities
Biomass as feedstock
The use of biomass as a feedstock for chemical products is also considered as a potential game changer, primarily in relation to reduction of GHG emissions which it achieves in three ways. First, the obvious alteration is that increasing the use of biomass will reduce dependency on fossil fuels, the source of most GHG emissions in chemical processing. The second advantage of biomass feedstocks becomes evident when products are analysed using a “cradle-to-grave” LCA. In this case, the accounting of emissions includes the fact that biomass materials absorb CO2 while growing, which can be used to counterbalance against emissions produced during manufacture or even during destruction or waste. Thirdly, biomass sources are renewable, while fossil fuels are finite and likely to show larger price volatility in the future. But such emission reduction gains must be weighed against the energy requirements for biomass-based production. These points, as well as the challenge of sustainable production of biomass sources, are discussed in greater detail in the following paragraphs.
Biomass-based routes are mainly catalytic processes and thus depend on catalysts to the same extent as conventional fossil-based routes. Biomass-based processes are being pursued in a large number of R&D projects, pilot plants and semi-commercial scale plants. The largest commercial activity takes place in Brazil, where the Brazilian petrochemical company Braskem operates the first industrial-scale sugarcane-based ethanol plant (200 kt/yr capacity) for subsequent polyethylene production.
Different production routes are considered as part of the biomass game changer option, based on either biomass gasification (with subsequent reactions using the generated synthesis gas) or on biomass fermentation. To assess its total impact, the entire biomass-based process chain must be analysed.22 The following subsections provide summaries for areas in which DECHEMA analysed biomass substitution.23
22. As described further in Annex 6 . See also discussion of SEC As described further in Annex 6 . See also discussion of SEC Annex 6 . See also discussion of SEC definition in Annex 1.
23. Additional details can be found in Annex 6.Additional details can be found in Annex 6.
Figure 11: GHG savings enabled by production of hydrogen-based ammonia and methanol
Source: DECHEMA.
0
50
100
150
200
250
GH
Gsa
vings
(MtC
O-e
q)
2
Methanol Ammonia
10%
20%
30%
5%
2020 2030 2040 2050
KEY POINT: Producing hydrogen from renewable sources for use in ammonia and methanol production could result in a significant decrease in GHG emissions.

26 Technology Roadmap Energy and GHG reductions in the chemical industry via catalytic processes
Olefins and polyethylene synthesis from biomass
Olefins (ethylene, propylene) and subsequent products can be produced from biomass in different ways, but in all cases biomass (the primary feedstock) is converted into a secondary feedstock which is then used for olefin production. A common pathway is the fermentation of sugar-/starch-rich biomass (such as sugar cane, sugar beet and maize) to ethanol (as secondary feedstock), which is then converted (by dehydration) into ethylene. Alternatively, biomass can be gasified into a synthetic gas, which is used for methanol production (secondary feedstock). Olefins are then made using the MTO process already described. Converting the biomass (the primary feedstock) into the fuel (the secondary feedstock) for HVC24 production is very energy-intensive.
Overall, the energy consumption of the relevant biomass routes is 3.5 to 5 times that of the fossil route (Figure 12). Energy demand is highest (72.5 GJ/tHVC) for ethanol from sugar cane, reflecting the relatively inefficient production of ethanol and the energy required for ethanol distillation from the product streams, which contain large amounts of water but relatively low concentrations of ethanol.
24. For explanation of the term HVC, see Glossary and Annex 1: Boundary conditions for the DECHEMA model.
Compared to energy demand for naphtha cracking (5 GJ/tHVC), the process for olefin production by lignocellulose gasification, subsequent methanol synthesis and MTO is very high (64.5 GJ/tHVC).
Considerable variation is found in the systems studied and data treatment in this area, yet all reports agree that the biomass routes require substantial amounts of biomass feed and high volumes of biomass-based energy. The two biomass routes analysed (via ethanol from sugarcane and via lignocelluloses from methanol) require 20% to 200% less fossil energy, but overall energy use increases substantially (Figure 13).
Figure 14 compares the routes of lignocelluloses via methanol and sugar cane via ethanol; assumed deployment rates are 2.5% biomass use in 2020, 5% in 2030 and 10% in 2040.The ethanol route has the highest fossil fuel saving potential with 1.6 EJ in 2040, while the methanol route requires less biomass-based energy – i.e. 2.3 EJ instead of 4.7 EJ (Figure 15).25 Total energy consumption, however, increases by 2.2 EJ for the methanol route and 3.0 EJ for the ethanol route.
25. Basic assumptions for this scenario are summarised in Annex 6.Basic assumptions for this scenario are summarised in Annex 6.Annex 6..
Figure 12: Energy use for biomass versus fossil routes to HVC, including the total process chain
Note: EtOH = ethanol. Source: DECHEMA.
0
10
20
30
40
50
60
70
80
90
Lignocell. via MeOH Sugar cane via EtOH Napthta cracking
Ener
gy
use
(GJ/
t)
HV
C
HVC production Second feedstock production (naphtha, MeOH, EtOH) Primary feedstock production(oil, sugar cane, lignocellulosic biomass)
9.5
50
5
8.5
72.5
2
0.45
12
KEY POINT: Using biomass as a feedstock for chemical products can be 10 to 15 times more energy-intensive compared with the established fossil-based routes.
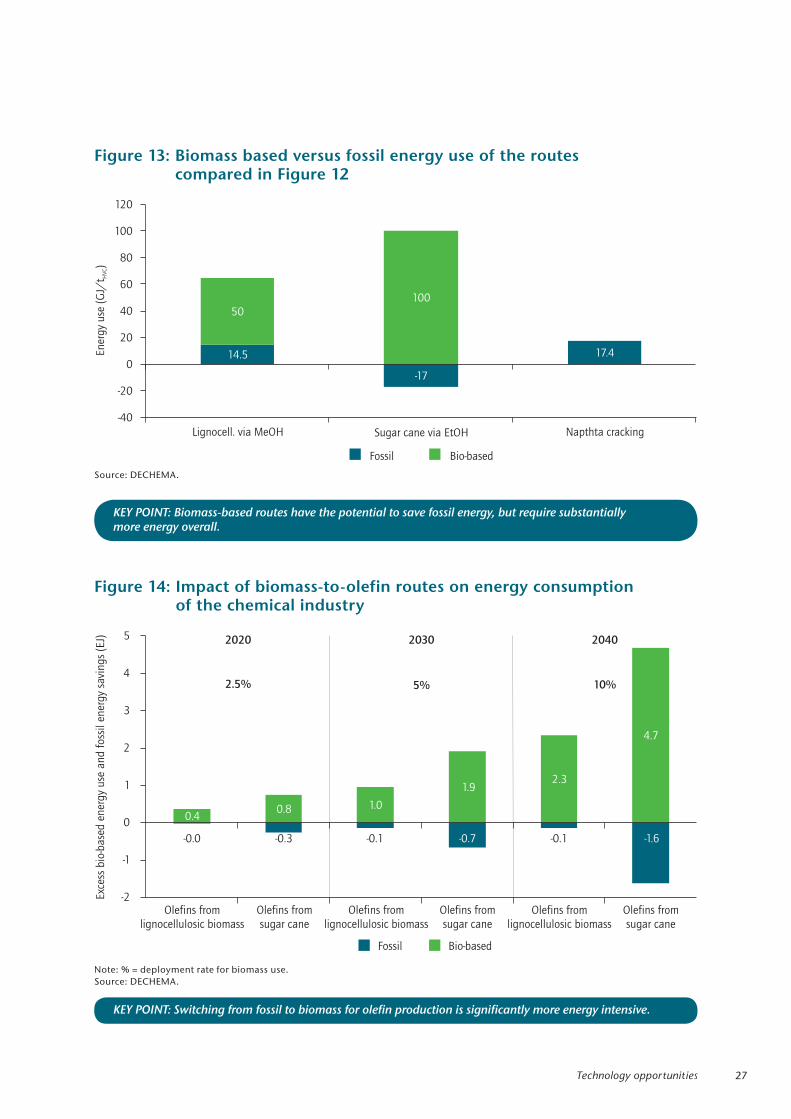
27Technology opportunities
Figure 13: Biomass based versus fossil energy use of the routes compared in Figure 12
Source: DECHEMA.
Figure 14: Impact of biomass-to-olefin routes on energy consumption of the chemical industry
Note: % = deployment rate for biomass use. Source: DECHEMA.
50100
14.5
-17
17.4
-40
-20
0
20
40
60
80
100
120
Lignocell. via MeOH Sugar cane via EtOH Napthta cracking
Ener
gy
use
(GJ/
t)
HV
C
Bio-basedFossil
0.4
-2
-1
0
1
2
3
4
5
Olefins fromlignocellulosic biomass
Olefinslignocellulosic biomass
from
Exc
ess
bio
-base
den
ergy
use
and
foss
ilen
ergy
savi
ngs
(EJ)
Bio-basedFossil
204020302020
5% 10%2.5%
0.8 1.0
1.92.3
4.7
-0.7 -1.6-0.3-0.0 -0.1 -0.1
Olefins fromsugar cane
Olefins fromsugar cane
Olefins fromsugar cane
Olefinslignocellulosic biomass
from
KEY POINT: Biomass-based routes have the potential to save fossil energy, but require substantially more energy overall.
KEY POINT: Switching from fossil to biomass for olefin production is significantly more energy intensive.
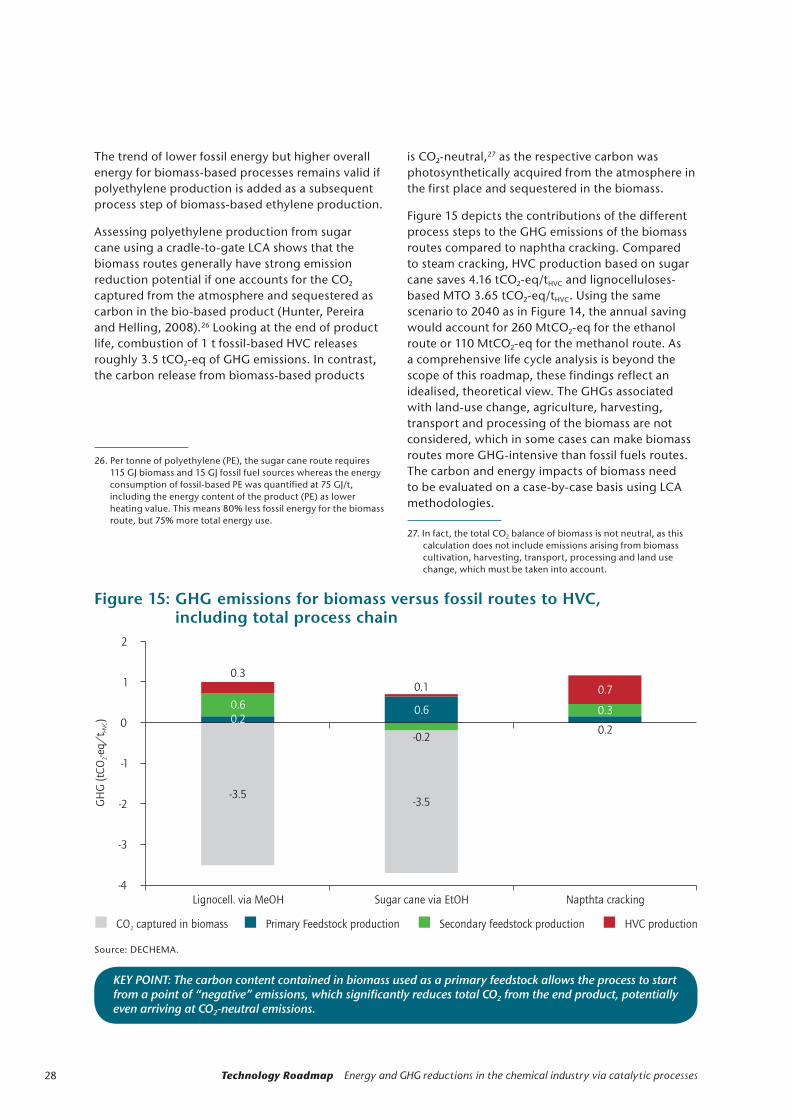
28 Technology Roadmap Energy and GHG reductions in the chemical industry via catalytic processes
The trend of lower fossil energy but higher overall energy for biomass-based processes remains valid if polyethylene production is added as a subsequent process step of biomass-based ethylene production.
Assessing polyethylene production from sugar cane using a cradle-to-gate LCA shows that the biomass routes generally have strong emission reduction potential if one accounts for the CO2 captured from the atmosphere and sequestered as carbon in the bio-based product (Hunter, Pereira and Helling, 2008).26 Looking at the end of product life, combustion of 1 t fossil-based HVC releases roughly 3.5 tCO2-eq of GHG emissions. In contrast, the carbon release from biomass-based products
26. Per tonne of polyethylene (PE), the sugar cane route requires 115 GJ biomass and 15 GJ fossil fuel sources whereas the energy consumption of fossil-based PE was quantified at 75 GJ/t, including the energy content of the product (PE) as lower heating value. This means 80% less fossil energy for the biomass route, but 75% more total energy use.
is CO2-neutral,27 as the respective carbon was photosynthetically acquired from the atmosphere in the first place and sequestered in the biomass.
Figure 15 depicts the contributions of the different process steps to the GHG emissions of the biomass routes compared to naphtha cracking. Compared to steam cracking, HVC production based on sugar cane saves 4.16 tCO2-eq/tHVC and lignocelluloses-based MTO 3.65 tCO2-eq/tHVC. Using the same scenario to 2040 as in Figure 14, the annual saving would account for 260 MtCO2-eq for the ethanol route or 110 MtCO2-eq for the methanol route. As a comprehensive life cycle analysis is beyond the scope of this roadmap, these findings reflect an idealised, theoretical view. The GHGs associated with land-use change, agriculture, harvesting, transport and processing of the biomass are not considered, which in some cases can make biomass routes more GHG-intensive than fossil fuels routes. The carbon and energy impacts of biomass need to be evaluated on a case-by-case basis using LCA methodologies.
27. In fact, the total CO2 balance of biomass is not neutral, as this calculation does not include emissions arising from biomass cultivation, harvesting, transport, processing and land use change, which must be taken into account.
Figure 15: GHG emissions for biomass versus fossil routes to HVC, including total process chain
Source: DECHEMA.
-4
-3
-2
-1
0
1
2
Lignocell. via MeOH Sugar cane via EtOH Napthta cracking
GH
G(t
CO
-eq/
t)
2H
VC
CO captured in biomass2 HVC productionSecondary feedstock productionPrimary Feedstock production
0.6
-3.5
0.2
0.3
0.6
-0.2
-3.5
0.1
0.3
0.2
0.7
KEY POINT: The carbon content contained in biomass used as a primary feedstock allows the process to start from a point of “negative” emissions, which significantly reduces total CO2 from the end product, potentially even arriving at CO2-neutral emissions.

29Technology opportunities
Similar to the hydrogen game changer, current bio-based routes to chemical feeds must significantly improve overall energy consumption and cost to be widely used for large-scale chemical feedstocks. In addition, there is growing concern about the amount of arable land required for a high-volume, bio-based chemical feedstock infrastructure, and potential competition with food production. Additional research is clearly needed.
Technology actions and milestonesThe findings above from the DECHEMA scenarios show that deployment of BPTs offer the most potential in the short to medium term for reducing energy demand and GHG emissions in the chemical industry. Achieving the true potential magnitude of catalyst gains lies beyond BPTs, however, leaving the question of where stakeholders can realise the best returns on R&D investments. The DECHEMA
Table 3: Top catalyst/process development opportunities and technology needs
Technology Improvement needs Current development stage
Feedstock production efficiency: olefins Return on investment: HIGH
Catalytic naphtha crackers and ethane/propane cracker
Viability for natural gas crackersPilot scale for catalytic naphtha crackers; lab-scale for ethane oxidative dehydrogenation
Methanol-to-olefinsImprovements of efficiency and MTO catalysts
Emerging, first commercial plants
Alternative means of fuel production: fuels Return on investment: HIGH
Gas-to-liquid technologies:
Fischer-Tropsch synthesis with subsequent conversion of the products via hydro-isomerization and hydrocracking as well as oligomerization of olefins
Process improvements, small mobile facilities for production in remote areas to access stranded gas
Commercial
Biomass as feedstock: ethanol/ethylene and aromatics Return on investment: MEDIUM
Saccharification of lignocellulose into bioethanol as raw material for ethylene
Processes and biocatalytic systems Research stage
Lignin to aromatics (BTX)Depolymerisation of lignin components and defunctionalisation
Fundamental research
Hydrogen production Return on investment: MEDIUM
Water electrolysis
Optimised processes for unsteady operation; improved stability for operations under pressure (30 to 40 bars); development of electrodes with low noble metals and other rare elements content
Commercially available in small-/medium-sized facilities
Photocatalytic water splitting
Lab-scale development of highly efficient (performance), corrosion-resistant (longevity) photoelectrode materials and processing technologies; development of electrodes without noble metals and other rare elements and with reduction >50% of overpotential in H2 generation with respect to current state
Fundamental research

30 Technology Roadmap Energy and GHG reductions in the chemical industry via catalytic processes
research identified four main areas in which investment in catalytic technologies are expected to deliver a medium to high return on investment: feedstock production efficiency for olefins; alternative paths to fuel production; use of biomass as feedstock for ethanol/ethylene and BTX; and alternative hydrogen production (Table 3).
The long-term nature of the work to be carried forward warrants establishing high-level milestones (Table 4), while the substantial
technical hurdles and high investment costs (particularly for areas with a high return on investment) create a need for collective effort on the part of all stakeholders including academia, research institutes and industrial partners. Governments must play an enabling role by establishing policies to encourage the necessary long-term collaborations and investments.
Table 4: Milestones for technology improvements for top processes
Milestone Steps of catalytic technology advances Timeframe
Advance catalytic cracking to commercial implementation.
z Catalysts with increased low-olefin yield and lower by-product yield;
z Decrease coking;
z Management of spent catalyst.
2018-23
Advance catalytic oxidative dehydrogenation of low alkanes to ethylene to demonstration scale.
z Prevent further oxidation, partial oxidation or thermal cracking at higher reaction temperature;
z Increased olefin yield at increased conversion.
2023-28
Hydrogen by water electrolysis. z Efficiency of 80% and higher;
z Flexible dynamic operation.
2018-23

31Vision for advances in catalytic and related process improvements for the chemical industry
Having explored some of the potential pathways for improving energy efficiency and reducing emissions in the chemical industry, this visioning section sets out specific findings of the IEA and DECHEMA modelling work. It bears reminding that both approaches start from current production volumes based on data provided by SRI Consulting (IHS) and similar growth forecasts.
The anticipated growth of the 18 chemicals28 based on data provided by SRI Consulting is shown in Figure 16. These numbers were used for the DECHEMA modelling work. Numbers beyond 2030 have been linearly extrapolated.
28. The BTX are depicted as separate products here, hence 20 products are shown.
The anticipated production volumes for ammonia and methanol in China are based on data kindly provided by the China Petroleum and Chemical Industry Federation (CPCIF). Production volumes are expected to increase by a factor of 2.0 between 2010 and 2030, and by 2.8 by 2050. This corresponds to a yearly production increase of 2.6% for 2010-50, or 3.3%/yr for 2010-30.
Around the globe, the potential impact of increased production volumes will vary with country development stage, industry maturity, expected growth, and feedstock availability. Energy consumption and GHG emissions will scale with the production growth, which is expected to be highest in emerging countries (Figure 22). Highest growth of chemical production volumes within the
Vision for advances in catalytic and related process improvements for the chemical industry
Figure 16: Forecast of chemical production volumes between 2010 and 2050
Source: Data from SRI Consulting (IHS).
0
500
1 000
1 500
2 000
2 500
2010 2015 2020 2025 2030 2035 2040 2045 2050
Pro
duct
ion
volu
me
(Mt)
Vinyl Chloride MonomerTerephthalic AcidStyrenePropylene OxidePolypropylenePolyethylene
PhenolPara-XyleneEthylene OxideEthylene GlycolCumeneCaprolactamAcrylonitrile
Mixed XyleneTolueneBenzenePropyleneEthyleneMethanolAmmonia
KEY POINT: Significant growth is expected in production volume of the chemical and petrochemical sector.

32 Technology Roadmap Energy and GHG reductions in the chemical industry via catalytic processes
time frame (2010-50) considered are expected to take place in China and Latin America (>400% in both), followed by India (340%) and Middle East (320%), whereas North America (210%) and Europe (170%) have slower growth or a lower growth rate. A factor that could alter this regional outlook would be the arrival of shale gas in some locations, such as the United States Gulf Coast, which could positively impact growth in this region.
While the production projections and regional analysis are similar between the IEA and DECHEMA models, final results on the potential for energy savings and emission reduction in 2050 differ somewhat. This reflects the ways in which the two models diverge in terms of what they measure and how they calculate results (as described in the two sections following; Table 5). Importantly, both find substantial opportunity for savings in both areas.
IEA scenarios: catalysis and beyond... This section describes the potential for catalytic and related process improvements, based on the technologies needed to achieve the 2DS modelled in the IEA ETP 2012 (see Box 2). Like the DECHEMA work, this approach assesses technology options covered in this analysis including the implementation of BPT in the short term and, in the long term, it assesses the new technologies that would allow the sector to reduce significantly both its energy needs and its CO2 intensity. The range of new technologies explored, however, is broader and includes: new developments in catalysts, membranes and other separation processes; process intensification; bio-based processes and CCS in ammonia plants; industrial co-generation; and HVC production. Recycling and energy recovery also play important roles.
Current energy savings potential in the chemicals sector
Energy and feedstock in the chemical and petrochemical sector accounted for approximately 10% of worldwide final energy demand in 2010, equivalent to 36 EJ (IEA, 2012). Based on production levels of the same year, the potential savings of broader BPT implementation (including process heat and electricity) are estimated at 5.6 EJ/yr (Figure 17). Yet this represents only 53% of the entire saving potential, calculated in the IEA analysis at 10.5 EJ/yr based on 2010 production volumes. Additional savings can be realised through process intensification, co-generation, recycling and energy recovery. In 2050, this level of energy savings would deliver emissions reduction of 346 MtCO2/yr (IEA, 2009).
Table 5: Energy savings and emissions reduction projected in 2050 by the two models
Model Energy savings Emissions reduction
IEA 16.0 EJ 1.6 GtCO2/yr (Low-Demand Case)
1.8 GtCO2/yr (High-Demand Case)
DECHEMA 13.2 EJ 1.0 GtCO2-eq/yr

33Vision for advances in catalytic and related process improvements for the chemical industry
Figure 17: Current energy savings potential for chemicals and petrochemicals, based on BPT deployment
Note: Energy savings potential based on 2010 production levels.
Source: IEA.
Ener
gy
consu
mpti
on
(EJ)
4.5
4.0
3.5
3.0
2.5
2.0
1.5
1.0
0.5
0.0
Process intensificationCo-generation
Recycling and energy recoveryElectricity savings potentialBest practice technology (process heat savings potential)
Japan Korea United States Canada China India Brazil OECD Europe Other
KEY POINT: IEA analysis shows global energy saving potential in the chemical sector is around 10.5 EJ, with the most significant contributions coming from BPT implementation and recycling and energy recovery.
Given uncertainties about projecting long-term growth in materials consumption, the IEA has developed two variants for each of the scenarios used to analyse the chemicals sector in this roadmap. The assumption on gross domestic product (GDP) is the same for both variants. The two variants reflect, however, different levels of decoupling of economic growth from demand for chemicals and petrochemicals.
Considering a starting point in which average annual demand for HVC is 44 kilogrammes per capita (kg/cap) in 2010, the variants project in 2050:
z an increase to 87 kg/cap, with 1.7% being the annual average growth rate (AAGR) in the Low-Demand Case.
z an increase to 105 kg/cap in the High-Demand Case, with AAGR at 2.2%.
The variations in production are largely explained by increased recycling of post-consumer plastic wastes, which could reduce the need for HVC (Table 6).
Note: production numbers (from SRI and CPCIF) used in the DECHEMA scenario are in the same range and generally correspond to the High-Demand Case.
Box 6: IEA Low- and High-Demand Cases for chemicals
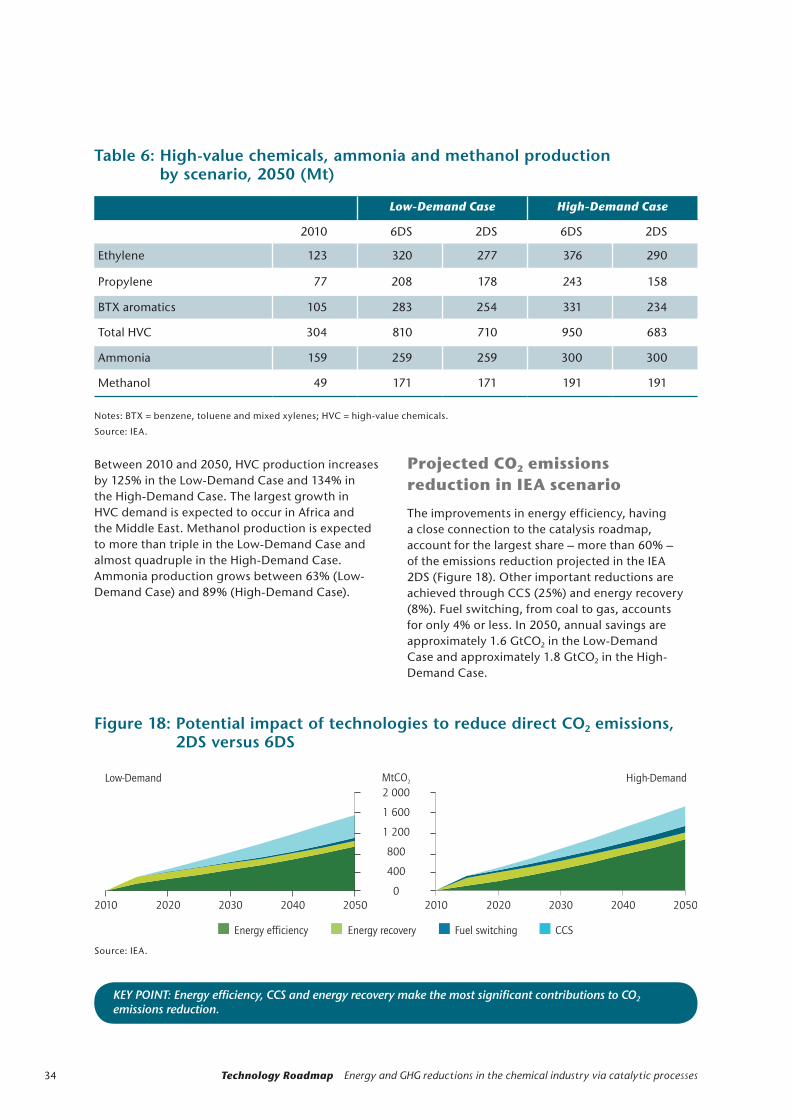
34 Technology Roadmap Energy and GHG reductions in the chemical industry via catalytic processes
Between 2010 and 2050, HVC production increases by 125% in the Low-Demand Case and 134% in the High-Demand Case. The largest growth in HVC demand is expected to occur in Africa and the Middle East. Methanol production is expected to more than triple in the Low-Demand Case and almost quadruple in the High-Demand Case. Ammonia production grows between 63% (Low-Demand Case) and 89% (High-Demand Case).
Projected CO2 emissions reduction in IEA scenario
The improvements in energy efficiency, having a close connection to the catalysis roadmap, account for the largest share – more than 60% – of the emissions reduction projected in the IEA 2DS (Figure 18). Other important reductions are achieved through CCS (25%) and energy recovery (8%). Fuel switching, from coal to gas, accounts for only 4% or less. In 2050, annual savings are approximately 1.6 GtCO2 in the Low-Demand Case and approximately 1.8 GtCO2 in the High-Demand Case.
Table 6: High-value chemicals, ammonia and methanol production by scenario, 2050 (Mt)
Low-Demand Case High-Demand Case
2010 6DS 2DS 6DS 2DS
Ethylene 123 320 277 376 290
Propylene 77 208 178 243 158
BTX aromatics 105 283 254 331 234
Total HVC 304 810 710 950 683
Ammonia 159 259 259 300 300
Methanol 49 171 171 191 191
Notes: BTX = benzene, toluene and mixed xylenes; HVC = high-value chemicals.
Source: IEA.
Figure 18: Potential impact of technologies to reduce direct CO2 emissions, 2DS versus 6DS
Source: IEA.
MtCO2Low-Demand High-Demand
2 000
1 600
1 200
800
400
0
2010 20102020 20202030 20302040 20402050 2050
Energy recoveryEnergy efficiency Fuel switching CCS
KEY POINT: Energy efficiency, CCS and energy recovery make the most significant contributions to CO2 emissions reduction.

35Vision for advances in catalytic and related process improvements for the chemical industry
CCS could be a vitally important technology for the chemicals sector and across industry more broadly, based on a projected impact of 25% CO2 emissions reduction in 2050, as noted in the CCS in Industrial Applications Roadmap (IEA, 2011).
Its use in the chemical industry presents specific challenges, however. CCS is a relatively costly emissions reduction technology due to high energy needs, and is most efficient and cost-effective when capturing large amounts of CO2 that is of quite high purity. Large facilities for the production of ammonia, methanol, ethylene oxide, hydrogen and products from coal gasification might have sufficient scale to make CCS financially feasible (depending on location). Crackers can also be high-volume sources (1 MtCO2/yr), but their flue gas is more dilute (4% to 7% CO2, lower concentration than a coal-fired power plant which can be 10% CO2 to 12% CO2) and drive up the CO2 capture costs.
CCS is a new technology that requires significant development and investment to bring to scale in industry. Large-scale projects are underway to develop CO2 capture at a refinery cracker (Norway) and for an
ammonia facility (Texas, United States). CO2
transportation is the crucial link between CO2 emission sources and storage sites but, to date, related technology and infrastructure needs have received insufficient attention.
The ETP 2DS suggests that, by 2050, annual sequestration in the chemical sector should reach 467 MtCO2. Timely development of CCS in the chemicals sector will require a globally consistent policy framework that provides appropriate regulation as well as economic incentives through carbon prices and other instruments to ensure the availability of CO2 transport facilities or CO2 storage space near chemical facilities.
Sector stakeholders should also pursue opportunities to use, rather than just store, CO2 as is now being done in enhanced oil recovery (CO2-EOR) projects. Several CO2-EOR projects pump CO2 captured from chemical sources into oil reservoirs to build up pressure, thereby facilitating easier recovery of hydrocarbons. Procedures can be devised to retain additional CO2 in the formation.
Box 7: Carbon capture and storage (CCS)
Regional results
Under the 6DS29 Low-Demand Case, energy use in the chemicals sector could increase from 42 EJ in 2010 to 85 EJ in 2050; it increases to 96 EJ in the High-Demand Case. In the 2DS Low-Demand Case, energy consumption is projected to rise by only 65 EJ in 2050 as greater energy efficiency and increased recycling reduce energy intensity. The 2DS also assumes a higher level of biomass and waste use, which accounts for 4% in the Low-
29. For descriptions of 6DS and 2DS, please refer to Box 2.For descriptions of 6DS and 2DS, please refer to Box 2.
Demand Case and 5% in the High-Demand Case, of total chemical energy use by 2050. Over half of the energy savings potential under the 2DS is expected to come from China (8.4 EJ) and the Middle East (4.7 EJ). Less than one-third of the 16 EJ savings potential is expected from OECD regions (Figure 18).

36 Technology Roadmap Energy and GHG reductions in the chemical industry via catalytic processes
DECHEMA scenariosAccording to the DECHEMA incremental improvement scenario, between 2010 and 2050, the average energy intensity of the combined processes linked to the 18 products could decrease 19% from 11.0 GJ/tproduct to 9.0 GJ/tproduct (Figure 6). However, calculating energy savings by tonne of product can be misleading in terms of overall energy use and GHG emissions. Even with the assumed technology and efficiency advances, the anticipated large increase in global demand and resulting global production volume of these 18 chemicals could still result in an increase of 6.5 EJ in total energy consumption by 2050.
Catalysis and related process advances can make a significant contribution to offsetting the expected rise in energy use as the industry grows to meet society’s demands for materials. Although the energy savings will not completely counteract the expected total energy rise associated with projected production growth (Figure 7), the cumulative savings potential through 2050 is equal to the current primary energy demand of a medium-sized industrialised country.
Various drivers could influence the projected growth rates. By 2050, incremental improvements, deployment of BPTs and emerging technologies could deliver 13.2 EJ of energy savings (Figure 20) – nearly 50% of the total demand under BAU at that time. Deployment of the game changers investigated (i.e. biomass- and hydrogen-based processes) would require additional energy, which is depicted as negative energy savings in Figure 20.
Similarly, implementing the incremental improvements, BPTs and emerging technologies shows significant potential for delivering reductions in GHG emissions: by 2050, 997 MtCO2-eq/year could be avoided compared to a BAU scenario, the equivalent of 80% of the 2010 emissions from the chemical industry (Figure 21). Game changers could add even larger contributions further down the timeline, if risks are lowered and technology investments made.
Figure 19: Energy savings by region in the Low-Demand Case
Note: Excludes changes in feedstock use.
Source: IEA.
0
2
4
6
8
10
12
14
16
18
2010 2015 2020 2025 2030 2035 2040 2045 2050
Middle EastAfricaLatin AmericaNon-OECD Europe and EurasiaOther developing Asia
IndiaChinaOECD PacificOECD EuropeOECD America
KEY POINT: The largest potential for energy saving in the chemicals sector is in the regions of strongest projected growth – i.e. China and the Middle East.

37Vision for advances in catalytic and related process improvements for the chemical industry
Figure 20: Energy savings potential of catalyst and related process advances from all categories
Note: Black line represents zero axis.
Source: DECHEMA.
Figure 21: GHG emissions avoidance potential of catalyst and related process advances from all categories compared to BAU
Note: Biomass and hydrogen scenarios include the emerging technologies scenario.
Source: DECHEMA.
-5
5
0.0
10
15
2010 2020 2030 2040 2050
Tota
len
ergy
savi
ngs
(EJ)
Biomass HydrogenIncremental improvement BPT conservative BPT optimistic Emerging technologies
0.00
0.25
0.50
0.75
1.00
1.25
1.50
1.75
2.00
2010 2020 2030 2040 2050
Tota
lG
HG
savi
ngs
(GtC
O-e
q)
2
Biomass HydrogenIncremental improvement BPT conservative BPT optimistic Emerging technologies
KEY POINT: Game changers may yield GHG reductions, but may require additional energy consumption.
KEY POINT: Game changers may allow for an additional reduction in long-term GHG emissions.
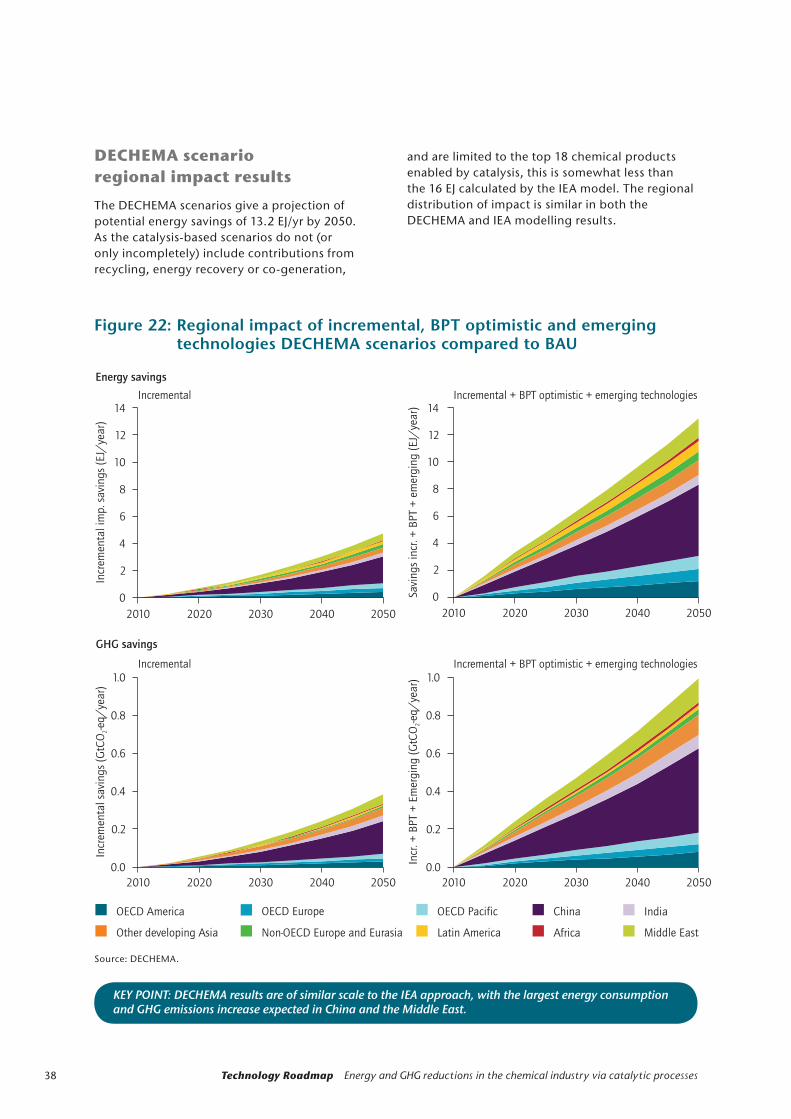
38 Technology Roadmap Energy and GHG reductions in the chemical industry via catalytic processes
DECHEMA scenario regional impact results
The DECHEMA scenarios give a projection of potential energy savings of 13.2 EJ/yr by 2050. As the catalysis-based scenarios do not (or only incompletely) include contributions from recycling, energy recovery or co-generation,
and are limited to the top 18 chemical products enabled by catalysis, this is somewhat less than the 16 EJ calculated by the IEA model. The regional distribution of impact is similar in both the DECHEMA and IEA modelling results.
Figure 22: Regional impact of incremental, BPT optimistic and emerging technologies DECHEMA scenarios compared to BAU
Source: DECHEMA.
KEY POINT: DECHEMA results are of similar scale to the IEA approach, with the largest energy consumption and GHG emissions increase expected in China and the Middle East.
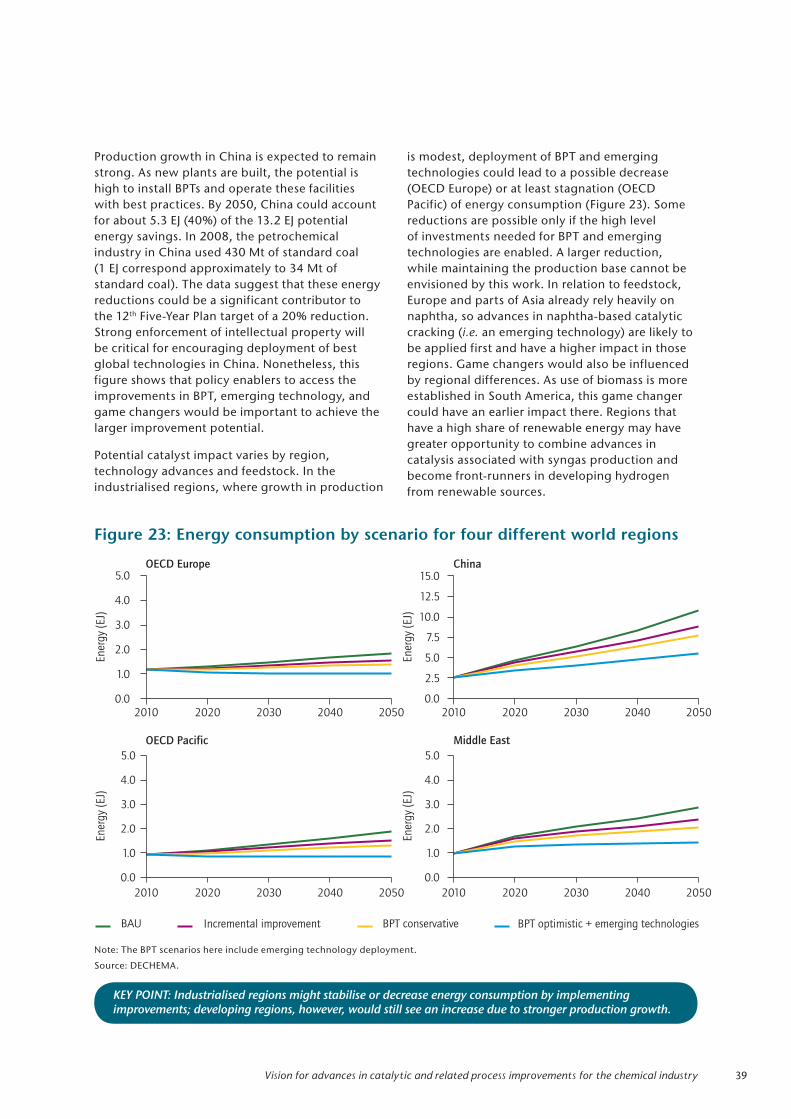
39Vision for advances in catalytic and related process improvements for the chemical industry
Production growth in China is expected to remain strong. As new plants are built, the potential is high to install BPTs and operate these facilities with best practices. By 2050, China could account for about 5.3 EJ (40%) of the 13.2 EJ potential energy savings. In 2008, the petrochemical industry in China used 430 Mt of standard coal (1 EJ correspond approximately to 34 Mt of standard coal). The data suggest that these energy reductions could be a significant contributor to the 12th Five-Year Plan target of a 20% reduction. Strong enforcement of intellectual property will be critical for encouraging deployment of best global technologies in China. Nonetheless, this figure shows that policy enablers to access the improvements in BPT, emerging technology, and game changers would be important to achieve the larger improvement potential.
Potential catalyst impact varies by region, technology advances and feedstock. In the industrialised regions, where growth in production
is modest, deployment of BPT and emerging technologies could lead to a possible decrease (OECD Europe) or at least stagnation (OECD Pacific) of energy consumption (Figure 23). Some reductions are possible only if the high level of investments needed for BPT and emerging technologies are enabled. A larger reduction, while maintaining the production base cannot be envisioned by this work. In relation to feedstock, Europe and parts of Asia already rely heavily on naphtha, so advances in naphtha-based catalytic cracking (i.e. an emerging technology) are likely to be applied first and have a higher impact in those regions. Game changers would also be influenced by regional differences. As use of biomass is more established in South America, this game changer could have an earlier impact there. Regions that have a high share of renewable energy may have greater opportunity to combine advances in catalysis associated with syngas production and become front-runners in developing hydrogen from renewable sources.
Figure 23: Energy consumption by scenario for four different world regions
Note: The BPT scenarios here include emerging technology deployment.
Source: DECHEMA.
0.0
1.0
2.0
3.0
4.0
20100.0
2.5
5.0
7.5
10.0
12.5
15.0
2010
0.0 0.0
1.0 1.0
2.0 2.0
3.0 3.0
4.0 4.0
5.0 5.0
2010 2010
Ener
gy
(EJ)
Ener
gy
(EJ)
Ener
gy
(EJ)
Ener
gy
(EJ)
BAU Incremental improvement BPT conservative BPT optimistic + emerging technologies
OECD Europe5.0
2020 2030 2040 2050
China
2020 2030 2040 2050
2020 20202030 20302040 20402050 2050
OECD Pacific Middle East
KEY POINT: Industrialised regions might stabilise or decrease energy consumption by implementing improvements; developing regions, however, would still see an increase due to stronger production growth.

40 Technology Roadmap Energy and GHG reductions in the chemical industry via catalytic processes
Emissions grow fastest in Asia, Africa and the Middle East, in line with the expected increases in chemical and petrochemical production. Conversely, if these regions were to implement incremental impacts, BPTs and emerging technologies, they have the greatest potential to contribute substantially to reducing CO2 emissions. In OECD countries, emissions decline as efficiency improvements offset the minor increase associated with relatively small growth in chemicals production.
Resource needsTo achieve economies of scale in the production of high-volume chemicals, producers tend to build very large manufacturing plants. This makes the industry very capital intensive and also means that each plant generally consumes very large amounts of energy. It also means that capital costs to modify or replace these assets in order to improve energy efficiency are significant.
Using a database managed by the American Chemistry Council (ACC), which has detailed historical information on the United States chemical industry, including volumes, investments and energy consumption, it is possible to estimate the capital costs needed for sustained energy improvement. In the United States from 1995 to 2010, energy efficiency in the sector improved at about 2% per year on average (equivalent to about 0.13 EJ/yr).30 The ACC data for the United States investments designated for “energy improvement” suggest sustained spending of approximately USD 600 million to USD 700 million per year, which amounts to about 4% of total industry investment. This is likely to be understated, as many energy improvement investments are embedded in grass roots investments rather than in stand-alone energy efficiency projects.
To better estimate the overall energy-related investment, one may consider the average monetary savings achieved per year and determine what level of investment would have been supported by these savings assuming a reasonable return on investment. The calculation assumed an energy cost of USD 4.75/GJ and five years payback, pre-tax. This suggests an annual United States investment for energy efficiency of USD 2.4 billion (2010 basis), roughly 11% of overall United States
30. 0.13 EJ/yr = 126 trillion BTU/yr.
chemicals investment. This is a more realistic estimate of overall capital spending required to sustain recent energy improvement rates.
Simplistically, as United States production represents about 19% of global chemical output, one could estimate a global energy investment level of about USD 13.2 billion per year (2010 basis) would be needed to sustain a global efficiency improvement rate of 2% per year in the near term. In the DECHEMA model projection, this represents steady incremental improvement plus a significant level of BPT implementation. It should be anticipated that investments to implement additional BPT would be less economically attractive and more capital intensive, as the most attractive investments receive the first funding.
A sustained 2% efficiency improvement through 2050 is a highly optimistic scenario, better than the BPT optimistic model. As major platforms become even more mature and approach “theoretical best” energy efficiency, much higher investment levels would be required to maintain this improvement rate. The relative incentives for energy efficiency investments will need to increase to support a 2% annual gain.
Factors such as regional specific volume growth, feedstock availability and costs, and the timing of plant obsolescence will affect decision making in energy efficiency investment, as will the important issue of the development and life-cycle of new catalysts. Even a “drop-in” catalyst typically takes at least three years to develop and test. Full commercial implementation is often delayed by the timing of planned plant shutdowns. Ten years is typical for an adoption rate of 80% across a process for a catalyst that has clear and substantial benefits. New catalysts that require substantial capital investment will take longer to commercialise fully.
Resource requirements and timing for emerging technologies are very difficult to estimate because of the many steps involved including significant R&D, engineering, pilot plant, scale-up, permitting and investment decisions. At present, no comprehensive studies exist for such developments, but two historical examples provide some insight:
z Significant improvements in polypropylene processes were developed in the 1980s in the form of Montell’s Spheripol bulk slurry process and Unipol’s gas-phase process, both of which

41Vision for advances in catalytic and related process improvements for the chemical industry
were enabled by higher yield/higher selectivity catalysts. These more efficient processes have replaced many older slurry plants, but the transformation is not yet 100% complete.
z Metallocene catalysts began to replace Ziegler-Natta catalysts for polyethylene production in the 1990s. In the past 20 years, numerous improvements have been realised and the number of plants using this technology has increased significantly; it is now being used in multiple process platforms and product families.
Step changes in catalyst and related process improvements require a dedicated effort over many years and hence sustained funding over a relatively long period. Collaboration between industry and government is often effective for financing new discoveries and ultimately overcoming fundamental technical hurdles.

42 Technology Roadmap Energy and GHG reductions in the chemical industry via catalytic processes
Although beyond the scope of this roadmap, the impact of catalysts in some large applications outside of chemical and petrochemicals warrants a brief examination. Quantitative information for these areas were difficult to obtain: the summaries below highlight the impact DECHEMA was able to discern. As the data available were limited and the analysis was semi-quantitative at best, it is quite possible that the impacts are more important than reported here. Further study would be required to reach more rigorous conclusions.
Refineries
Some crude oil refining processes are highly reliant on catalysts, making refineries one of the largest catalyst applications. The refining process involves separating crude oil into hydrocarbon fractions and cracking, restructuring, treating and blending of the hydrocarbon molecules to generate petroleum products. The main catalytic process steps are catalytic cracking, catalytic reforming and catalytic hydro-treating.31 BP estimates the world oil refinery capacity in 2010 at 91.8 million barrels/ day (BP, 2011). As a representative figure, the United States has about 150 refineries, which account for roughly 25% of the world production (AMO, 2007), consume 3.4 EJ of energy and emit some 244 MtCO2-eq of process-related GHGs (AMO, 2012). These numbers reflect all refinery operations, including the first and largest energy-consuming steps of crude oil distillation, which are non-catalytic.
For the three catalytic processes noted above, the total global energy consumption is estimated at about 2 EJ/yr. Studies show that in the United States, BPT refineries consume 20% to 30% less energy than the industry average (Energetics Incorporated, 2006) (see Annex 7). Presuming this reduction is globally applicable through complete BPT deployment, the potential energy savings would be 0.5 EJ/yr. This is still well above the theoretical minimum energy for these processes, so it is possible that further savings could be realised via catalytic or process technology breakthroughs.
Although high level and incomplete, this view of the potential catalysis opportunities for refining suggests that significant energy and GHG savings are still achievable in this very mature industry. Further study and analysis would be needed to construct a comprehensive view of catalysis opportunity and a detailed roadmap for refining.
31. Explained in Annex 7.
Other industrial catalyst applications
Catalysis can also impact energy efficiency and emissions reduction in other industrial applications, some of which are summarised here.
z Low-temperature detergents: enzymes act as biocatalysts in washing detergents and allow for higher cleaning efficiency and/or lower washing temperatures, providing energy and GHG savings. One study quantified the potential annual GHG savings to be 81 MtCO2-eq and the product use-related savings of 92 MtCO2-eq (McKinsey, 2009). By providing effective cleaning at lower washing temperature (30°C instead 40°C to 50°C), detergent enzymes reduce the energy consumption in the detergent use phase by 50% (to approximately 240 gCO2-eq/washing cycle).32
z Catalytic decomposition of nitrous oxide in industrial processes: nitrous oxide (N2O) is a potent GHG with a global warming potential (GWP) 300 times greater than CO2. Between 1990 and 2009, N2O emissions from adipic acid production decreased 82%, even as production volumes increased, due to N2O abatement technologies (namely thermal and catalytic decomposition).
z Automotive applications: most gasoline-powered vehicles are equipped with a three-way catalytic converter, which uses an oxidising reaction to convert carbon monoxide (CO) and unburned hydrocarbons to CO2 and water, and a reduction reaction to convert nitrogen oxides (NOx) to nitrogen and oxygen. In diesel engines, a diesel oxidation catalyst, converts CO to CO2 and hydrocarbons to water and CO2. While catalytic converters effectively reduce the target pollutants (CO, hydrocarbons and NOx), they do not specifically reduce CO2 emissions. New R&D suggests that catalysts could reduce emissions of methane, which is a strong GHG (R. Gorte, 2012).
z Materials with (photo) catalytic properties: several photocatalytic products have been commercialised such as self-cleaning items (lamps, car coatings and construction materials), anti-fog products (mirrors and glass), indoor and outdoor coatings for air control, and decomposition of volatile organic compounds (VOCs), etc. While these applications do not directly target energy efficiency or GHG
32. Using the 158.5 billion washing cycles estimated by McKinsey Using the 158.5 billion washing cycles estimated by McKinsey (ICCA, McKinsey 2009), this would result in savings of 38 MtCO2-eq.
Other catalytic process-related areas
43Other catalytic process-related areas
abatement, they might help to reduce energy consumption by replacing solutions that currently use more energy.
z Catalytic combustion enables complete combustion at lower temperatures than otherwise possible. The process offers burning of “lean” gas mixtures, thereby reducing hydrocarbon and carbon monoxide emissions from unburned and incompletely burned fuel. This allows for operation at lower temperatures to have near-zero NOx emissions. Catalytic combustion of VOCs33 can lower the combustion temperature from 800°C to a range of 200°C to 400°C, which avoids the formation of harmful by-products (NOx, CO).
z Methane reduction in coal mining: worldwide, the coal mining industry emitted more than 377 MtCO2-eq of methane in 2000, which is 3.3% of total anthropogenic methane emissions. Thermal oxidation technologies have been
33. A. Buekens, Thermal and Catalytic Combustion, Encyclopedia of A. Buekens, Thermal and Catalytic Combustion, Encyclopedia of Life Support Systems (EOLSS).
introduced and catalytic oxidation technologies are emerging.34 If oxidiser technology were applied to all mine ventilation air systems with concentrations greater than 0.15% methane, about 97% of the methane from coal mining could be mitigated (EPA, 2006).35
z CO2 conversion: Captive CO2 is commonly re-used internally in ammonia and some methanol plants (e.g. Mitsui). Converting CO2 into chemicals would be thermodynamically challenging, and would carry costs for the energy and hydrogen needed for conversion into useful products. The IEA results above show that CCS could have some impact in the chemical industry, particularly if low-cost, pure CO2 were available that could aid CO2 chemical conversion efforts. This will depend largely on lowering current cost hurdles as diluted CO2 sources from crackers are very expensive options.
34. Best Practice Guidance for Effective Methane Drainage and Best Practice Guidance for Effective Methane Drainage and Use in Coal Mines, UNITED NATIONS Publication, ECE ENERGY SERIES No.31, ISBN 978-92-1-117018-4, New York-Geneva, 2010.
35. Global Mitigation of Non-CO Global Mitigation of Non-CO2 Greenhouse Gases; United States Environmental Protection Agency, Office of Atmospheric Programs, June 2006.

44 Technology Roadmap Energy and GHG reductions in the chemical industry via catalytic processes
To have a balanced view of the overall impact of the chemical industry, and the impact of catalysts, it is important to consider the impact of chemical products during their use phase. This can be done via the Life Cycle Assessment (LCA) methodology, which rigorously examines the impacts of a product from raw material extraction through end-of-life disposition. LCA compares the results for chemically and non-chemically derived products with the same or similar function.
In the food packaging industry, for example, polyolefin-based materials (films, sacks, bottles, etc.) have replaced many applications that were formerly served by metals, glass or cardboard. These former materials required more raw material and higher energy to produce, and resulted in higher GHG emissions than their plastic alternatives. In addition, the lighter weight of plastic packaging
Avoided emissions in the use phase
Figure 24: Potential GHG use-phase impact, using BAU direct emissions impact from this work and the McKinsey impact ratio of 2.1 t of GHGs saved/tproduction
4.0
2.0
3.0
1.0
0.0
-1.0
-2.0
-3.0
-4.0
-6.0
-5.0
-7.0
-8.0
Tota
lch
ange
inG
HG
(GtC
O-e
q)
2
Direct GHGincrease “BAU”
scenario
“Type 3”use phasephase abatement
Net abatement
2010 2015 2020 2025 2030 2035 2040 2045 2050
KEY POINT: Chemical products reduce GHG emissions by substituting for more GHG-intense materials.
saves energy for transportation. Thus, the LCA shows significant use-phase benefits for plastic packaging (even though it does not consider the additional benefit of reduced food spoilage, which reduces the energy, water and land use required for agriculture and also lowers landfill volume).
Similar use-phase efficiencies can be identified in the automotive, hygiene and consumer industries. A comprehensive LCA study (carried out by ICCA/McKinsey) of chemicals in a wide range of applications concluded that the use of chemicals saved 2.1 t to 2.6 t of GHG for every tonne of emission associated with their production (ICCA, 2009). Overlaying the more conservative estimate (2.1 of GHG) with the BAU direct emissions growth case in this roadmap suggests one possible view of the net impact of chemicals growth on future GHG emissions (Figure 24).
This likely represents the worst-case scenario. As this roadmap suggests, many opportunities exist to improve direct emissions beyond the BAU scenario, and the GHG avoided ratio can be improved via further product innovation and continued
replacement of GHG-intensive materials. The ICCA/McKinsey study suggested that focused strategies could boost the GHG abatement ratio to exceed 4:1 by 2030.

45Avoided emissions in the use phase
The ability of catalysis to reduce both direct and use-phase energy and GHG emissions from chemicals needs to be considered when discussing related policy options. The chemical industry can make a larger impact by applying its products in energy-saving applications than through reducing its footprint during production phases. Both avenues should be pursued, but the potential is even higher in product application.
A strong example of catalyst technology improving LCA attributes and sustainability can be found in the development, commercialisation and rapid growth of metallocene-based polyolefins over the past couple of decades. Compared with older catalysts such as Ziegler-Natta, metallocene catalyst technology represented a huge step forward, enabling more exact control of both polymer composition and structure, as well as the ability to copolymerise higher levels of comonomers
with ethylene to make new compositions. For example, metallocene-based polyethylenes have more uniform molecular weight and composition distribution, which results in stronger and tougher materials that support development of thinner and lighter films. Copolymerisation with higher alpha olefins enabled new families of very low-density polyethylenes (“plastomers”), which proved to be effective impact modifiers in polypropylene blends. Such blends (referred to as thermoplastic olefins or TPOs) have replaced heavier and more resource-intensive metals in many automotive exterior applications. The energy impact of these replacements can be seen in estimates that a 10% weight reduction in an automobile translates to about 7% improvement in fuel economy.
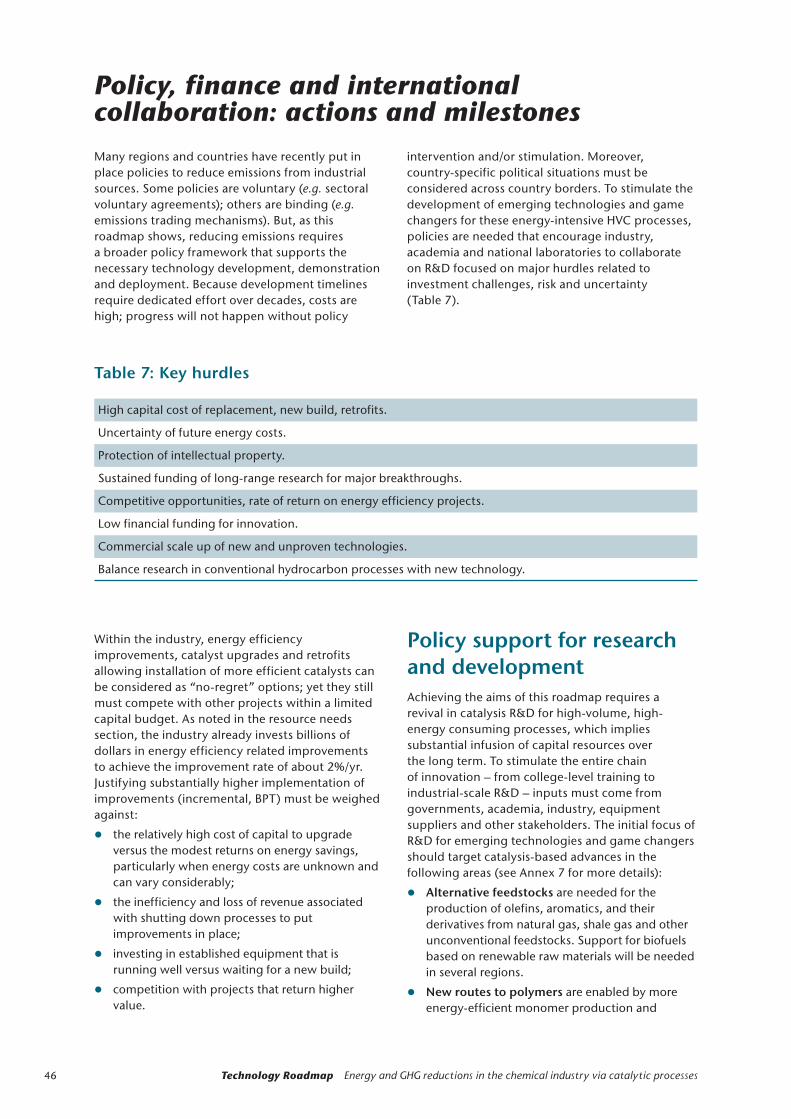
46 Technology Roadmap Energy and GHG reductions in the chemical industry via catalytic processes
Many regions and countries have recently put in place policies to reduce emissions from industrial sources. Some policies are voluntary (e.g. sectoral voluntary agreements); others are binding (e.g. emissions trading mechanisms). But, as this roadmap shows, reducing emissions requires a broader policy framework that supports the necessary technology development, demonstration and deployment. Because development timelines require dedicated effort over decades, costs are high; progress will not happen without policy
intervention and/or stimulation. Moreover, country-specific political situations must be considered across country borders. To stimulate the development of emerging technologies and game changers for these energy-intensive HVC processes, policies are needed that encourage industry, academia and national laboratories to collaborate on R&D focused on major hurdles related to investment challenges, risk and uncertainty (Table 7).
Policy, finance and international collaboration: actions and milestones
Table 7: Key hurdles
High capital cost of replacement, new build, retrofits.
Uncertainty of future energy costs.
Protection of intellectual property.
Sustained funding of long-range research for major breakthroughs.
Competitive opportunities, rate of return on energy efficiency projects.
Low financial funding for innovation.
Commercial scale up of new and unproven technologies.
Balance research in conventional hydrocarbon processes with new technology.
Within the industry, energy efficiency improvements, catalyst upgrades and retrofits allowing installation of more efficient catalysts can be considered as “no-regret” options; yet they still must compete with other projects within a limited capital budget. As noted in the resource needs section, the industry already invests billions of dollars in energy efficiency related improvements to achieve the improvement rate of about 2%/yr. Justifying substantially higher implementation of improvements (incremental, BPT) must be weighed against:
z the relatively high cost of capital to upgrade versus the modest returns on energy savings, particularly when energy costs are unknown and can vary considerably;
z the inefficiency and loss of revenue associated with shutting down processes to put improvements in place;
z investing in established equipment that is running well versus waiting for a new build;
z competition with projects that return higher value.
Policy support for research and development Achieving the aims of this roadmap requires a revival in catalysis R&D for high-volume, high-energy consuming processes, which implies substantial infusion of capital resources over the long term. To stimulate the entire chain of innovation – from college-level training to industrial-scale R&D – inputs must come from governments, academia, industry, equipment suppliers and other stakeholders. The initial focus of R&D for emerging technologies and game changers should target catalysis-based advances in the following areas (see Annex 7 for more details):
z Alternative feedstocks are needed for the production of olefins, aromatics, and their derivatives from natural gas, shale gas and other unconventional feedstocks. Support for biofuels based on renewable raw materials will be needed in several regions.
z New routes to polymers are enabled by more energy-efficient monomer production and

47Policy, finance and international collaboration: actions and milestones
polymerisation, both being central topics of catalytic and process engineering R&D.
z Hydrogen production from cultivated biomass or from the exploitation of secondary materials is the first priority, followed closely by the improvement of water electrolysis processes, both in process control and water cleavage with new catalyst systems.
This roadmap recommends policies that will:
z Sustain long-term R&D collaboration (both domestically and internationally among public and private research institutions and industry) to address fundamental hurdles for the key processes needed for the development and application of emerging and game changer technologies.
z Foster cross-cutting R&D in areas such as photocatalysis or water cleavage for lower cost hydrogen production and subsequent use for ammonia or methanol production.
z Encourage joint scientific and engineering research projects to address both chemical and technology aspects of catalytic processes.
Securing financing, including through timely incentives Substantial investment – and greater investment certainty – is needed to achieve the goals outlined in this roadmap. Greater innovation is needed in financing and incentives to accelerate investment in the catalyst impact areas above. This would help to balance out the ratio of risks versus benefits.
The European Investment Bank (EIB) supports R&D and capital projects by helping to finance (up to 50%) initiatives that meet a set of criteria, which includes an energy efficiency target improvement of 20%. The EIB’s low loan rates, AAA rating and capacity to move projects forward can have long-term benefits.
Incentives for incremental and BPT projects need to be increased, as these local projects are often not attracting investment relative to other global opportunities. Additionally, incentives should be scaled, with higher rewards for technologies that are commercially attractive and deliver a bigger step change in reducing energy use or GHG emissions. Emerging or game changing technologies should
receive the highest level of support with the focus on enabling R&D and first demonstration of the technology as the scale and cost effectiveness improve.
Where investment support or green certificates are used to co-fund BPT, such measures should ideally remain restricted to kick-start funding while avoiding competition disruption or dependence on long-term subsidies. In addition, incentive policies should be technology neutral – i.e. they should support investment in new technologies without attempting to “pick” winners or losers.
Economic incentives can also stimulate periodic upgrading of BPTs for energy efficiency and technical developments.
This roadmap recommends policies that will:
z Eliminate energy subsidies that act as barriers to deploying more energy-efficient technologies.
z Favour staged incentives that promote energy efficiency improvements that are technically feasible today, but need a boost to be attractive against other opportunities. Such approaches provide long-range encouragement to deploy BPT making it the best economic choice, and promote future investment in emerging/game changer technologies.
z Establish a global carbon price signal to incentivise all industry, and link carbon markets to mechanisms that effectively engage industry in adopting cleaner technologies.
z Avoid isolated, unilateral cost burdens.
Policies to promote international collaboration and sharing of data, information, best practice and R&DThe overall reductions from energy and emission improvements should be visible to local utilities so that they can encourage such investments through their own incentives. BPT deployment can be facilitated by empowering regional industrial associations and industry to collaborate through active forums for exchange (consistent with Competition Law constraints).

48 Technology Roadmap Energy and GHG reductions in the chemical industry via catalytic processes
This roadmap recommends policies that will:
z Strengthen international co-operation to: gather reliable, industry-level energy and GHG emissions data; support effective policy development; track performance; and identify and publish regional and national performance gaps and BPT.
z Foster sharing of best practice policies for the promotion of energy efficiency and GHG emissions reductions in the chemicals industry.
z Promote international collaboration and cost sharing on R&D projects.
Policies for regulationRegulation for the chemical industry should be well integrated into the broader legislative fabric while also avoiding double regulation, for example in jurisdictions where GHG emissions reduction policies or energy efficiency policies are already being implemented to encourage BPT. Corresponding guidelines and standards need to be well balanced and developed, and updated in close consultation with industry sectors concerned. Such consultation safeguards feasibility and international competitiveness while avoiding prohibitively expensive responses or stranded investment.
This roadmap recommends policies that:
z Are long term to encourage developments in emerging technologies and game changers, and also feedstock choices (such as biomass).
z Accelerate permit approval for energy efficiency projects.
z Support energy management systems (such as ISO 50001) that prompt companies to follow a continuous improvement plan for energy.
z Staged incentives could mean a higher incentive if companies deploy and improve BPT (reducing energy and environmental burden), and further encourage participation in long-term R&D to substantially improve the process (e.g. emerging technology, game changers).
Stakeholder collaboration, including public-private partnershipsInternational collaboration plays an important role in accelerating technological progress in the demonstration phase. New forms of public-private partnerships (PPP) must be defined through which governments, R&D institutions, the chemical industry and equipment suppliers can work together to organise, fund, screen, develop and demonstrate selected technologies in shorter time frames.
A good example from the steel industry is the Ultra-Low CO2 Steelmaking (ULCOS) project.36 This consortium of 48 European companies and organisations, financially supported by the European Commission, undertakes co-operative R&D into CO2 emissions reduction from steel production.
The process industries, including the chemical industry in Europe, recently proposed a European PPP dedicated to innovation in resource and energy efficiency in and enabled by the process industries.37
Such industry associations can help in numerous ways including: developing/communicating a common target, organising workshops, summarising progress, and advancing the cause for support of top candidate projects. Several “shells” of interaction that can facilitate collaboration among government laboratories, academic partners, technology developers and financing entities would be important to help reach objectives (Figure 25). NGOs, sustainability partners and other stakeholders would also be part of the larger interaction space.
36. www.ulcos.org/en/index.php.
37. SPIRE; www.spire2030.eu/.SPIRE; www.spire2030.eu/.
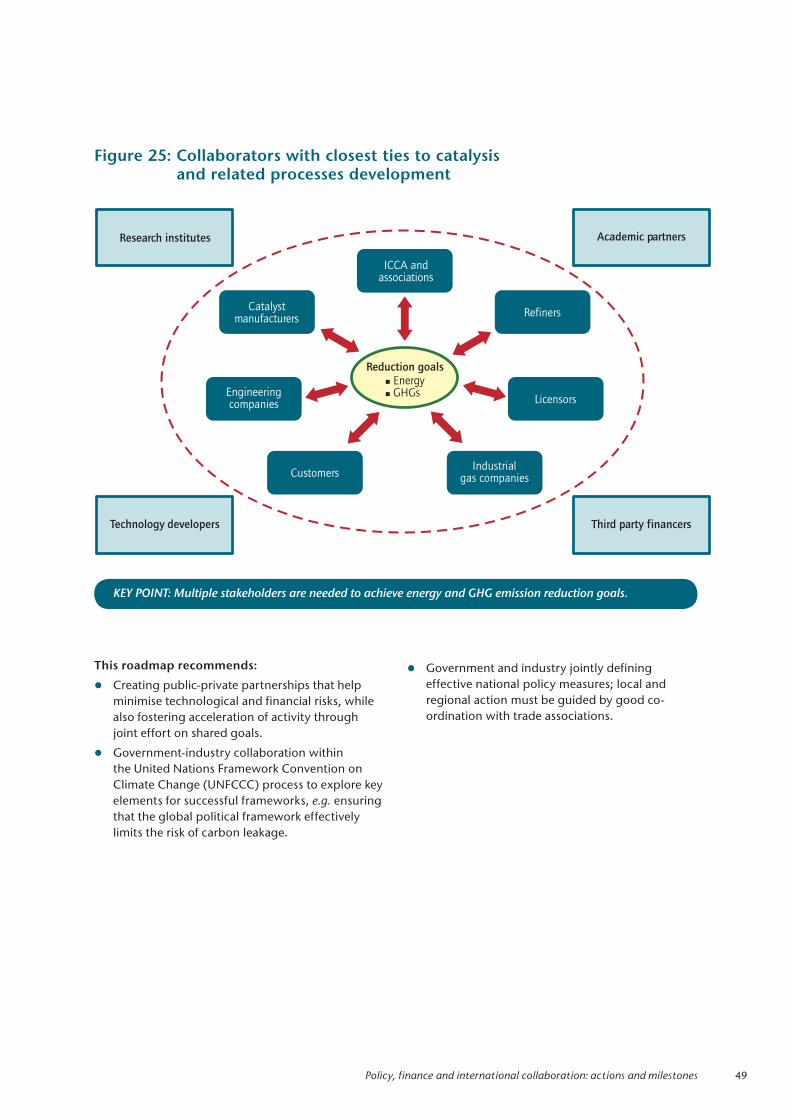
49Policy, finance and international collaboration: actions and milestones
This roadmap recommends:
z Creating public-private partnerships that help minimise technological and financial risks, while also fostering acceleration of activity through joint effort on shared goals.
z Government-industry collaboration within the United Nations Framework Convention on Climate Change (UNFCCC) process to explore key elements for successful frameworks, e.g. ensuring that the global political framework effectively limits the risk of carbon leakage.
Figure 25: Collaborators with closest ties to catalysis and related processes development
� EnergyGHGs�
ICCA andassociations
RefinersCatalyst
manufacturers
Engineeringcompanies Licensors
Industrialgas companiesCustomers
Research institutes Academic partners
Technology developers Third party financers
Reduction goals
KEY POINT: Multiple stakeholders are needed to achieve energy and GHG emission reduction goals.
z Government and industry jointly defining effective national policy measures; local and regional action must be guided by good co-ordination with trade associations.

50 Technology Roadmap Energy and GHG reductions in the chemical industry via catalytic processes
Conclusion: near-term actions for stakeholdersThis roadmap sets out milestones that the international community can use to measure progress and assess whether the chemical industry is on track to achieve the emissions reductions required by 2050 to limit the long-term global
average temperature rise to 2°C. The roadmap is a “living” document in the sense that it will be updated regularly to reflect advances and identify necessary adjustments.
Lead stake-holder
Actions
Industry z Identify top catalyst opportunities.
z Prompt collaboration with academia and government labs.
z Share best practice policies for the promotion of energy efficiency and GHG emissions reduction.
z Accelerate capital investments and R&D.
z Encourage R&D on alternative feedstocks and new catalytic routes to polymers with lower energy use and environmental footprint; collaborate on studies of hydrogen production, use and economics.
Governments z Increase incentives and reduce barriers for energy efficiency improvements; establish staged incentives encouraging development of emerging technologies and game changers.
z Create long-term policy frameworks that invigorate catalyst/process R&D for high-energy consuming processes.
z Introduce policies facilitating the use of best practices where new facilities will be built.
z Eliminate energy subsidies and policy instruments (also market-based schemes) that may create local cost burden and be barriers to more energy-efficient technology investments.
z Stimulate academic and national lab research on high-volume/high-energy use processes. Foster cross-cutting R&D in areas involving alternative feedstocks, such as H2 (including photocatalysis or water cleavage for lower cost hydrogen production) and use of biofuels, that will lower economic hurdles, aid development and help scale up development.
z Ensure strong intellectual property protection is in place in developing countries, to encourage global industry leaders to invest there and to incentivise R&D.
z Facilitate public-private partnerships that help minimise technological risks and create options to increase energy efficiency or reduce CO2 emissions.
Universities and other research institutions
z Discuss with industry leaders top prospects for gains in fundamental knowledge that will lead to good return on investment.
z Encourage students and peers to research chemistry and engineering projects that will lower energy use and GHG footprint of industrially relevant chemical processes.
Financial institutions z Aid industry/financial institutions flexibility for means to aid attractive projects and low long-term economic risks.
z Aid flexibility in industry/utility partnerships to save energy.
Non-governmental organisations
z Support industry initiatives to reduce energy use and GHG emissions via improvements in catalysis and related process improvements.

51Annexes
AnnexesFurther details and backup for several subject areas are available on the ICCA and IEA websites in several annexes. The topics covered are listed below.
Annex 1: Data approach and assumptions
Annex 2: Process routes for propylene oxide
Annex 3: Theoretical potential
Annex 4: Improvement options
Annex 5: Hydrogen option
Annex 6: Biomass-based process routes
Annex 7: Refineries
Annex 8: Description of IEA scenarios and additional details
Annex 9: Research needs
Annex 10: Workshop participants
http://iea.org/media/freepublications/technologyroadmaps/TechnologyRoadmapCatalyticProcessesAnnexes.pdf
www.icca-chem.org/en/Home/ICCA-initiatives/Energy--Climate-Change-/
http://www.dechema.de/industrialcatalysis

52 Technology Roadmap Energy and GHG reductions in the chemical industry via catalytic processes
GlossaryBase chemicals: base chemicals or commodity chemicals are a broad chemical category including polymers, bulk petrochemicals and intermediates, and the starting point for a huge range of final products.
BAU (Business-as-usual): describes a scenario in which the current state of technology is projected into the future.
Biocatalysis: using catalysts from biological sources, generally called enzymes, for chemical reactions.
Best-practice technology (BPT): describes the most energy efficient available process technologies at a given moment in time. Within the projection, a conservative BPT option and an optimistic BPT option describe different rates of implementation of best-practice technology compared to the average technology in newly built and retrofitted plants.
BTX: BTX is a shorthand and summary description for light aromatic compounds: toluene, benzene and xylenes.
Carbon leakage: defined as the increase in CO2 emissions in one country (A) that result from emissions reduction in another country (B) with more stringent constraints. It often reflects cost associated with emissions reductions: as constraints drive up costs of production in country B, companies may opt to produce the same goods in country A, where lighter restrictions help keep costs lower.
Catalysis: a concept in chemistry by which the speed of a chemical reaction towards a specific outcome is enhanced by using a catalyst. Catalysis cannot make a thermodynamically impossible reaction possible, nor does it change the overall energy balance of a reaction. However, it may shift the processing conditions towards a technically more accessible environment and strongly enhance the yield of the desired product compound.
Catalytic decomposition: describes the transformation of thermodynamically unstable compounds into thermodynamically more stable with the help of catalysts (e.g. N2O into N2 and O2).
Carbon capture and storage (CCS): a series of process steps aimed at capturing CO2 from flue gases and transferring it into geological formations for storage.
CO2-eq: a unit to measure the global warming effect of a greenhouse gas in the atmosphere. 1 tCO2-eq describes the effect of the gas in question to have the same effect as if 1 metric tonne of CO2 would have been emitted.
Co-generation: describes coupled generation of heat and power in the same power plant, which strongly increases the overall energetic efficiency of the plant.
Consumer chemicals: consumer chemicals represent a large group of chemicals sold to final consumers, such as soaps and detergents as well as perfumes and cosmetics.
DECHEMA (Society for Chemical Engineering and Biotechnology): The DECHEMA Gesellschaft für Chemische Technik und Biotechnologie e. V. (Society for Chemical Engineering and Biotechnology) is a non-profit scientific and technical society based in Frankfurt am Main, Germany. It has more than 5 500 private and institutional members, among them scientists, engineers, companies, organisations and institutes. One aim of DECHEMA is to promote and support research and technological progress in Chemical Technology and Biotechnology. DECHEMA regards itself as interface between science, economy, state and public.
Emerging technologies: describes technologies that have demonstrated technical viability and have a high potential of being economically competitive on an industrial scale.
Emissions - direct, indirect, process: GHG emissions can come from different sources. Direct emissions include emissions caused by, for example, burning a fuel for heat generation. Indirect emissions are caused by the power plants producing the electricity required for the process. Process emissions are stoichiometric emissions caused by the chemical reaction on which the process is based on or emissions caused by over-oxidation for a given chemical process.
Energy intensity: the amount of energy required to produce a given product, expressed in units of GJ per metric tonne product.
Exajoule: unit of energy = 1018 Joules.
Feedstock: describes the precursor compounds for a specific chemical process. Within the process chains of the chemical industry, most feedstocks originate from fossil fuels (coal, oil, natural gas).

53Glossary
Game changers: technologies that significantly change the status quo of current production and value chains in the chemical and petrochemical industry.
Greenhouse gases (GHGs): gases that when released to the atmosphere, reduce the net infrared radiation that is emitted by the Earth surface to outer space, thereby increasing the average global temperature of the atmosphere. The most prominent GHG in the Earth’s atmosphere is CO2. Other GHGs include methane, N2O, ozone and refrigerants.
GHG intensity: the amount of GHG emitted to produce a given product, expressed in units of CO2-eq per metric tonne product.
Gigajoule: unit of energy: 109 Joules.
Heat integration: describes the efficient coupling of heat sources and heat consumers within or between chemical processes.
High-value chemicals (HVC): a general term to describe the products of naphtha cracking. Ethylene and propylene are the main products, but HVCs also include e.g. butadiene and aromatics. The term HVC is also used in the context of catalytic olefin technologies and methanol-to-olefin technologies.
International Council of Chemical Associations (ICCA): the worldwide voice of the chemical industry, representing chemical manufacturers and producers all over the world. It accounts for more than 75% of chemical manufacturing operations with a production exceeding USD 1.6 trillion annually. ICCA promotes and co-ordinates Responsible Care® and other voluntary chemical industry initiatives. ICCA has a central role in the exchange of information within the international industry, and in the development of position statements on matters of policy. It is also the main channel of communication between the industry and various international organisations that are concerned with health, environment and trade-related issues, including the United Nations Environment Programme (UNEP), the World Trade Organization (WTO) and the Organisation for Economic Co-operation and Development (OECD).
International Energy Agency (IEA): an autonomous organisation that works to ensure reliable, affordable and clean energy for its 28 member countries and beyond. Founded in response to the 1973/74 oil crisis, the IEA initial role was to help countries co-ordinate a collective
response to major disruptions in oil supply through the release of emergency oil stocks to the markets. While this continues to be a key aspect of the Agency’s work, the IEA has evolved and expanded to encompass the full mix of energy resources. It is at the heart of global dialogue on energy, providing authoritative and unbiased research, statistics, analysis and recommendations.
Incremental improvement: describes all improvements carried out to a chemical or petrochemical plant during its operational lifetime without major retrofits.
Life-Cycle-Analysis (LCA): evaluates the effect of a given product on the environment (e.g. energy consumption, GHG emissions) over its entire life-cycle.
Metallocene: catalyst compounds in which the catalytically active metal is shielded by aromatic compounds in order to make it more selective.
Methanol-to-olefine (MTO): a process that produces ethylene and propylene using methanol as a feedstock.
Naphtha: a certain refinery cut in the oil distillation that contains a wide variety of compounds. Naphtha is generally fed into crackers to produce most basic precursor chemicals within the chemical industry value chain.
Non-energy use emission accounting tables (NEAT): a method used to distinguish overall fossil fuel consumption in chemical process in energetic and non-energetic use.
Over-oxidation: chemical oxidation processes generally aim for a specific product, which in most practical cases might still be subject to further oxidation. Often, some “over”-oxidation of the intended product cannot be avoided and is an inherent feature of the process.
Polyethylene (PE): a plastic compound, derived from linking ethylene units.
Photocatalysis: describes catalytic processes that make use of light as a source of energy for the chemical reaction.
Process intensification: process-specific improvements that lead to major step change improvements in the way a process is operated.
Shale gas: shale gas is natural gas found trapped within shale rock formations.

54 Technology Roadmap Energy and GHG reductions in the chemical industry via catalytic processes
Specialty chemicals: a category of relatively high valued, rapidly growing chemicals with diverse end product markets.
Specific energy consumption (SEC): the amount of energy, expressed in GJ/t, that an average plant requires to produce a specific product.
Shutdown economics: old plants have already amortised their original capital investment cost. The plant economic viability is defined only by the operational cost and therefore it is often still competitive even if based on “no-longer-state-of-the-art” technology.
Stoichiometry: describes quantitatively the relationship between different reactants and products within a chemical reaction.
Synthesis gas (syngas): gas mixtures of CO and H2 generated by gasification of fossil fuels. The amount of hydrogen in the mixture can be enhanced by applying a water-gas shift reaction on the mixture, which converts H2O and CO into H2 and CO2.
Thermodynamic limit: describes the energetic difference between reactants and products of a chemical reaction. It is the minimum amount of energy necessary for a chemical reaction to occur.

55References
ReferencesACC (American Chemistry Council), (2012), Guide to the Business of Chemistry, ACC, Washington, DC.
AMO (Advanced Manufacturing Office, US Department of Energy) (2007), Energy and Environmental Profile of the U.S. Petroleum Refining Industry, US DoE, Washington, DC.
AMO (2012), Manufacturing Energy and Carbon Footprint - Sector: Petroleum Refining (NAICS 324110), US DoE, Washington, DC, March 2012.
Barger, P.T., B.V. Vora and UOP LLC (2003), Methanol-to-Olefin Process with Increased Selectivity to Ethylene and Propylene, US Patent 6,534,692, US Patent and Trademark Office (USPTO), DesPlaines, IL.
Benner, J.H.B., M. Lieshout and H.J. Croezen (2012), Identifying Breakthrough Technologies for the Production of Basic Chemicals, CE Delft 2012, Delft.
Blauwhoff, P.M.M., J.W. Gosselink, E.P. Kieffer, S.T. Sie and W.H.J. Stork (2012), Zeolites as Catalysts in Industrial Processes; in Catalysis and Zeolites – Fundamentals and Applications, B.J. Weitkamp and L. Puppe (eds.), Springer, Berlin.
BP (British Petroleum) (2011), BP Statistical Review of World Energy 2011, BP, London.
CEFIC (European Chemical Industy Council) (2012), Facts and Figures 2012: The European Chemicals Industry in a Worldwide Perspective, CEFIC, Brussels.
Chemical Week (2002), “LG Develops Catalytic Naphtha Cracking Process”, ChemicalWeek, New York/London, 22 May 2002.
Edwards, R., J.-F. Larivé, V. Mahieu and P. Rouveirolles (2011), Well-to-Wheels Analysis of Future Automotive Fuels and Powertrains in the European Context: WELL-to-TANK Report Version 3c, July 2011, European Commission, Brussels.
Energetics Incorporated (2006), Energy Bandwidth for Petroleum Refining Processes, Energetics Incorporated, for the US Department of Energy, Office of Energy Efficiency and Renewable Energy Industrial Technologies Program, Columbia, MD, October 2006.
Erismann, J.W. (2008), How a century of ammonia synthesis changed the world, Nature Geoscience 2008, Vol. 1, 636-39.
GeCatS (2010), Catalysis - A Key Technology for Sustainable Economic Growth, Roadmap for Catalysis Research in Germany, 3rd edition, 2010, German Catalysis Society, Frankfurt.
Han, S.S., J.N. Kim, C.W. Lee and Y.K. Park (2002), Catalytic Cracking of Heavy Naphtha and Olefin Separation in Atmospheric Temperature, Korea Research Institute of Chemical Technology (KRICT) Advanced Chemical Technology Division, Seoul, Korea.
Hunter, S., B. Pereira and R. Helling (2008), Life Cycle Assessment of Sugarcane-Based Polyethylene, Dow Chemical Company, 2008.
ICCA (International Council of Chemical Associations) (2009), Innovations for Greenhouse Gas Reductions: A Life-Cycle Quantification of Carbon Abatement Solutions Enabled by the Chemical Industry, ICCA, Amsterdam.
ICCA (2010), ICCA Annual Report 2010, ICCA, Amsterdam.
IEA (2009), Energy Technology Transition in Industry, OECD/IEA, Paris.
IEA (2011), CCS in Industrial Applications Roadmap, OECD/IEA, Paris.
IEA (2012), Energy Technology Perspectives 2012, OECD/IEA, Paris.
IFA (International Fertilizer Association) (2009), Energy Efficiency and CO2 Emissions in Ammonia Production, IFA, Paris, December 2009, retrieved from www.ifa.org.
Jones, M. and D. Elliott (2011), Workshop on Conversion Technologies for Advanced Biofuels, Pacific Northwest National Laboratory, 6-8 December 2011.
Lange, J.P. (2001), Fuels and Chemicals Manufacturing: Guidelines for Understanding and Minimizing the Production Costs, CATTECH 2001, Vol. 5, No. 2, 82-95.
Neelis, M.L., M.K. Patel, P. Bach, W.G. Haije and K. Blok (2007), “Approximation of Theoretical Energy-Saving Potentials for the Petrochemical Industry Using Energy Balances for 68 Key Processes”, Energy, Vol. 32, pp. 1104-23.
NREL (National Renewable Energy Laboratory) (2004), Analysis of Current-Day Commercial Electrolyzers, NREL, Washtington, DC.
56 Technology Roadmap Energy and GHG reductions in the chemical industry via catalytic processes
NREL (2011), 2011 Interim Update, Technical Plan: Production, NREL, Washington, DC, retrieved from NREL’s Office of Energy Efficiency and Renewable Energy - Fuel Cell Technologies Program in 2009: www1.eere.energy.gov/hydrogenandfuelcells/mypp/pdfs/production.pdf.
Observ'ER (L'Observatoire des énergies renouvelables) (2011), Worldwide Electricity Production From Renewable Energy Sources: Stats and Figures Series: Thirteenth Inventory - Edition 2011, Observ'ER, Paris.
Ren, T., M. Patel and K. Blok (2006), Olefins from Conventional and Heavy Feedstocks: Energy Use in Steam Cracking and Alternative Processes, Energy, Vol. 31, No. 4, pp. 425-51.
Ren, T. (2009), Petrochemicals from Oil, Natural Gas, Coal and Biomass: Energy Use, Economics and Innovation, Utrecht University, 2009.
Saygin, D., M. Patel, C. Tam and D. Gielen (2009), Chemical and Petrochemical Sector, OECD/IEA, Paris.
TOPCOMBI (2007), TOPCOMBI, Sixth Framework Programme Annex, NMP-CT2005-515792 – 22.05.2007, Institut für Mikrotechnik Mainz GmbH, Mainz, Germany.
Weiss, M., M.L. Neelis, K. Blok and M.K. Patel (2008), Non-Energy Use and Related Carbon Dioxide Emissions in Germany: A Carbon Flow Analysis with the NEAT Model for the Period of 1990–2003, Resources, Conservation and Recycling 2008, Vol. 52, pp. 1252–65.
Yoneyama, M.W. (2010), Catalysts: Petroleum and Chemical Process, SRI Consulting, Menlo Park, USA.
This document and any map included herein are without prejudice to the status of or sovereignty over any territory, to the delimitation of international frontiers
and boundaries and to the name of any territory, city or area.
IEA Publications, 9 rue de la Fédération, 75739 PARIS CEDEX 15PRINTED IN FRANCE BY CORLET, MAY 2013
Front cover photo (large): © GraphicObsessionFront cover photo (small): © Comstock
Back cover photo (large): © GraphicObsession, © Siemens, © PhotodiscBack cover photo (small): © BASF
The paper used for this document has received certification from the Programme for the Endorsement of Forest Certification (PEFC) for being produced respecting PEFC’s ecological, social and ethical standards. PEFC is an international non-profit, non-governmental
organization dedicated to promoting Sustainable Forest Management (SFM) through independent third-party certification.

International Energy Agency • 9 rue de la Fédération • 75739 Paris Cedex 15, France
Buy IEA publications online:
www.iea.org/books
PDF versions available at 20% discount
A number of books printed before January 2012
are now available free of charge in pdf format
on our website
Onlinebookshop
Tel: +33 (0)1 40 57 66 90
E-mail: [email protected]
Bookshop_2013_Q_A4.indd 1 12/19/2012 10:41:23 AM

2020
2025
2030
2010
2015
International Energy Agency – IEA9 rue de la Fédération, 75015 Paris, FranceTel: +33 (0)1 40 57 65 00/01 Fax: +33 (0)1 40 57 65 59Email: [email protected], Web: www.iea.org
ICCA c/o CeficAvenue E. Van Nieuwenhuyse 4, Box 1, B-1160 Brussels, BelgiumTel: +32 (0)2 676 74 15 Fax: +32 (0)2 676 74 32Email: [email protected], Web: www.icca-chem.org
DECHEMA Gesellschaft für Chemische Technik und Biotechnologie e. V. Theodor-Heuss Allee 25, 60486 Frankfurt am Main, GermanyTel: +49 (0)69 7564 0Fax: +49 (0)69 7564 201Email: [email protected], Web: www.dechema.de
Tech
nol
ogy
Roa
dm
ap
Ener
gy a
nd G
HG
Red
uctio
ns in
the
Che
mic
al In
dust
ry v
ia C
atal
ytic
Pro
cess
es


