29
As of May 8, 2018 The AES Corporation Fact Sheet
As of May 8, 2018
The AES CorporationFact Sheet
2Contains Forward-Looking Statements 2
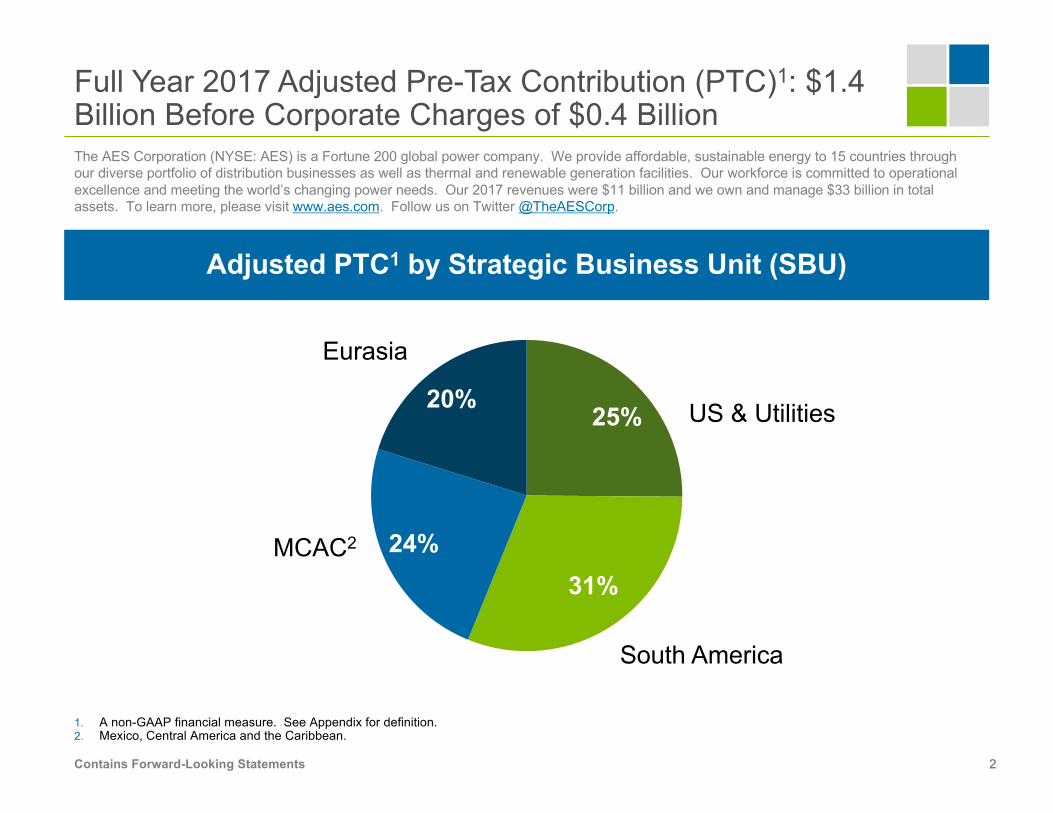
Adjusted PTC1 by Strategic Business Unit (SBU)
The AES Corporation (NYSE: AES) is a Fortune 200 global power company. We provide affordable, sustainable energy to 15 countries through our diverse portfolio of distribution businesses as well as thermal and renewable generation facilities. Our workforce is committed to operational excellence and meeting the world’s changing power needs. Our 2017 revenues were $11 billion and we own and manage $33 billion in total assets. To learn more, please visit www.aes.com. Follow us on Twitter @TheAESCorp.
1. A non-GAAP financial measure. See Appendix for definition.2. Mexico, Central America and the Caribbean.
Full Year 2017 Adjusted Pre-Tax Contribution (PTC)1: $1.4 Billion Before Corporate Charges of $0.4 Billion
25%
31%24%
20%
Eurasia
US & Utilities
MCAC2
South America
3Contains Forward-Looking Statements 3
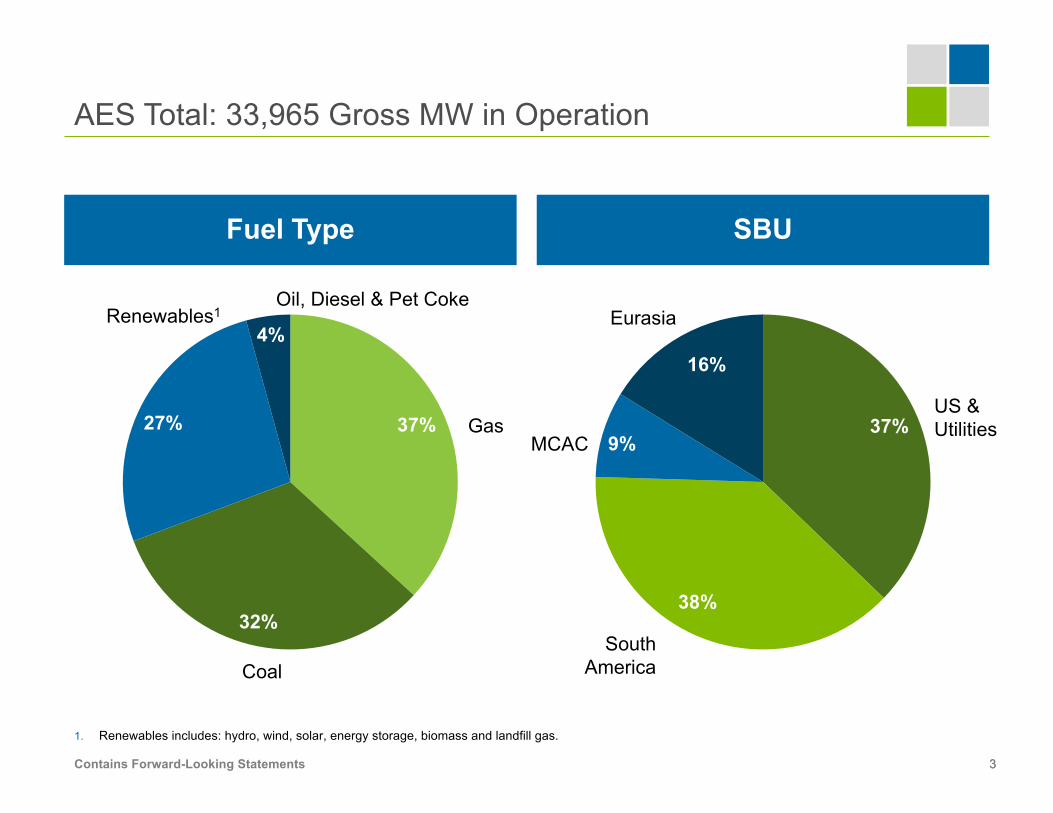
Fuel Type SBU
1. Renewables includes: hydro, wind, solar, energy storage, biomass and landfill gas.
AES Total: 33,965 Gross MW in Operation
37%
32%
27%
4%
37%
38%
9%
16%
Oil, Diesel & Pet CokeRenewables1
Gas
Coal
US & Utilities
South America
MCAC
Eurasia
4Contains Forward-Looking Statements 4
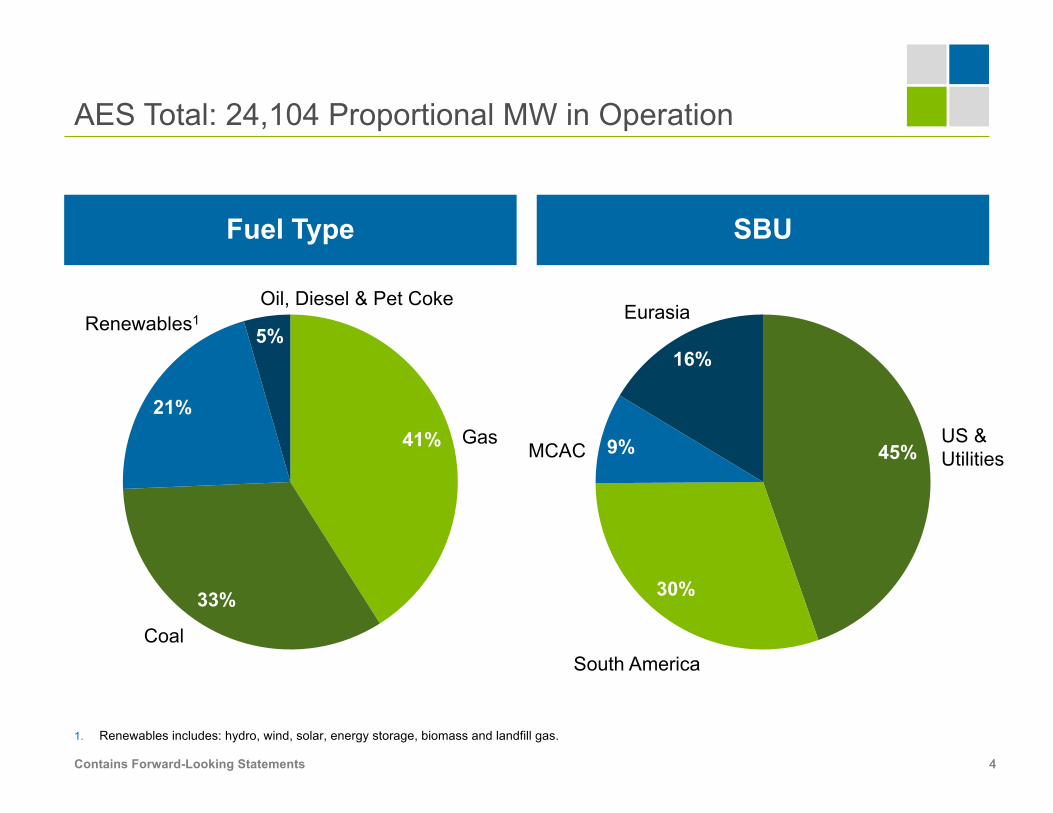
Fuel Type SBU
1. Renewables includes: hydro, wind, solar, energy storage, biomass and landfill gas.
AES Total: 24,104 Proportional MW in Operation
41%
33%
21%
5%
45%
30%
9%
16%
Oil, Diesel & Pet CokeRenewables1
Gas
Coal
US & Utilities
South America
MCAC
Eurasia
5Contains Forward-Looking Statements 5
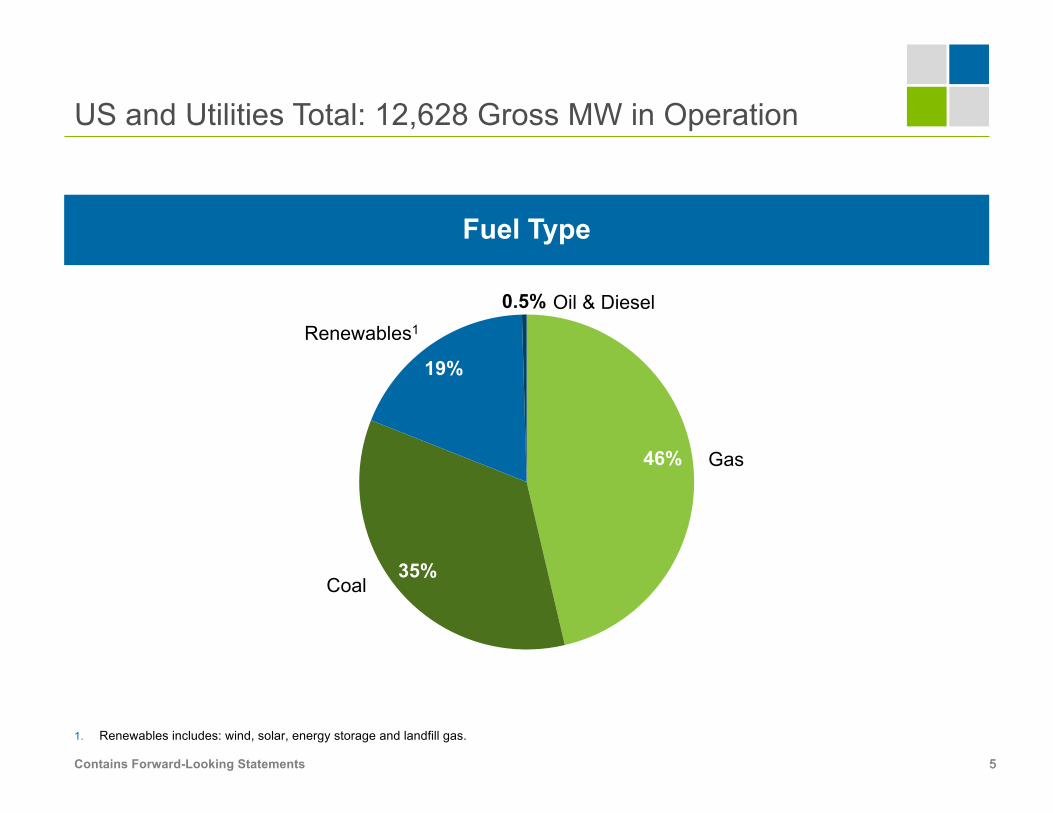
Fuel Type
1. Renewables includes: wind, solar, energy storage and landfill gas.
US and Utilities Total: 12,628 Gross MW in Operation
46%
35%
19%
0.5%Renewables1
Gas
Coal
Oil & Diesel
6Contains Forward-Looking Statements 6
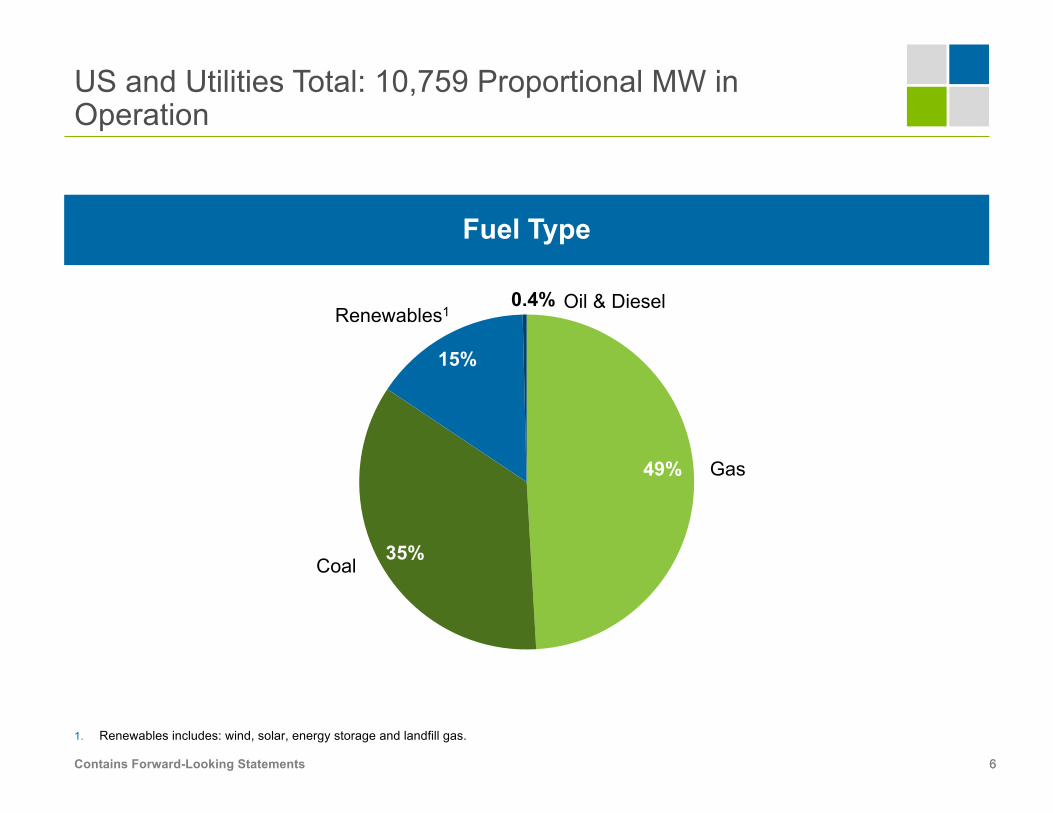
Fuel Type
1. Renewables includes: wind, solar, energy storage and landfill gas.
US and Utilities Total: 10,759 Proportional MW in Operation
49%
35%
15%
0.4%Renewables1
Gas
Coal
Oil & Diesel
7Contains Forward-Looking Statements 7
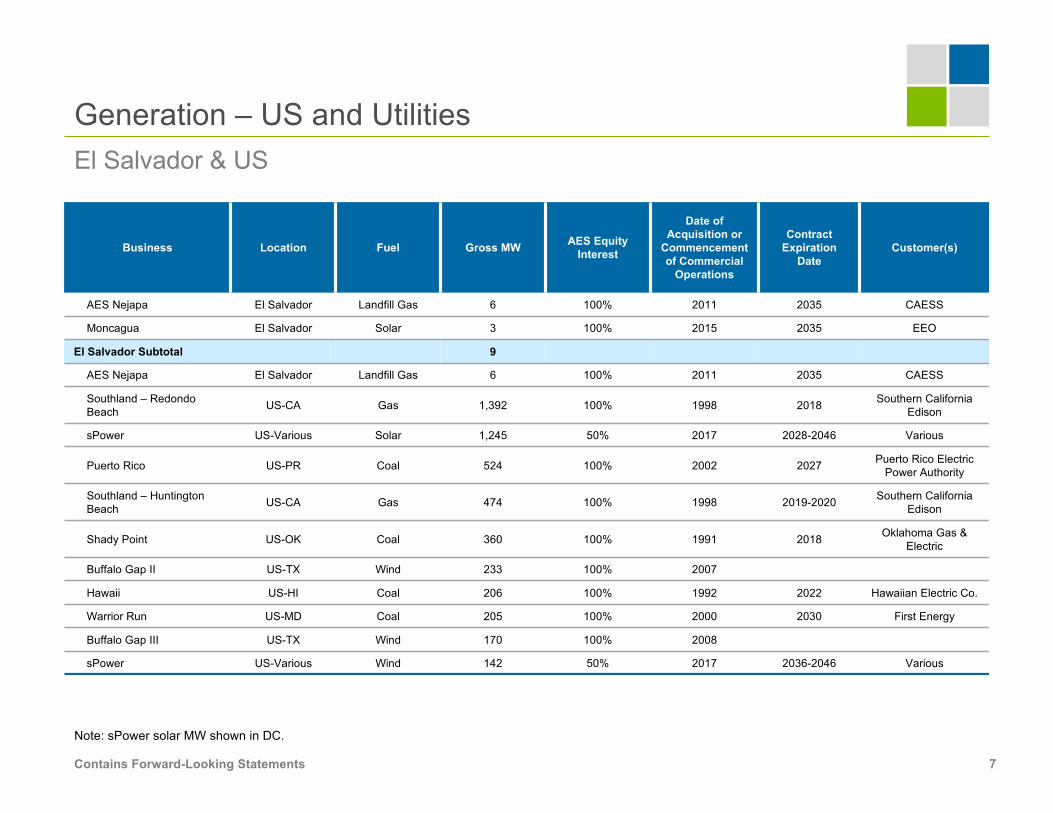
Business Location Fuel Gross MW AES Equity Interest
Date of Acquisition or
Commencement of Commercial
Operations
Contract Expiration
DateCustomer(s)
AES Nejapa El Salvador Landfill Gas 6 100% 2011 2035 CAESS
Moncagua El Salvador Solar 3 100% 2015 2035 EEO
El Salvador Subtotal 9
AES Nejapa El Salvador Landfill Gas 6 100% 2011 2035 CAESS
Southland – Redondo Beach US-CA Gas 1,392 100% 1998 2018 Southern California
Edison
sPower US-Various Solar 1,245 50% 2017 2028-2046 Various
Puerto Rico US-PR Coal 524 100% 2002 2027 Puerto Rico Electric Power Authority
Southland – Huntington Beach US-CA Gas 474 100% 1998 2019-2020 Southern California
Edison
Shady Point US-OK Coal 360 100% 1991 2018 Oklahoma Gas & Electric
Buffalo Gap II US-TX Wind 233 100% 2007
Hawaii US-HI Coal 206 100% 1992 2022 Hawaiian Electric Co.
Warrior Run US-MD Coal 205 100% 2000 2030 First Energy
Buffalo Gap III US-TX Wind 170 100% 2008
sPower US-Various Wind 142 50% 2017 2036-2046 Various
El Salvador & US
Note: sPower solar MW shown in DC.
Generation – US and Utilities
8Contains Forward-Looking Statements 8
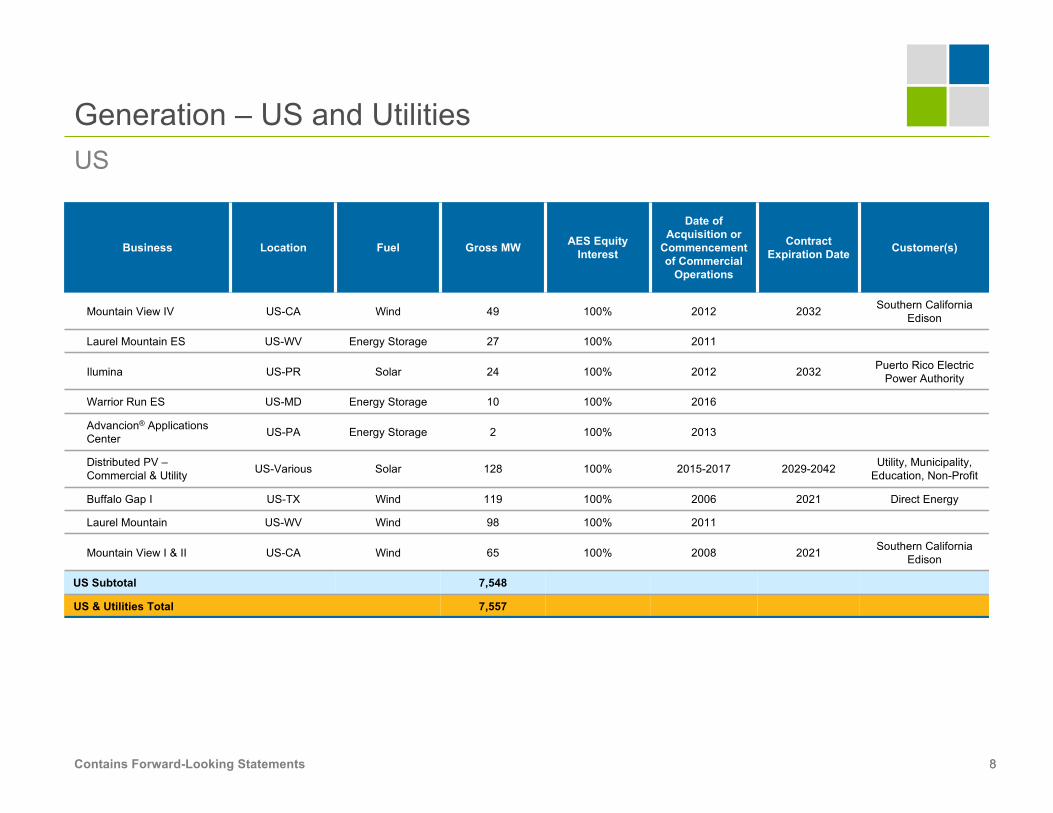
Business Location Fuel Gross MW AES Equity Interest
Date of Acquisition or
Commencement of Commercial
Operations
Contract Expiration Date Customer(s)
Mountain View IV US-CA Wind 49 100% 2012 2032 Southern California Edison
Laurel Mountain ES US-WV Energy Storage 27 100% 2011
Ilumina US-PR Solar 24 100% 2012 2032 Puerto Rico Electric Power Authority
Warrior Run ES US-MD Energy Storage 10 100% 2016
Advancion® Applications Center US-PA Energy Storage 2 100% 2013
Distributed PV –Commercial & Utility US-Various Solar 128 100% 2015-2017 2029-2042 Utility, Municipality,
Education, Non-Profit
Buffalo Gap I US-TX Wind 119 100% 2006 2021 Direct Energy
Laurel Mountain US-WV Wind 98 100% 2011
Mountain View I & II US-CA Wind 65 100% 2008 2021 Southern California Edison
US Subtotal 7,548
US & Utilities Total 7,557
US
Generation – US and Utilities
9Contains Forward-Looking Statements 9
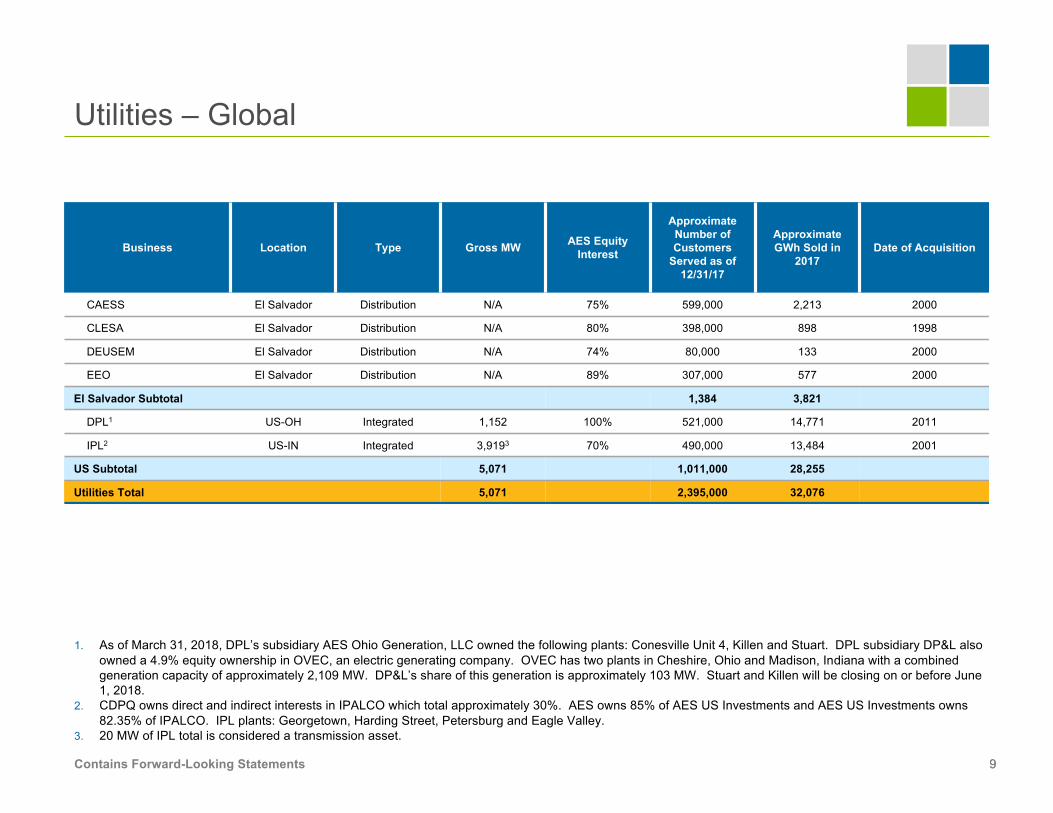
Business Location Type Gross MWAES Equity
Interest
Approximate Number of Customers
Served as of 12/31/17
Approximate GWh Sold in
2017Date of Acquisition
CAESS El Salvador Distribution N/A 75% 599,000 2,213 2000
CLESA El Salvador Distribution N/A 80% 398,000 898 1998
DEUSEM El Salvador Distribution N/A 74% 80,000 133 2000
EEO El Salvador Distribution N/A 89% 307,000 577 2000
El Salvador Subtotal 1,384 3,821
DPL1 US-OH Integrated 1,152 100% 521,000 14,771 2011
IPL2 US-IN Integrated 3,9193 70% 490,000 13,484 2001
US Subtotal 5,071 1,011,000 28,255
Utilities Total 5,071 2,395,000 32,076
1. As of March 31, 2018, DPL’s subsidiary AES Ohio Generation, LLC owned the following plants: Conesville Unit 4, Killen and Stuart. DPL subsidiary DP&L also owned a 4.9% equity ownership in OVEC, an electric generating company. OVEC has two plants in Cheshire, Ohio and Madison, Indiana with a combined generation capacity of approximately 2,109 MW. DP&L’s share of this generation is approximately 103 MW. Stuart and Killen will be closing on or before June 1, 2018.
2. CDPQ owns direct and indirect interests in IPALCO which total approximately 30%. AES owns 85% of AES US Investments and AES US Investments owns 82.35% of IPALCO. IPL plants: Georgetown, Harding Street, Petersburg and Eagle Valley.
3. 20 MW of IPL total is considered a transmission asset.
Utilities – Global
10Contains Forward-Looking Statements 10
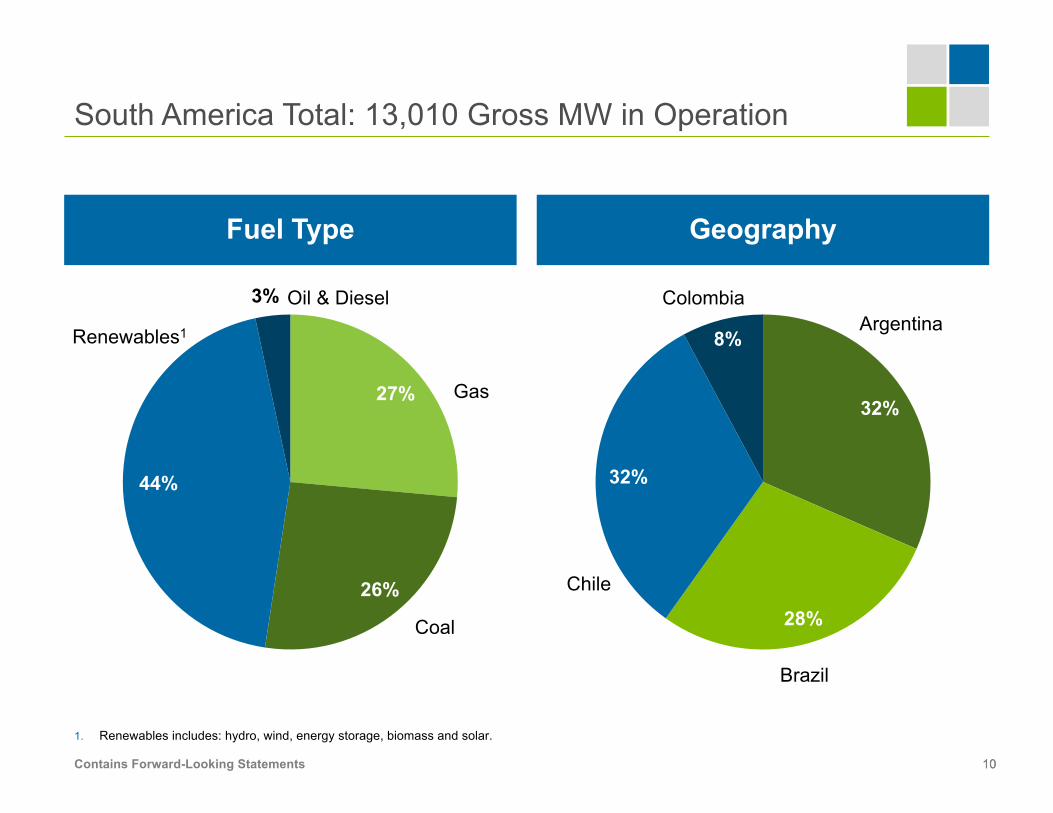
Fuel Type Geography
1. Renewables includes: hydro, wind, energy storage, biomass and solar.
South America Total: 13,010 Gross MW in Operation
27%
26%
44%
3%
32%
28%
32%
8%
Oil & Diesel
Renewables1
Gas
Coal
ArgentinaColombia
Chile
Brazil
11Contains Forward-Looking Statements 11
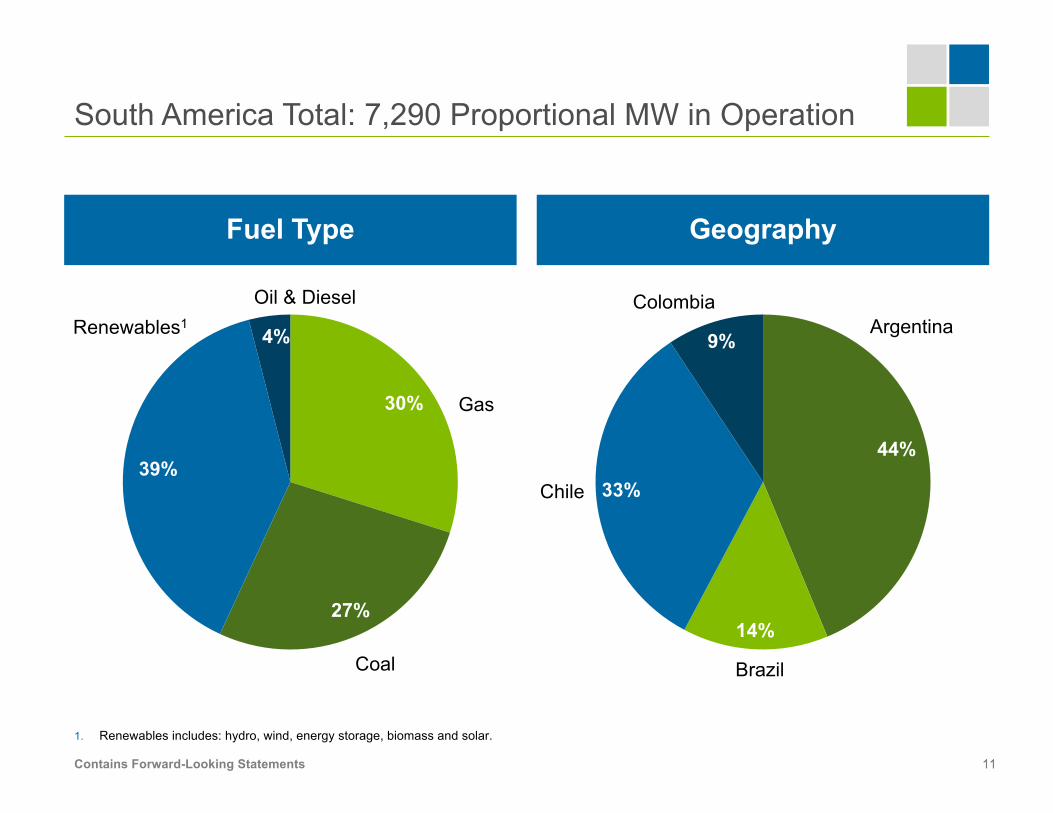
Fuel Type Geography
1. Renewables includes: hydro, wind, energy storage, biomass and solar.
South America Total: 7,290 Proportional MW in Operation
30%
27%
39%
4%
44%
14%
33%
9%
Oil & DieselRenewables1
Gas
Coal
ArgentinaColombia
Chile
Brazil
12Contains Forward-Looking Statements 12
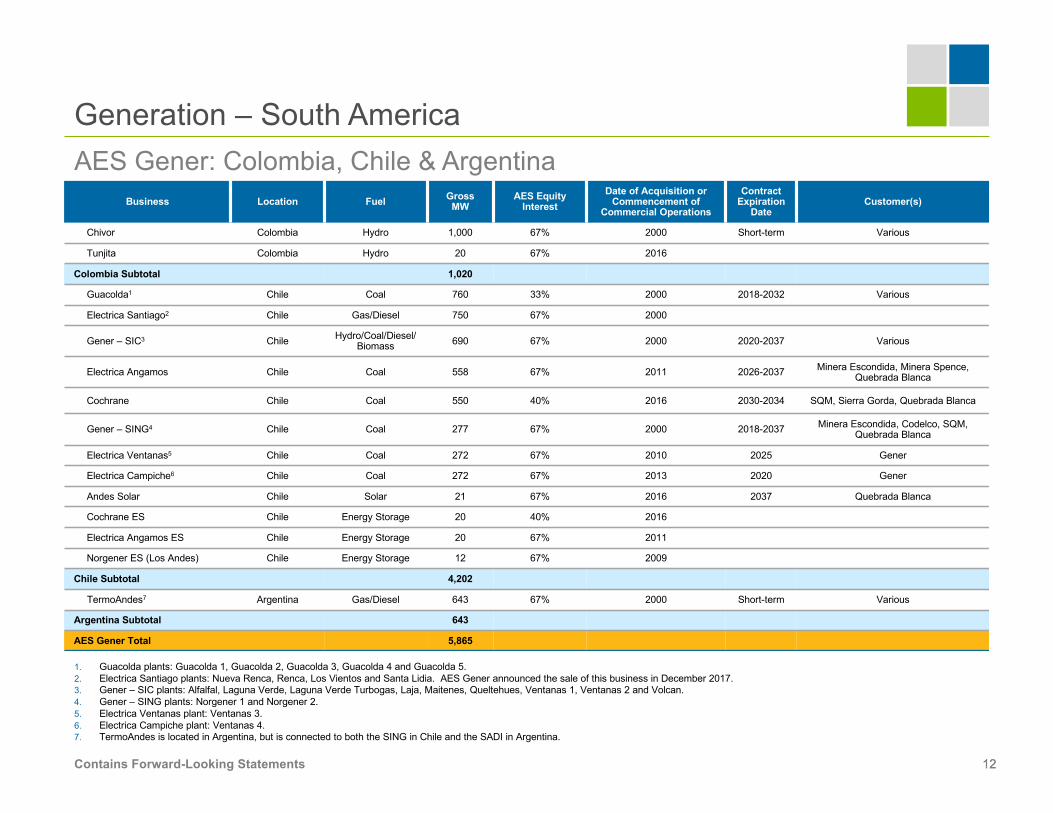
Business Location Fuel Gross MW
AES Equity Interest
Date of Acquisition or Commencement of
Commercial Operations
Contract Expiration
DateCustomer(s)
Chivor Colombia Hydro 1,000 67% 2000 Short-term Various
Tunjita Colombia Hydro 20 67% 2016
Colombia Subtotal 1,020
Guacolda1 Chile Coal 760 33% 2000 2018-2032 Various
Electrica Santiago2 Chile Gas/Diesel 750 67% 2000
Gener – SIC3 ChileHydro/Coal/Diesel/
Biomass690 67% 2000 2020-2037 Various
Electrica Angamos Chile Coal 558 67% 2011 2026-2037Minera Escondida, Minera Spence,
Quebrada Blanca
Cochrane Chile Coal 550 40% 2016 2030-2034 SQM, Sierra Gorda, Quebrada Blanca
Gener – SING4 Chile Coal 277 67% 2000 2018-2037Minera Escondida, Codelco, SQM,
Quebrada Blanca
Electrica Ventanas5 Chile Coal 272 67% 2010 2025 Gener
Electrica Campiche6 Chile Coal 272 67% 2013 2020 Gener
Andes Solar Chile Solar 21 67% 2016 2037 Quebrada Blanca
Cochrane ES Chile Energy Storage 20 40% 2016
Electrica Angamos ES Chile Energy Storage 20 67% 2011
Norgener ES (Los Andes) Chile Energy Storage 12 67% 2009
Chile Subtotal 4,202
TermoAndes7 Argentina Gas/Diesel 643 67% 2000 Short-term Various
Argentina Subtotal 643
AES Gener Total 5,865
AES Gener: Colombia, Chile & Argentina
1. Guacolda plants: Guacolda 1, Guacolda 2, Guacolda 3, Guacolda 4 and Guacolda 5.
2. Electrica Santiago plants: Nueva Renca, Renca, Los Vientos and Santa Lidia. AES Gener announced the sale of this business in December 2017.
3. Gener – SIC plants: Alfalfal, Laguna Verde, Laguna Verde Turbogas, Laja, Maitenes, Queltehues, Ventanas 1, Ventanas 2 and Volcan.
4. Gener – SING plants: Norgener 1 and Norgener 2.
5. Electrica Ventanas plant: Ventanas 3.
6. Electrica Campiche plant: Ventanas 4.
7. TermoAndes is located in Argentina, but is connected to both the SING in Chile and the SADI in Argentina.
Generation – South America
13Contains Forward-Looking Statements 13
Business Location Fuel Gross MW AES Equity Interest
Date of Acquisition or
Commencement of Commercial
Operations
Contract Expiration
DateCustomer(s)
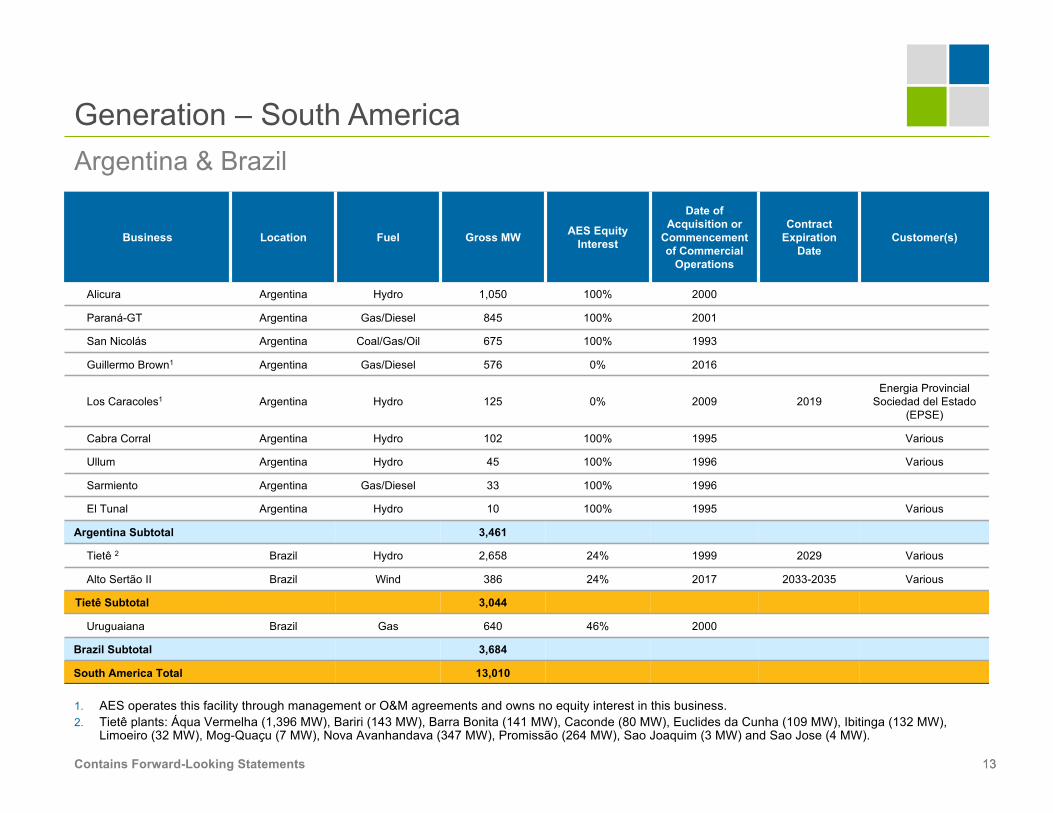
Alicura Argentina Hydro 1,050 100% 2000
Paraná-GT Argentina Gas/Diesel 845 100% 2001
San Nicolás Argentina Coal/Gas/Oil 675 100% 1993
Guillermo Brown1 Argentina Gas/Diesel 576 0% 2016
Los Caracoles1 Argentina Hydro 125 0% 2009 2019Energia Provincial
Sociedad del Estado (EPSE)
Cabra Corral Argentina Hydro 102 100% 1995 Various
Ullum Argentina Hydro 45 100% 1996 Various
Sarmiento Argentina Gas/Diesel 33 100% 1996
El Tunal Argentina Hydro 10 100% 1995 Various
Argentina Subtotal 3,461
Tietê 2 Brazil Hydro 2,658 24% 1999 2029 Various
Alto Sertão II Brazil Wind 386 24% 2017 2033-2035 Various
Tietê Subtotal 3,044
Uruguaiana Brazil Gas 640 46% 2000
Brazil Subtotal 3,684
South America Total 13,010
Argentina & Brazil
1. AES operates this facility through management or O&M agreements and owns no equity interest in this business.2. Tietê plants: Áqua Vermelha (1,396 MW), Bariri (143 MW), Barra Bonita (141 MW), Caconde (80 MW), Euclides da Cunha (109 MW), Ibitinga (132 MW),
Limoeiro (32 MW), Mog-Quaçu (7 MW), Nova Avanhandava (347 MW), Promissão (264 MW), Sao Joaquim (3 MW) and Sao Jose (4 MW).
Generation – South America
14Contains Forward-Looking Statements 14
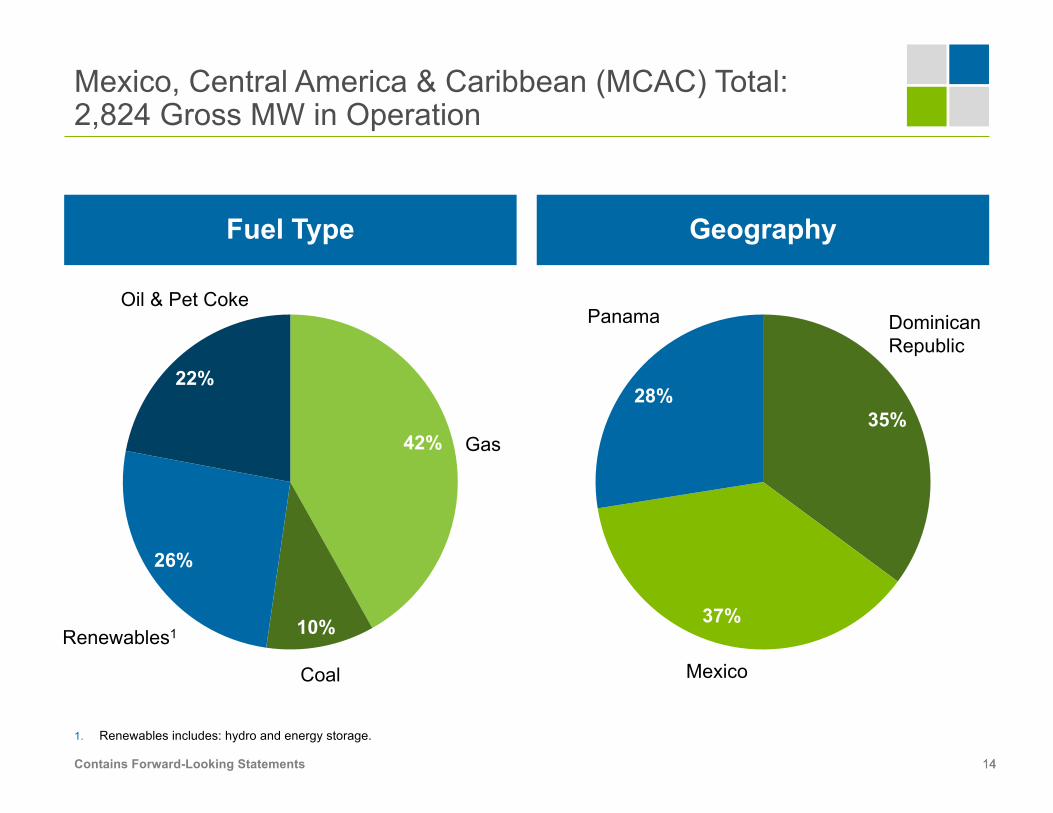
Fuel Type Geography
1. Renewables includes: hydro and energy storage.
Mexico, Central America & Caribbean (MCAC) Total: 2,824 Gross MW in Operation
42%
10%
26%
22%
35%
37%
28%
Oil & Pet Coke
Renewables1
Gas
Coal
Dominican Republic
Mexico
Panama
15Contains Forward-Looking Statements 15
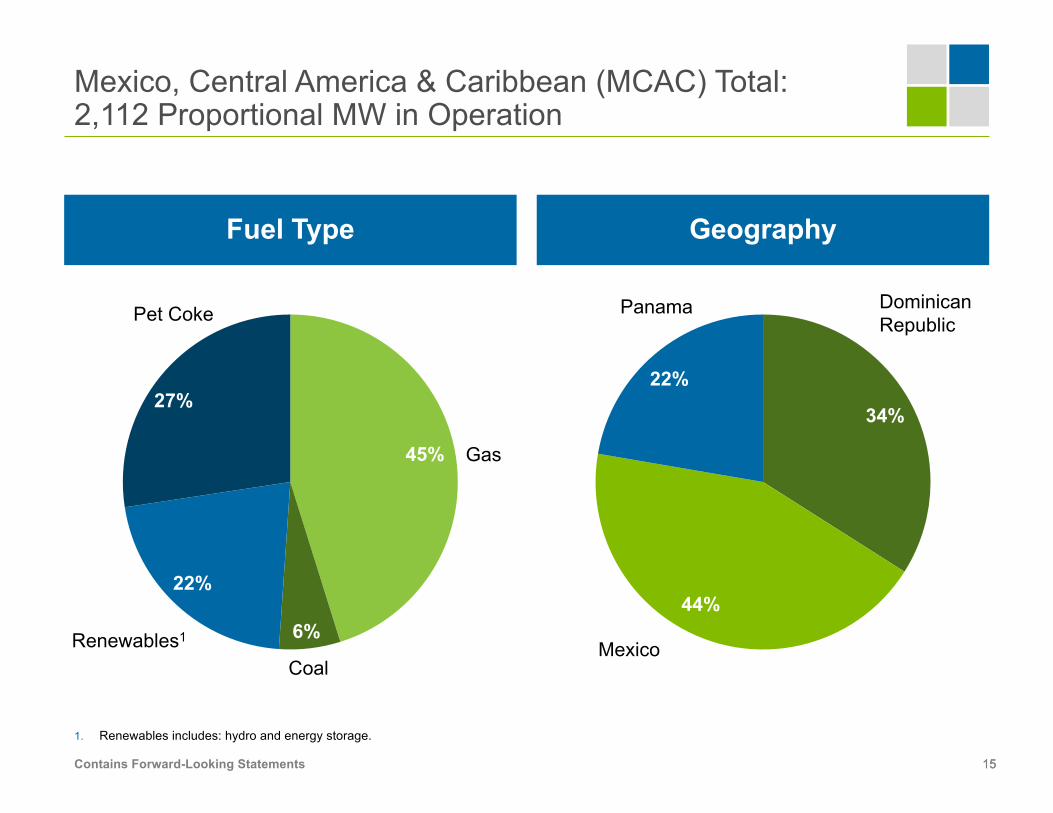
Fuel Type Geography
1. Renewables includes: hydro and energy storage.
Mexico, Central America & Caribbean (MCAC) Total: 2,112 Proportional MW in Operation
45%
6%
22%
27%34%
44%
22%
Pet Coke
Renewables1
Gas
Coal
Dominican Republic
Mexico
Panama
16Contains Forward-Looking Statements 16
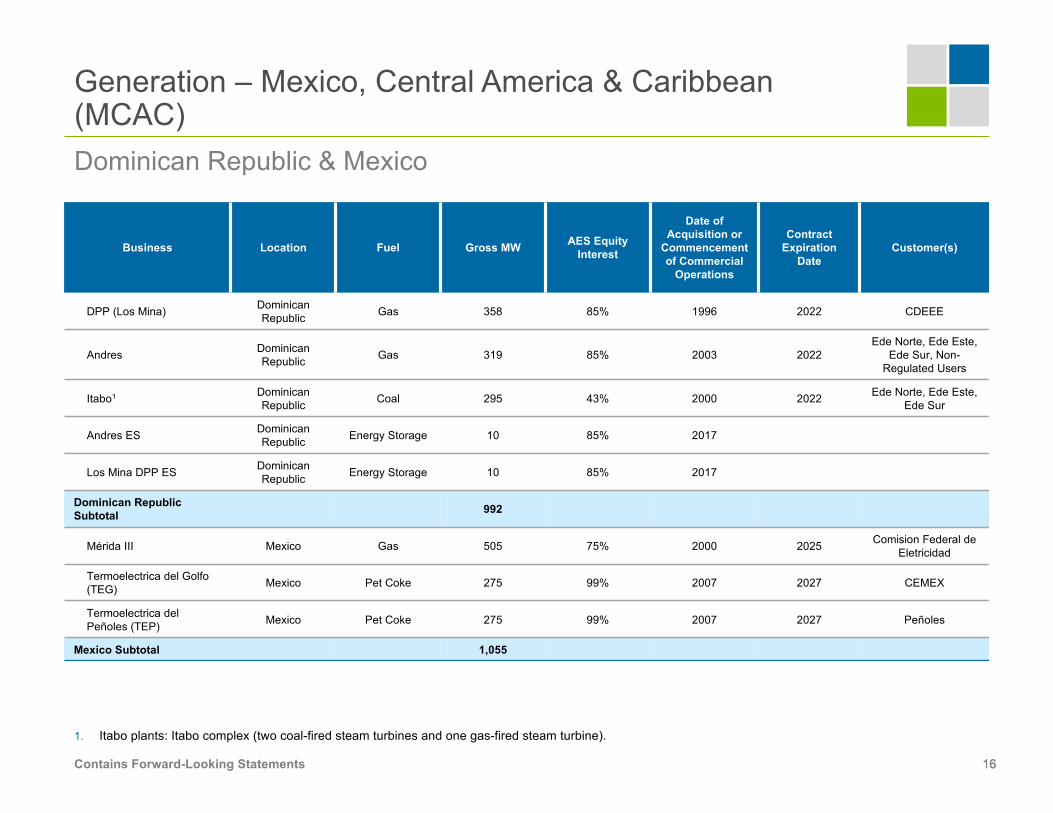
Business Location Fuel Gross MW AES Equity Interest
Date of Acquisition or
Commencement of Commercial
Operations
Contract Expiration
DateCustomer(s)
DPP (Los Mina)Dominican
RepublicGas 358 85% 1996 2022 CDEEE
AndresDominican
RepublicGas 319 85% 2003 2022
Ede Norte, Ede Este,
Ede Sur, Non-
Regulated Users
Itabo1Dominican
RepublicCoal 295 43% 2000 2022
Ede Norte, Ede Este,
Ede Sur
Andres ESDominican
RepublicEnergy Storage 10 85% 2017
Los Mina DPP ESDominican
RepublicEnergy Storage 10 85% 2017
Dominican Republic Subtotal 992
Mérida III Mexico Gas 505 75% 2000 2025Comision Federal de
Eletricidad
Termoelectrica del Golfo
(TEG)Mexico Pet Coke 275 99% 2007 2027 CEMEX
Termoelectrica del
Peñoles (TEP)Mexico Pet Coke 275 99% 2007 2027 Peñoles
Mexico Subtotal 1,055
Dominican Republic & Mexico
1. Itabo plants: Itabo complex (two coal-fired steam turbines and one gas-fired steam turbine).
Generation – Mexico, Central America & Caribbean
(MCAC)
17Contains Forward-Looking Statements 17
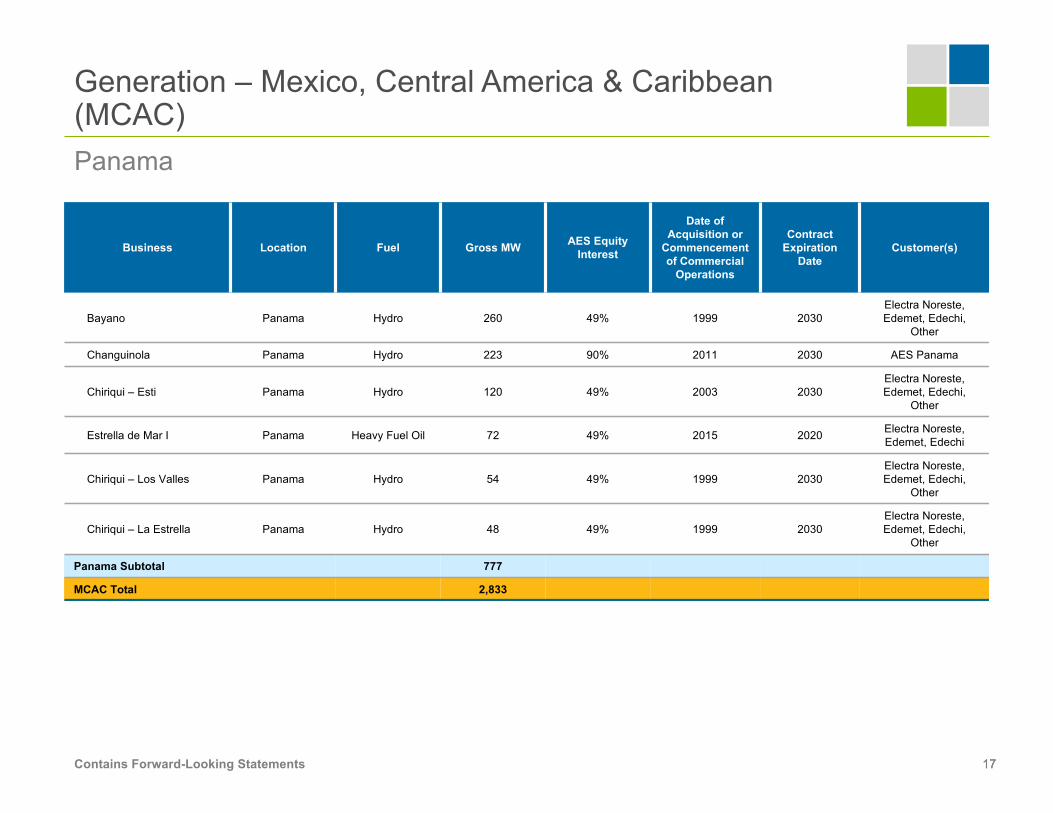
Business Location Fuel Gross MW AES Equity Interest
Date of Acquisition or
Commencement of Commercial
Operations
Contract Expiration
DateCustomer(s)
Bayano Panama Hydro 260 49% 1999 2030Electra Noreste, Edemet, Edechi,
Other
Changuinola Panama Hydro 223 90% 2011 2030 AES Panama
Chiriqui – Esti Panama Hydro 120 49% 2003 2030Electra Noreste, Edemet, Edechi,
Other
Estrella de Mar I Panama Heavy Fuel Oil 72 49% 2015 2020 Electra Noreste, Edemet, Edechi
Chiriqui – Los Valles Panama Hydro 54 49% 1999 2030Electra Noreste, Edemet, Edechi,
Other
Chiriqui – La Estrella Panama Hydro 48 49% 1999 2030Electra Noreste, Edemet, Edechi,
Other
Panama Subtotal 777
MCAC Total 2,833
Panama
Generation – Mexico, Central America & Caribbean (MCAC)
18Contains Forward-Looking Statements 18
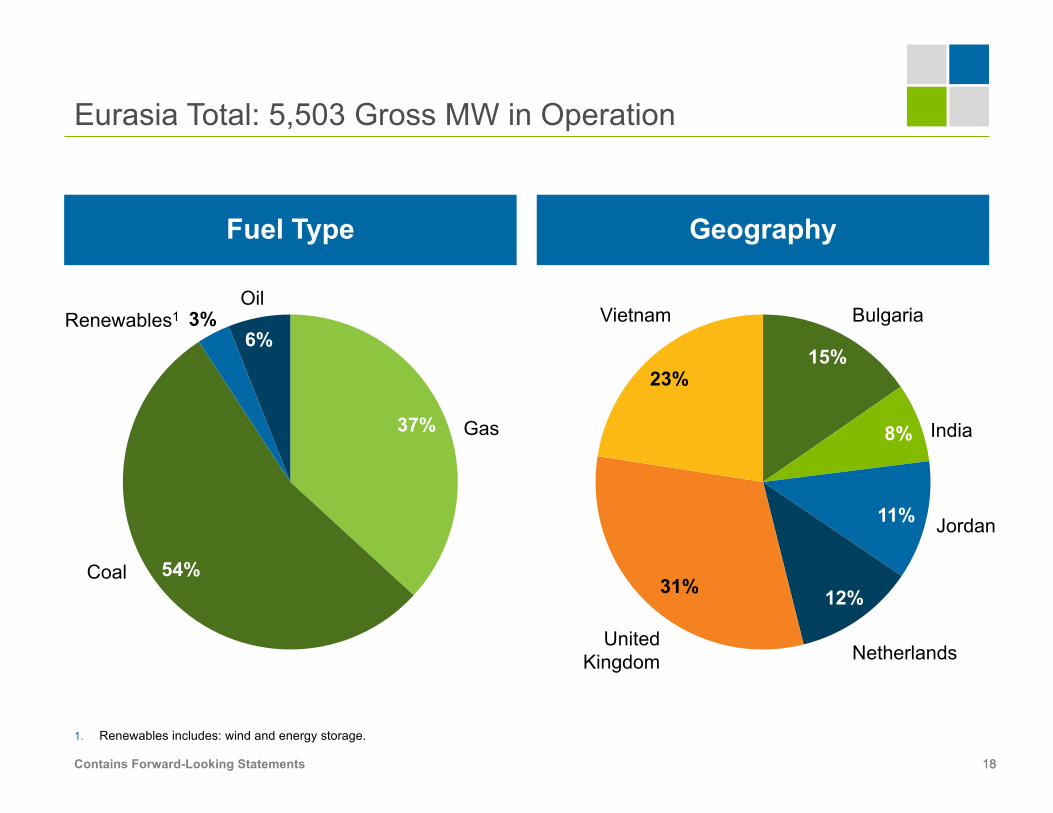
Fuel Type Geography
1. Renewables includes: wind and energy storage.
Eurasia Total: 5,503 Gross MW in Operation
37%
54%
3%6%
15%
8%
11%
12%31%
23%
OilRenewables1
Gas
Coal
Bulgaria
Netherlands
Jordan
United Kingdom
India
Vietnam
19Contains Forward-Looking Statements 19
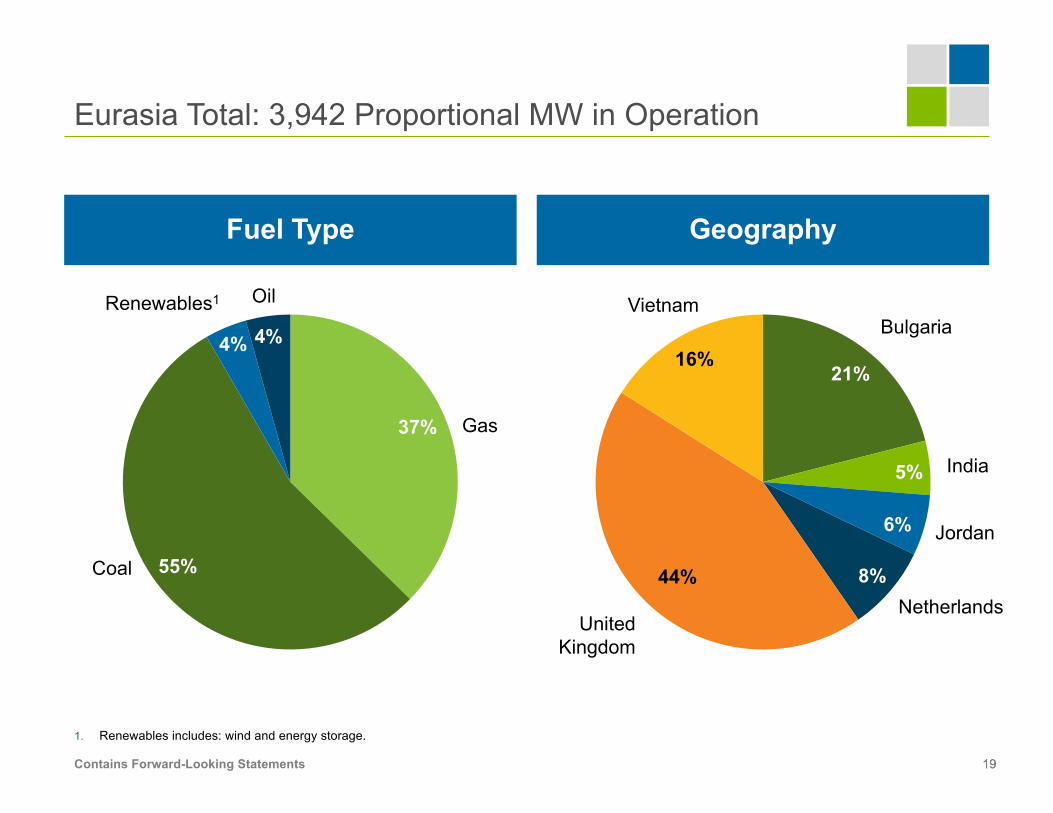
Fuel Type Geography
1. Renewables includes: wind and energy storage.
Eurasia Total: 3,942 Proportional MW in Operation
37%
55%
4% 4%
21%
5%
6%
8%44%
16%
OilRenewables1
Gas
Coal
Bulgaria
Netherlands
Jordan
United Kingdom
India
Vietnam
20Contains Forward-Looking Statements 20
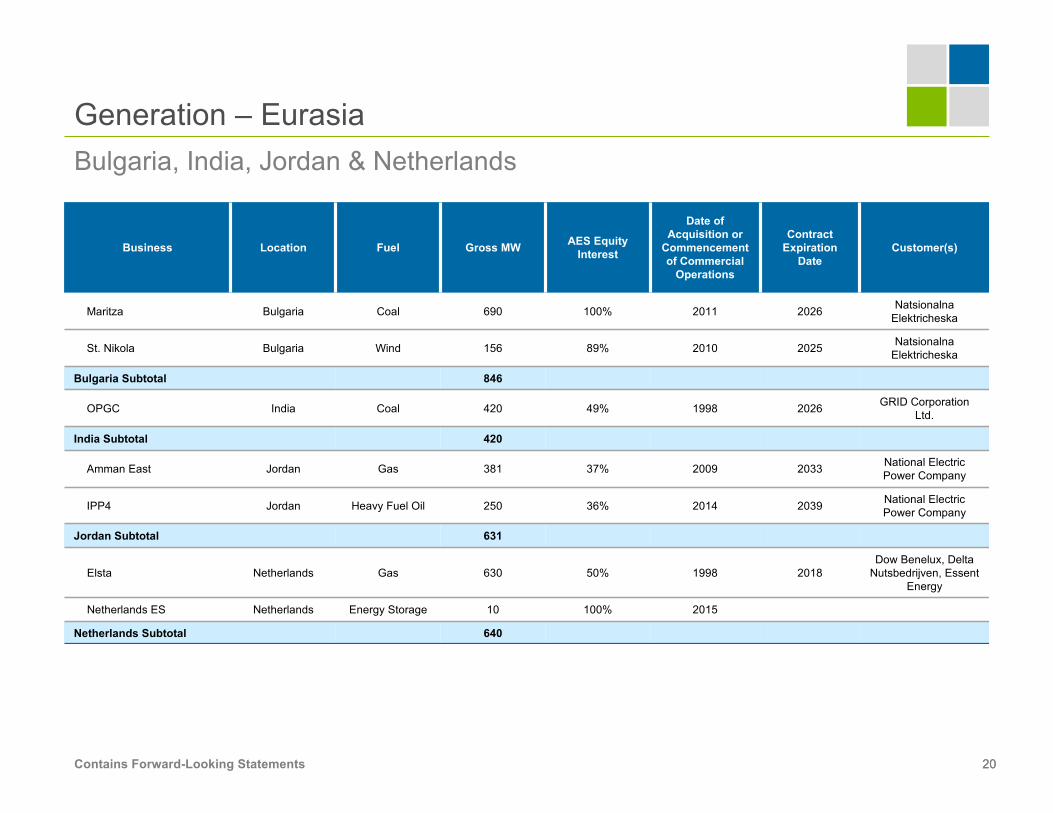
Business Location Fuel Gross MW AES Equity Interest
Date of Acquisition or
Commencement of Commercial
Operations
Contract Expiration
DateCustomer(s)
Maritza Bulgaria Coal 690 100% 2011 2026 Natsionalna Elektricheska
St. Nikola Bulgaria Wind 156 89% 2010 2025 Natsionalna Elektricheska
Bulgaria Subtotal 846
OPGC India Coal 420 49% 1998 2026 GRID Corporation Ltd.
India Subtotal 420
Amman East Jordan Gas 381 37% 2009 2033 National ElectricPower Company
IPP4 Jordan Heavy Fuel Oil 250 36% 2014 2039 National ElectricPower Company
Jordan Subtotal 631
Elsta Netherlands Gas 630 50% 1998 2018Dow Benelux, Delta
Nutsbedrijven, EssentEnergy
Netherlands ES Netherlands Energy Storage 10 100% 2015
Netherlands Subtotal 640
Bulgaria, India, Jordan & NetherlandsGeneration – Eurasia
21Contains Forward-Looking Statements 21
Business Location Fuel Gross MW AES Equity Interest
Date of Acquisition or
Commencement of Commercial
Operations
Contract Expiration
DateCustomer(s)
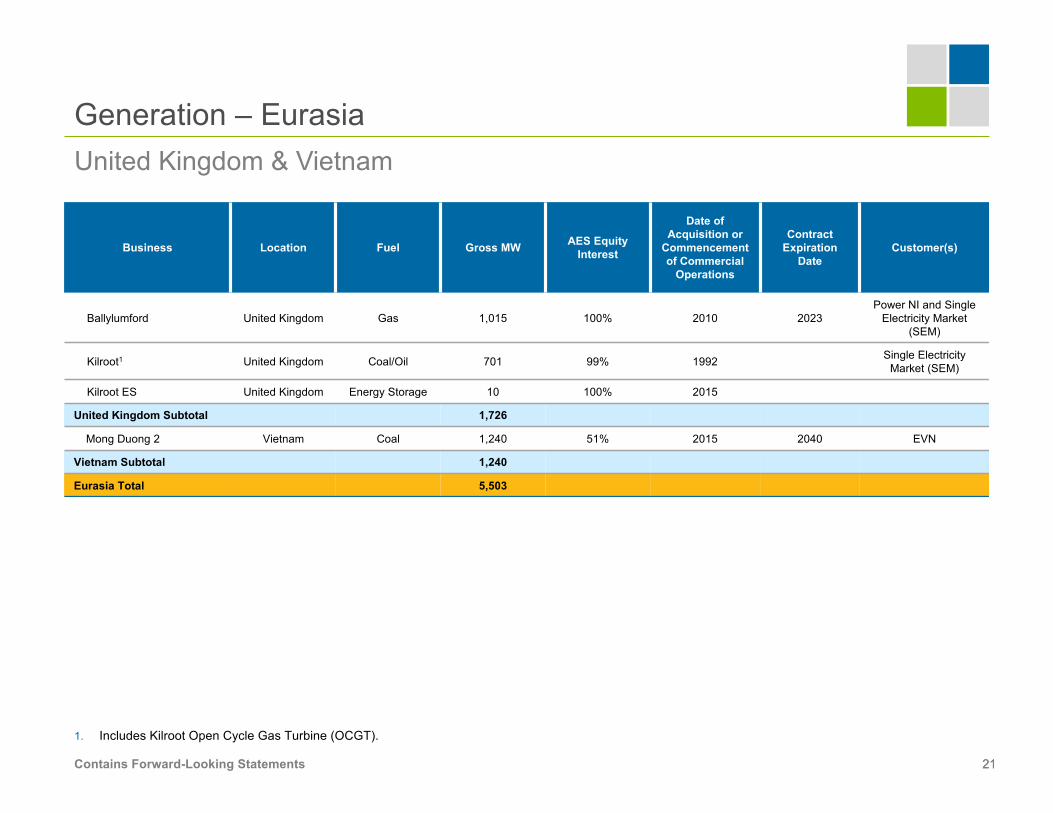
Ballylumford United Kingdom Gas 1,015 100% 2010 2023Power NI and Single
Electricity Market (SEM)
Kilroot1 United Kingdom Coal/Oil 701 99% 1992 Single Electricity Market (SEM)
Kilroot ES United Kingdom Energy Storage 10 100% 2015
United Kingdom Subtotal 1,726
Mong Duong 2 Vietnam Coal 1,240 51% 2015 2040 EVN
Vietnam Subtotal 1,240
Eurasia Total 5,503
United Kingdom & Vietnam
1. Includes Kilroot Open Cycle Gas Turbine (OCGT).
Generation – Eurasia
22Contains Forward-Looking Statements 22
Business Location Fuel Interconnection MW Resource MW1 AES Equity
Interest
Date of Acquisition or Commencement
of Commercial Operations
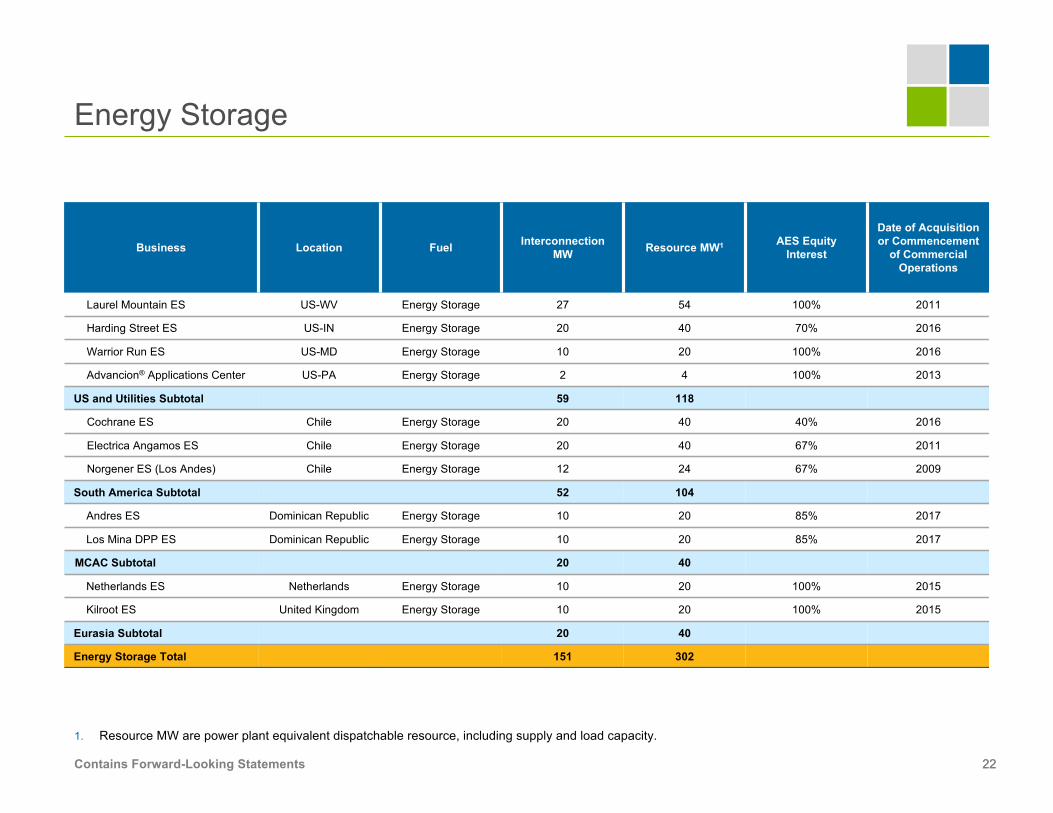
Laurel Mountain ES US-WV Energy Storage 27 54 100% 2011
Harding Street ES US-IN Energy Storage 20 40 70% 2016
Warrior Run ES US-MD Energy Storage 10 20 100% 2016
Advancion® Applications Center US-PA Energy Storage 2 4 100% 2013
US and Utilities Subtotal 59 118
Cochrane ES Chile Energy Storage 20 40 40% 2016
Electrica Angamos ES Chile Energy Storage 20 40 67% 2011
Norgener ES (Los Andes) Chile Energy Storage 12 24 67% 2009
South America Subtotal 52 104
Andres ES Dominican Republic Energy Storage 10 20 85% 2017
Los Mina DPP ES Dominican Republic Energy Storage 10 20 85% 2017
MCAC Subtotal 20 40
Netherlands ES Netherlands Energy Storage 10 20 100% 2015
Kilroot ES United Kingdom Energy Storage 10 20 100% 2015
Eurasia Subtotal 20 40
Energy Storage Total 151 302
1. Resource MW are power plant equivalent dispatchable resource, including supply and load capacity.
Energy Storage
23Contains Forward-Looking Statements 23
Fuel Type Geography
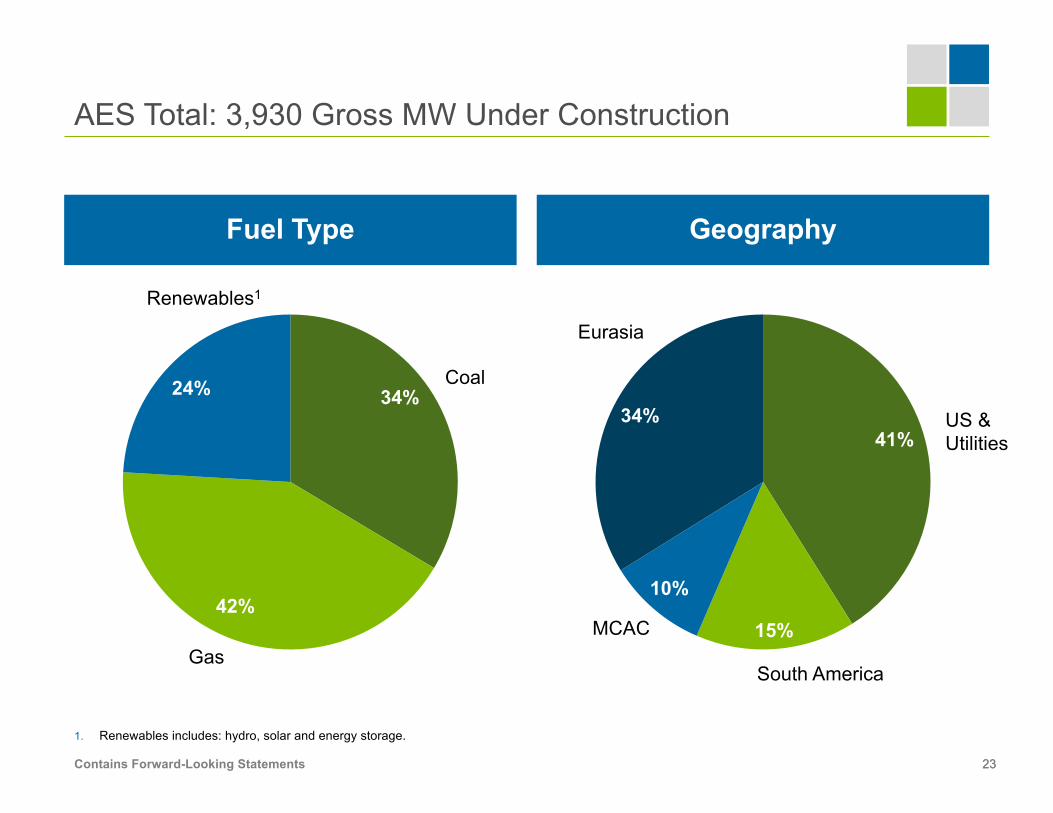
1. Renewables includes: hydro, solar and energy storage.
AES Total: 3,930 Gross MW Under Construction
34%
42%
24%
41%
15%
10%
34%
Renewables1
Coal
Gas
US & Utilities
South America
Eurasia
MCAC
24Contains Forward-Looking Statements 24
Fuel Type Geography
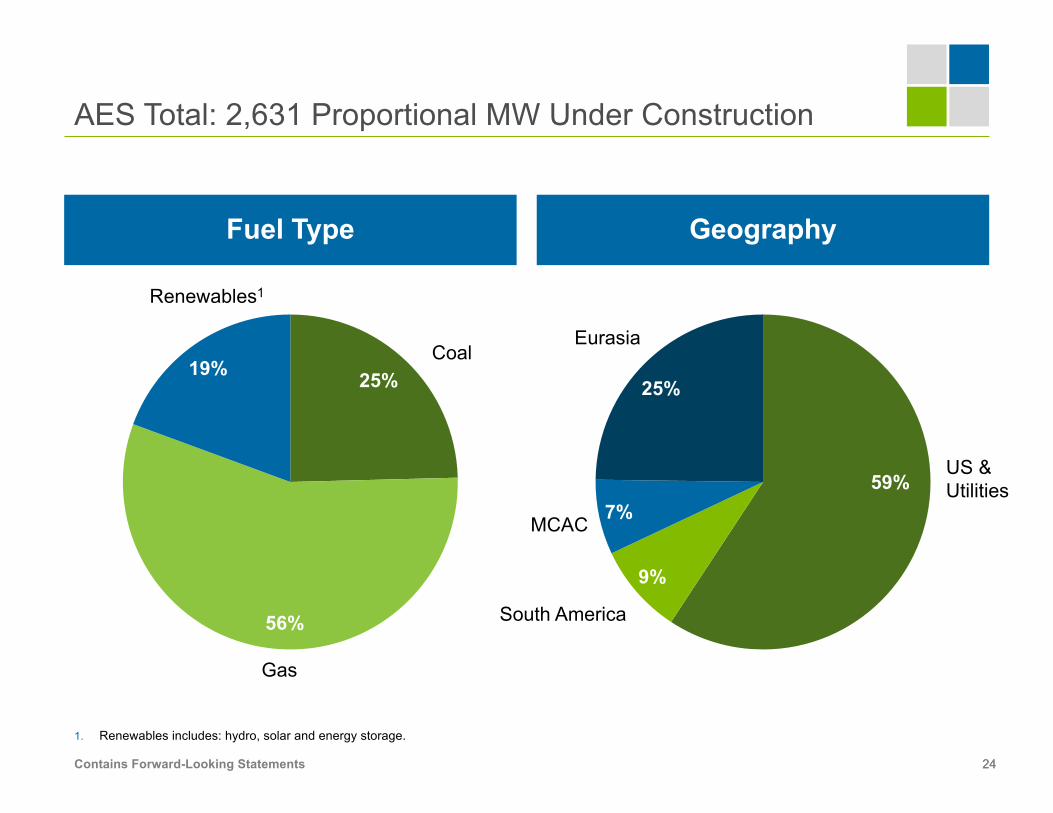
1. Renewables includes: hydro, solar and energy storage.
AES Total: 2,631 Proportional MW Under Construction
25%
56%
19%
59%
9%
7%
25%
Renewables1
Coal
Gas
US &Utilities
South America
Eurasia
MCAC
25Contains Forward-Looking Statements 25
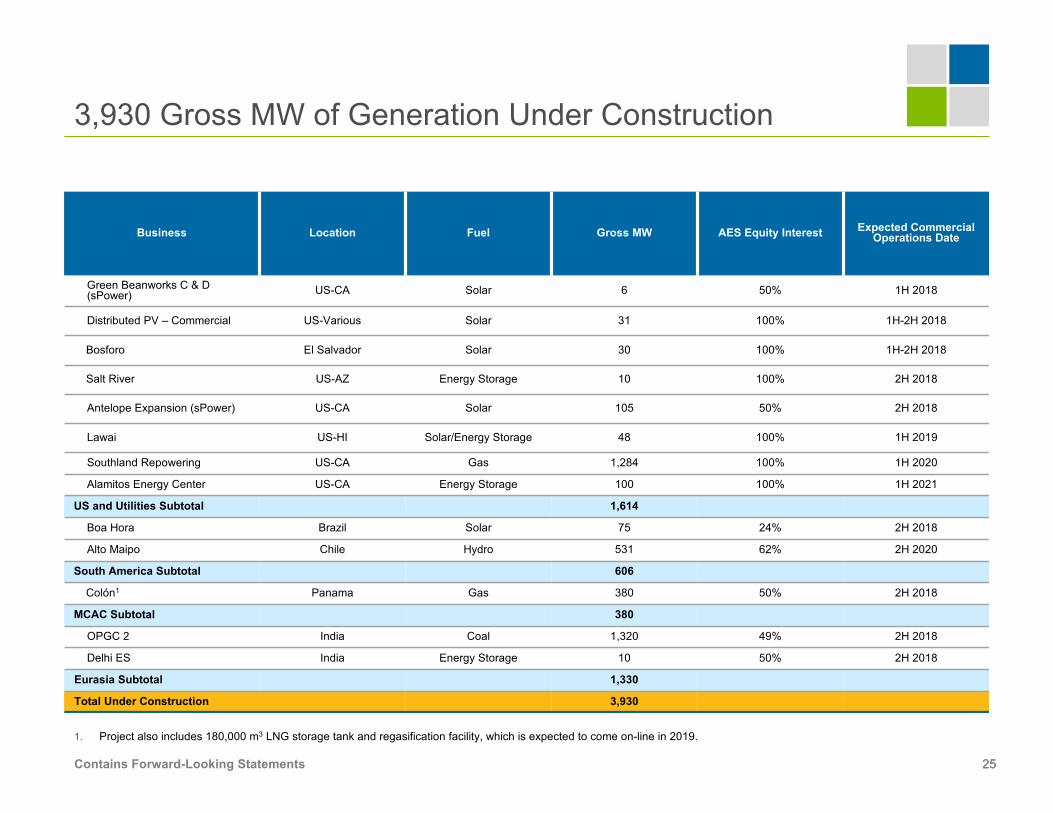
Business Location Fuel Gross MW AES Equity Interest Expected Commercial Operations Date
Green Beanworks C & D (sPower) US-CA Solar 6 50% 1H 2018
Distributed PV – Commercial US-Various Solar 31 100% 1H-2H 2018
Bosforo El Salvador Solar 30 100% 1H-2H 2018
Salt River US-AZ Energy Storage 10 100% 2H 2018
Antelope Expansion (sPower) US-CA Solar 105 50% 2H 2018
Lawai US-HI Solar/Energy Storage 48 100% 1H 2019
Southland Repowering US-CA Gas 1,284 100% 1H 2020
Alamitos Energy Center US-CA Energy Storage 100 100% 1H 2021
US and Utilities Subtotal 1,614
Boa Hora Brazil Solar 75 24% 2H 2018
Alto Maipo Chile Hydro 531 62% 2H 2020
South America Subtotal 606
Colón1 Panama Gas 380 50% 2H 2018
MCAC Subtotal 380
OPGC 2 India Coal 1,320 49% 2H 2018
Delhi ES India Energy Storage 10 50% 2H 2018
Eurasia Subtotal 1,330
Total Under Construction 3,930
1. Project also includes 180,000 m3 LNG storage tank and regasification facility, which is expected to come on-line in 2019.
3,930 Gross MW of Generation Under Construction
26Contains Forward-Looking Statements 26
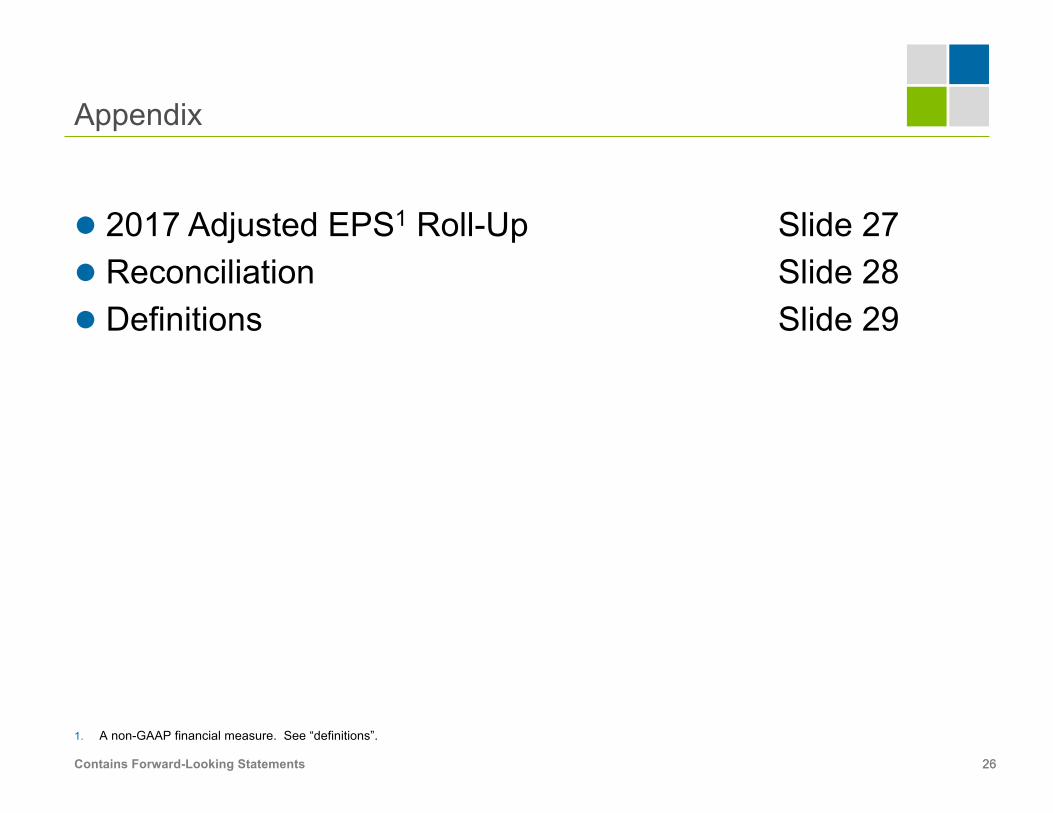
l 2017 Adjusted EPS1 Roll-Up Slide 27l Reconciliation Slide 28l Definitions Slide 29
1. A non-GAAP financial measure. See “definitions”.
Appendix
27Contains Forward-Looking Statements 27
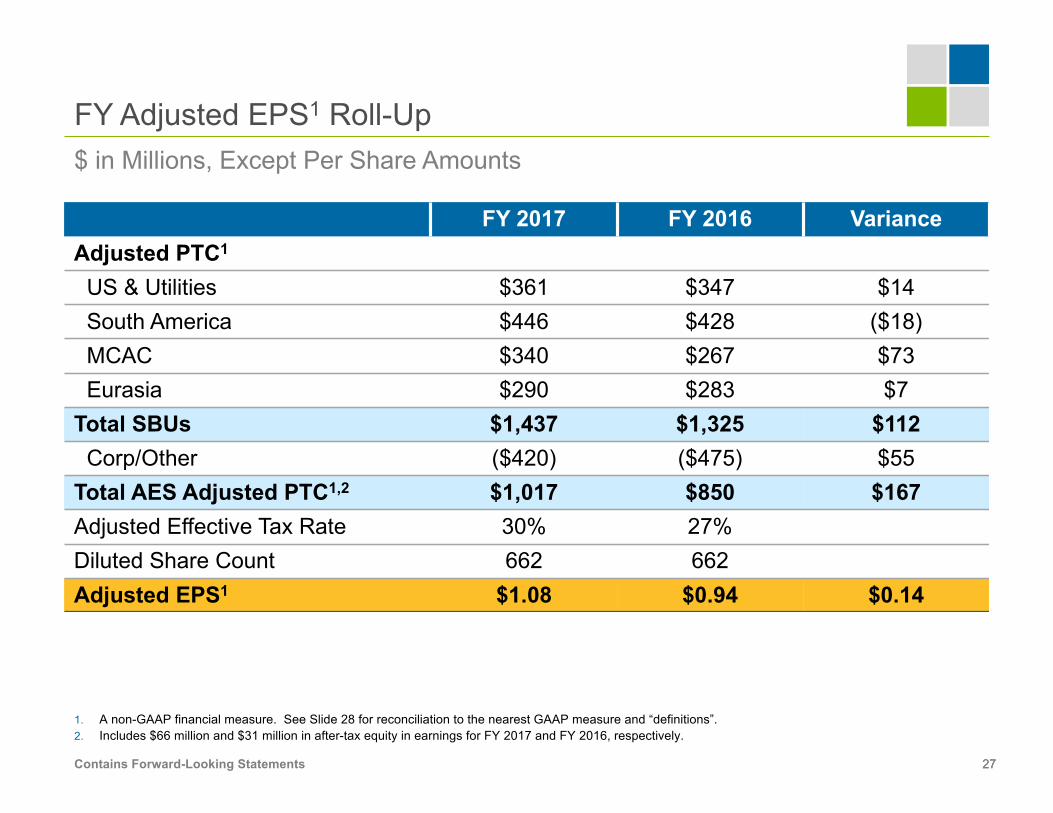
FY 2017 FY 2016 VarianceAdjusted PTC1
US & Utilities $361 $347 $14
South America $446 $428 ($18)
MCAC $340 $267 $73
Eurasia $290 $283 $7
Total SBUs $1,437 $1,325 $112Corp/Other ($420) ($475) $55
Total AES Adjusted PTC1,2 $1,017 $850 $167Adjusted Effective Tax Rate 30% 27%
Diluted Share Count 662 662
Adjusted EPS1 $1.08 $0.94 $0.14
$ in Millions, Except Per Share Amounts
1. A non-GAAP financial measure. See Slide 28 for reconciliation to the nearest GAAP measure and “definitions”.
2. Includes $66 million and $31 million in after-tax equity in earnings for FY 2017 and FY 2016, respectively.
FY Adjusted EPS1 Roll-Up
28Contains Forward-Looking Statements 28
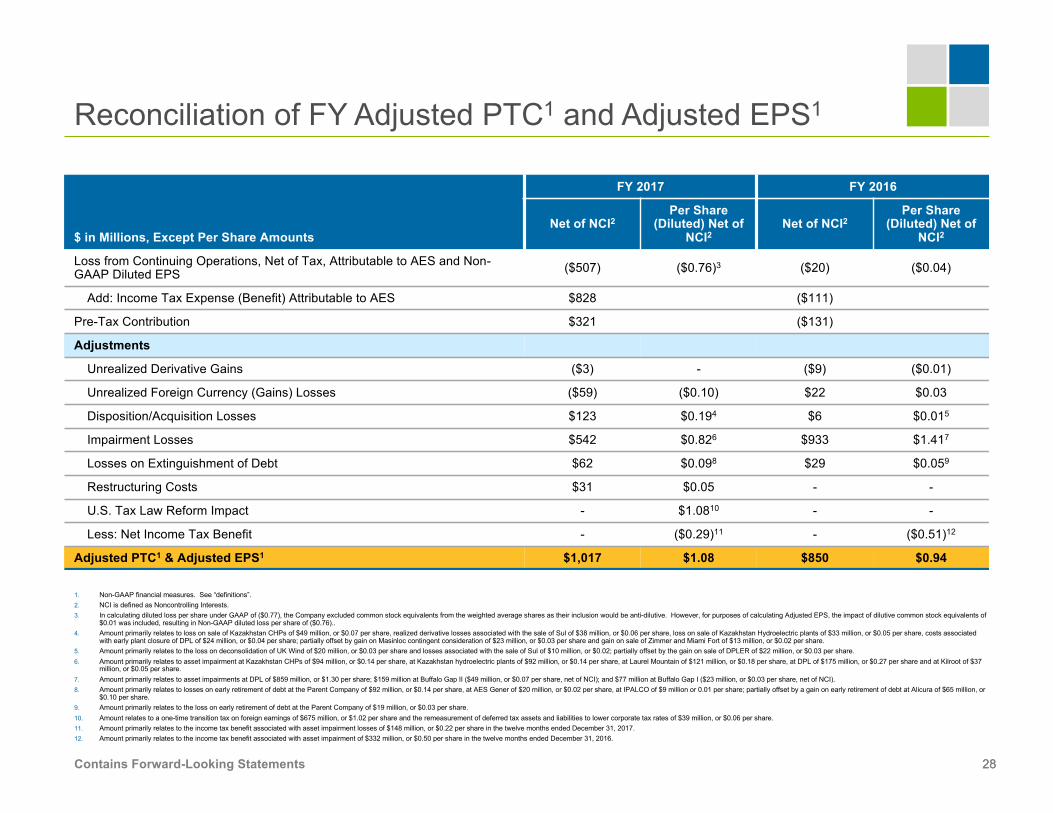
$ in Millions, Except Per Share Amounts
FY 2017 FY 2016
Net of NCI2Per Share
(Diluted) Net of
NCI2Net of NCI2
Per Share
(Diluted) Net of
NCI2
Loss from Continuing Operations, Net of Tax, Attributable to AES and Non-
GAAP Diluted EPS($507) ($0.76)3 ($20) ($0.04)
Add: Income Tax Expense (Benefit) Attributable to AES $828 ($111)
Pre-Tax Contribution $321 ($131)
Adjustments
Unrealized Derivative Gains ($3) - ($9) ($0.01)
Unrealized Foreign Currency (Gains) Losses ($59) ($0.10) $22 $0.03
Disposition/Acquisition Losses $123 $0.194 $6 $0.015
Impairment Losses $542 $0.826 $933 $1.417
Losses on Extinguishment of Debt $62 $0.098 $29 $0.059
Restructuring Costs $31 $0.05 - -
U.S. Tax Law Reform Impact - $1.0810 - -
Less: Net Income Tax Benefit - ($0.29)11 - ($0.51)12
Adjusted PTC1 & Adjusted EPS1 $1,017 $1.08 $850 $0.94
1. Non-GAAP financial measures. See “definitions”.
2. NCI is defined as Noncontrolling Interests.
3. In calculating diluted loss per share under GAAP of ($0.77), the Company excluded common stock equivalents from the weighted average shares as their inclusion would be anti-dilutive. However, for purposes of calculating Adjusted EPS, the impact of dilutive common stock equivalents of
$0.01 was included, resulting in Non-GAAP diluted loss per share of ($0.76)..
4. Amount primarily relates to loss on sale of Kazakhstan CHPs of $49 million, or $0.07 per share, realized derivative losses associated with the sale of Sul of $38 million, or $0.06 per share, loss on sale of Kazakhstan Hydroelectric plants of $33 million, or $0.05 per share, costs associated
with early plant closure of DPL of $24 million, or $0.04 per share; partially offset by gain on Masinloc contingent consideration of $23 million, or $0.03 per share and gain on sale of Zimmer and Miami Fort of $13 million, or $0.02 per share.
5. Amount primarily relates to the loss on deconsolidation of UK Wind of $20 million, or $0.03 per share and losses associated with the sale of Sul of $10 million, or $0.02; partially offset by the gain on sale of DPLER of $22 million, or $0.03 per share.
6. Amount primarily relates to asset impairment at Kazakhstan CHPs of $94 million, or $0.14 per share, at Kazakhstan hydroelectric plants of $92 million, or $0.14 per share, at Laurel Mountain of $121 million, or $0.18 per share, at DPL of $175 million, or $0.27 per share and at Kilroot of $37
million, or $0.05 per share.
7. Amount primarily relates to asset impairments at DPL of $859 million, or $1.30 per share; $159 million at Buffalo Gap II ($49 million, or $0.07 per share, net of NCI); and $77 million at Buffalo Gap I ($23 million, or $0.03 per share, net of NCI).
8. Amount primarily relates to losses on early retirement of debt at the Parent Company of $92 million, or $0.14 per share, at AES Gener of $20 million, or $0.02 per share, at IPALCO of $9 million or 0.01 per share; partially offset by a gain on early retirement of debt at Alicura of $65 million, or
$0.10 per share.
9. Amount primarily relates to the loss on early retirement of debt at the Parent Company of $19 million, or $0.03 per share.
10. Amount relates to a one-time transition tax on foreign earnings of $675 million, or $1.02 per share and the remeasurement of deferred tax assets and liabilities to lower corporate tax rates of $39 million, or $0.06 per share.
11. Amount primarily relates to the income tax benefit associated with asset impairment losses of $148 million, or $0.22 per share in the twelve months ended December 31, 2017.
12. Amount primarily relates to the income tax benefit associated with asset impairment of $332 million, or $0.50 per share in the twelve months ended December 31, 2016.
Reconciliation of FY Adjusted PTC1 and Adjusted EPS1
29Contains Forward-Looking Statements 29
l Adjusted Earnings Per Share, a non-GAAP financial measure, is defined as diluted earnings per share from continuing operations excluding gains or losses of both consolidated entities and entities accounted for under the equity method due to (a) unrealized gains or losses related to derivative transactions, (b) unrealized foreign currency gains or losses, (c) gains or losses and associated benefits and costs due to dispositions and acquisitions of business interests, including early plant closures, and the tax impact from the repatriation of sales proceeds, (d) losses due to impairments, (e) gains, losses and costs due to the early retirement of debt, (f) costs directly associated with a major restructuring program, including, but not limited to, workforce reduction efforts, relocations, and office consolidation; and (g) tax benefit or expense related to the enactment effects of 2017 U.S. tax law reform. The GAAP measure most comparable to Adjusted EPS is diluted earnings per share from continuing operations. We believe that Adjusted EPS better reflects the underlying business performance of the Company and is considered in the Company’s internal evaluation of financial performance. Factors in this determination include the variability due to unrealized gains or losses related to derivative transactions, unrealized foreign currency gains or losses, losses due to impairments and strategic decisions to dispose of or acquire business interests, retire debt or implement restructuring initiatives, which affect results in a given period or periods. Adjusted EPS should not be construed as an alternative to diluted earnings per share from continuing operations, which is determined in accordance with GAAP. For the year ending December 31, 2017, the definition was revised to exclude associated benefits and costs due to acquisitions, dispositions and early plant closures, including the tax impact of decisions made at the time of sale to repatriate proceeds; costs directly associated with a major restructuring program, including, but not limited to, workforce reduction efforts, relocations, and office consolidation; and tax benefit or expense related to the enactment effects of 2017 U.S. tax law reform.
l Adjusted Pre-Tax Contribution, a non-GAAP financial measure, is defined as pre-tax income from continuing operations attributable to AES excluding gains or losses of the consolidated entity due to (a) unrealized gains or losses related to derivative transactions, (b) unrealized foreign currency gains or losses, (c) gains or losses and associated benefits and costs due to dispositions and acquisitions of business interests, including early plant closures, (d) losses due to impairments, (e) gains, losses and costs due to the early retirement of debt, and (f) costs directly associated with a major restructuring program, including, but not limited to, workforce reduction efforts, relocations, and office consolidation. Adjusted PTC also includes net equity in earnings of affiliates on an after-tax basis adjusted for the same gains or losses excluded from consolidated entities. The GAAP measure most comparable to Adjusted PTC is income from continuing operations attributable to AES. We believe that Adjusted PTC better reflects the underlying business performance of the Company and is considered in theCompany’s internal evaluation of financial performance. Factors in this determination include the variability due to unrealized gains or losses related to derivative transactions, unrealized foreign currency gains or losses, losses due to impairments and strategic decisions to dispose of or acquire business interests, retire debt or implement restructuring initiatives, which affect results in a given period or periods. In addition, for Adjusted PTC, earnings before tax represents the business performance of the Company before the application of statutory income tax rates and tax adjustments, including the effects of tax planning, corresponding to the various jurisdictions in which the Company operates. Adjusted PTC should not be construed as an alternative to income from continuing operations attributable to AES, which is determined in accordance with GAAP. For the year ending December 31, 2017, the definition was revised to exclude associated benefits and costs due to dispositions and acquisitions of business interests, including early plant closures, and costs directly associated with a major restructuring program, including, but not limited to, workforce reduction efforts, relocations, and office consolidation.
Definitions


