Page 1
The Emerging Middle Class in Pakistan: How it Consumes, Earns, and Saves
Dr. Jawaid Abdul Ghani Professor, Strategy and Marketing Research,
Karachi School of Business and Leadership
[email protected]
Introduction
During the first decade of the twenty first century, and for the first time in the history of
Pakistan, over half of the households in the country belonged to the middle class (M-class).
During this period (2002-2011) the M-class, defined as households with daily per capita
expenditures of $2-$10 in 2005 purchasing power parity dollars1, grew from 32 percent to 55
percent of all households in the country, and the number of people in this class doubled from 38
million to 84 million. Real aggregate national consumption increased by about $60 billion, of
which $55 billion was accounted for by the increase in consumption of the M-class. As a result
90 percent of the increase in national consumption during this decade came from the increase in
consumption of the M-class2. It is not surprising that the Asian Development Bank listed
Pakistan as among the top five countries3 in the Asia Pacific region with the fastest growing M-
class during 1990-2008 (Chun 2010).
What characterizes the M-class? Bannerjee and Duflo (2008) suggest that holding a relatively
secure job is the single most important characteristic of the M-class. Individuals with higher
levels of “permanent income” are less vulnerable to economic shocks, have lower discount rates
for future rewards and thus invest more in health, education, and other “rent generating”
credentials. Professionals and others in the “service class” with large amounts of human capital
and stable employment relationships are considered the most likely to invest in securing their
own and children‟s future. Indeed, according to Sorenson (2000) it is the level of uncertainty in
“lifetime wealth” and resulting living conditions which result in differences among social
classes4. M-class values are described as optimism and confidence regarding the future, a
preference for moderation and stability, a willingness to pay a little extra for quality, the “ability
to defer gratification”, and income often based on specialized skills. As a result the M-class has
the “base amount of income to invest in productive activities that contribute to economy-wide
Page 2
welfare” (Chun 2010), and is more likely to accumulate human capital and savings, and more
inclined towards entrepreneurship (Lopez 2012, Meyer 2012).
The M-class is thus characterized by an income stream which is both sufficiently high and
certain. A study of the M-class requires an understanding of income streams, in particular what
percentage is derived from relatively secure returns from physical investments such as urban or
agricultural properties, from businesses, or from human skills valued by local labor markets, or
in the case of international remittances valued by relevant global labor markets. Hence it is
necessary to study both the sources of income5 and also the portfolio of physical and human
assets from which these income streams are derived. Since income streams are also sensitive to
macro-economic shocks, it is also useful to consider the impact of relevant events in the national
and global economy, on consumer confidence and consumption behavior.
The M-class is ultimately characterized by its pattern of consumption, in particular by
expenditures on less essential and “positional” goods, and also by expenditures on long-term
human and physical assets. Less essential goods as those on which share of household budget
have upward-sloping Engel curves, while essential goods have downward-sloping Engel curves6.
Rising incomes result in greater consumption of less essential goods. Thus as households enter
the M-class, it is expected that their consumption will shift from essential to less essential goods.
Among these less essential goods are “positional” goods such as jewelry which are used to signal
one‟s status in society. Expenditures on positional goods are found to vary depending on
consumers‟ beliefs about how much others are spending on these goods, and are found to be
more sensitive to economic shocks such as during recessions or high inflation. This is because in
times of economic recession, consumers in all economic classes tend to reduce consumption of
positional goods, and thus the relative status remains the same with lower expenditures in each
class (Kamakura 2012). Since consumption of positional goods may be used to signal one‟s
status in society, an understanding of social class and its determinants can assist in understanding
consumption patterns. In studies where M-class is defined primarily in terms of economic well-
being as is the case in this paper, social class may be used to explain variations in consumption
patterns within this income-based M-class, or to suggest differences in motivation behind a
particular consumption pattern.
Page 3
Why is the emergence of the M-class so significant? The reason lies not just in the impact of a
large M-class on national consumption and on continued economic growth and stability, but the
expected role of the Asian M-class in the global economy. A large and stable M-class is claimed
to induce economic growth7, and is considered as “the backbone of both the market economy and
of democracy in most advanced societies” (Easterly 2001, Birdsall et al. 2000, Ravaillion
2009).Furthermore the M-class plays an important role in the global economy.It is estimated that
the American M-class is responsible for about sixty percent of U.S. private spending and is an
important driver of the global economy8. However there is now a fear that the current global
financial crisis may result in a “retrenchment of the American consumer”, and thus a long-term
void in global demand (Kharas and Gertz 2010b, Bannerjee and Duflo 2008, PEW 2008).
It is in this context, that the growth of the Asian M-class has become important and the subject of
considerable debate. Kharas and Gertz (2010) estimate that several Asian countries have reached
a tipping point where large numbers of people will enter the M-class, and that by 2015, for the
first time in three hundred years the number of Asian M-class consumers will equal the number
in Europe and North America9. They predict that the emerging M-class in China and other
populous Asian countries will drive future global consumption, replacing the shortfall created by
the decreased spending of the American consumer. The impact of the emerging Asian M-class is
already considerable, as can be seen for instance by changes in global automobile sales. In 2001
China represented barely 1 percent of global automobile sales while the U.S. represented 37
percent. By 2009, Chinese automobile sales were 13.6 million vehicles compared to 10.4 million
in the U.S., and the Chinese M-class was the second largest in the world, only after the United
States (Kharas and Gertz 2010).
Pakistan has now reached this tipping point where large numbers of households are entering the
M-class. Several questions may be asked regarding these M-class households. What is their
profile in terms of family composition, education, and sources of income? How do they
distribute their spending, and their wealth? What durables do they own? How different is the
rural M-class from the urban M-class? How distinct is the M-class from other classes, and is it
useful to distinguish between say a lower and an upper M-class household? How does Pakistan‟s
Page 4
M-class compare with others in South Asia, particularly with India and Bangladesh in terms of
size and consumption behavior? And finally what predictions can be made regarding Pakistan‟s
M-class in the year 2020, and which industries might most benefit from the new spending power
of this class in the years to come? This paper is a modest attempt to answer some of these
questions, and to define a program of research to address those that remain.
Data and Methodology
The main source of data is an analysis of various rounds of Pakistan Social and Living Standards
Measurement Survey (PSLM) conducted by Pakistan‟s Federal Bureau of Statistics. The surveys
are typically conducted every two years, and involve a sample size of about 16 thousand
households. LSM surveys are conducted with the support of the World Bank in over a hundred
countries, and are considered a source of highly reliable data10
. LSM is widely used for
computing national statistics including inequality, poverty, and for studying household behavior
(Banerjee and Duflo 2008).
The measure used in this paper for determining the economic class of each household is based on
total imputed annual household expenditures. This is an absolute measure11
, which allows for
comparisons to be made across countries and over time. The standard used is that suggested by
Bannerjee and Duflo (2008), and close to that followed by Chun (2010), and Ravaillion (2009).
The M-class is defined as households with daily per capita expenditures of $2-$10 measured in
terms of 2005 purchasing power parity dollars12
. The choice of using expenditures rather than
income is based on the general consensus among researchers regarding the difficulty of
collecting reliable income data from household surveys. Problems with income data include
seasonality, hidden income generated through wages in kind, multiple earners in a household,
and purchases through credit (Banerjee and Duflo 2007, Shukla 2010, Deaton and Kozel 2004).
As a result classifications based on expenditures are considered to provide greater accuracy and
allow comparisons across studies13
. Finally the choice of using imputed rather than cash
expenditures is once again based on generally accepted practice, particularly to allow for a fair
assessment taking into account non-cash consumption, and to correct for often larger imputed
food expenditures in rural areas and larger imputed house rental expenditures in urban areas14
.
Page 5
The middle class is further classified into a lower middle class (LMC) and an upper middle class
(UMC), defined as households with $2-$4 and $4-$10 (measured in terms of 2005$PPP as
discussed above). As households approach the $2 threshold the amount spent on essential foods
falls to just under 50 percent. As households cross the $4 threshold and move into UMC, the
percentage of household budget spent on essential foods, drops down to 32 percent.
Changes during 2001-2011
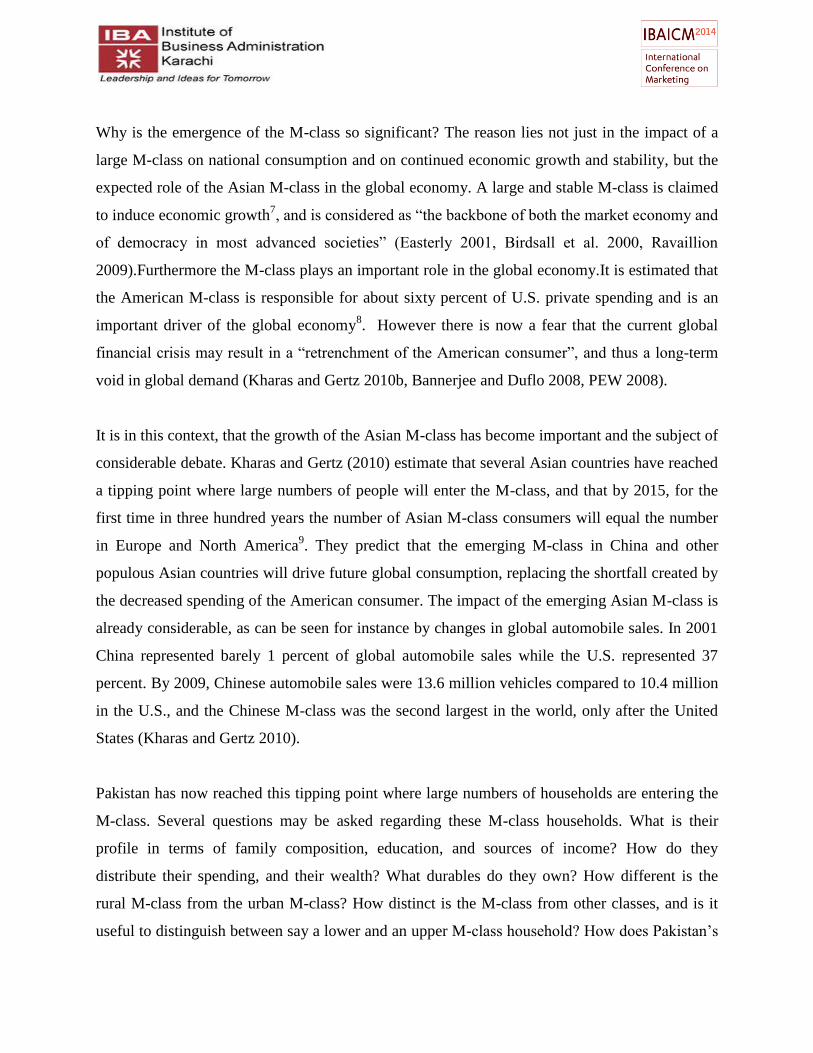
Figure 1 shows the cumulative percent of the population with consumption below the threshold
figure on the x-axis, for 2002 and 2011. The percent of households with daily per capita
expenditure under $2 dropped from 67 percent in 2002 to 44 percent in 2011, and the M-class
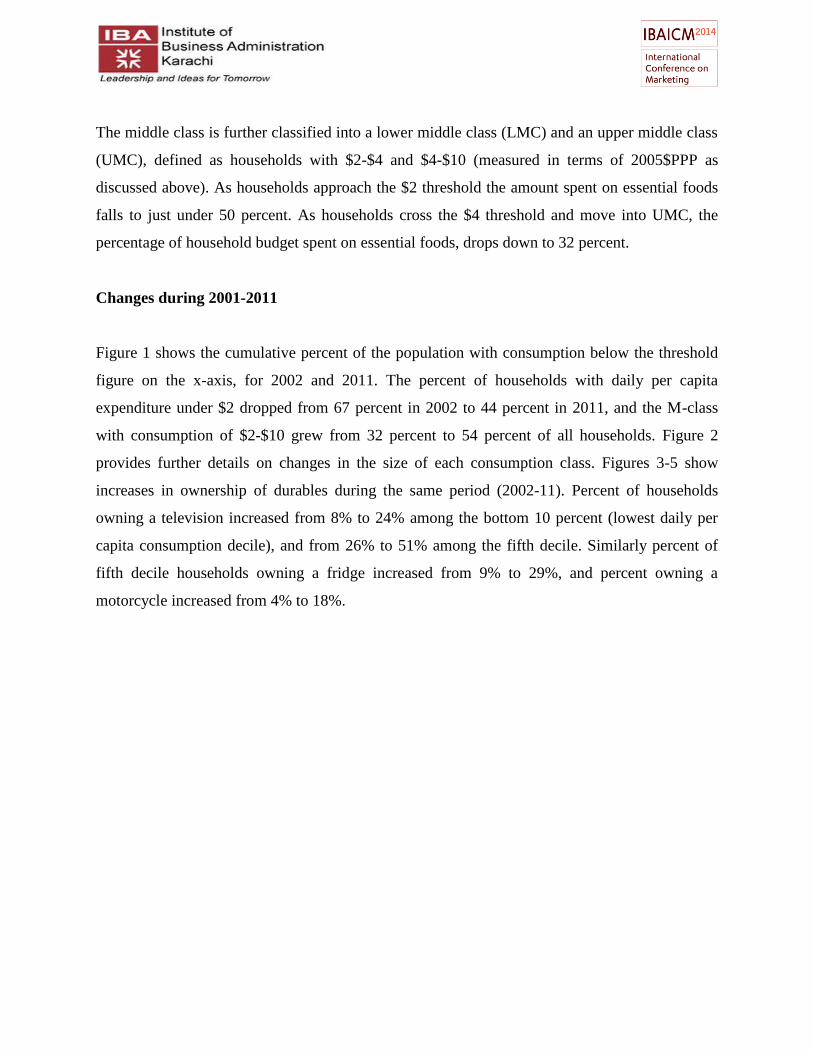
with consumption of $2-$10 grew from 32 percent to 54 percent of all households. Figure 2
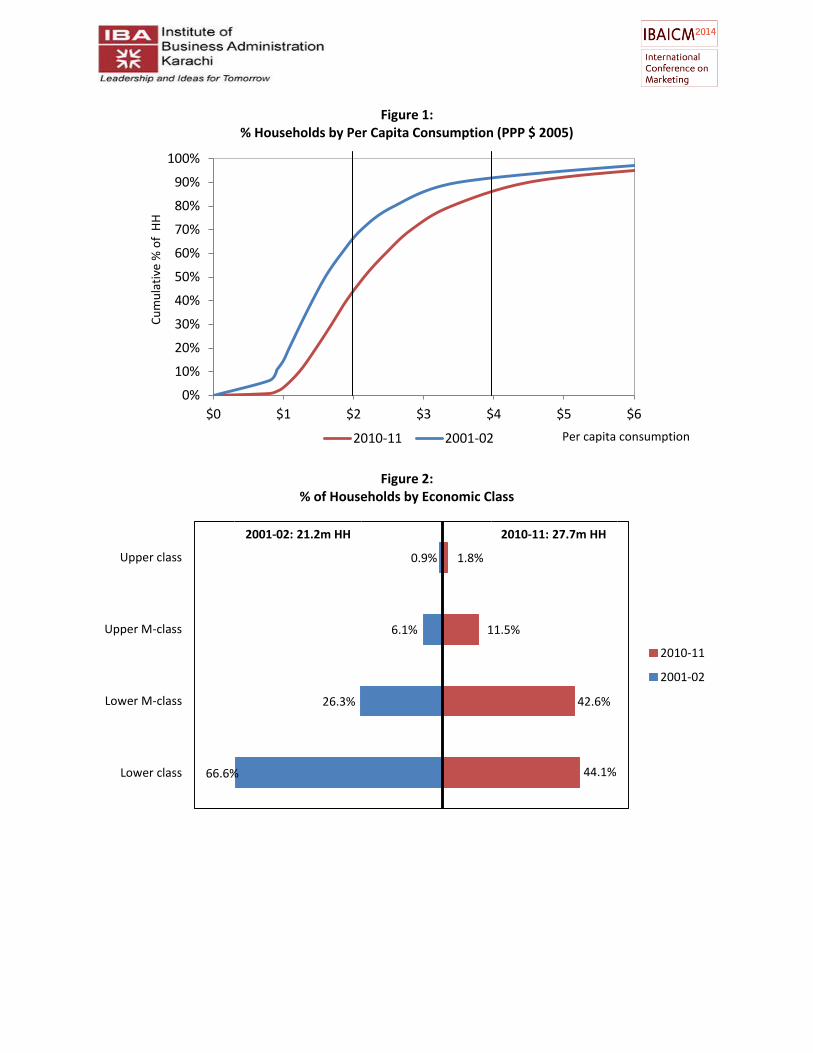
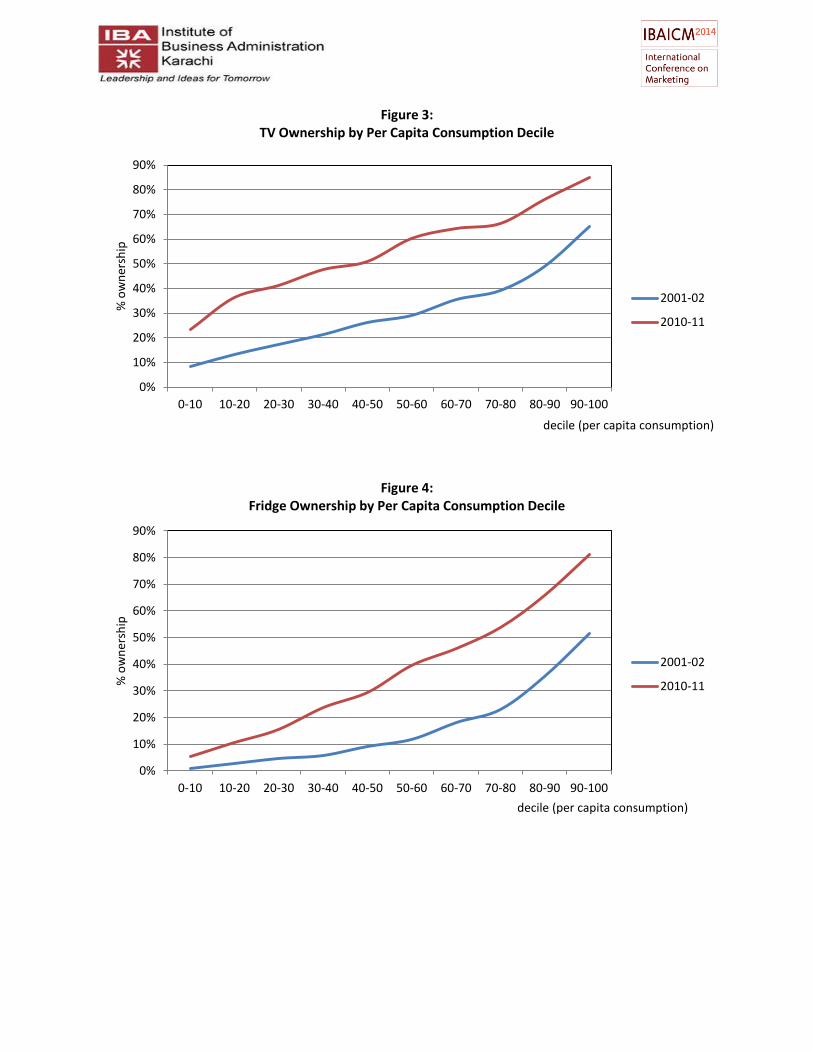
provides further details on changes in the size of each consumption class. Figures 3-5 show
increases in ownership of durables during the same period (2002-11). Percent of households
owning a television increased from 8% to 24% among the bottom 10 percent (lowest daily per
capita consumption decile), and from 26% to 51% among the fifth decile. Similarly percent of
fifth decile households owning a fridge increased from 9% to 29%, and percent owning a
motorcycle increased from 4% to 18%.
Page 6
0%
10%
20%
30%
40%
50%
60%
70%
80%
90%
100%
$0 $1 $2 $3 $4 $5 $6
Cu
mu
lati
ve %
of
HH
Per capita consumption
Figure 1: % Households by Per Capita Consumption (PPP $ 2005)
2010-11 2001-02
44.1%
42.6%
11.5%
1.8%
66.6%
26.3%
6.1%
0.9%
Lower class
Lower M-class
Upper M-class
Upper class
Figure 2: % of Households by Economic Class
2010-11
2001-02
2001-02: 21.2m HH 2010-11: 27.7m HH
Page 7
0%
10%
20%
30%
40%
50%
60%
70%
80%
90%
0-10 10-20 20-30 30-40 40-50 50-60 60-70 70-80 80-90 90-100
% o
wn
ersh
ip
decile (per capita consumption)
Figure 3: TV Ownership by Per Capita Consumption Decile
2001-02
2010-11
0%
10%
20%
30%
40%
50%
60%
70%
80%
90%
0-10 10-20 20-30 30-40 40-50 50-60 60-70 70-80 80-90 90-100
% o
wn
ersh
ip
decile (per capita consumption)
Figure 4: Fridge Ownership by Per Capita Consumption Decile
2001-02
2010-11
Page 8
Table 1 shows that aggregate consumption15
increased from $98 billion to $158 billion during
2002-11, while aggregate spending grew from $71 billion to $120 billion, aggregate income
grew from $85 billion to $152 billion, and total assets grew from $387 billion to $773 billion.
During the same period M-class consumption increased from $43 billion to $98 billion, and
wealth from $208 billion to $523 billion. As a resultnot only did the absolute size, consumption,
and wealth of the M-class more than double during the period 2002-11, but 90 percent of the
increase in national consumption and 80 percent of the increase in wealth in the country could be
accounted for by changes in this class. In the next sections we will examine how these 15 million
M-class households representing about 84 million individuals, consume $98 billion of goods and
services, earn their income, and invest their $523 billion worth of assets.
Table 1:
National Household Aggregates
($ billions in 2005 $ PPP)
All Pk All Pk M-class M-class
2001-02 2010-11 2001-02 2010-11
Consumption 97.6 158.3 43.3 98.0
Cash Spending 71.5 120.2 31.9 74.2
Income 85.0 151.6 38.2 96.5
Assets 387.2 772.6 208.1 522.6
0%
10%
20%
30%
40%
50%
60%
0-10 10-20 20-30 30-40 40-50 50-60 60-70 70-80 80-90 90-100
% o
wn
ersh
ip
decile (per capita consumption)
Figure 5: Motorcycle Ownership by Per Capita Consumption Decile
2001-02
2010-11
Page 9
M-Class: An Overview
How does the M-class differ from the lower class (LC)? Household expenditures are typically
about 60% higher while income is 80% higher, and wealth is over three times higher. Daily per
capita consumption is 120% higher due to the smaller household size of the M-class compared
with the LC (5.6 vs. 7.5 members). M-class households spend less of their budget on essential
foods (40% vs. 53%), and twice as much on education and durables. Education levels are higher
with five times more households having an individual with some college education (21% vs.
4%). Households also have more amenities including twice as many houses with running
tapwater, flush system, and natural gas. A key distinction lies in the ownership of a refrigerator
(53% vs. 15%), a washing machine (57% vs. 25%), and a motorcycle (35% vs. 10%). There are
also differences in occupation, with more than twice as many (28% vs. 12%) professionals,
businessmen and shopkeepers among the M-class compared to the LC.
The M-class is not homogeneous. There are significant differences between urban and rural M-
class households, in terms of income streams and consumption patterns. At the same time there
are significant differences between the upper and lower M-class.As household cross the $4 daily
per capita consumption threshold the share of household budget spent on essential foods drops
from 43% to 32%, resulting in a change in expenditure patterns. In the following sections we
focus primarily on the urban upper M-class in terms of household characteristics, consumption
patterns, income streams and assets, and contrast these households with the rural and the lower
M-class.
Household Characteristics
The upper M-class (UMC) consists of 3.2 million households (20% of the M-class). Two million
of these UMC households live in urban areas. Urban UMC expenditures are about 50 percent
higher than that of urban LMC, while incomes are 68 percent higher. Total assets of UMC are
about ten times annual cash expenditures, thus providing a cushion against economic shocks, and
the confidence to invest in physical and human assets. The LMC on the other hand, while having
crossed the poverty threshold, nevertheless remain vulnerable to economic shocks, with assets
Page 10
only about 5.5 times annual cash expenditures. Note that owned house represents about 70
percent of assets of the urban M-class, the value of which averages $48,600 and $20,600 for the
urban UMC and LMC respectively (in 2005$PPP). The difference in absolute value of assets of
the urban UMC and LMC, and also their asset to expenditure ratios, is indicative of the relative
vulnerability of these two classes, and results in differences in consumption patterns as will be
discussed below.
The typical urban upper M-class household is headed by a male aged about 48 years old, with
slightly over ten years of education, a family size of 4.8, with 1.4 children aged 16 or younger.
Over 30 percent of UMC households have at least one individual with some college education16
.
This contrasts with LMC households which are larger (family size of 6.1, with 2.2 children), and
less educated (head has 7 years of education, and only 24 percent with college education). Rural
M-class households are somewhat smaller, and less educated (UMC and LMC college education
is 24% and 10%, and household head education is about 6 and 5 years, respectively).
Over 75% of urban UMC live in their own house, and 73 percent have a flush toilet. The typical
house has 3.1 rooms, thus averaging about 1.5 persons per room. Compared to UMC, urban
LMC houses are significantly smaller (2.5 persons per room). M-class rural houses are about the
same size as in urban areas, house ownership is more common (93%), but rarely have a flush
system (less than 5%).
Consumption Patterns
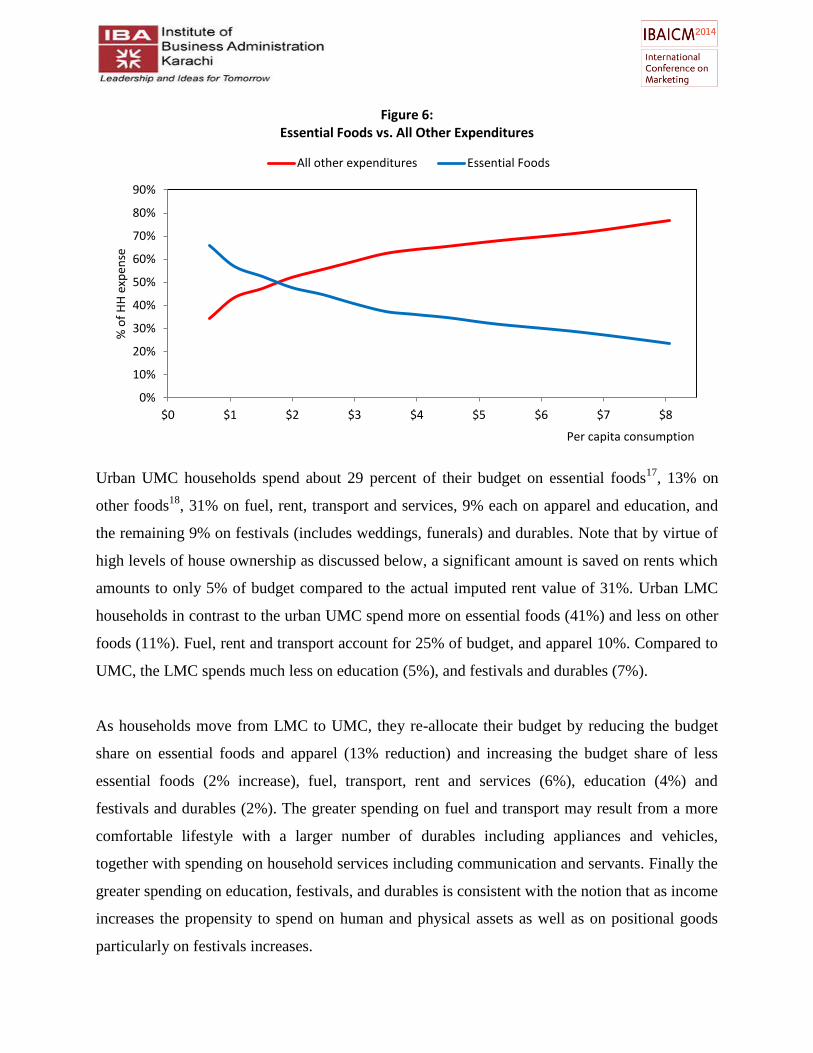
Figure 6 shows how expenditures on different goods as a percentage of total cash expenditures
changes as overall household consumption increases. The graphs, referred to as Engel curves, are
downward sloping for essential goods, and upward sloping for less essential goods. The share of
budget on most food items decreases with increasing affluence, while it increases for less
essential food items.
Page 11
Urban UMC households spend about 29 percent of their budget on essential foods17
, 13% on
other foods18
, 31% on fuel, rent, transport and services, 9% each on apparel and education, and
the remaining 9% on festivals (includes weddings, funerals) and durables. Note that by virtue of
high levels of house ownership as discussed below, a significant amount is saved on rents which
amounts to only 5% of budget compared to the actual imputed rent value of 31%. Urban LMC
households in contrast to the urban UMC spend more on essential foods (41%) and less on other
foods (11%). Fuel, rent and transport account for 25% of budget, and apparel 10%. Compared to
UMC, the LMC spends much less on education (5%), and festivals and durables (7%).
As households move from LMC to UMC, they re-allocate their budget by reducing the budget
share on essential foods and apparel (13% reduction) and increasing the budget share of less
essential foods (2% increase), fuel, transport, rent and services (6%), education (4%) and
festivals and durables (2%). The greater spending on fuel and transport may result from a more
comfortable lifestyle with a larger number of durables including appliances and vehicles,
together with spending on household services including communication and servants. Finally the
greater spending on education, festivals, and durables is consistent with the notion that as income
increases the propensity to spend on human and physical assets as well as on positional goods
particularly on festivals increases.
0%
10%
20%
30%
40%
50%
60%
70%
80%
90%
$0 $1 $2 $3 $4 $5 $6 $7 $8
% o
f H
H e
xpen
se
Per capita consumption
Figure 6: Essential Foods vs. All Other Expenditures
All other expenditures Essential Foods
Page 12
The rural M-class, compared with their urban counterparts, spend about the same amount on
essential foods. However, significantly less is spent on milk (5% versus 11% for rural and urban
UMC respectively) while more on sugar and oil (8% versus 6%), probably due to the availability
of milk from owned animals. Expenditures in rural areas are also lower for fuel, rent and
transport (26% versus 31%), and education (5% versus 9%), and considerably higher on events
and durables (21% versus 9%).
Income Streams and Occupations
Sources of income are quite different in urban and rural areas. Over 80 percent of the income of
the urban M-class is derived from a relatively steady monthly income stream. The vast majority
(80%) of the urban M-class earn their living as skilled workers, office workers, professionals,
businessmen or shopkeepers. The proportion of professionals, supervisory staff, executives,
businessmen and shopkeepers is higher among UMC compared with LMC (52% versus 35%).
The higher certainty in income streams of the urban UMC results in greater expenditures on
human and physical assets, and other less essential goods, as was discussed in the previous
section.
The rural M-class on the other hand, particularly the rural LMC, derives only 45 percent from
monthly income, while almost 50 percent is dependent on relatively uncertain income sources
(27% seasonal income, 10% loans and asset sales, 12% remittances). As a result the rural
(particularly the lower) M-class may perceive itself to be more vulnerable to economic shocks,
and as a result be less willing to invest in long-term human and physical resources.
Income sources of the urban and rural M-class differ in several other ways. About 50 percent of
urban LMC income comes from monthly income of the household head, and another 33 percent
from a second job of the household head or from income of other household members. The
pattern is similar for the urban UMC. On the other hand among rural LMC, monthly salaries of
the household head and that of others represents only 25 and 22 percent respectively, while 27
percent comes from annual and seasonal income. Remittance income together with transient
Page 13
income from loans and sale of assets is also much higher among the rural M-class. About 12
percent of rural LMC income is derived from remittances19
(7% international, and 6% local)
compared to 5 percent for urban LMC (3% international, 2% local). Another 10 percent of rural
LMC income comes from transient income (8% from loans and 2% from asset sales), compared
to 6 percent for urban LMC (4% loans, 2% from asset sales). Rental income and other returns on
assets are also higher among the rural M-class, representing 10 percent for rural UMC compared
to 5 percent for urban UMC.
Asset Portfolio
The urban upper M-class household has assets worth $74 thousand (in 2005$PPP), which is over
ten times annual cash expenditures of $7,500. This provides a relatively high degree of security
regarding “lifetime wealth”, and thus the confidence to spend on human and physical assets and
positional goods as was discussed earlier. Compared to the urban UMC, the LMC‟s wealth of
$28,000 is considerably lower, representing only about five times annual cash expenditure of
$5,000.
The portfolio of assets, as was the case of income streams, is different for the urban and for the
rural M-class. Owned residence represents 73 percent of the assets of the urban LMC, with
another 12 percent in agricultural property. For rural LMC households, owned residence
represents 45 percent of assets, with another 40 percent in agriculture (32% agricultural land and
8% animals). Investments in agricultural land are significantly higher for the rural UMC (49% of
assets), than for the urban UMC (16%). Savings and other non-agricultural property represent
about 12 percent of M-class assets, irrespective of urban or rural, LMC or UMC.
The average value of owned residence for urban UMC is $48,600 (in 2005$PPP), compared to
$18,800 for rural UMC, which reflects the significant differences in urban and rural property
values. Imputed rents for urban LMC and UMC amount to 21% and 31% of their total cash
expenditures, while actual rent payments amount to only about 4.5%. As a result urban M-class
saves considerably on rent by virtue of house ownership, which may explain the high ownership
levels and investment levels (76% of urban UMC own a house, and 73% of their total assets are
Page 14
in houses. The rural M-class on the other hand utilizes the savings from lower costs of rural
housing, to invest in agricultural land and thus generate a steady stream of agricultural income
(as compensation for the lack of a steady salary income).
Durable Ownership
Durable goods are widely owned among all classes particularly in urban Pakistan. For instance
even among the poor with daily per capita consumption under $2 (2005$PPP), ownership of
electric fans is 96 percent, mobiles 77%, television 64%, sewing machines 53%, and washing
machines 49%. The majority of urban LMC households own a washing machine (75%), a
refrigerator (65%), while the majority of urban UMC also own a motorcycle (58%) and a
growing number owns a personal computer (36%), an air-conditioner (27%), and a car (18%).
The ownership of durables is considerably lower in rural areas. Among the rural LMC mobiles
are commonly owned (78%), together with sewing machines (56%) and televisions (50%), while
the rural UMC owns refrigerators (59%), washing machines (59%), and motor cycles (44%).
However ownership of air conditioners, personal computers and cars are far less prevalent in
rural areas, with only half as many rural UMC households owning these durables, compared with
urban UMC households, reflecting a difference in life style and priorities.
Discussion
During the last decade (2002-2011) both population and real per capita consumption grew by
about 33 percent each, resulting in doubling the size of the middle class (M-class) to 15 million
households. The biggest shift in economic classes was the growth of the LMC (from 5.6 to
11.8m households) and the drop in the lower class (from 14 to 12.2 m), and an equivalent
increase in the UMC (from 1.3 to 3.2m). The growth of the LMC (by 6.2m) together with the
small growth in the upper class (0.3m), thus accounted for almost the entire increase in the
national population (6.6m), while the increase in the UMC was almost exactly offset by an
equivalent decrease in the lower class (both 1.9m).
Page 15
It is expected that the next decade will witness further growth in the M-class and another major
shift in economic classes, but this time due to the growth in the UMC rather than in the LMC. If
real per capita consumption continues to grow as in the past decade, households will continue to
shift from the LC to the LMC, but even greater numbers will move from the LMC to the UMC.
During the last decade 62% of the $60 billion growth in national consumption was accounted for
by the increase in the LMC, and another 28% due to the UMC. In the next decade the
percentages may reverse, with consumption growth being driven by the UMC rather than by the
LMC. The growth in the UMC results in greater consumption growth than would result from an
equivalent growth in the LMC. An increase in UMC by one million households results in
additional consumption of about $9.3 billion, while the equivalent increase in LMC would result
in $5.8 billion.
Of interest to policy makers and businessmen, would be the changing patterns of consumption as
a new UMC emerges in the country. One difference in consumption patterns would be a further
rise in expenditures on non-essential “positional” goods, such as durables, festivals, and
education, often used to attain a higher standard of living, but also used to signal one‟s position
in the social ladder. The UMC has available 71% of the household budget to spend on items
other than essential foods, compared to about 58% for the LMC, and only 48% for the LC. As
households move up the economic ladder, the number of durables owned increases. The typical
LC household owns a mobile, an electric fan and a television. The move to LMC is signaled by
the purchase of a refrigerator and washing machine, while a motorcycle signals that the
household belongs to the UMC. Finally ownership of a car and air conditioner characterize upper
class households.
Consumption choices are driven not just by absolute income, but also by certainty of future
income streams. The urban UMC derives 80% of income from a relatively steady monthly
income stream, compared with the rural UMC which derives only 48% from steady monthly
incomes. It is thus the urban UMC which has values and behavior more typical of the global M-
class20
. It is also expected that Pakistan‟s future M-class will more resemble today‟s urban UMC,
as rural UMC households adopt consumption patterns similar to their urban counterparts, and as
the UMC becomes a greater percent of the M-class.
Page 16
The urban UMC consists of about 2 million householdsand has an income stream which is both
sufficiently high and certainwhich makes itless vulnerable to economic shocks, and allows itto
invest in health, education and other “rent generating” credentials. This class has assets ten times
annual cash expenditures providing the cushion to weather economic shocks. The average value
of owned residence is about $50 thousand (in 2005$PPP). Over 75% live in their house, 73%
have a flush toilet, and 30% have at least one person with college education in the household.
Most own a refrigerator (88%), a washing machine (86%), a motor cycle (58%), a personal
computer (36%), an air conditioner (27%), and a car (18%). Over half have steady income
streams from salaried jobs, with another 10% obtaining income from remittances. Share of
expenditures on essential foods is under 30 percent, which allows them to spend 13% on non-
essential foods, and 9% each on education, durables, and festivals.
The conclusions which can be made from this study include broad generalizations about changes
in economic classes over the last decade, and details of consumption patterns, income streams,
and wealth profiles of different classes. However many questions remain unanswered. These
include the impact on consumption behavior as households of various economic classes face
higher energy costs, as exchange rates fluctuate and the resulting impact on prices of various
items. While it is difficult to predict the future, careful analysis of micro household data can be
used to identify the impact of past “economic shocks” on consumption behavior of various
economic classes. Finally it would be valuable to develop models linking macro-economic
growth to impact on specific economic classes, so that better estimates can be made of the size of
the M-class in the next decade. But whatever the answers to these more detailed questions, it
seems certain that Pakistan‟s M-class has finally emerged, and that in the decades to come it will
play a greater role as the center of global consumption inevitably shifts from the developed to
developing nations and from the old to the young.
The author gratefully acknowledges the superb research support provided by Mariam Vadria,
and thanks Fahad Siddique for his help in meticulously preparing and mining the data.
Page 17
References
Ablett, J., Baijal, A., Beinhocker, E., Bose, A., Farrell, D., Gersch, U., ...& Gupta, S. (2007). The
„Bird of Gold‟: The Rise of India‟s Consumer Market. McKinsey Global Institute.
Allen, J., & Rigby, D. (2005).The Consumer of 2020. In reprinted from Global Agenda,
published for the World Economic Forum Annual Meetings in Davos, Switzerland (January 26–
30).
Banerjee, A. V., & Duflo, E. (2007).The economic lives of the poor.The journal of economic
perspectives: a journal of the American Economic Association, 21(1), 141.
Banerjee, A. V., & Duflo, E. (2008). What is middle class about the middle classes around the
world?.The Journal of Economic Perspectives: a journal of the American Economic Association,
22(2), 3.
Chun, N. (2010). Middle class size in the past, present, and future: A description of trends in
Asia (No. 217). Asian Development Bank.
Coleman, R. P. (1983). The continuing significance of social class to marketing.Journal of
Consumer Research, 265-280.
Deaton, A. (1997). The analysis of household surveys: a microeconometric approach to
development policy. World Bank Publications.
Deaton, A. (2001). Counting the world's poor: problems and possible solutions. The World Bank
Research Observer, 16(2), 125-147.
Deaton, A., &Kozel, V. (2005). Data and dogma: the great Indian poverty debate. The World
Bank Research Observer, 20(2), 177-199.
Deaton, A., &Heston, A. (2008).Understanding PPPs and PPP-based national accounts (No.
w14499).National Bureau of Economic Research.
Ghani, J.A. (2006). Note on the socio-economic classification (SEC) of urban Pakistan. Lahore
University of Management Sciences.
Jolliffe, D. (2002). Whose Education Matters in the Determination of Household Income?
Evidence from a Developing Country*.Economic Development and Cultural Change, 50(2),
287-312.
Kharas, H. (2010). The emerging middle class in developing countries (pp. 7-8). Paris: OECD
Development Centre.
Page 18
Kharas, H., &Gertz, G. (2010). The new global middle class: a cross-over from West to East.
China’s emerging middle class: beyond economic transformation, Brookings Institution Press,
Washington, DC.
Levedahl, J. W. (1980). The impact of permanent and transitory income on household
automobile expenditure.Journal of consumer Research, 7(1), 55-66.
Loeb, B. S. (1955). The use of engel's laws as a basis for predicting consumer expenditures.The
Journal of Marketing, 20-27.
McKenzie, D. J. (2005).Measuring inequality with asset indicators.Journal of Population
Economics, 18(2), 229-260.
Meyer, C. J., &Birdsall, N. (2012).New Estimates of India‟s Middle Class.CGD Note, Center for
Global Development, Washington, DC.
Ravallion, M. (2010).The developing world‟s bulging (but vulnerable) middle class.World
Development, 38(4), 445-454.
Sørensen, A. B. (2000). Toward a Sounder Basis for Class Analysis 1.American Journal of
Sociology, 105(6), 1523-1558.
Taylor, P., Morin, R., D‟Vera Cohn, R. F., Kochhar, R., & Clark, A. (2008). Inside the middle
class: Bad times hit the good life. Pew Research Center.
Zukin, S., & Maguire, J. S. (2004).Consumers and consumption.Annual review of sociology,
173-197.
1 In this paper all $ amounts are given in terms of 2005 PPP dollars. The conversion rate for purchasing power parity
(PPP) 2005 dollars was Rs. 17.60 in 2001-02, Rs. 41.50 in 2010-11, and Rs 50 in 2013-14. Thus the M-class was
defined to be monthly expenditures (for a 6 person household) of Rs. 6,400 -32,100 in 2002, and Rs. 15,100 to Rs.
75,700 in 2011. 2 Aggregate national consumption increased from $98 billion (2005 ppp) to $158 billion, while M-class
consumption increased from $43b to $98b. Note that $158b (2005 PPP) was equivalent to Rs 6.6 trillion in 2010-11. 3 Of 21 Asia and Pacific countries studied, the ones with fastest growth during 1990-2008 were Armenia, PRC
(China), Viet Nam, Indonesia, and Pakistan (Chun 2010) 4 Considerable evidence exists to indicate that asset inequality plays a greater role in subsequent economic growth
than does income inequality, thus reinforcing the importance of lifetime wealth as the basis of class. See Deninger
2000. 5Levedahl (1980) differentiates between permanent and transitory income, and suggests that anticipated permanent
income helps predict the acquisition of durable goods such as automobiles. 6 Engel‟s Laws propose that as income increases the percentage spent on food decreases, the share spent on rent,
fuel, and clothing remains the same, and the share spent on education, health, comfort and recreation increases
(Loeb 1955). Empirical studies have found varying levels of support for these laws. For instance Millican (1967)
found expenditures on education to exhibit the greatest elasticity since richer families with children in private
schools spend considerably more than the less affluent with children in public schools. At the same time the
elasticity of expenditures of food consumed at home is different from food consumed away from home.
Page 19
7 Easterly (2001) indicates that a country‟s growth rate is strongly correlated with the size and share of aggregate
income held by the M-class. Ravaillion (2009) finds that a larger M-class is related to a higher rate of poverty
reduction, than under a neutral distribution growth scenario. 8 U.S. private consumption of $10 trillion accounts for about 20% the world economy Kharas 2010b
9 It is important to note that there are significant differences in what is referred to as M-class in developed countries
compared to the developing world. In developing countries households with $2-$10 daily per capita consumption (in
2005 purchase power parity dollars) are generally considered as M-class, which is lower than the $13 poverty line in
the U.S. (Bannerjee and Duflo 2008). The key is the distinct patterns of consumption and associated “aspiration”
levels of the M-class, together with reasonable certainty in lifetime wealth, and availability of buffer from economic
shocks. 10
Considerable efforts have been made by various international “Expert Groups” to develop standards for national
income and expenditure studies. See for instance, “United Nations Canberra Group Handbook on Household Income
Statistics” (2011), and Deaton (1997). Typical PSLM consists of separate questionnaires for males and females,
each about 18 pages long, with about 50 questions related to education and occupation including details for each
household member, 170 questions dealing with household expenditures, another 200 questions related to financial
assets and wealth. Males are asked about occupation, earnings, assets, and non-food expenditures. Females are asked
questions regarding maternal health, children, occupation, education, and food (and personal goods) expenditures. 11
The alternative is to take a relativist approach. Studies of M-class in developed countries have generally adopted a
relative measure of the interval such as 75% to 125% of the median (Thurow 1987), or 75% to 150% of the median
(PEW 2008). Studies of the M-class in developing countries have generally adopted the absolute approach, usually
using 2005 purchasing power parity U.S. dollars of $2 as the lower bound. The upper bound has been taken as $10
(Bannerjee and Duflo 2008), $13 (Ravaillion 2009), $20 (ADB 2010). The choice of upper bound is relatively
inconsequential, given that in most developing countries the percent having daily per capita expenditures of over
$10 is usually less than 2%. Note that this definition of developing country M-class of $2-$10 is considerably below
that of the developed world; In the U.S. for instance in 2005 the poverty line was defined as $13 per day. 12
The standard used for absolute measures of income and expenditures, is the 2005 purchasing power parity
(2005$PPP) U.S. dollar. The 2005$PPP uses the results of the 2005 International Comparison Program of the UN-
OECD-World Bank-regional development banks exercise based on prices for 1000 goods and services across 146
countries, and is described as “the most extensive and thorough effort ever to measure PPPs across economies”
(Deaton 2009, Kharas 2010a). 13
India‟s National Sample Survey (NSS) for instance reports only expenditures, and is the basis for the
Government‟s official poverty estimates. 14
Imputed values include any non-cash consumption such as milk from owned animal, self-produced and consumed
vegetables, gifts, and owner-occupied house. 15
Aggregate consumption includes cash and imputed expenditures. Note that there exists a discrepancy in aggregate
consumption and consumer (cash) spending estimates as reported by household surveys and in national accounts
(Meyer 2012, Deaton 2001). Studies related to M-class, income inequality and poverty estimates tend to utilize
household data. 16
Maximum years of schooling in a household (of any member of the household) is most significantly correlated
with household income, compared with other measures of household education (including education of household
head, and maximum female education) [Jolliffe 2002]. 17
Essential foods (with negative e-curve) include grains (wheat, rice, pulses), sugar, cooking oil, vegetables, spices,
tea, milk, and tobacco. 18
Other foods (less essential with positive e-curve) include beverages (soft drinks, but not tea, milk), meat, fruit,
readymade and packaged foods. 19
The M-class receives 66% of total international remittances; 45% to the rural MC, and 21% to the urban MC.
About 25% of total international remittances go to the UMC. 20
Coleman (1983) for instance describes the American M-class as “struggling to uplift oneself”, having “an upward
gaze”, concerned about appearances, shopping at more expensive stores for clothing with “one of the better brand
names”, and providing a college education to their children. Zukin (2004) describes the new M-class as
exemplifying the consuming self, attending to self-improvement, and with knowledge of status codes legitimizing
the display of “good taste”. The rise of the M-class is thus closely linked with the rise of mass consumption
societies, characterized by income levels enough to allow discretionary spending and the luxury of choosing a
lifestyle and a pattern of consumption.