The IT Dashboard By Chuck Back Submitted to the Faculty of the Information Technology Program in Partial Fulfillment of the Requirements for the Degree of Bachelor of Science in Information Technology University of Cincinnati College of Applied Science June 2011
Transcript
The IT Dashboard
By
Chuck Back
Submitted to the Faculty of the Information Technology Program
in Partial Fulfillment of the Requirements for the Degree of Bachelor of Science
in Information Technology
University of Cincinnati
College of Applied Science
June 2011
2 | P a g e
The IT Dashboard
By
Chuck Back
Submitted to the Faculty of the Information Technology Program
in Partial Fulfillment of the Requirements for
the Degree of Bachelor of Science in Information Technology
The author grants to the Information Technology Program permission to reproduce and distribute copies of this document in whole or in part.
___________________________________________________ __________________ Chuck Back Date ___________________________________________________ __________________ Profess John Nyland, Faculty Advisor Date
3 | P a g e
Acknowledgements
I would like to give special acknowledgment to Dr. Michal Kouril, the IT Dashboard’s project sponsor from Research IT Services at Children’s Hospital. Dr. Kouril brought the concept of the IT Dashboard to the Senior Design classroom, and accepted my invitation to execute the project. The IT Dashboard was a total success because of his guidance.
4 | P a g e
Table of Contents 1. Statement of the problem .................................................................................................................... 7
2. Description of the solution ................................................................................................................... 9
List of Figures ............................................................................................................................... Page Figure 1 Taxonomy of The ITD core functions4 ........................................................................................... 11 Figure 2 Senior Design I tasks and schedule ............................................................................................... 21 Figure 3 Senior Design II tasks and schedule .............................................................................................. 22 Figure 4 Senior Design II tasks continued ................................................................................................... 23 Figure 5 Senior Design III task and timeline. ............................................................................................... 23 Figure 6 Default view of The ITD’s dashboard. ........................................................................................... 24 Figure 7 The ITD’s Relationship status for a ML application ....................................................................... 25 Figure 8 The ITD’s dashboard Ad Hoc Conditions ....................................................................................... 26 Figure 9 The ITD’s search screen. ................................................................................................................ 27 Figure 10 The search screen after selecting an application. ....................................................................... 28 Figure 11 Search screen bound control ...................................................................................................... 29 Figure 12 Search results for a ML application. ............................................................................................ 30 Figure 13 Default application screen .......................................................................................................... 31 Figure 14 Add or remove attributes from an application ........................................................................... 32 Figure 15 Attributes page ........................................................................................................................... 33 Figure 16 ML Server Profile ......................................................................................................................... 34 Figure 17 ML Server Profile ......................................................................................................................... 35 Figure 18 Ad Hoc Conditions ....................................................................................................................... 37 Figure 19 Data Imports top of page ............................................................................................................ 39 Figure 20 Second half of data imports page ............................................................................................... 41 Figure 21 User groups and their permission ............................................................................................... 42 Figure 22 Log Search ................................................................................................................................... 43
6 | P a g e
Abstract
The IT Dashboard (ITD) is a software tool that monitors components in a network, finds
missing components in enterprise level software, and enforces business rules for the network
components. The ITD contains data repositories for each enterprise level application, and for
every server in the network. The enterprise level applications provide information about their
configuration, and the ITD monitors their configuration to determine if it is missing a
component, and if the component’s details are correct. The administrator imports the data from
the enterprise software application, and links each applicable server to the application. The ITD
monitors the CI, and prompts the user if a server is missing or if information about the server
changes. The ITD’s primary goal is to ensure each application’s configuration is correct, and
includes, or does not include, every server in the network.
7 | P a g e
The IT Dashboard
1. Statement of the problem
Research IT Services supports a large wide area network for the Bio Medical Division in
Children’s Hospital. The personal computers and servers in the network contain very important
material including medical records, sensitive research information, and proprietary internal
documentation. All of the information supports, or assists with saving lives at Children’s
Hospital, and is nearly impossible to replace if it is lost. Ensuring all of the information is
secure, redundant, available, and credible is a key task for Research IT Services.
The network includes both virtual and physical machines, and the IT staff uses many
different software packages to monitor, audit, backup, and document the network. Some of the
software packages include VMware Tools, Symantec Netbackup, HP Sim, NetScout, WSUS, and
Solsoft. All of these applications have a heterogeneous configuration, but their settings need to
reflect the network. The hospital’s network does not stop growing, so manual audits of the
software are only accurate for a short amount of time. Standardizing the software that supports
the network is an impossible task for a human to overtake, so a technical solution is necessary for
the Research IT Services to comply with industry standards.
Currently, Research IT Services is experiencing growth of nearly one terabyte per week.
The hardware environment is also converting from physical servers to virtual machines. The
growth of their enterprise requires constant updates to their supporting software, so their
applications accurately echo their enterprise. When there is a change to the network (IP/FQDN,
OS, Firewall, etc…) each piece of software must reflect the change, so the configuration is
consistent. Missing an application or forgetting to replicate a change throughout the enterprise
8 | P a g e
can have devastating effects. Here is a list of potential disasters which can result if the network
applications do not have the correct configuration:
• Lost Data
o The backup strategy must include all of the servers, and if the backup software
does not backup a server consistently data can be lost if the server fails.
• Loss of service
o Research IT Services wipes/reuses servers based upon their label which can
lead to a loss of services if the server does not have the correct label.
• Prolonged troubleshooting
o The administrator must gather information from multiple sources when an
application is not up-to-date which leads to longer downtimes.
Today, Research IT Services tracks all of the changes using several inaccurate and
unreliable operations. First, the administrator’s have standard operating procedures (SOP) to
follow, but the procedures do not include all of the applications, and are unreliable because of the
human element. The administrators have missed applications in the SOP, and the results were
disastrous. Second, manual enterprise audits to evaluate the servers and applications, but these
audits are not reliable because of the human element, and do not maintain accuracy because the
enterprise is in the constant rate of change. Lastly, the administrators use an Excel spreadsheet
to track all of the changes. However, the solution is futile because of the project’s scope, and
Excel is not powerful enough tool to provide the user’s needs.
The human element in their system configuration tracking is producing errors,
inconsistencies, and failures in their enterprise. The current methodology for managing the
information related to the components in their enterprise has many security risks, is inefficient to
9 | P a g e
manage, unreliable, and creates unnecessary overhead. Research IT Services needs a fully
integrated, three tier solution, which incorporates the needs of their users, and is powerful
enough to collect information from the entire enterprise.
2. Description of the solution
The proposed solution is a system that provides a dashboard for all the issues related to
the IT Research Services. The IT Dashboard allows the administrators to ensure consistency
throughout the enterprise, prevent disasters, reduce time and cost, and ensure compliance. The IT
Dashboard (ITD) uses federated data from multiple sources to evaluate the network servers and
applications. ITD is a single reference point for all software elements that control the network,
and allows an administrator to understand their enterprise by providing a real time list of servers
and attributes, and their relationship with the support software. To provide the high-level control
and insight, ITD uses some of the most powerful technologies available, including Microsoft
SQL Server 2008, Microsoft .Net 4.0, and Microsoft Server 2008. The ITD monitoring service
uses current technology to locate all of the servers in the enterprise, and pool resources so the
ML of servers is unquestionably complete. After building the ML of servers, ITD gathers data
from the enterprise software that manages the wide area network. It analyzes all of the metadata
to provide an overview of the network, and the configuration of each enterprise level application.
The ITD system is a multi-tiered solution that integrates with the Research IT Services’ network
applications, and provides the administrators with an up-to-date look of their network. The
application’s goal is to eliminate time, costs, errors, and allow Research IT Services’ to comply
with networking standards. Reducing or removing these elements allows Research IT Services
to provide the most optimal environment for their users.
10 | P a g e
2.1 Architecture
ITD’s framework is based upon a configuration management database (CMDB) which is
a method of tracking changes in an IT environment. CMDB is a core component of The
Information Technology Infrastructure Library (ITIL). ITIL is a set of concepts and practices for
Information Technology Management, Information Technology development and IT operations.2
Strictly speaking, the ITIL CMDB contains a record of the expected configuration of the IT
environment, as authorized and controlled through the change management and configuration
management processes.2 A CMDB collects data from multiple sources and provides IT staff a
unified source to view the information, and relationships between the information. Some of
leaders in creating a standard in federated CMBD architecture include Microsoft, Fujitsu, HP and
IBM. These standards revolve around using a consistent architecture, so the solution is viable in
many different scenarios. A CMDB Without consistency, a solution is limited to the proprietary
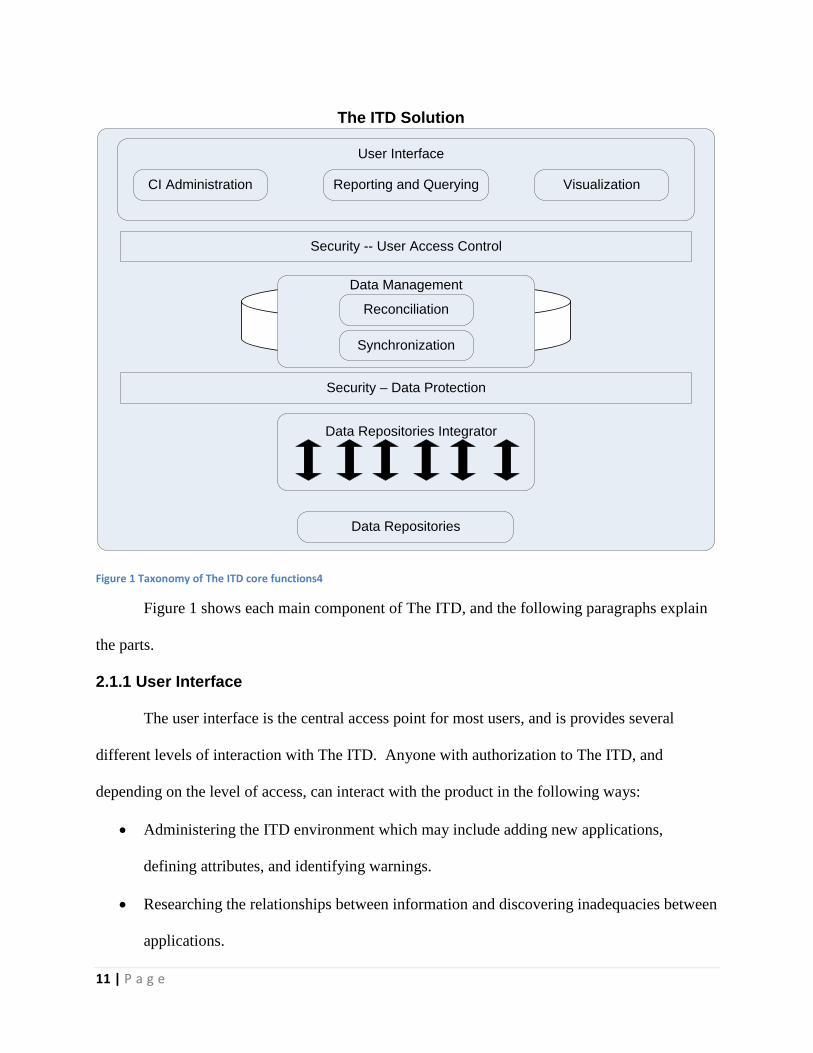
environment. Figure 1 shows the core functions of The IT Dashboard.
11 | P a g e
The ITD Solution
User Interface
CI Administration Reporting and Querying Visualization
Security -- User Access Control
Reconciliation
Data Management
Synchronization
Security – Data Protection
Data Repositories Integrator
Data Repositories
Figure 1 Taxonomy of The ITD core functions4
Figure 1 shows each main component of The ITD, and the following paragraphs explain
the parts.
2.1.1 User Interface
The user interface is the central access point for most users, and is provides several
different levels of interaction with The ITD. Anyone with authorization to The ITD, and
depending on the level of access, can interact with the product in the following ways:
• Administering the ITD environment which may include adding new applications,
defining attributes, and identifying warnings.
• Researching the relationships between information and discovering inadequacies between
applications.
12 | P a g e
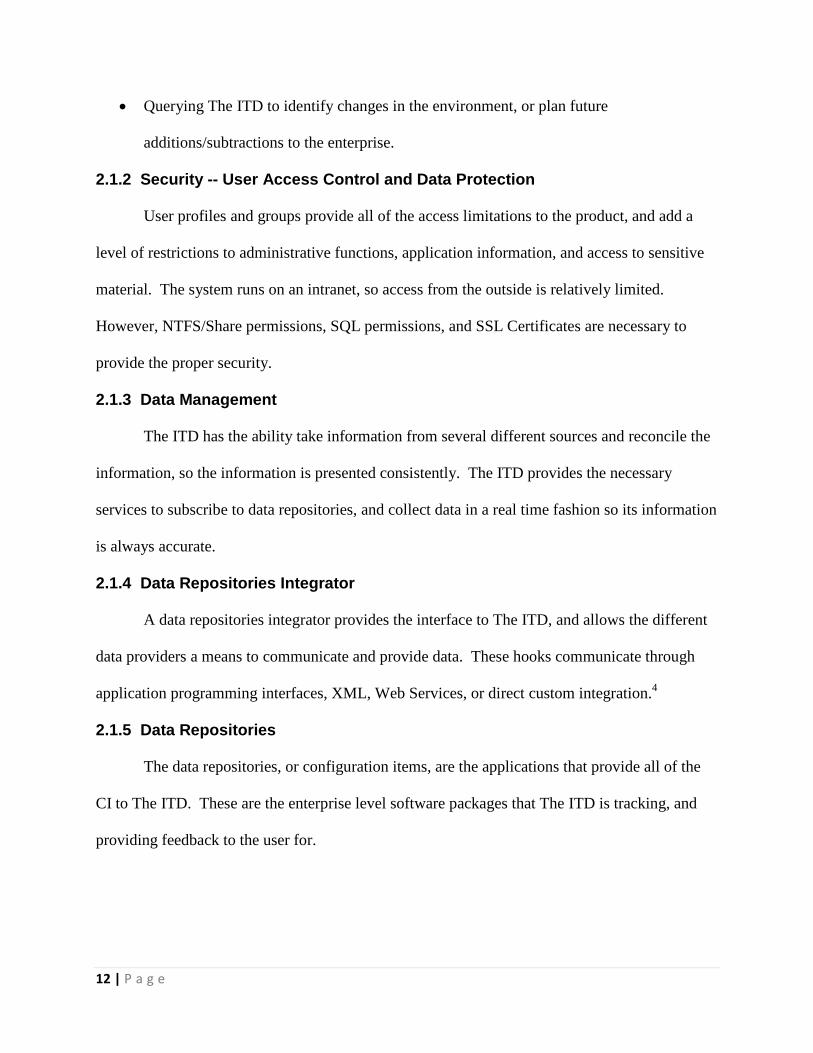
• Querying The ITD to identify changes in the environment, or plan future
additions/subtractions to the enterprise.
2.1.2 Security -- User Access Control and Data Protection
User profiles and groups provide all of the access limitations to the product, and add a
level of restrictions to administrative functions, application information, and access to sensitive
material. The system runs on an intranet, so access from the outside is relatively limited.
However, NTFS/Share permissions, SQL permissions, and SSL Certificates are necessary to
provide the proper security.
2.1.3 Data Management
The ITD has the ability take information from several different sources and reconcile the
information, so the information is presented consistently. The ITD provides the necessary
services to subscribe to data repositories, and collect data in a real time fashion so its information
is always accurate.
2.1.4 Data Repositories Integrator
A data repositories integrator provides the interface to The ITD, and allows the different
data providers a means to communicate and provide data. These hooks communicate through
application programming interfaces, XML, Web Services, or direct custom integration.4
2.1.5 Data Repositories
The data repositories, or configuration items, are the applications that provide all of the
CI to The ITD. These are the enterprise level software packages that The ITD is tracking, and
providing feedback to the user for.
13 | P a g e
2.2 Specifications
The services to support the above architecture includes the following:5
o Federated CMDB Services, which provide for
Administration of the Federated CMDB
Resource federation, including the registration of resources by data
repositories
Query of the reconciled resources and their relationships in the Federated
CMDB
Subscription and notification for both resource and metadata changes in
the Federated CMDB
o Data Repository Services, which provide for
Query of the resource records and relationships managed by the data
repositories
Subscription and notification for resource changes in the data repositories
The ITD monitoring service locates applications that contain information on all of the servers
in the enterprise. ITD can use one of many applications, and its schema provides the users with a
simple one-to-one view of each list of information, or a combination of views which cross-
reference each list to find disparities. ITD builds a ML of servers and their attributes that are in
the wide area network. The ML comes from multiple applications, and the administrator has the
ability to select the applications that have the most up-to-date information, so building the ML
guarantees to have all of the servers in the enterprise. These applications can include asset
tracking software that contains all of the hardware in the enterprise, virtualization software that
controls all of the virtual machines in the enterprise, or any application that has the ability to
14 | P a g e
export information about the assets that are being tracked in the ITD. Research IT Services has
two applications that have all of the servers in the enterprise, and these applications can provide
attributes about the servers. The following are the two applications for building the ML
applications at Research IT Services:
• VMware vCenter
o vCenter is the master controls for the entire BMI virtual network
o Holds a part of the ML of servers in the enterprise
• RT Asset Tracker
o Manages all of the assets of the entire enterprise
o Holds a part of the ML of server in the enterprise
VMware vCenter controls the entire virtual environment for everything in the Children’s
Hospital network, so it contains every virtual machine that exists. The RT Asset Tracker
monitors every hardware asset in the enterprise, so it contains every piece of hardware that
connects to the enterprise. Therefore, retrieving data from both pools of information guarantees
ITD is working with a complete list of servers.
Next, ITD creates data repositories to build a useful source of information. The master list
(ML) cross-references the configuration information (CI) to find inconsistent configurations, and
CI application look for the matching server in the ML application to determine if the server is
missing. This dual relationship finds any missing servers in the enterprise software, and any
orphan servers that no longer exist in the ML applications. Here is a list of potential applications
and their means to provide information:
• Symantec NetBackup
15 | P a g e
o Enterprise level application that provides a single console to backup and restore
all of the machines in the Children’s network.
o Ability to provide data in the form of a comma separated file
• IPAM
o Manages all of the IP Addresses, DHCP, and DNS in network.
o Ability to track the servers in half of the network
o API to provide data
• Log Logic – Security Change Manager Reporter
o Firewall management software that controls all of the firewall rules for each
server.
o API to provide data
• Q1 Labs – Radar Log Manager
o Collect, archive, and analyze network and security event logs.
o API to provide data
• Zenoss
o Uses SNMP to pull performance data from servers.
o API to pull data
These data repositories use the data repositories integrator to communicate with The ITD, and
provide information that relates to the list of servers in the ML. The ITD compares the
information, and sends notifications to the user when there are inconsistencies.
Each server in the ML has a server profile that links the server to one or many CI
application using an attribute. The ML and CI applications link using the server name from the
ML, and the server identifier in the CI application. The server identifier in an application must
16 | P a g e
be unique for that application. The value of the CI’s attribute does not have to be an exact match
to the ML’s server attribute, and a user can enter an artificial value to link the applications.
2.2.1 User Profiles
The IT Dashboard’s design includes two user group types who have different access to
the functionality in the Web site. The user profile types include Administrators that have full
access to all of ITD’s functionality, and the Data Owners that do not have access to changing the
ITD’s configuration.
The IT Dashboard’s design and intended use incorporates high-level technical concepts,
and access information from enterprise level applications. The ITD’s Administrators have
access to these applications, and typically administer those applications too. The Administrators
have access to the following core features:
• Dashboard
• Search
• Applications
• Attributes
• Relationships
• Ad Hoc Comparisons
• User Groups
• Logs
• Data Imports
Research IT Services has full time IT personnel that are responsible for administering and
maintaining the IT Dashboard. Future maintenance and administration can include the following
functionalities: HTML, .Net, T-SQL, and CSS.
17 | P a g e
The Data Owners are the network users, or IT personnel, that know the information in
each enterprise level application, and can verify the ITD’s accuracy. These users need access to
the Dashboard functionality so they can determine if there are any issues with the enterprise level
application, and can use the Search feature to investigate the ITD’s information. The Data
Owners have the permission to view the information the ITD gathers from the data repositories,
but do not have permission to change, update, or delete the information.
3. Deliverables
The ITD deliverables include adding applications, comparing data, showing alerts to the
user, importing data, and creating users. Combining each of these components provides the user
with a complete configuration management database. The following paragraphs include
explanation of the feature in the ITD.
3.1 Configuration
The ITD configuration module allows an administrator user to add, edit, and delete a new
storage container for the data coming from the enterprise level applications. The ITD stores data
for two different applications including MLs and CI applications. These applications have
attributes that are characteristics of the applications, and define the data they contain. After the
applications have information, the ITD compares thee CI applications with the ML, and displays
any inconsistencies on the Dashboard. The ITD administrator configures the relationships
between the ML and CI applications, and the ITD uses the alert definitions when comparing the
application’s data.
• Application ML – A ML is the primary source of information, and includes all of the
hardware that the ITD monitors. The ML comes from multiple applications, and the
18 | P a g e
administrator has the ability to select the applications that have the most up-to-date
information, so building the ML guarantees to have all of the servers in the enterprise.
• Application CI – The ITD cross-references the data from these applications with the ML
to find inconsistent configurations. These applications may include network backup
applications, firewall software, and other enterprise level applications.
• Attributes – The attributes are the containers for the data each application can contain.
Each attribute has a data type, name, and description.
• Server Profile – Each server in a ML has a server profile that links the server to one or
many CI applications. The server profile consists of a ML’s connection to a CI
application. The link between a ML and CI application can be an exact match, or the
user can create a link with an artificial link.
• Ad Hoc Comparison – A user can create a custom relationship to enforce business rules
between a ML’s data and CI data.
• Alerts – The alerts are comparisons between the data in the MLs and CI lists. The user
configures the alerts that include selecting a ML’s attribute, and a CI attribute. The ITD
monitors the lists, and alerts the user when it finds an inconsistency.
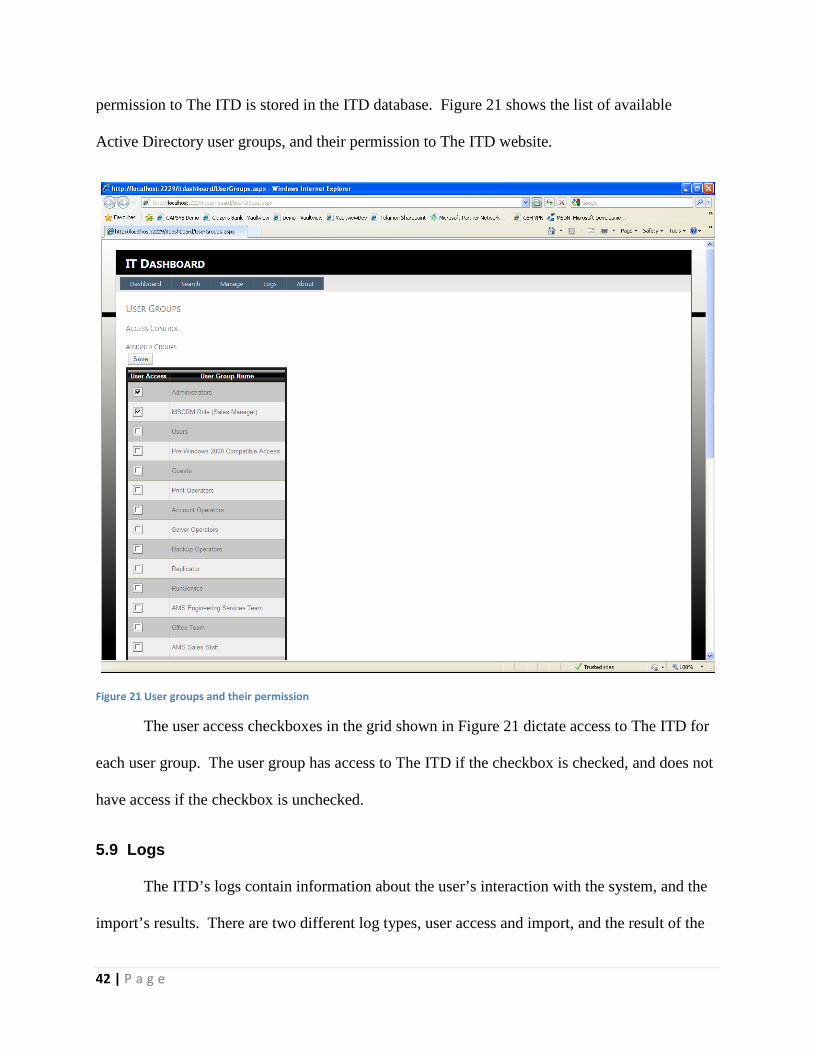
• User Groups – An administrator of The ITD can add user groups from Active Directory,
and apply administrator or data owner permissions.
3.2 Client
The ITD Client provides the user with several different views of the information inside
the database. A user can query the database and view the records for a ML and a CI list, or
quickly glance at the dashboard feature that displays a summary of all the lists. The client also
displays the alerts to the user, and allows the user to silence an alert if it is a known difference.
19 | P a g e
A user can also investigate and troubleshoot The ITD by using the system logs, which is
available through the client.
• Query The ITD – The can choose between searching through a ML or a CI list. After
selecting an application, the user can enter data into the applicable attributes, and search
the database for the parameter.
• Manage Alerts – When The ITD finds an inconsistency, it flags the problem for the
administrator, and highlights the information so the user can address the issue. The user
can silence an alert while they are taking action, or if the problem is a known issue.
• Dashboard – The primary view of The ITD is the dashboard utility that provides an
overview of the system. The dashboard summarizes all of the applications, and displays
the total alerts.
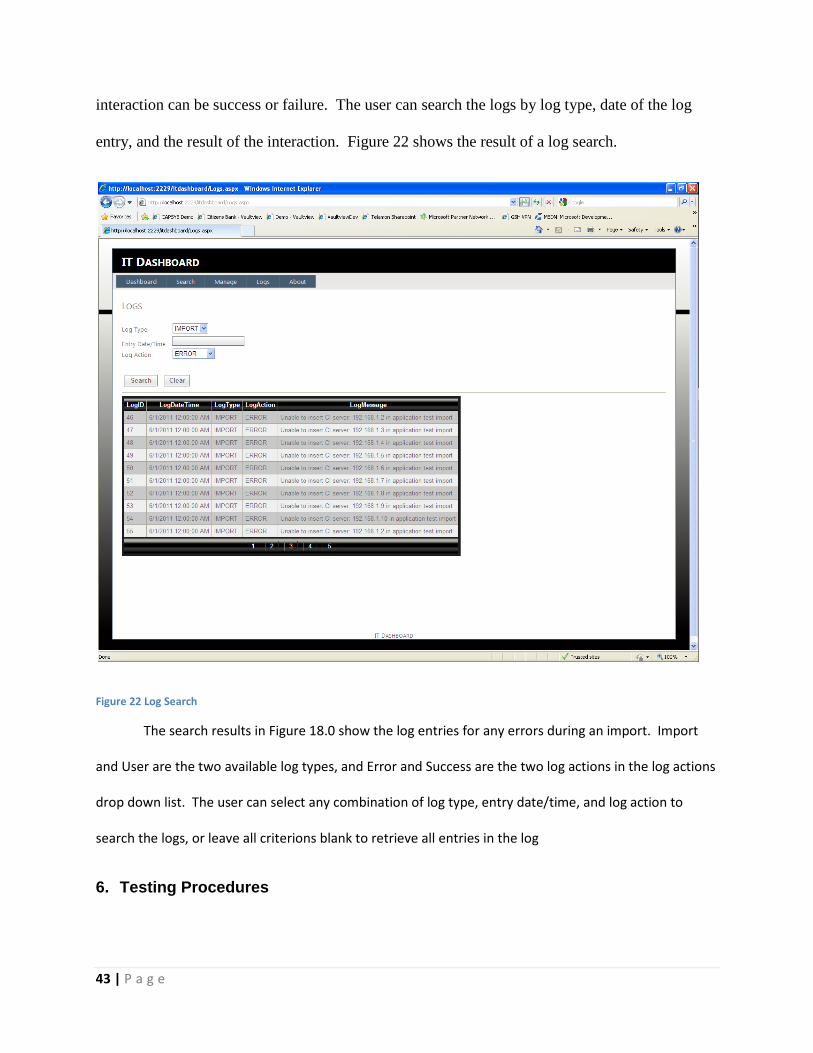
• Log – The logs show the user past actions made by The ITD including imports, user
interaction, and system errors.
3.3 Data Repositories Integrator
The data repositories integrator (DRI) provides a pipeline for information into The ITD.
The DRI uses Windows Communication Foundation to communicate with The ITD, and
provides the applications a way to import data. There are several methods to import data
including a manual import, scheduled import, or direct API import.
• Manual Import – The manual import allows a user to insert data into The ITD by
choosing the appropriate application, and mapping the attributes to the import file. The
import file must be a separated file, and have a consistent format.
• Scheduled Import – The scheduled import is a job that runs a saved manual import, or a
scheduled direct API import.
20 | P a g e
• Direct API Import – The API import is a custom link between an external data repository
and The ITD that communicates directly to the database using a web service.
4. Design and Development
The following sections describe the project’s timeline, and each quarter’s tasks and
accomplishments.
4.1 Timeline
The ITD’s timeline covers three different classes including Senior Design I, Senior
Design II, and Senior Design III. The Senior Design I’s primary goal is a problem and possible
solution to the problem. Senior Design II’s outcome is a design for the solution, and a prototype
with basic functionality. The project ends in Senior Design III, and a fully functional solution is
expected. The following is a breakdown of each quarter, and the tasks accomplished.
4.1.1 Senior Design I -- Accomplishments
Senior Design I’s goal was to find a problem, define the problem, and propose a solution
to solve the problem. I accomplished the following during Senior Design I:
• Research Configuration Management databases
• Analyze appropriate technologies
• Interview customer
• Draft a high-level architecture for The ITD
• Create a proposal and oral presentation
21 | P a g e
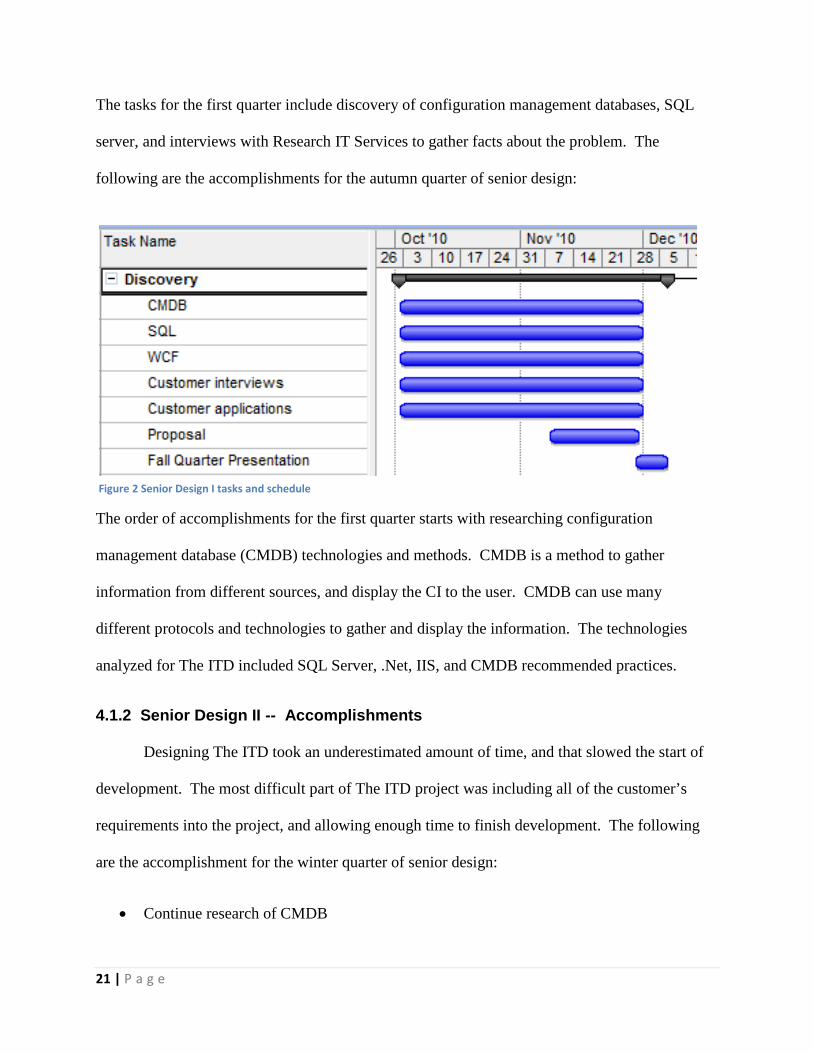
The tasks for the first quarter include discovery of configuration management databases, SQL
server, and interviews with Research IT Services to gather facts about the problem. The
following are the accomplishments for the autumn quarter of senior design:
The order of accomplishments for the first quarter starts with researching configuration
management database (CMDB) technologies and methods. CMDB is a method to gather
information from different sources, and display the CI to the user. CMDB can use many
different protocols and technologies to gather and display the information. The technologies
analyzed for The ITD included SQL Server, .Net, IIS, and CMDB recommended practices.
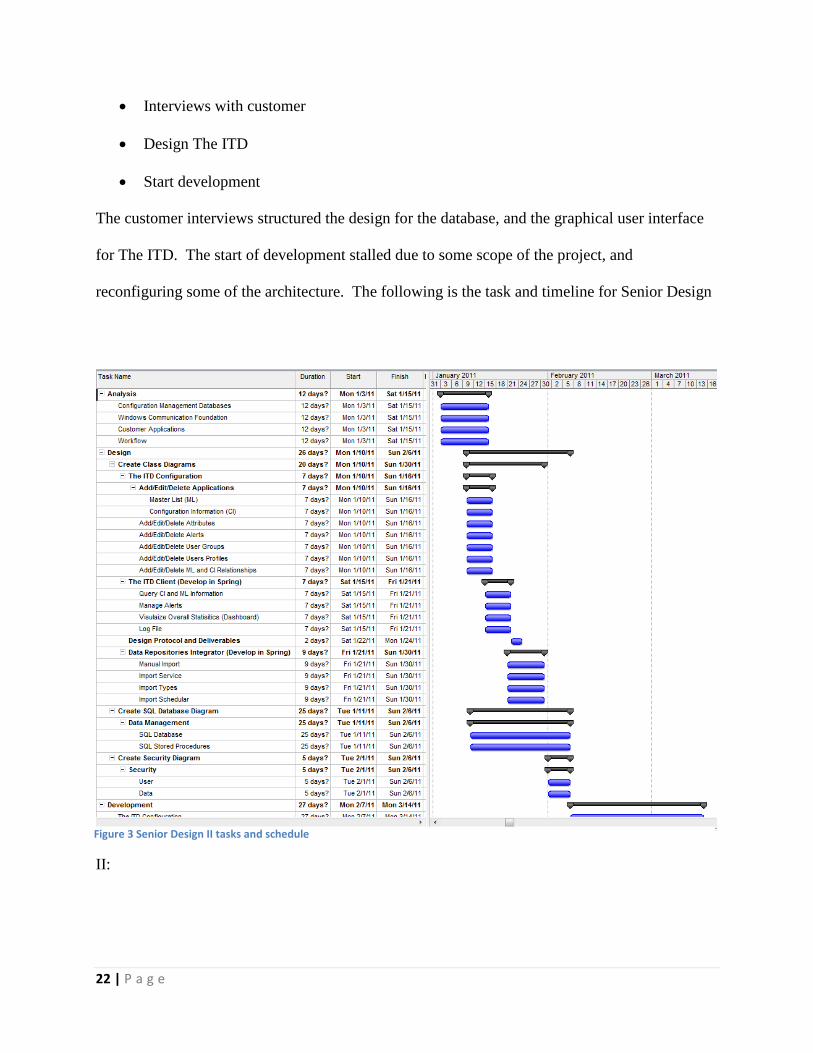
4.1.2 Senior Design II -- Accomplishments
Designing The ITD took an underestimated amount of time, and that slowed the start of
development. The most difficult part of The ITD project was including all of the customer’s
requirements into the project, and allowing enough time to finish development. The following
are the accomplishment for the winter quarter of senior design:
• Continue research of CMDB
Figure 2 Senior Design I tasks and schedule
22 | P a g e
• Interviews with customer
• Design The ITD
• Start development
The customer interviews structured the design for the database, and the graphical user interface
for The ITD. The start of development stalled due to some scope of the project, and
reconfiguring some of the architecture. The following is the task and timeline for Senior Design
II:
Figure 3 Senior Design II tasks and schedule
23 | P a g e
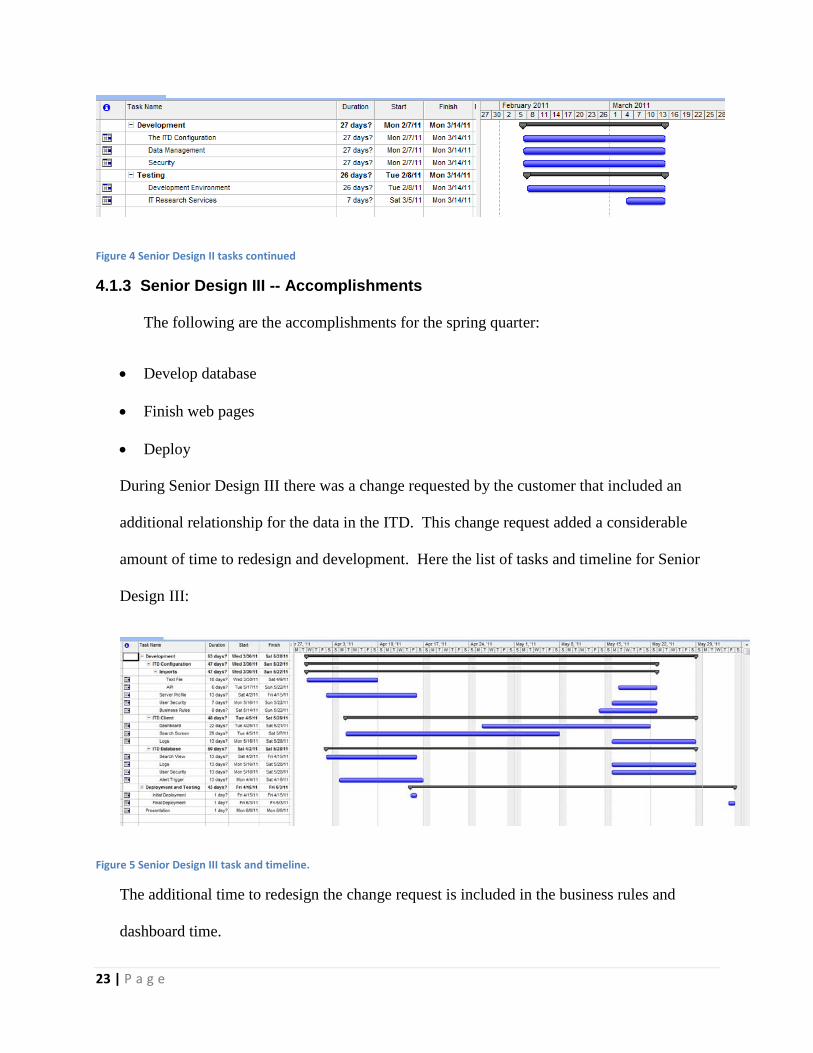
Figure 4 Senior Design II tasks continued
4.1.3 Senior Design III -- Accomplishments
The following are the accomplishments for the spring quarter:
• Develop database
• Finish web pages
• Deploy
During Senior Design III there was a change requested by the customer that included an
additional relationship for the data in the ITD. This change request added a considerable
amount of time to redesign and development. Here the list of tasks and timeline for Senior
Design III:
Figure 5 Senior Design III task and timeline.
The additional time to redesign the change request is included in the business rules and
dashboard time.
24 | P a g e
5. Proof of Design
The proof of design section describes each deliverable and the challenges encountered during
the project. The sections are divided into The ITD’s core functionality, and explain how each component
works to accomplish the goals and deliverables for the project.
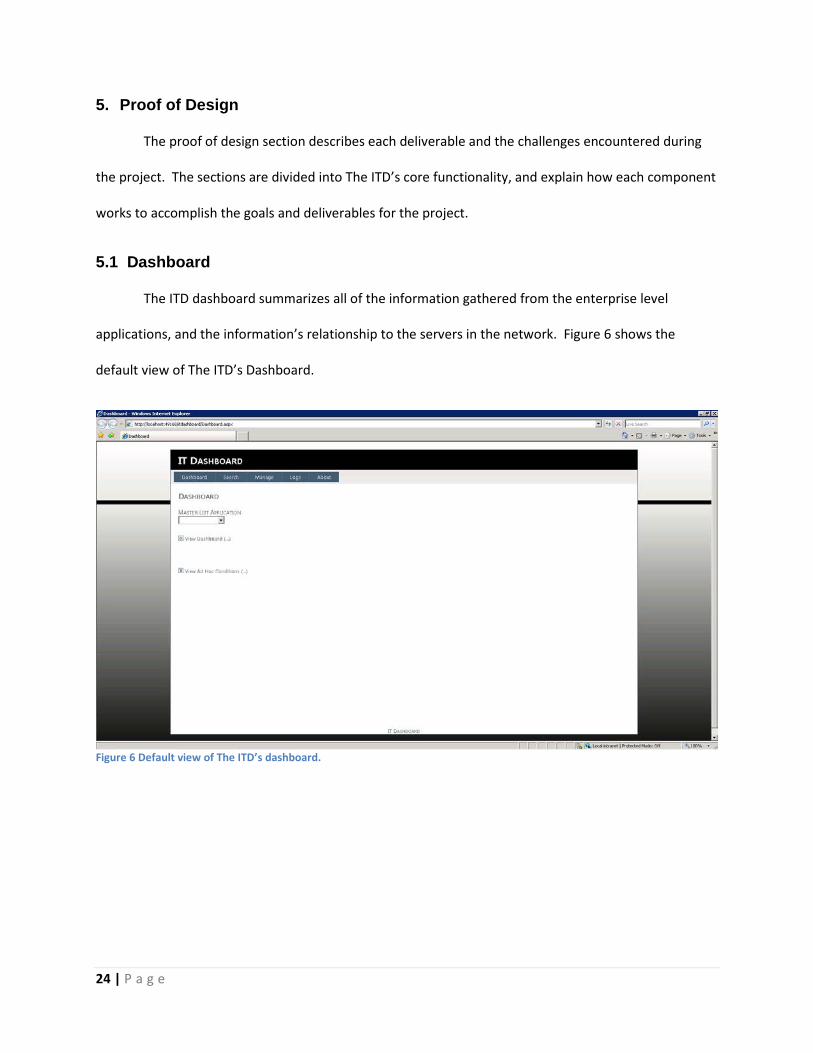
5.1 Dashboard
The ITD dashboard summarizes all of the information gathered from the enterprise level
applications, and the information’s relationship to the servers in the network. Figure 6 shows the
default view of The ITD’s Dashboard.
Figure 6 Default view of The ITD’s dashboard.
25 | P a g e
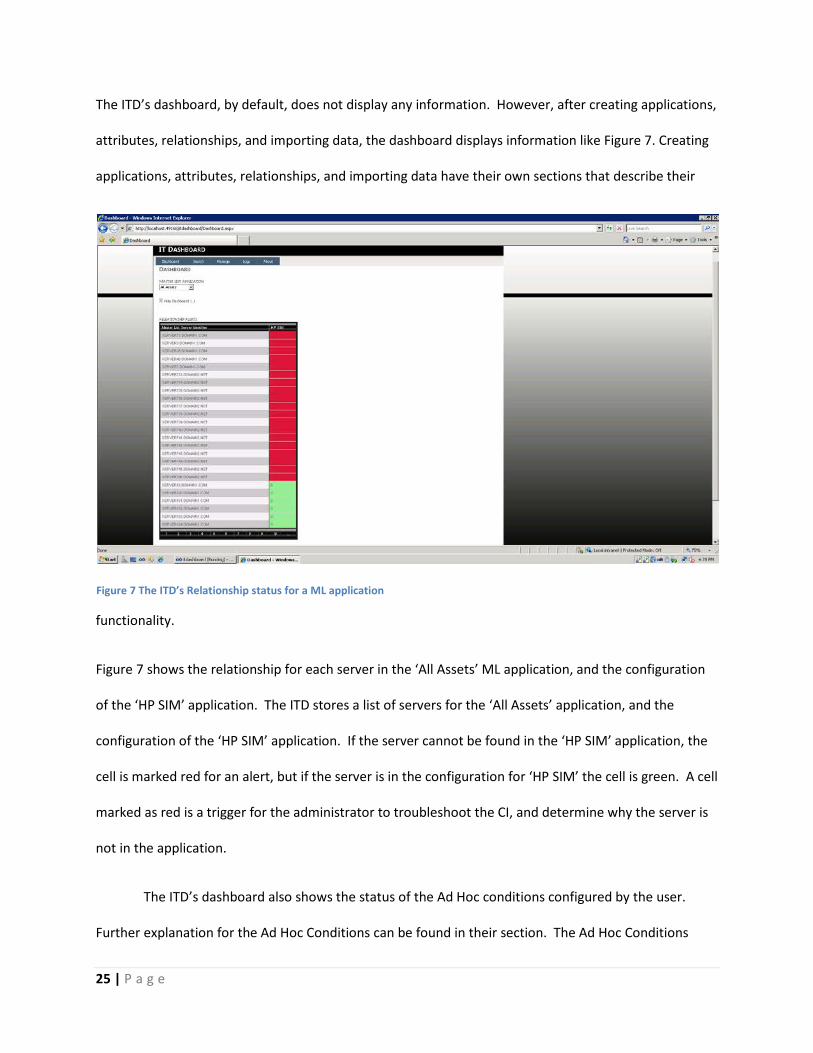
The ITD’s dashboard, by default, does not display any information. However, after creating applications,
attributes, relationships, and importing data, the dashboard displays information like Figure 7. Creating
applications, attributes, relationships, and importing data have their own sections that describe their
functionality.
Figure 7 shows the relationship for each server in the ‘All Assets’ ML application, and the configuration
of the ‘HP SIM’ application. The ITD stores a list of servers for the ‘All Assets’ application, and the
configuration of the ‘HP SIM’ application. If the server cannot be found in the ‘HP SIM’ application, the
cell is marked red for an alert, but if the server is in the configuration for ‘HP SIM’ the cell is green. A cell
marked as red is a trigger for the administrator to troubleshoot the CI, and determine why the server is
not in the application.
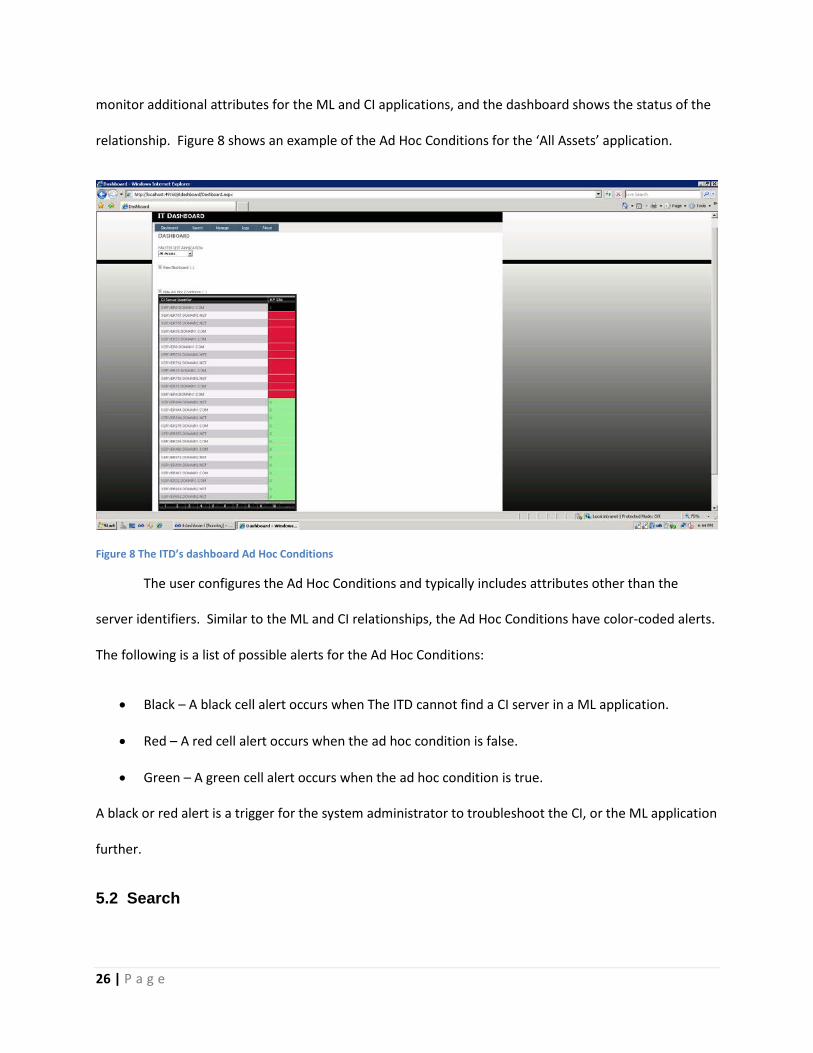
The ITD’s dashboard also shows the status of the Ad Hoc conditions configured by the user.
Further explanation for the Ad Hoc Conditions can be found in their section. The Ad Hoc Conditions
Figure 7 The ITD’s Relationship status for a ML application
26 | P a g e
monitor additional attributes for the ML and CI applications, and the dashboard shows the status of the
relationship. Figure 8 shows an example of the Ad Hoc Conditions for the ‘All Assets’ application.
Figure 8 The ITD’s dashboard Ad Hoc Conditions
The user configures the Ad Hoc Conditions and typically includes attributes other than the
server identifiers. Similar to the ML and CI relationships, the Ad Hoc Conditions have color-coded alerts.
The following is a list of possible alerts for the Ad Hoc Conditions:
• Black – A black cell alert occurs when The ITD cannot find a CI server in a ML application.
• Red – A red cell alert occurs when the ad hoc condition is false.
• Green – A green cell alert occurs when the ad hoc condition is true.
A black or red alert is a trigger for the system administrator to troubleshoot the CI, or the ML application
further.
5.2 Search
27 | P a g e
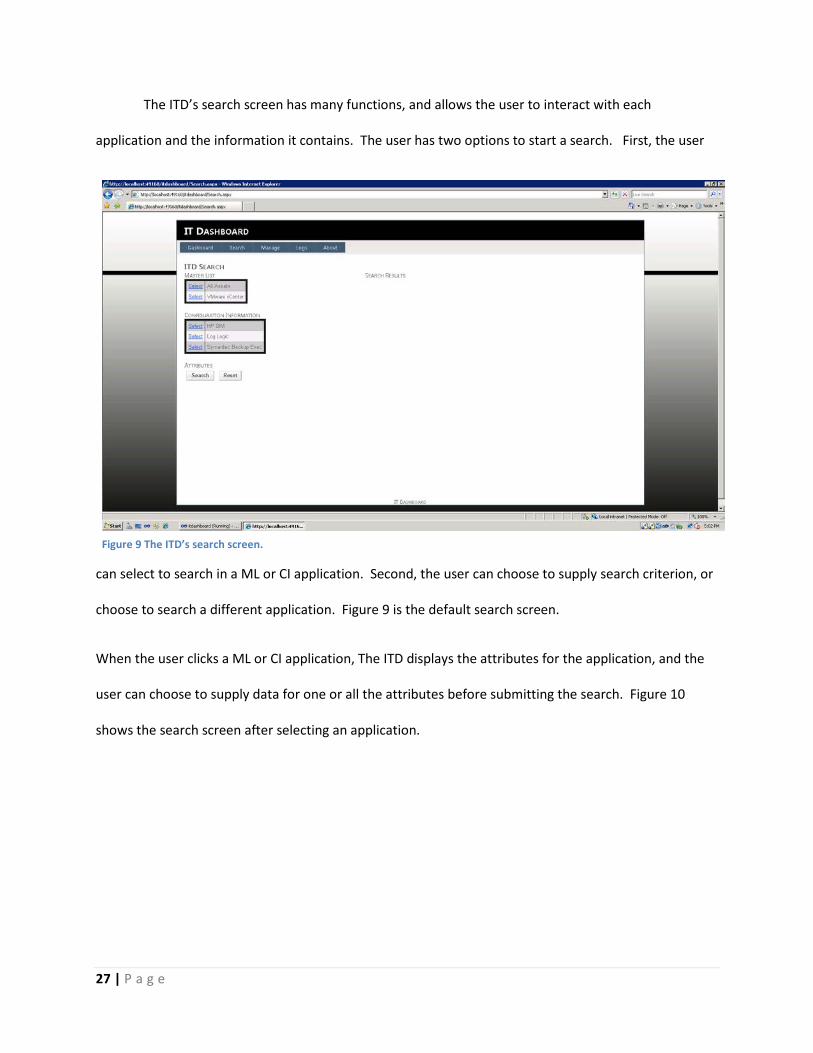
The ITD’s search screen has many functions, and allows the user to interact with each
application and the information it contains. The user has two options to start a search. First, the user
can select to search in a ML or CI application. Second, the user can choose to supply search criterion, or
choose to search a different application. Figure 9 is the default search screen.
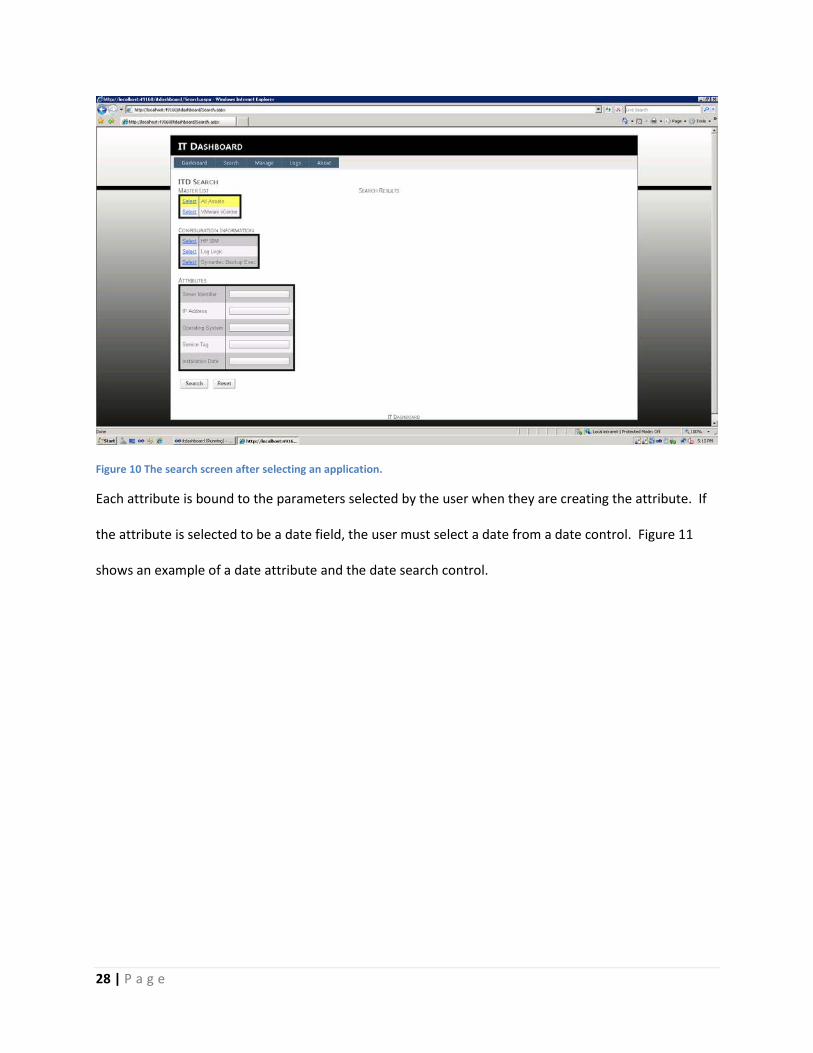
When the user clicks a ML or CI application, The ITD displays the attributes for the application, and the
user can choose to supply data for one or all the attributes before submitting the search. Figure 10
shows the search screen after selecting an application.
Figure 9 The ITD’s search screen.
28 | P a g e
Figure 10 The search screen after selecting an application.
Each attribute is bound to the parameters selected by the user when they are creating the attribute. If
the attribute is selected to be a date field, the user must select a date from a date control. Figure 11
shows an example of a date attribute and the date search control.
29 | P a g e
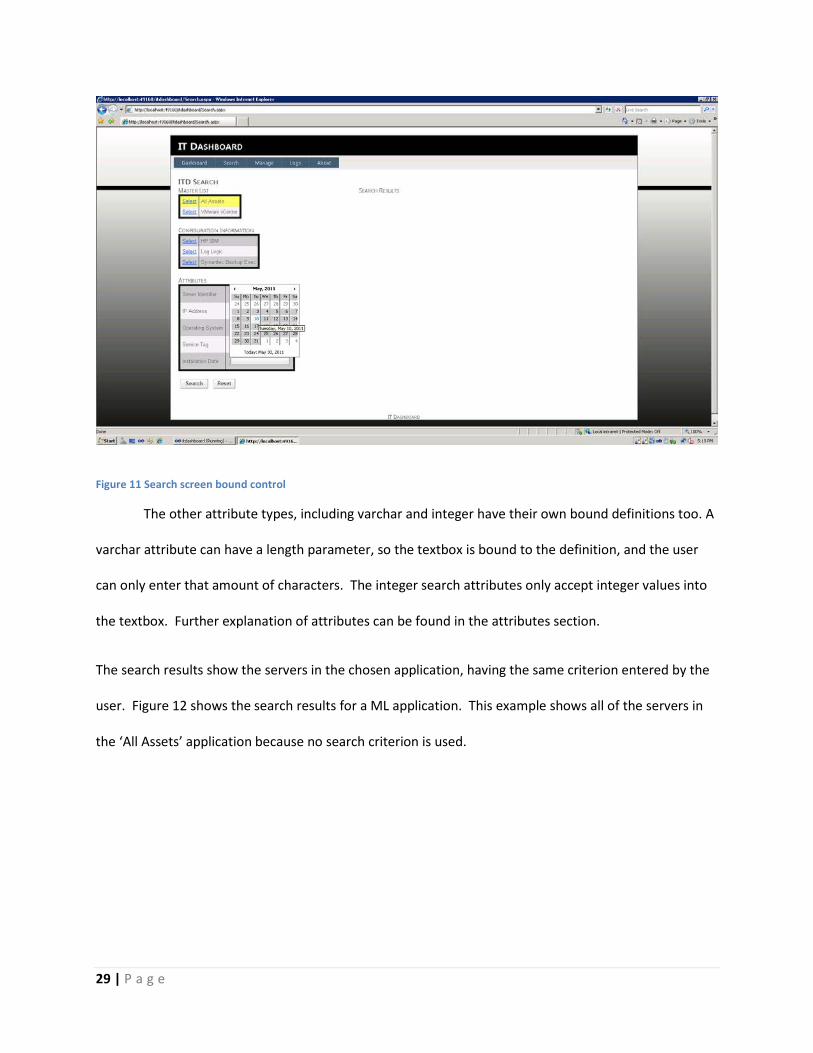
Figure 11 Search screen bound control
The other attribute types, including varchar and integer have their own bound definitions too. A
varchar attribute can have a length parameter, so the textbox is bound to the definition, and the user
can only enter that amount of characters. The integer search attributes only accept integer values into
the textbox. Further explanation of attributes can be found in the attributes section.
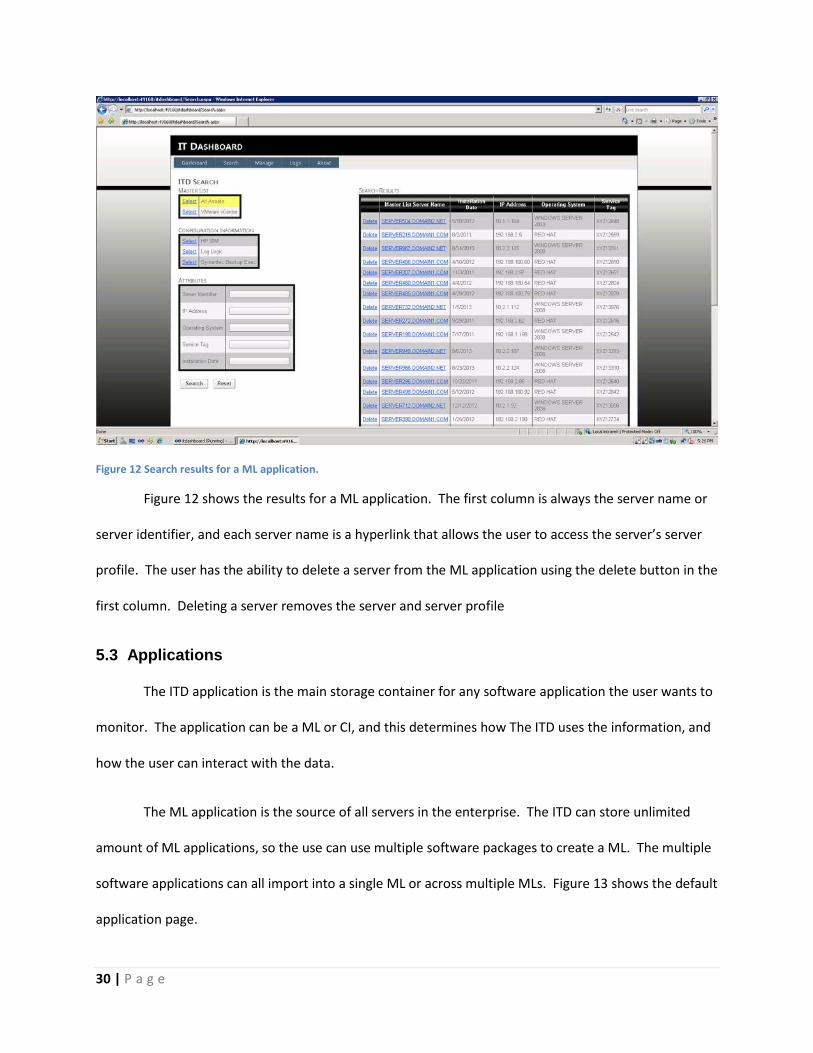
The search results show the servers in the chosen application, having the same criterion entered by the
user. Figure 12 shows the search results for a ML application. This example shows all of the servers in
the ‘All Assets’ application because no search criterion is used.
30 | P a g e
Figure 12 Search results for a ML application.
Figure 12 shows the results for a ML application. The first column is always the server name or
server identifier, and each server name is a hyperlink that allows the user to access the server’s server
profile. The user has the ability to delete a server from the ML application using the delete button in the
first column. Deleting a server removes the server and server profile
5.3 Applications
The ITD application is the main storage container for any software application the user wants to
monitor. The application can be a ML or CI, and this determines how The ITD uses the information, and
how the user can interact with the data.
The ML application is the source of all servers in the enterprise. The ITD can store unlimited
amount of ML applications, so the use can use multiple software packages to create a ML. The multiple
software applications can all import into a single ML or across multiple MLs. Figure 13 shows the default
application page.
31 | P a g e
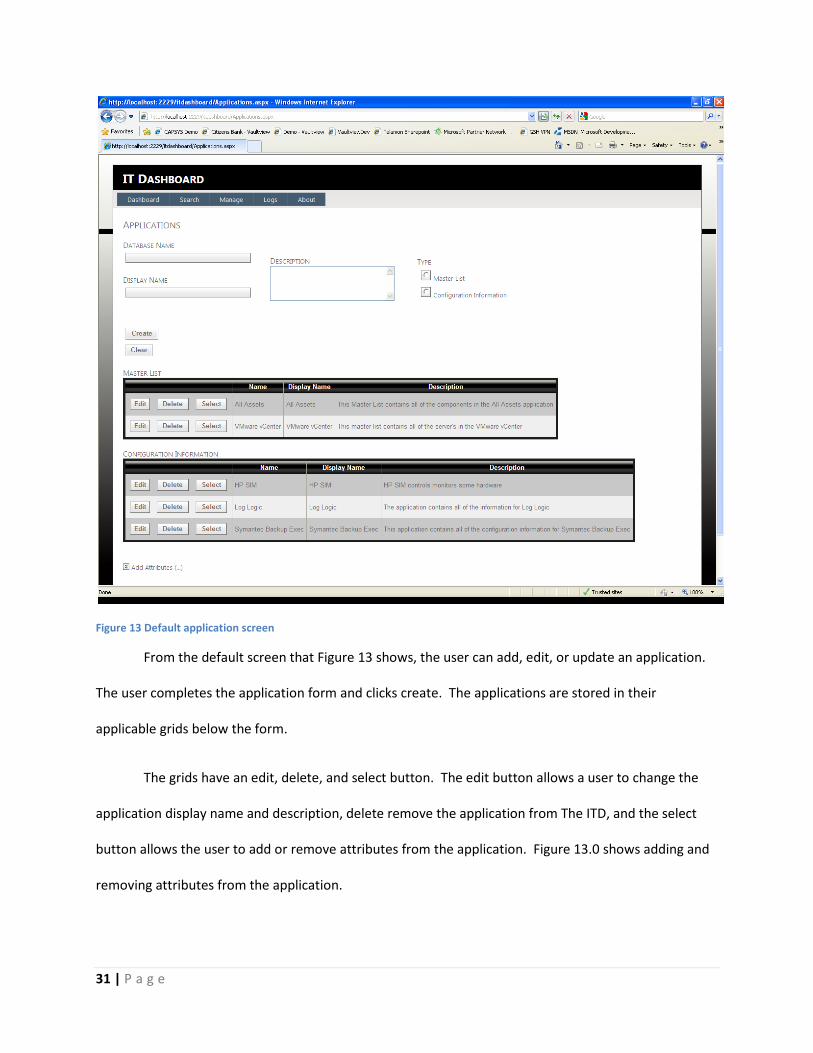
Figure 13 Default application screen
From the default screen that Figure 13 shows, the user can add, edit, or update an application.
The user completes the application form and clicks create. The applications are stored in their
applicable grids below the form.
The grids have an edit, delete, and select button. The edit button allows a user to change the
application display name and description, delete remove the application from The ITD, and the select
button allows the user to add or remove attributes from the application. Figure 13.0 shows adding and
removing attributes from the application.
32 | P a g e
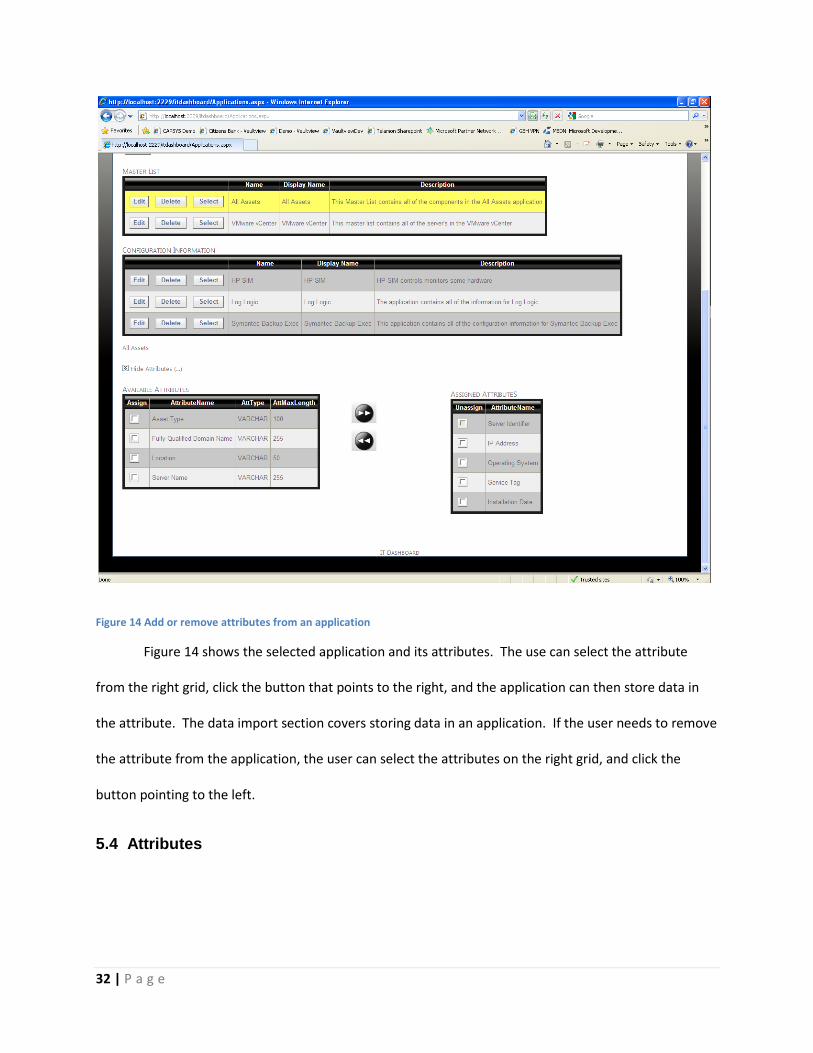
Figure 14 Add or remove attributes from an application
Figure 14 shows the selected application and its attributes. The use can select the attribute
from the right grid, click the button that points to the right, and the application can then store data in
the attribute. The data import section covers storing data in an application. If the user needs to remove
the attribute from the application, the user can select the attributes on the right grid, and click the
button pointing to the left.
5.4 Attributes
33 | P a g e
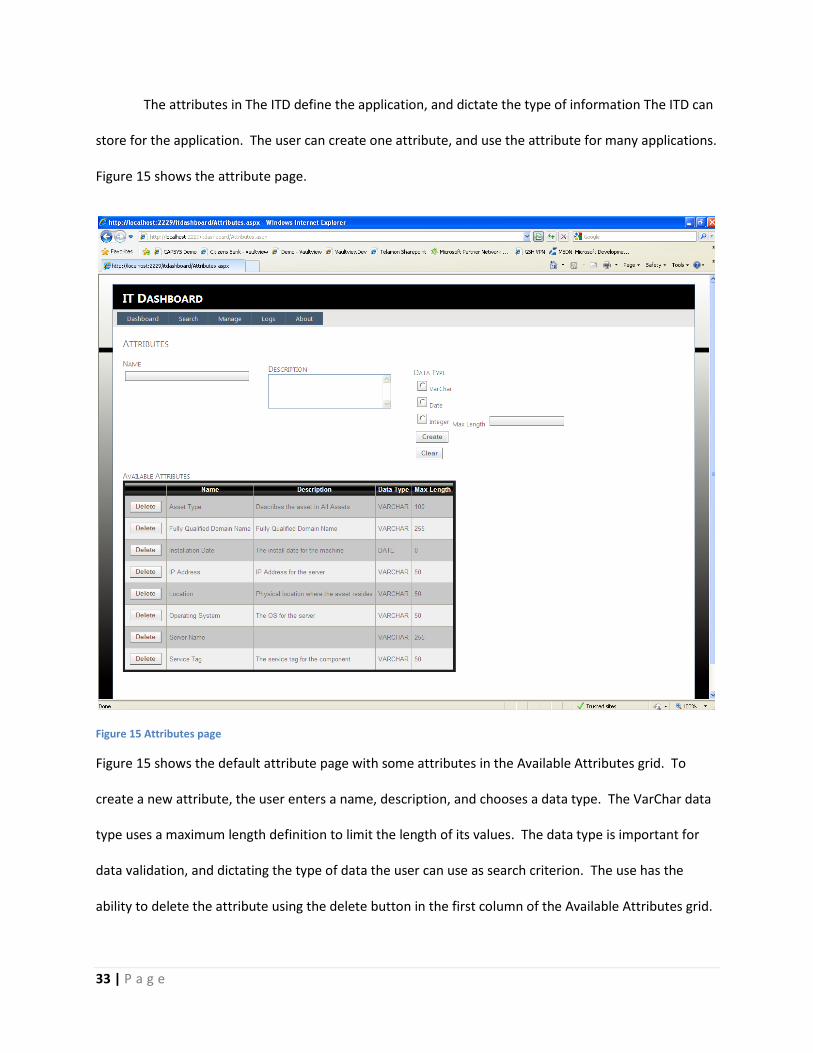
The attributes in The ITD define the application, and dictate the type of information The ITD can
store for the application. The user can create one attribute, and use the attribute for many applications.
Figure 15 shows the attribute page.
Figure 15 Attributes page
Figure 15 shows the default attribute page with some attributes in the Available Attributes grid. To
create a new attribute, the user enters a name, description, and chooses a data type. The VarChar data
type uses a maximum length definition to limit the length of its values. The data type is important for
data validation, and dictating the type of data the user can use as search criterion. The use has the
ability to delete the attribute using the delete button in the first column of the Available Attributes grid.
34 | P a g e
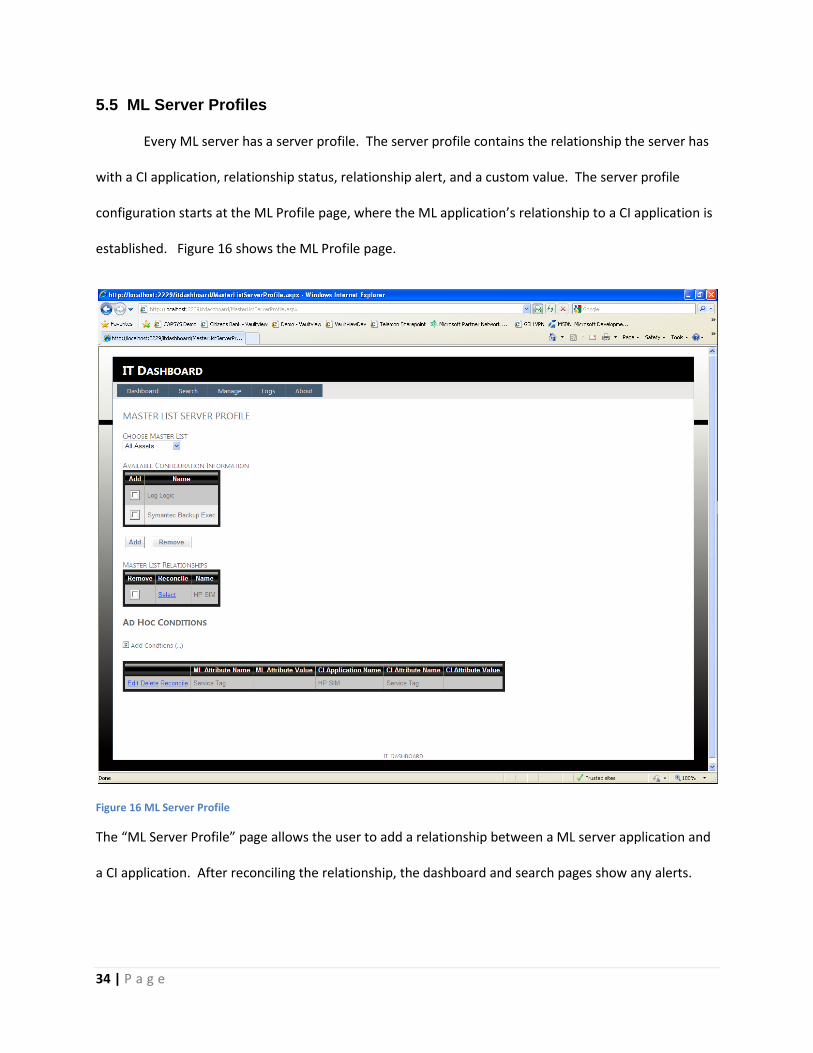
5.5 ML Server Profiles
Every ML server has a server profile. The server profile contains the relationship the server has
with a CI application, relationship status, relationship alert, and a custom value. The server profile
configuration starts at the ML Profile page, where the ML application’s relationship to a CI application is
established. Figure 16 shows the ML Profile page.
Figure 16 ML Server Profile
The “ML Server Profile” page allows the user to add a relationship between a ML server application and
a CI application. After reconciling the relationship, the dashboard and search pages show any alerts.
35 | P a g e
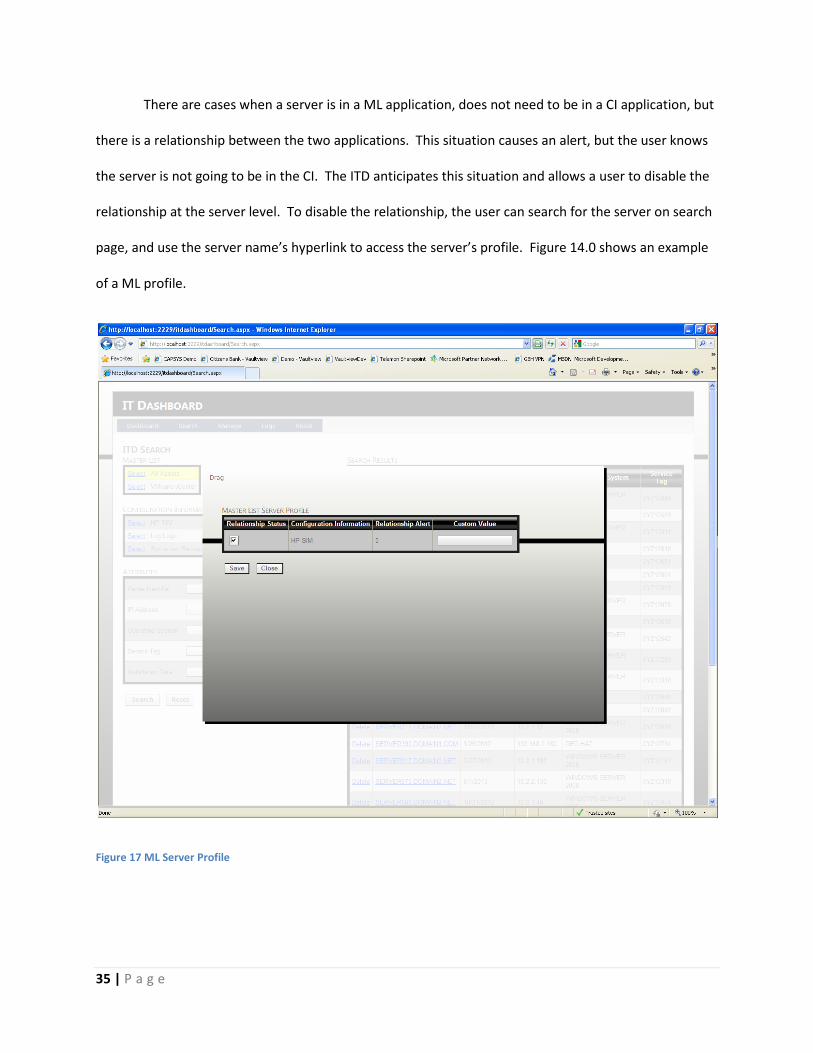
There are cases when a server is in a ML application, does not need to be in a CI application, but
there is a relationship between the two applications. This situation causes an alert, but the user knows
the server is not going to be in the CI. The ITD anticipates this situation and allows a user to disable the
relationship at the server level. To disable the relationship, the user can search for the server on search
page, and use the server name’s hyperlink to access the server’s profile. Figure 14.0 shows an example
of a ML profile.
Figure 17 ML Server Profile
36 | P a g e
The ML server’s profile in Figure 17 shows the relationship between the server and the CI
application. The user can control the relationship for each server in a ML application, by disabling the
relationship status, or supplying a customer value.
When the user reconciles a relationship between ML and CI application, only the servers in the
ML application that have a relationship status set to true (checked) are processed to look for missing
servers. The servers that have a relationship status of true can use their ML server name to create a
relationship with a CI application, or use a custom value. Not all enterprise level applications identify a
server the same way. While some may store a fully qualified domain name, others store an IP address
to identify servers. The user has the ability to link a server in a ML application to a server in a CI
application using values that are not exact equals. When the relationship reconciles, instead of using
the server name, The ITD uses the custom value.
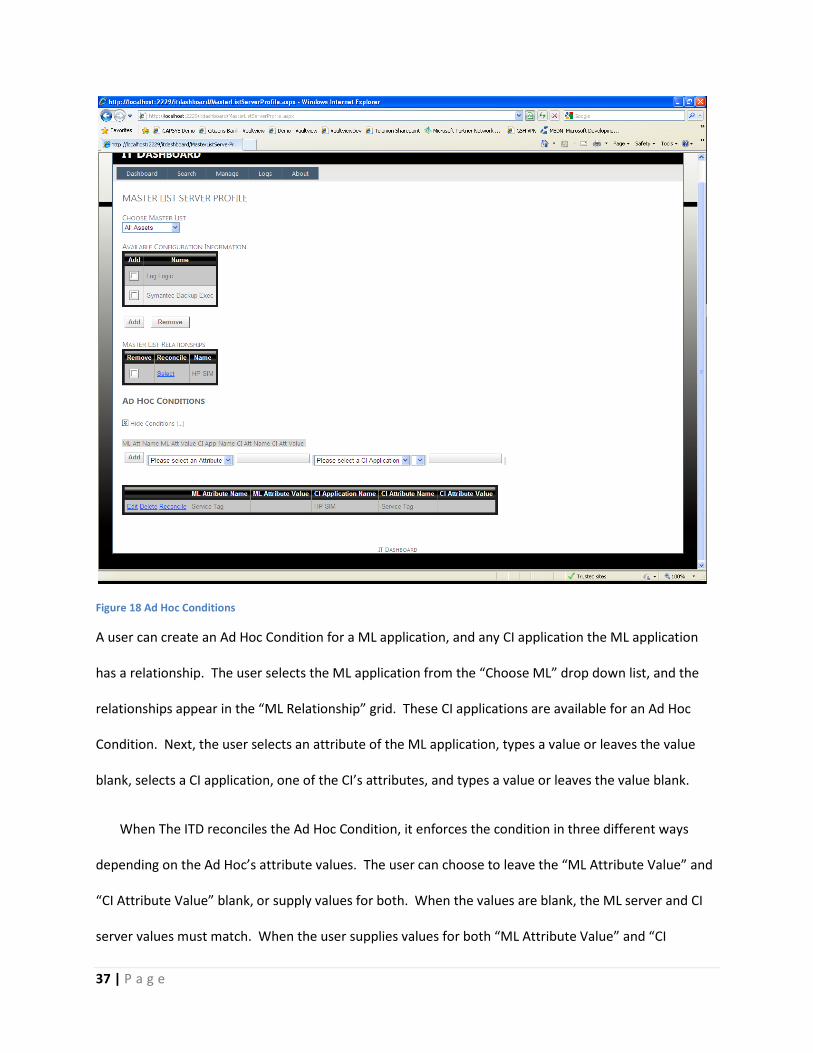
5.6 Ad Hoc Conditions
Ad Hoc Conditions perform two functions. First, Ad Hoc Conditions enforce rules for CI’s
attributes. Second, the conditions also apply a reverse search for the server in a ML application. Figure
18 shows the Ad Hoc Conditions page.
37 | P a g e
Figure 18 Ad Hoc Conditions
A user can create an Ad Hoc Condition for a ML application, and any CI application the ML application
has a relationship. The user selects the ML application from the “Choose ML” drop down list, and the
relationships appear in the “ML Relationship” grid. These CI applications are available for an Ad Hoc
Condition. Next, the user selects an attribute of the ML application, types a value or leaves the value
blank, selects a CI application, one of the CI’s attributes, and types a value or leaves the value blank.
When The ITD reconciles the Ad Hoc Condition, it enforces the condition in three different ways
depending on the Ad Hoc’s attribute values. The user can choose to leave the “ML Attribute Value” and
“CI Attribute Value” blank, or supply values for both. When the values are blank, the ML server and CI
server values must match. When the user supplies values for both “ML Attribute Value” and “CI
38 | P a g e
Attribute Value”, if the ML Server attribute value equals the Ad Hoc’s “ML Attribute value” then the CI
Server attribute value must match the Ad Hoc’s “CI Attribute Value”. If the server in the CI application
does not exist in the ML application, the Ad Hoc Condition does not execute. Additional information for
the Ad Hoc Condition alerts is in the Dashboard section.
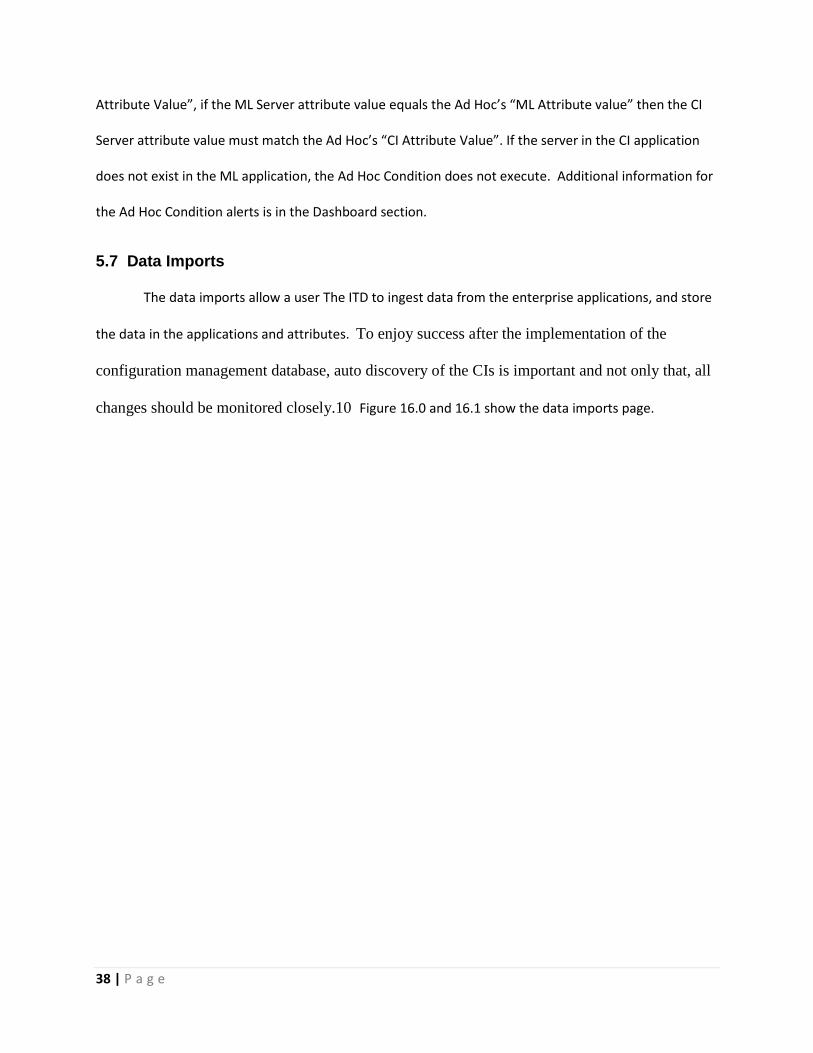
5.7 Data Imports
The data imports allow a user The ITD to ingest data from the enterprise applications, and store
the data in the applications and attributes. To enjoy success after the implementation of the
configuration management database, auto discovery of the CIs is important and not only that, all
changes should be monitored closely.10 Figure 16.0 and 16.1 show the data imports page.
39 | P a g e
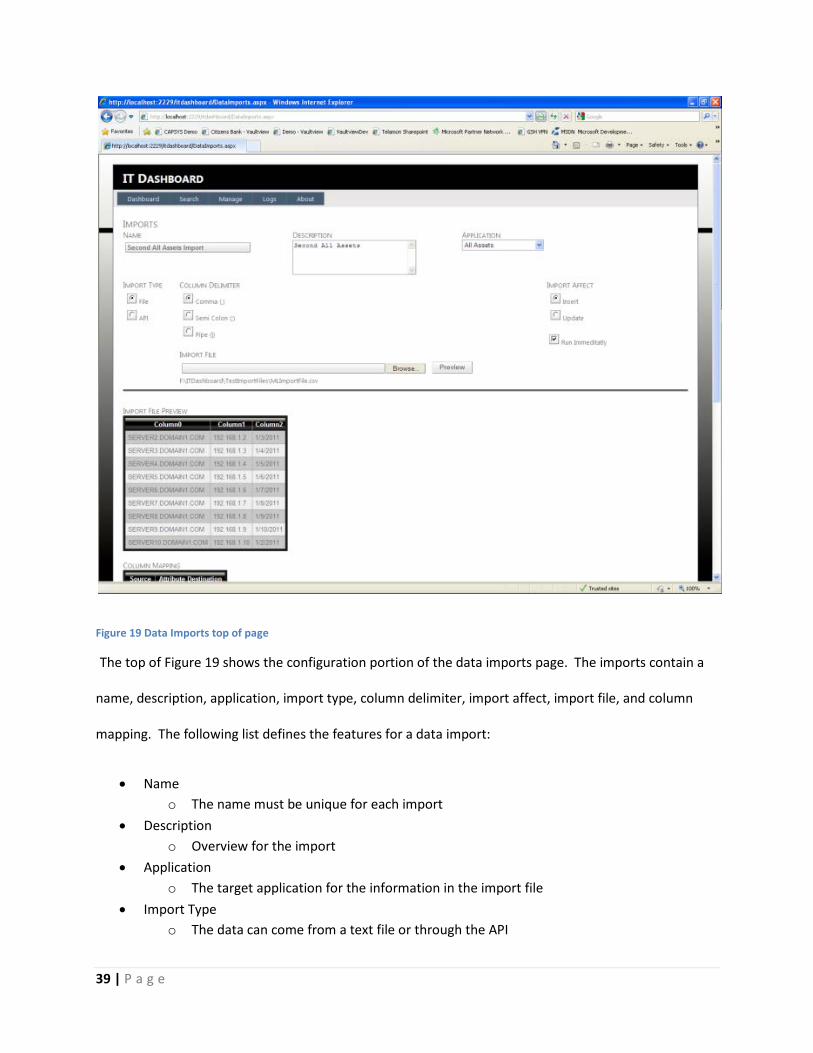
Figure 19 Data Imports top of page
The top of Figure 19 shows the configuration portion of the data imports page. The imports contain a