1 The Relation between the High Speed Submerged Cavitating Jet Behavior and the Cavitation Erosion Process Ezddin Ali Farag Hutli 1 , Milos S. Nedeljkovic 2 , Nenad A. Radovic 3 , Attila Bonyár 4 1 Corresponding author email [email protected]1 – Ph.D., Department of Thermohydraulics, Centre for Energy Research, Hungarian Academy of Sciences and Institute of Nuclear Techniques,BudapestUniversityofTechnologyandEconomics,Budapest,Hungary 2 – Professor, Ph.D., University of Belgrade, Faculty of Mechanical Engineering 3 – Professor, Ph.D., University of Belgrade, Faculty of Technology and Metallurgy 4 –A. Professor, Ph.D., Budapest University of Technology and Economics, Dep. of Electronics Technology Abstract In order to accurately and reliably evaluate the cavitation erosion resistance of materials using a cavitating jet generator, the effects of the hydrodynamic parameters and the nozzle geometry on the erosion process were investigated. Since the behaviour of a high speed submerged cavitating jet is also depending on the working conditions; their influence is also discussed based on the evaluation of cavitation erosion process. The erosion rate was used as an indicator for cavitating jet behaviour. Specimens of commercial-purity copper were subjected to high speed submerged cavitating jets under different initial conditions, for certain time periods. The force generated by jet cavitation is employed to initiate the erosion in surface. The tested specimens were investigated with a digital optical microscope and a profilometer. It was found that erosion becomes more pronounced with decreasing cavitation numbers, as well as with increasing exit jet velocities. The nozzle configuration and hydrodynamic parameters have strong influences on the erosion rate, eroded area and depth of erosion. A comparison between the obtained results explains some of the mechanisms involved in cavitation and erosion processes and their relation to the tested parameters. Mathematical expressions which combine these parameters with the erosion rate are obtained. These parameters are very important in order to control the cavitation as a phenomenon and also to control the performance of the cavitating jet generator. Key words: Cavitation, Cavitating jet, Cavitation erosion, Vortex, Shear. 1. Introduction Cavitation causes many adverse effects that are to be avoided or at least controlled in any hydraulic facility. On the other hand, cavitation is used in many diverse scientific and industrial applications (jet cutting, under water cleaning, etc.) via cavitation clouds produced by cavitating jet generators. The impingement of a cavitating jet leads to serious erosion in valves and hydraulic equipment. In order to reduce cavitation erosion in valves and oil hydraulic equipment or to improve the performance of jet cutting or under water cleaning etc., it is necessary to have an adequate knowledge about the mechanism of erosion due to the impingement of a cavitating jet (Choi (2012), Field et al (2012), Hutli et al (2008), Soyama (2011), Soyama et al (2009), and Yamaguchi and Shimizu (1987)). The great advantage of testing erosion by the use of cavitating jet is that the cavitating jet apparatus can simulate different cavitating conditions. If a relationship between the cavitation intensity in a cavitating jet and the erosion rate of a material were investigated precisely, the key parameter to predict the cavitation erosion rate could be clarified and the performance of the cavitation generator could be increased as well (Hutli et al (2010), Minguan et al (2013) and Soyama et al (2012)). The collapses of the cavities are the origin of high pressure spikes on the target surface. The amplitude of the collapse stress pulses is varying and random, but it can reach up to 1500 MPa, which is a level of stress high enough to deform or to rupture the surface of most industrial alloys (Karimi (1986)). In addition, the collapse of cavitation bubbles produces not only mechanical impact, which normally results in cavitation erosion in fluid machinery, but also high temperature spots which have a significant thermal effect. Frequently cited studies found that a converging shock wave reflects at the bubble center, generating peak pressures and temperatures above 10 Mbar and 10 7 K in a small central region of the bubble (Wu, C.C. & Roberts, P.H. (1993), Moss, W.C., et al (1993) and Bass, A., et al (2008)). Therefor it should be noted that, in the investigation of the cavitation damage, the possible influence of the generated temperature on the target surface should be considered. The understanding of these mechanical and thermal effects and their application may be employed to improve the corrosion resistance of a material (Soyama and Asahara (1999)). The flow across the holes of a nozzle can be controlled by different factors, which may be classified under three categories: operation conditions, orifice geometry and flow properties. The importance of these parameters may be understood from the results of many authors who have investigated the performance of jets e.g. (Okada et al (1995), Soyama et al (1998), Sun et al (2005), Vijay (1991b) and Zhou and Hammitt (1983)). The aim of this study was to examine the influence of hydrodynamic conditions, such as cavitation number, exit jet velocity, and the nozzle configuration (convergent or divergent) on the behaviour of the created cavitaing jet, where the cavitation erosion of commercial copper is used as an indicator of the cavitation behaviour. In this way the performance of the cavitating jet generator can be analysed.
Transcript
1
The Relation between the High Speed Submerged Cavitating Jet Behavior and
the Cavitation Erosion Process
Ezddin Ali Farag Hutli1, Milos S. Nedeljkovic2, Nenad A. Radovic3, Attila Bonyár4
1 – Ph.D., Department of Thermohydraulics, Centre for Energy Research, Hungarian Academy of Sciences
and Institute of Nuclear Techniques,BudapestUniversityofTechnologyandEconomics,Budapest,Hungary 2– Professor, Ph.D., University of Belgrade, Faculty of Mechanical Engineering 3 – Professor, Ph.D., University of Belgrade, Faculty of Technology and Metallurgy 4 –A. Professor, Ph.D., Budapest University of Technology and Economics, Dep. of Electronics Technology
Abstract
In order to accurately and reliably evaluate the cavitation erosion resistance of materials using a cavitating jet generator,
the effects of the hydrodynamic parameters and the nozzle geometry on the erosion process were investigated. Since the
behaviour of a high speed submerged cavitating jet is also depending on the working conditions; their influence is also
discussed based on the evaluation of cavitation erosion process. The erosion rate was used as an indicator for cavitating
jet behaviour. Specimens of commercial-purity copper were subjected to high speed submerged cavitating jets under
different initial conditions, for certain time periods. The force generated by jet cavitation is employed to initiate the
erosion in surface. The tested specimens were investigated with a digital optical microscope and a profilometer. It was
found that erosion becomes more pronounced with decreasing cavitation numbers, as well as with increasing exit jet
velocities. The nozzle configuration and hydrodynamic parameters have strong influences on the erosion rate, eroded
area and depth of erosion. A comparison between the obtained results explains some of the mechanisms involved in
cavitation and erosion processes and their relation to the tested parameters. Mathematical expressions which combine
these parameters with the erosion rate are obtained. These parameters are very important in order to control the
cavitation as a phenomenon and also to control the performance of the cavitating jet generator.
Cavitation causes many adverse effects that are to be avoided or at least controlled in any hydraulic facility. On the
other hand, cavitation is used in many diverse scientific and industrial applications (jet cutting, under water cleaning,
etc.) via cavitation clouds produced by cavitating jet generators. The impingement of a cavitating jet leads to serious
erosion in valves and hydraulic equipment. In order to reduce cavitation erosion in valves and oil hydraulic equipment
or to improve the performance of jet cutting or under water cleaning etc., it is necessary to have an adequate knowledge
about the mechanism of erosion due to the impingement of a cavitating jet (Choi (2012), Field et al (2012), Hutli et al
(2008), Soyama (2011), Soyama et al (2009), and Yamaguchi and Shimizu (1987)). The great advantage of testing
erosion by the use of cavitating jet is that the cavitating jet apparatus can simulate different cavitating conditions. If a
relationship between the cavitation intensity in a cavitating jet and the erosion rate of a material were investigated
precisely, the key parameter to predict the cavitation erosion rate could be clarified and the performance of the
cavitation generator could be increased as well (Hutli et al (2010), Minguan et al (2013) and Soyama et al (2012)). The
collapses of the cavities are the origin of high pressure spikes on the target surface. The amplitude of the collapse stress
pulses is varying and random, but it can reach up to 1500 MPa, which is a level of stress high enough to deform or to
rupture the surface of most industrial alloys (Karimi (1986)). In addition, the collapse of cavitation bubbles produces
not only mechanical impact, which normally results in cavitation erosion in fluid machinery, but also high temperature
spots which have a significant thermal effect.
Frequently cited studies found that a converging shock wave reflects at the bubble center, generating peak pressures and
temperatures above 10 Mbar and 107 K in a small central region of the bubble (Wu, C.C. & Roberts, P.H. (1993), Moss,
W.C., et al (1993) and Bass, A., et al (2008)). Therefor it should be noted that, in the investigation of the cavitation
damage, the possible influence of the generated temperature on the target surface should be considered. The understanding of these mechanical and thermal effects and their application may be employed to improve the
corrosion resistance of a material (Soyama and Asahara (1999)). The flow across the holes of a nozzle can be controlled
by different factors, which may be classified under three categories: operation conditions, orifice geometry and flow
properties. The importance of these parameters may be understood from the results of many authors who have
investigated the performance of jets e.g. (Okada et al (1995), Soyama et al (1998), Sun et al (2005), Vijay (1991b) and
Zhou and Hammitt (1983)).
The aim of this study was to examine the influence of hydrodynamic conditions, such as cavitation number, exit jet
velocity, and the nozzle configuration (convergent or divergent) on the behaviour of the created cavitaing jet, where the
cavitation erosion of commercial copper is used as an indicator of the cavitation behaviour. In this way the performance
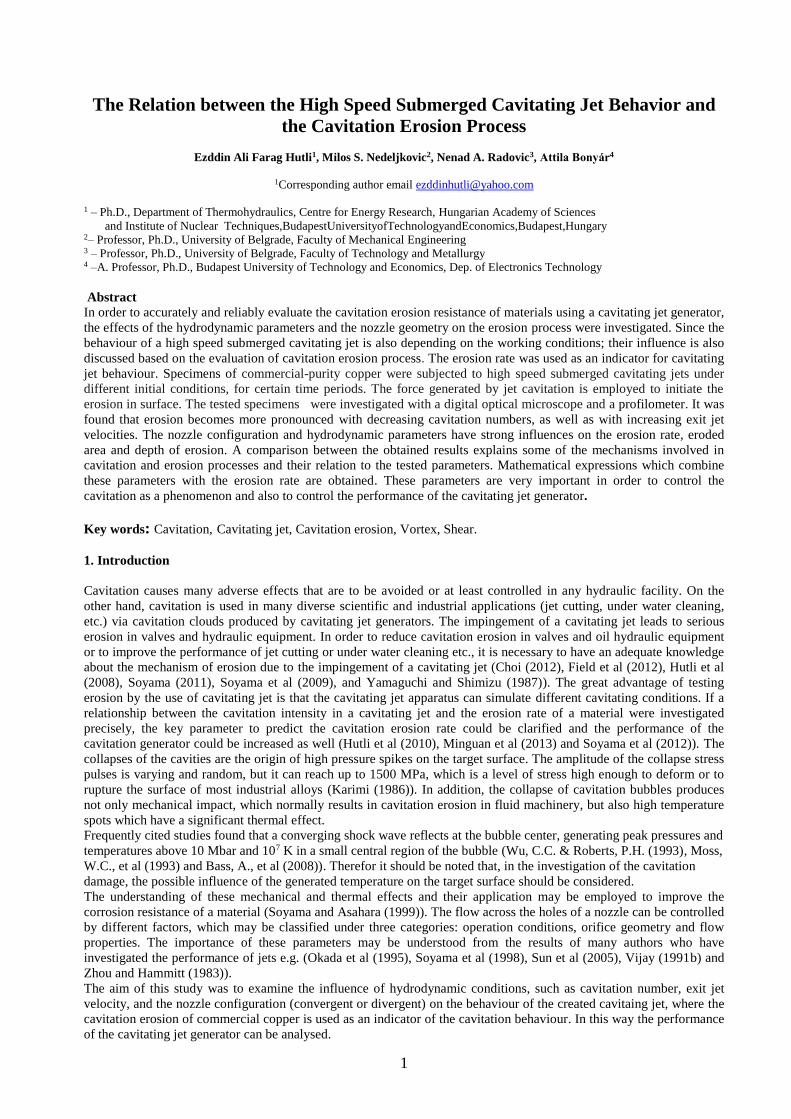
2.1 Cavitation Erosion Parameters and Erosion Quantification
The cavitation number was calculated as 2
refvref 5./ .. ρVoppσ . It represents a measure of resistance
of the flow to the incidence of cavitation, since the lower it is, the more intensive the cavitation will be. The value of
3
this parameter was obtained by measuring the upstream and downstream pressures, and by calculating the reference
velocity from the measured flow-rate. refp is the reference pressure (2p ),
vp is the vapour pressure, is the
density, and refV is the reference velocity (
refV = exit jet velocity (JV )). At regular intervals, the specimen was
carefully removed from the chamber, dried sufficiently and then submitted to further analysis. Usually, the rate of mass
loss, the rate of volume loss or the rate of the mean depth of penetration are used as good measures of the erosion
intensity. In this paper, the erosion rate tWRE /.. was used as the index to quantify the erosion, where W is
the mass of the specimen (Soyama et al (1998)). In addition, a profilometer was used to quantify the erosion area
(cutted) and the depth of the cutting.
(a) (b)
Figure 2. (a) Geometrical parameters of the nozzle (b) Ways of nozzle installation. (dimensions in mm)
2.2 Error Analysis of the Measured Quantities (Experimental Uncertainty)
All the apparatus in the facility (cavitating jet generator) were calibrated in order to obtain results with a high accuracy.
The pressure transducers used to measure the upstream and downstream pressure were calibrated precisely with a
reference pressure transducer (HUBER), then the flow rate for the different nozzle diameters and different directions of
flow were measured precisely in order to obtain the constant k in different cases for the calculation of the exit jet
velocity (JV ). The temperature sensors in the test rig were calibrated perfectly by the use of a NORMA type a digital
thermometer as the reference in the calibration process. The upstream pressure (1p ) and the downstream pressure
(2p ) were measured at the inlet and outlet of the test chamber, respectively. The pressure transducers were calibrated
by the manufacturer and accuracy certificates were issued for a maximum error of + 0.2/– 0.21 %FS. As the flow rate
was determined by using the P1 and P2 values from a previous nozzle calibration, the uncertainty in the determination
was also of the order of +/– 0.3 %FS. In order to assess the reproducibility and error reduction of the erosion loss, three
specimens were exposed to the cavitation in each step. The average value of loss was used for further calculations. The
mass loss was measured by using a high precision balance (METTLER AE 100), with a sensitivity of 0.1 mg.
3. Basic Mechanism of the Cavitation Phenomenon Generated by a Cavitating Jet Generator
When the jet penetrates the stagnant water in the test chamber, a shearing force is generated between them (the shearing
force is depending on the velocity gradient), which results in the generation of a vortex. The existence of a vortex can
be verified and tested by many parameters such as the circulation parameter ( ), the vorticity ( ), the centrifugal
force ( Fc ) and the energy of the vortex. The change from a constant vorticity to a radially varying vorticity is much
sharper for a turbulent vortex ring. In a turbulent field, the presence of additional vortices with random circulations in
the neighbourhood will disturb the closed streamline pattern around any vortex (Soyama, H., et al (1998)). However, in
general, in a turbulent flow (single phase), the portions of the fluid move both horizontally and vertically and there is a
continuous "mixing of particles". Some move upwards and some downward according to a stochastic process. Portions
of fluid move irregularly causing a continuous exchange of momentum from one portion of the fluid to another and this
momentum exchange is the reason for the turbulent shear stress, which is also called the Reynolds stress. In the case of
cavitating jets (two phase flow), part of the momentum exchange is established by the change of the phase (density
change), and also, because the Prandtl mixing length theory, which is based on the assumption that a fluid parcel has to
travel over a length lm before its momentum is transferred. Basically, for single phase flow it is easy to understand the
concept of the mixing length: since turbulent stress is caused by momentum transfer, it is useful to have a physical
length that defines when the momentum has been transferred (Agrawal and Prasad (2003)). For two phase, highly
turbulent flow, as in the cavitating jets, this is more complicated. Maybe, it can be assumed that the mixing length is
equal to the width of the jet at a given point, which can be used as an indicator for jet spreading. In the case of
4
cavitating jets created by a circular nozzle, the initial vortex of the jet produces a nearly axisymmetric low pressure.
This low pressure leads to the formation of ring-like cavitation bubbles in the near field of the jet. In the early stages of
jet development process, cavitation bubbles, which are generated inside the starting vortices, are sometimes connected
with each other in the form of a ring. The bubble rings travel downstream with the initial vortices and often survive for
a certain distance (Hutli, E., et al., (2013)). In the later stages of jet development, isolated bubbles are formed behind
the initial vortices; some of them are formed in groups, while others are randomly distributed in the shear layer of the
jet. The stability of a vortex cavitation ring is depending on the intensity of turbulence (injection pressure and velocity
distribution), the pressure in the test chamber and the stage life of the bubbles (rebounding and collapsing). As the exit
velocity is increasing (assuming the other parameters are constant), the vortex generation rate increases, which means
an increased number of cavitation bubbles. Also, as the downstream pressure (pressure inside the test chamber)
decreases, the rate of vortex generation increases because the jet can easily rotate the stagnant liquid and produce a
vortex (Hutli, E., et al., (2013)). In the case of high speed, continuously submerged cavitating jets, it is a complicated
task to describe the mechanism of vortex creation, since there is a two phase flow in addition to the rebounding and
collapsing of the cavitation bubbles, which frequently occurs along the jet trajectory producing very fast micro and
nano jets and shock waves. These liquid jets produce many new vortexes; in fact, thereby turbulent flow and chain
vortex production exist (Hutli, E., et al., (2013), Katepalli (1999)). Fig.3. shows examples for the vortex rings in several
different cases: in the simple case of an air jet (pulsed jet) (a), a submerged liquid jet in the same type of liquid (no
cavitation) (c), a submerged cavitating jet (pulsed) (DYNAFLOW, INC) (c) and a submerged cavitating jet
(continuous) (d). In the air jet it can clearly be seen how the vortex rings shift positions during their movement.
4. Flow characteristics of a cavitating jet (cavitation clouds)
The flow structure in the near field of the jet and in the jet itself is complex. As it is well known, the cavitating flow is
treated as a two-phase flow, which consists of a continuous liquid phase and a dispersed gaseous phase in the form of
bubbles in cavity clouds. In this kind of flow a relative motion exists between the bubbles and the surrounding fluid. In
many cases, the transfer of mass and/or heat is important. Cavity flows behave very differently from single-phase flows.
The presence of a second phase with significantly different density, viscosity and elasticity considerably alters the
effective properties of such a mixture. The interfaces between the liquid and the gas phase are deformable and unsteady.
Encounters between bubbles can lead to bouncing or coalescence. Bubbles may accelerate, deform, execute shape or
volume oscillations or even break up (collapse) (Sridhar, G. and Katz, J., (1995)). Since in our case a continuous jet is
used, the cavitation can be treated as a fast phenomenon (varying in order of few µs), the vortex ring does not appear
clearly, and also the oscillation and collapse of the individual bubbles cannot be seen. In order to describe the flow
characteristics, because of the reasons mentioned earlier, we can follow only the shedding and discharging of the cavity
clouds, in a macro level. As it is already shown in pervious publications, the characteristic unsteady motion of
cavitation clouds can be perceived through the observation of the cavitating area by using a high-speed video camera
(100,000 f/s). It was noted that the shedding pattern has a periodic character, although it does not stay regular for a long
time and it may change with the variation of the working conditions as could be seen in Fig. 4. The imperfect shedding
pattern could be the result of the incompatibility between the test equipment (nozzles, feed pumps, test chamber, and
recording system) (Hutli, E. and Nedeljkovic, M., (2008)). In general as it appears, the cloud expands almost to the
middle of the trajectory, which distance depends on the working conditions. The leading part of the main cavitating jet
moves gradually toward the target and then the jet shows a shrinking motion in the diameter close to the exit of the
nozzle, as can be clearly seen in the case of convergent nozzle in Fig. 4.
5
Figure3. The vortex ring in (a) an air jet (b) a submerged cavitating jet (pulsed) (DYNAFLOW, INC), (c) a turbulent
jet of water emerging from a circular orifice into a tank of still water (one phase) Katepalli (1999), (d) a submerged
cavitating jet (Hutli et al., (2013)).
Figure.4 High-speed camera images (24000 f/s, 512*128) of the shedding patterns. (a) Convergent nozzle
(P1 = 105 bar, P2 = 2.06 bar, VJ = 96.5 m/s, = 0.044, T = 18.5 oC). (b) Divergent nozzle (P1=90.5 bar P2 = 1.89 bar, VJ
= 23.4m/s, σ = 0.69, T = 20 oC), (C) Convergent nozzle (P1 = 177 bar, P2 = 2.06 bar, VJ = 125.7m/s, = 0.026,
T = 18.5 oC).and (d) divergent nozzle (P1 = 267 bar, P2 = 1.89 bar, VJ = 40.5m/s, = 0.23, T = 20 oC). The flow
direction is from left to right (Hutli and Nedeljkovic (2008)).
This shrinking motion in the cloud diameter does not appear clearly in the case of a divergent nozzle, while for a
convergent nozzle this phenomenon usually could be observed. This cloud shrinking motion moves toward the
upstream direction. At the same time some downstream clouds, which have already shrunk, change to a growing stage
6
and translate toward the downstream direction. This re-entrant motion reaches the nozzle exit and then changes to a new
shedding motion of a cavitation cloud in the reverse direction. As it appears in some images, there are discontinuous
parts of the cavitation clouds, which are caused by the arrival of the reentrant motion at the nozzle exit (Fig. 4). The
leading part a of new cavitating cloud, defined at this point of discontinuity, moves downstream with a certain speed
depending on the working conditions. The analysis of long recordings (some hundreds frames obtained with a shutter
time of 20 µs) revealed that the cavitation phenomenon appears to have a chain reaction behavior. As a result, the new
cavitating jet grows and develops in a coalescing manner with some already existing clouds and then moves
downstream from the exit of the nozzle. Also it could be noticed from Fig.4, that the cavity clouds do not keep their
shape, they are changing with time and position, which changes are related to the forces acting on the clouds. In
general, the forces acting on the bubble or on the cavity cloud are composed of separate and uncoupled contributions
from pressure gradient, drag, lift due to vorticity, virtual mass, hydrodynamic interaction forces (hydrodynamic
interactions between adjacent bubbles) and gravity (Sridhar, G. and Katz, J., (1995)). Therefore, as the clouds are
subjected to static and dynamic forces, their volume and area are changing, thus the calculated speed (V) does not
exactly represent the jet speed (VJ).
The effects of the geometrical and hydrodynamic parameters can be understood based on Fig.4. In the case of a
divergent nozzle with low injection pressure (Fig.4(b)) the shedding of cloudlike cavity may be depending on the
weakening of vortex formation and the increase of three dimensional disturbance on the separated shear layer (Sato, K., and Yasuhiro, S., (2003)). But in the case of high injection pressure for both cases (convergent and divergent), the
reason for the unclear distinguishing between both shedding and discharging processes is related to a strong vortex
formation, the inherent compact behavior of the shear layer and the length of cavitating area, and in addition to the fast
formation of vortex cavitation and their interaction with each other. Based on this result it should be noted that the
shedding frequency at low pressures and the influence of nozzle geometry remains to be further examined from the
point of view of vortex behaviour on the shear layer.
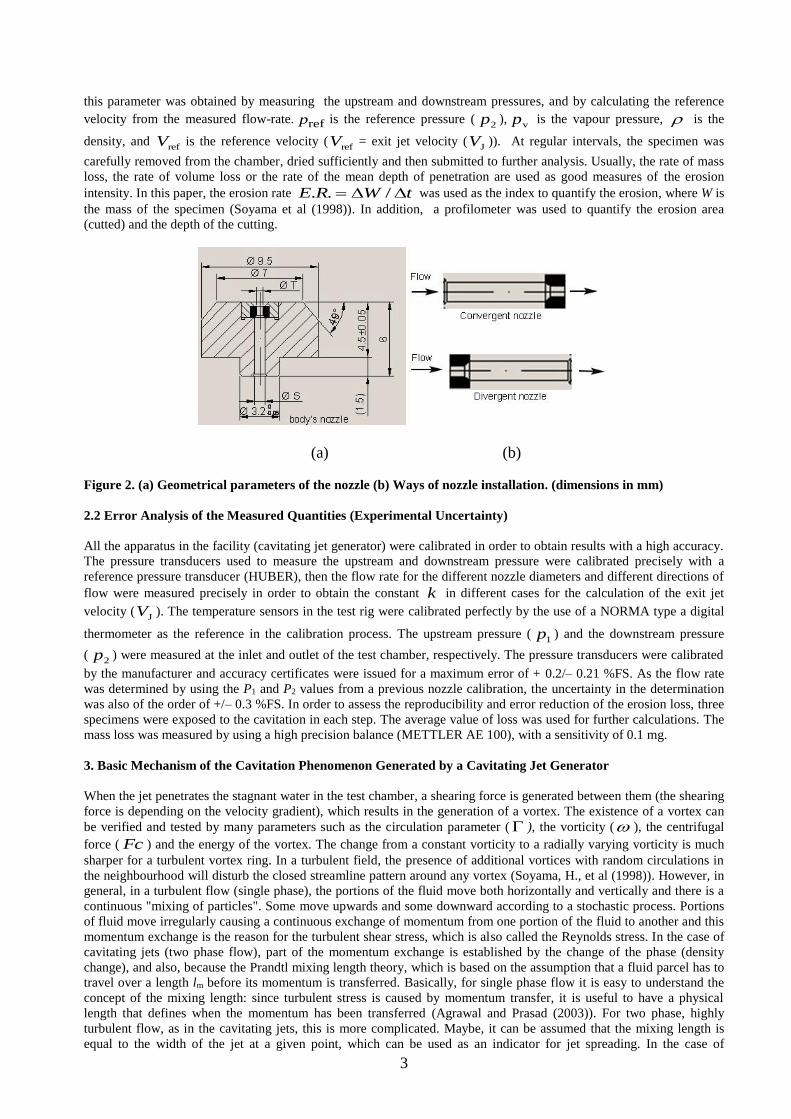
Cloud dynamics, which gives information about the strength and compactness of objects (cavitation clouds) is obtained
through image processing at pixel level using a special program with Matlab. As can be seen in Fig. 5 the changes in
the intensity reflect the changes in the size and shape of the cavitation bubbles. However, due to the scattering of the
light at the gas-liquid interface the edges of the bubbles can be blurred and hard to precisely indentify.
Also the translational speed of the leading part of the cavitating jet was calculated by using a given number of
consecutive frames (with a known frame rate) and by measuring the differences between the positions of the leading
part of cavity clouds in the consecutive frames. It was found that in the beginning the speed remains constant, then
acceleration and de-acceleration processes take place. As a result a new pressure distribution map is assumed to be
formed. In fact this speed does not represent the real speed of the cavity clouds, since the cavitating jet is varying during
its life, i.e. it undergoes in many process as mentioned earlier.
(a) (b)
Figure 5(a&b) 2D consecutive images (42µs time difference between images (a) and (b)) showing the strength and
compactness of cavitation clouds, obtained by image processing. (Divergent nozzle (Din=0.45 and Dout=1mm)
(P1 = 267 bar, P2 = 1.89 bar, VJ = 40.5 m/s, = 0.23,, T = 20 oC).
5. Fluid-solid interaction and Cavitation damage model
The scenario of solid and fluid interaction in the case of cavitating jets could be explained in two levels: macro and
micro scale levels. In the macro scale level the clouds and rings are considered as one unit, which, at the beginning of
the test, hits the surface of the specimen. The contact surface, where the cavitation cloud hits the sample has a ring
shape. In this area of contact the force of the cavitation cloud can be resolved into two components, normal and shear.
The shear component in the specimen can either move it or, in the case of a mounted sample can produce plastic
deformation. Therefore, the plastic deformation is localized in the area of the ring. With time the deformation becomes
more pronounced.
In the micro level scenario as our model illustrates in Fig. 6 (based on the assumption that the cloud is composed of
small bubbles), the cavitation cloud ring collapses at the moment of impact with the surface of a specimen. At that very
moment, the cavitation ring becomes divided into a large number of small bubbles. The newly formed bubbles and
7
which resemble the cavitation cloud are neither equal in size or in strength. The space between them is very small,
allowing the liquid to flow between them and to accelerate (micro jets). This acceleration leads to an increase in kinetic
energy. Due to differences in the sizes and positions of the bubbles, when they collapse, the formed “micro jets” now
hit the specimen at angles other than 90o, thus introducing a shear stress component at the surface, as can be seen in
Fig.6a. This shear component seems to be sufficient to initiate plastic deformation on the surface of the specimen. After
this initial step, further micro jets hit the roughened surface, Fig.6 ( b,c), leading to the commencement of rupturing of
the surface and finally to its erosion Fig.6(d).
It is not easy to predict the number of the bubbles in the cavitation cloud, especially when the cavitating jet is
continuous, therefore we should deal with the cloud as one unit. The strength of the clouds is the function of many
parameters such as bubble content, shape of the bubbles, number of bubbles in the cloud, pressure around the cloud,
working fluid temperature, forces acting on the cloud etc. The micro-jets and shockwaves are results of bubble
collapsing. The velocity of the micro/nano-jets is a function of the position of the bubble collapse. Some literature
reported that the maximum jet velocities are between 50 and 100 m/s. Reported values of the local material stress
induced by the micro-jets are from 100 to over 1000 MPa (Karimi, A., and Martin, J.L (1986)). Others a maximum jet
velocity of 950 m/s (Emil A.B., et al. (2001)).
Fig.7 shows the deformation stages caused by cavitation on the target surface. By increasing the exposure time, the
damage done by cavitation can move beyond plastic deformation. Erosion may occur which removes material from the
sample surfaceas observed in this case of Cu sample after 600 s exposure time. The determination of incubation time
(which is needed to reach the erosion stage) or studying the effect of the exposure time on the cavitation damage
(surface topology and cavitation erosion) is beyond the scope of our current paper. In order to show the earlier stages of
cavitation damage Fig. 7 shows the nano and micro level of the cavitation damage and the characteristic features on the
specimen's surface with Atomic Force Microscopy (AFM) images. These measurements were done on a JEOL SPM
5200 in room temperature at the NanoLab, University of Belgrade, Faculty of Mechanical Engineering. More
information regarding these experiments can be found in our earlier publication (Hutli, et al. (2013)). .
Figure 6. Sketch of the specimen surface during erosion test: (a) start of the test: contact between cavitating jet and
smooth specimen; (b) roughened surface after deformation on the surface; (c) contact between cavitation cloud and
roughened specimen; (d) start of rupturing on specimen surface.
(a) (b) (c) (d)
Figure 7. 3D topography AFM images of the investigated Cu samples (a) before cavitation attack (no damage), (b)
after 15 s test, (only plastic deformation), (c and d) after 600 s test ((d) cavitation erosion). The images are not from the
same point on the surface (Hutli et al.(2013)).
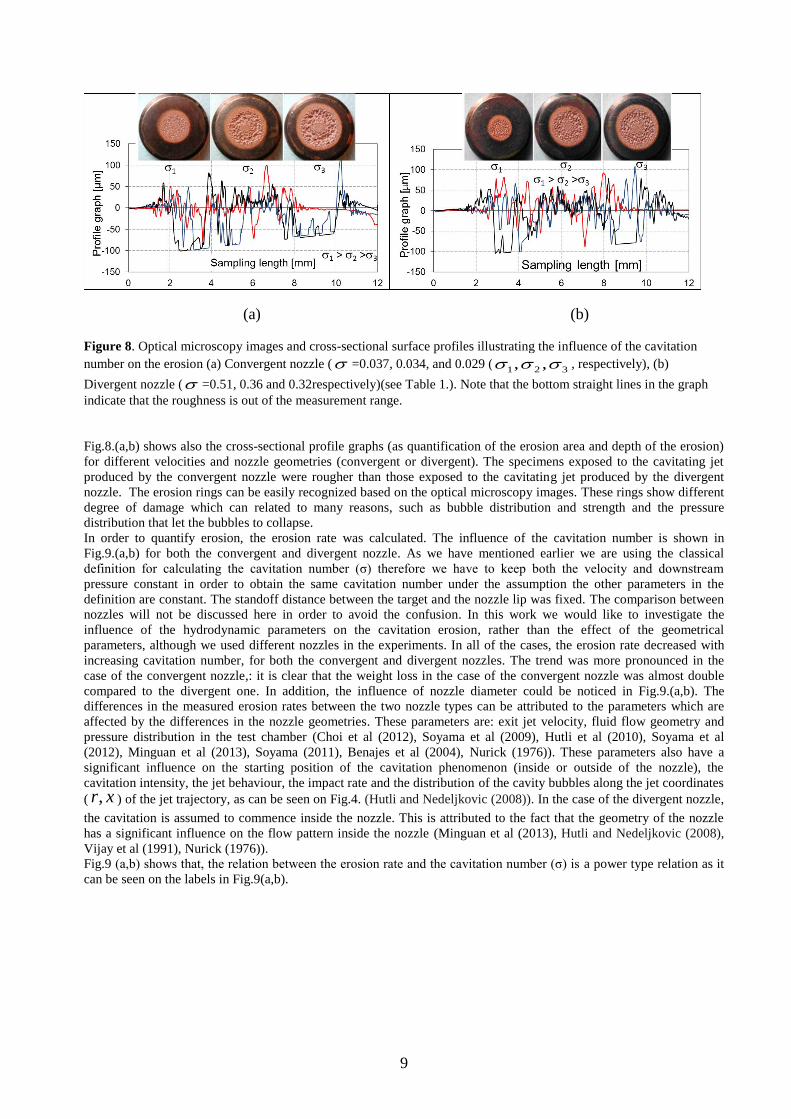
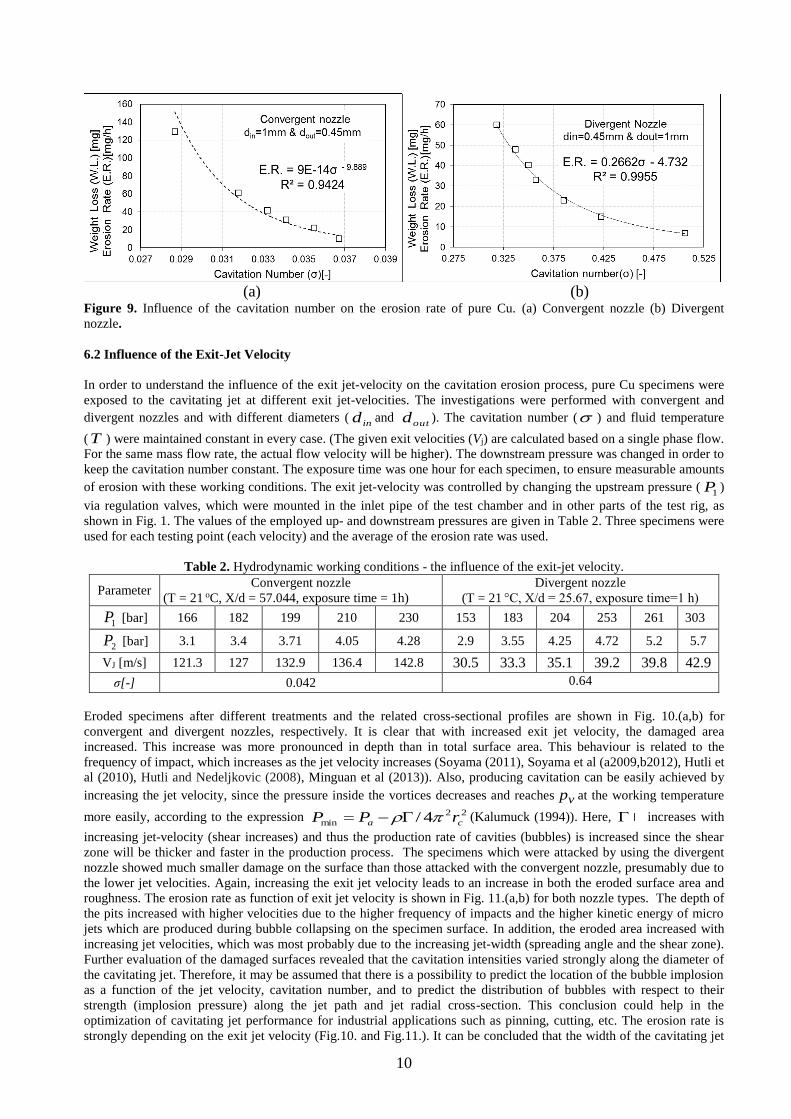
6. Results and Discussion
6.1 Influence of the Cavitation Number ( )
8
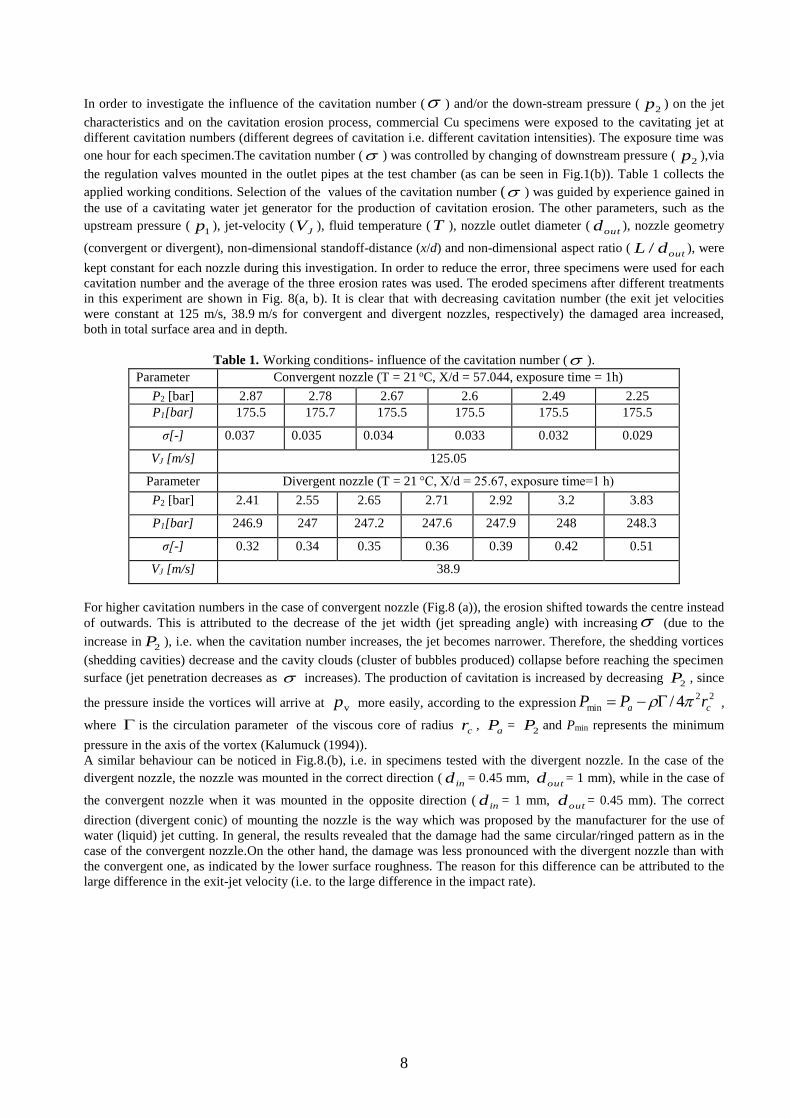
In order to investigate the influence of the cavitation number ( ) and/or the down-stream pressure (2p ) on the jet
characteristics and on the cavitation erosion process, commercial Cu specimens were exposed to the cavitating jet at
different cavitation numbers (different degrees of cavitation i.e. different cavitation intensities). The exposure time was
one hour for each specimen.The cavitation number ( ) was controlled by changing of downstream pressure (2p ),via
the regulation valves mounted in the outlet pipes at the test chamber (as can be seen in Fig.1(b)). Table 1 collects the
applied working conditions. Selection of the values of the cavitation number ( ) was guided by experience gained in
the use of a cavitating water jet generator for the production of cavitation erosion. The other parameters, such as the