Top Incomes and the Great Recession: Recent Evolutions and Policy Implications Thomas Piketty Paris School of Economics Emmanuel Saez University of California, Berkeley Paper presented at the 13th Jacques Polak Annual Research Conference Hosted by the International Monetary Fund Washington, DC─November 8–9, 2012 The views expressed in this paper are those of the author(s) only, and the presence of them, or of links to them, on the IMF website does not imply that the IMF, its Executive Board, or its management endorses or shares the views expressed in the paper. 13 TH J ACQUES P OLAK A NN UAL R ESEARCH C O N FERE N CE N OVEMBER 8–9,2012
Transcript
Top Incomes and the Great Recession: Recent Evolutions and Policy Implications
Thomas Piketty Paris School of Economics
Emmanuel Saez
University of California, Berkeley
Paper presented at the 13th Jacques Polak Annual Research Conference Hosted by the International Monetary Fund Washington, DC─November 8–9, 2012 The views expressed in this paper are those of the author(s) only, and the presence
of them, or of links to them, on the IMF website does not imply that the IMF, its Executive Board, or its management endorses or shares the views expressed in the paper.
Top Incomes and the Great Recession:Recent Evolutions and Policy Implications �
Thomas Piketty, Paris School of Economics
Emmanuel Saez, University of California at Berkeley
October 26 2012(Conference draft)
Abstract
This paper presents new �ndings from the World Top Incomes Database (WTID) anddiscusses some of their policy implications. In particular, we provide updated top incomeseries for the US - including new estimates for 2010, showing a strong rebound of the top1% income share, following the 2008-2009 sharp fall. We also present updated series forother developed countries (including the UK, France, Germany and Japan). In light ofthis new, extended set of country series, we analyze the relative importance of marketand institutional forces in explaining observed cross-country trends, and the likely impactof the Great recession on these long term evolutions. We discuss the policy implicationsof our �ndings, both in terms of optimal tax policy and regarding the interplay betweeninequality and macroeconomic fragility.
�Thomas Piketty, Paris School of Economics, [email protected]; Emmanuel Saez, University of Calforniaat Berkeley, [email protected]. Paper prepared for the 2012 IMF Annual Research Conference and the IMFEconomic Review. We are grateful to the editors for helpful comments.
1 Introduction
The share of national income accruing to upper income groups has increased sharply in recent
decades, particularly in the United States. The top decile income share has rosen from less than
35% during the 1970s to about 50% in recent years. This comes mostly from the very top. The
top percentile income share itself has more than doubled, from less than 10% in the 1970s to
over 20% in recent years. As a consequence, low and middle incomes have grown much less than
what aggregate GDP growth statistics would suggest. A similar trend has also taken place in a
number of other countries, especially English speaking countries, but is much more modest in
continental Europe or Japan.
This trend toward rising income concentration has raised growing concerns about both equity
and e¢ ciency. First, it is unclear whether rising US inequality can be justi�ed by incentive
considerations. There is a heated debate in the US and elsewhere about the extent to which
progressive tax policy should and could be used to reverse trends in the distribution of market
income and welfare. Next, a number of observers have argued that rising top income shares
might have exacerbated �nancial fragility, thereby imposing additional welfare costs.
In this paper, we present new �ndings from the World Top Incomes Database (WTID) and
discuss some of their policy implications.
In particular, we provide updated top income series for the US - including new estimates for
2010, showing a sharp rebound of top 1% share, following the 2008-2009 fall. We also present
updated series for other developed countries (including the UK, France, Germany and Japan).
In light of this new, extended set of country series, we analyze the relative importance of market
and institutional forces in explaining observed cross-country trends, and the likely impact of
the Great recession on these long term evolutions (section 2).
We then discuss the policy implications of our �ndings, both and in terms of optimal tax
policy for top incomes (section 3), and regarding the interplay between inequality and macro-
economic fragility (section 4).
2 New �ndings from the World Top Incomes Database
The World Top Incomes Database (WTID) is a collective project (Alvaredo et al, 2011). Be-
ginning with the research by Piketty (2001, 2003) of the long-run distribution of top incomes in
1
France, a succession of studies has constructed top income share time series over the long-run
for more than twenty countries to date. These works have generated a large volume of data,
which are intended as a research resource for further analysis. This is by far the largest historical
inequality data set available so far.
The WTID aims to providing convenient on line access to all the existent series. This is an
ongoing endeavour, and we will progressively update the base with new observations, as authors
extend the series forwards and backwards. The �rst twenty-two country-studies have been
included in two volumes (Atkinson and Piketty, 2007, 2010). As the map below shows, around
forty-�ve further countries are currently under study. Although the present paper chooses to
focus upon the �ndings obtained for developped countries (and particularly for the US), the
database aims to include a growing number of emerging countries.
The basic methodology used in the WTID following the pioneering work of Kuznets (1953).
That is, we use income tax data to compute top income series, and national accounts to compute
aggregate income. The key advantadge of these data sources is that they are available on a long
run, annual basis for a large number of countries. Also, administrative tax data is generally
of higher quality than household survey data, which often su¤ers from severe sampling and
self-reported biases (especially at the top of the distribution). There are limitations with our
approach, however, in particular due to the exclusion of tax exempt income (either tax exempt
capital income or transfer income), as we shall see below.
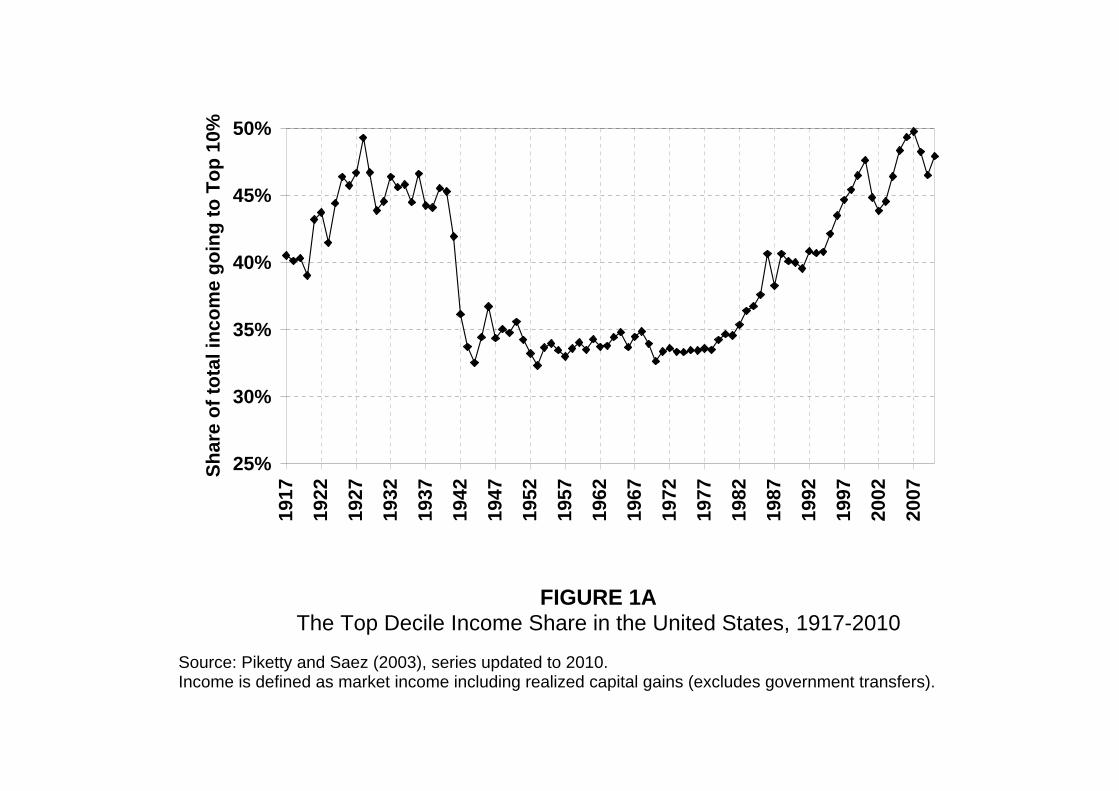
We start by presenting the updated version of what is probably the most spectacular result
coming from the WTID, namely the very pronounced U-shaped evolution of top income shares
in the US over the past century (Piketty and Saez (2003), series updated to 2010). The share
of total market income going to the top decile was as large as 50% at the eve of the 1929 Great
Depression, fell sharply during the 1930s and - most importantly - during World War 2, and
stabilized below 35% between the 1940s and the 1970s. It then rose gradually since the late
1970s-early 1980s, and is now close to 50% once again (see Figure 1A).
Several remarks are in order. First, the interesting new �nding here is that the Great
Recession of 2008-2009 seems unlikely to reverse the long run trend. There was a sharp fall in
the top decile share in 2008-2009, but it was followed by a strong rebound in 2010. We do not
have income tax return data for 2011-2012 yet, but all the evidence we have - e.g. regarding
corporate pro�ts or �nancial bonuses - suggests that the rebound might be continuing in 2011-
2
2012. This would be consistent with the experience of the previous economic downturn: top
income shares fell in 2001-2002, but quickly recovered and returned to the previous trend in
2003-2007.
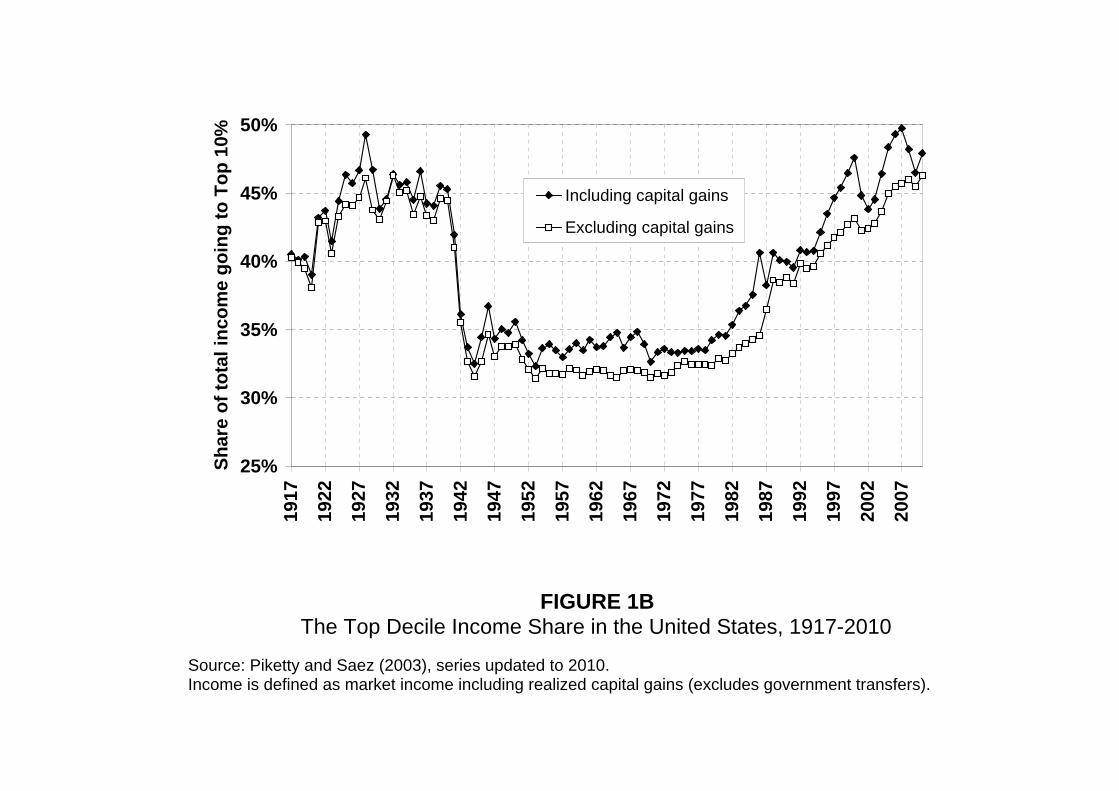
Another piece of evidence that is consistent with this interpretation is given by Figure 1B.
If we take away capital gains - unsurprisingly the most cyclical component of income - one
can see that the upward trend has continued since 2007. This strongly suggests that the Great
Recession will only depress top income shares temporarily and will not undo any of the dramatic
increase in top income shares that has taken place since the 1970s. Indeed, excluding realized
capital gains, the top decile share in 2010 is equal to 46.3%, higher than in 2007.
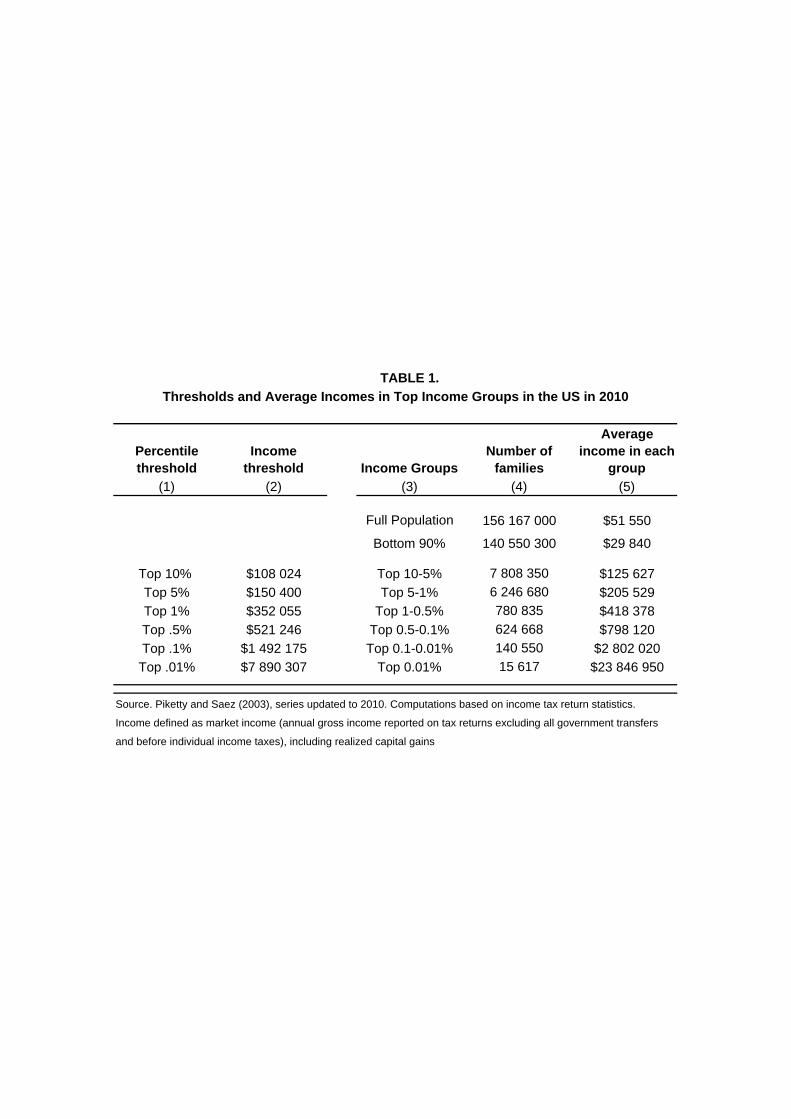
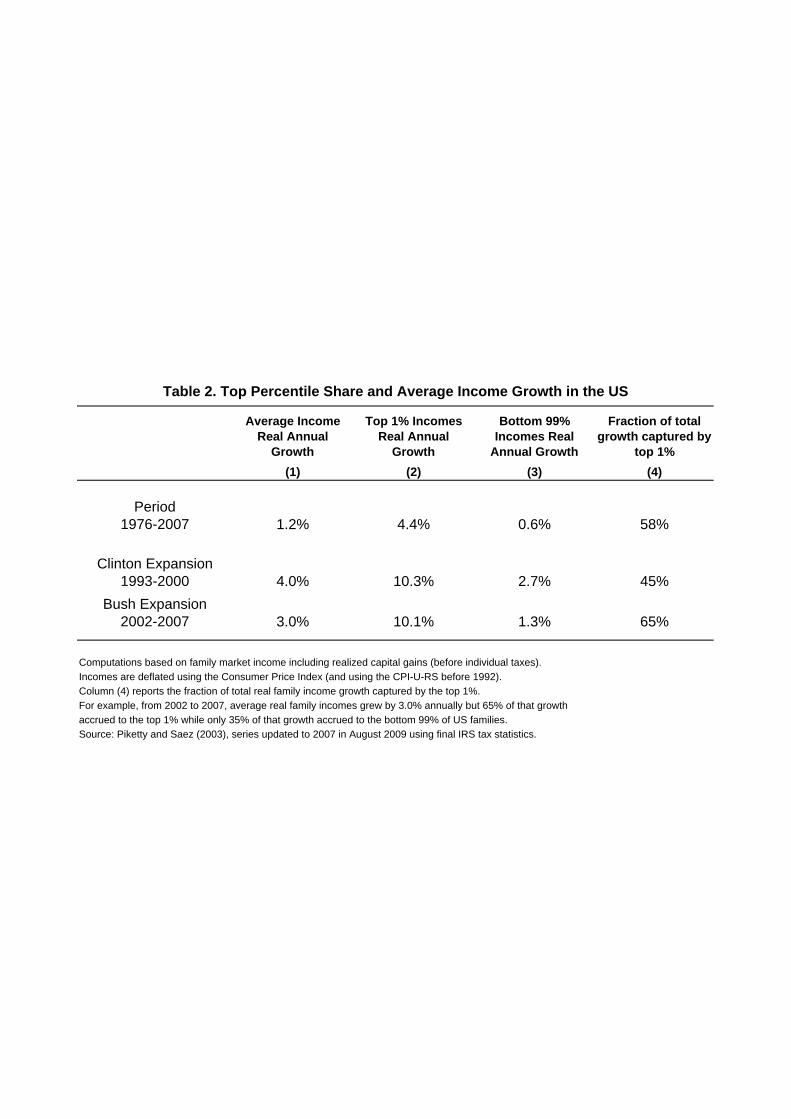
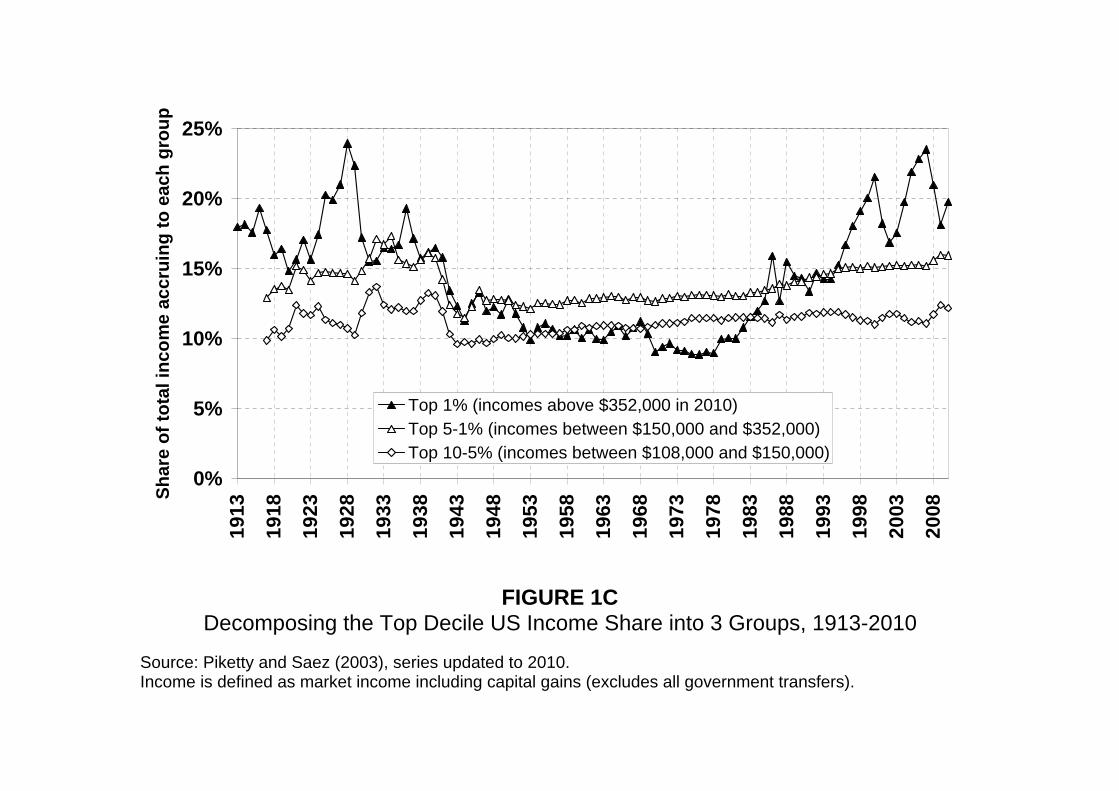
Next, it is worth stressing that the orders of magnitude are truly enormous. More that 15%
of US national income were shifted from the bottom 90% to the top 10% in the US over the
past 30 years. In e¤ect, the top 1% alone has absorbed almost 60% of aggregate US income
growth between 1976 and 2007 (see Figure 1C and Tables 1-2).
These results illustrate why it is critical to use administrative tax data to study trends in
income distribution. With standard surveys based upon limited sample size and self-reported
income (such as the Current population survey), one can measure adequately the evolution of
the 90-10 threshold ratio - but one cannot measure properly incomes above the 90th percentile,
and therefore one largely misses the magnitude of the trend that has been goig on.1
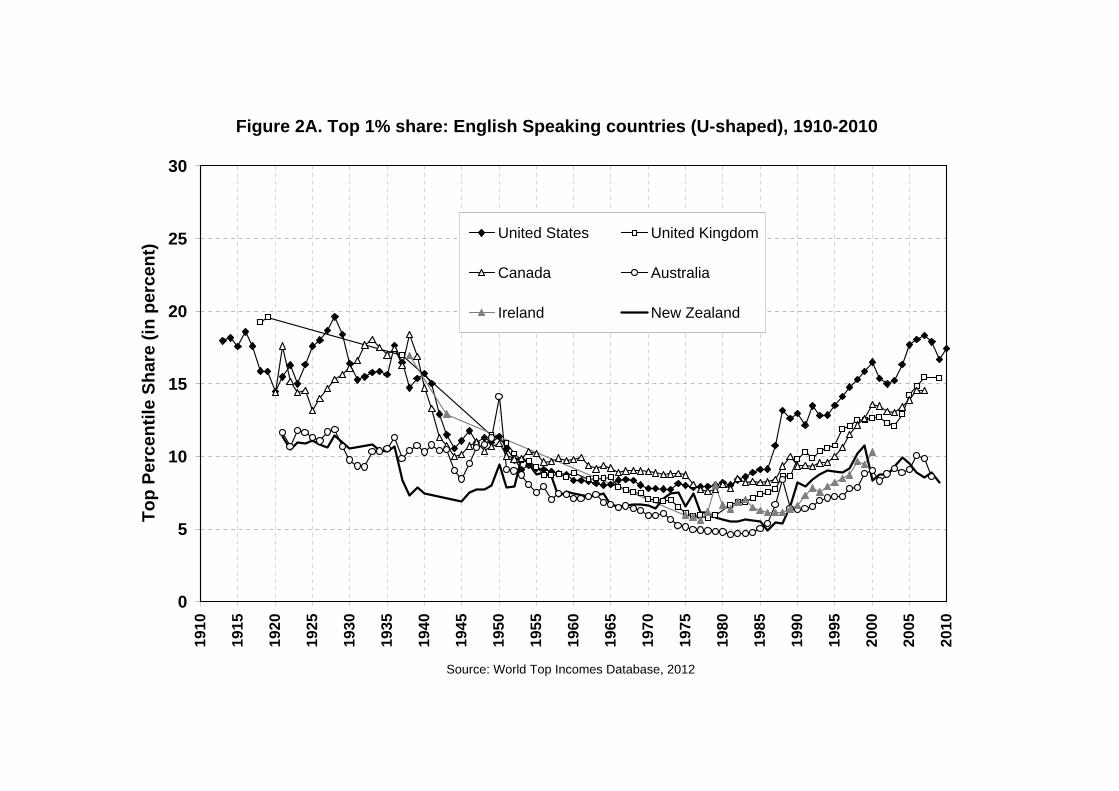
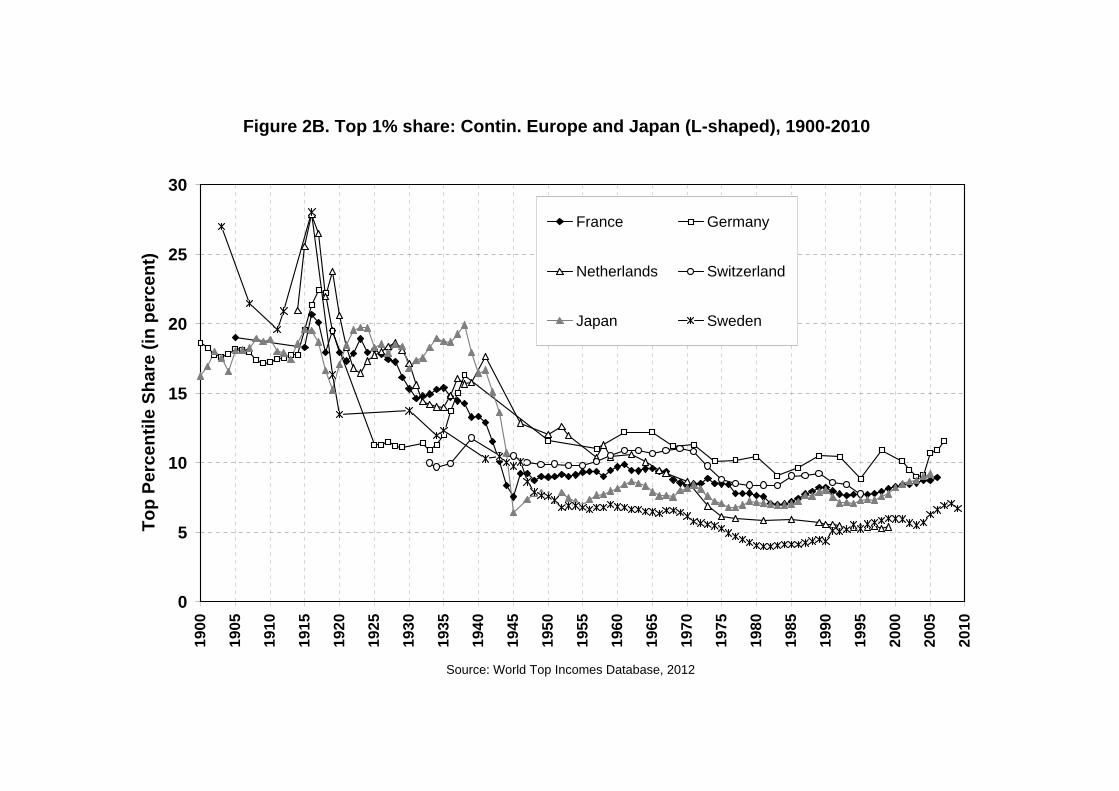
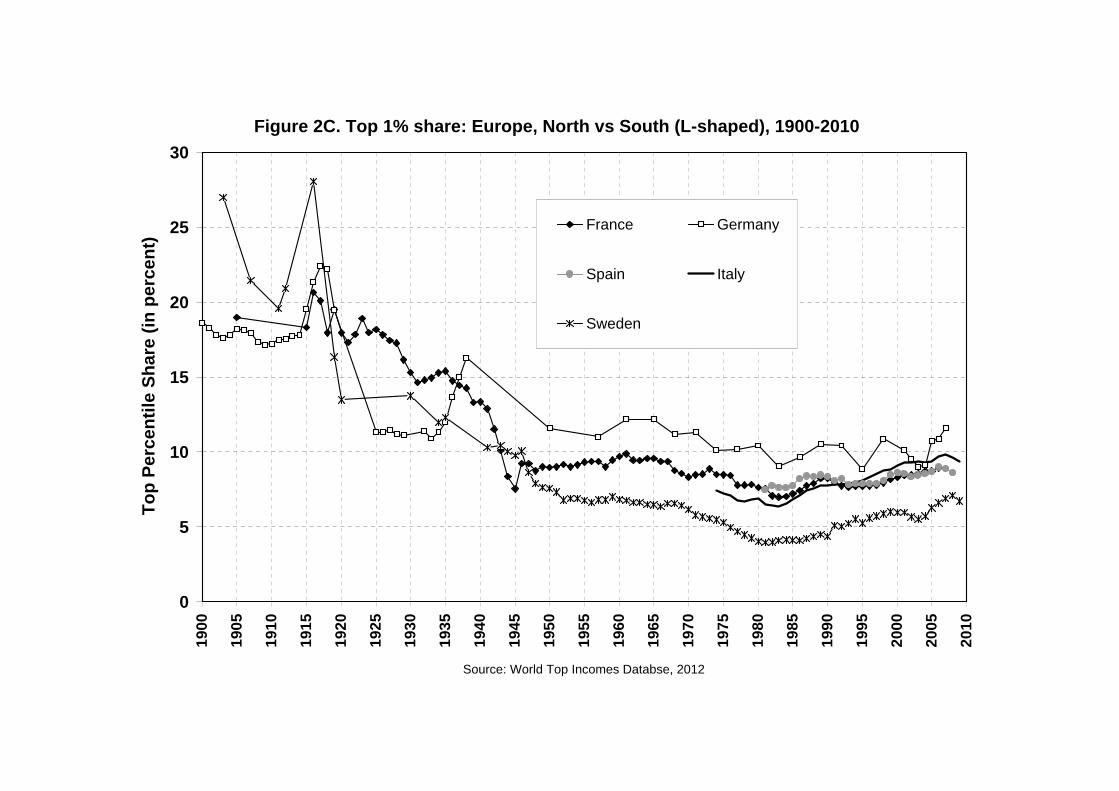
Next, it is striking to see that a similar - although smaller - trend has been going on in the
UK and in Canada, but not in Continental Europe and Japan, where the long pattern of income
inequality is much closer to a L-shaped than to a U-shaped curve (see Figures 2A-2C).
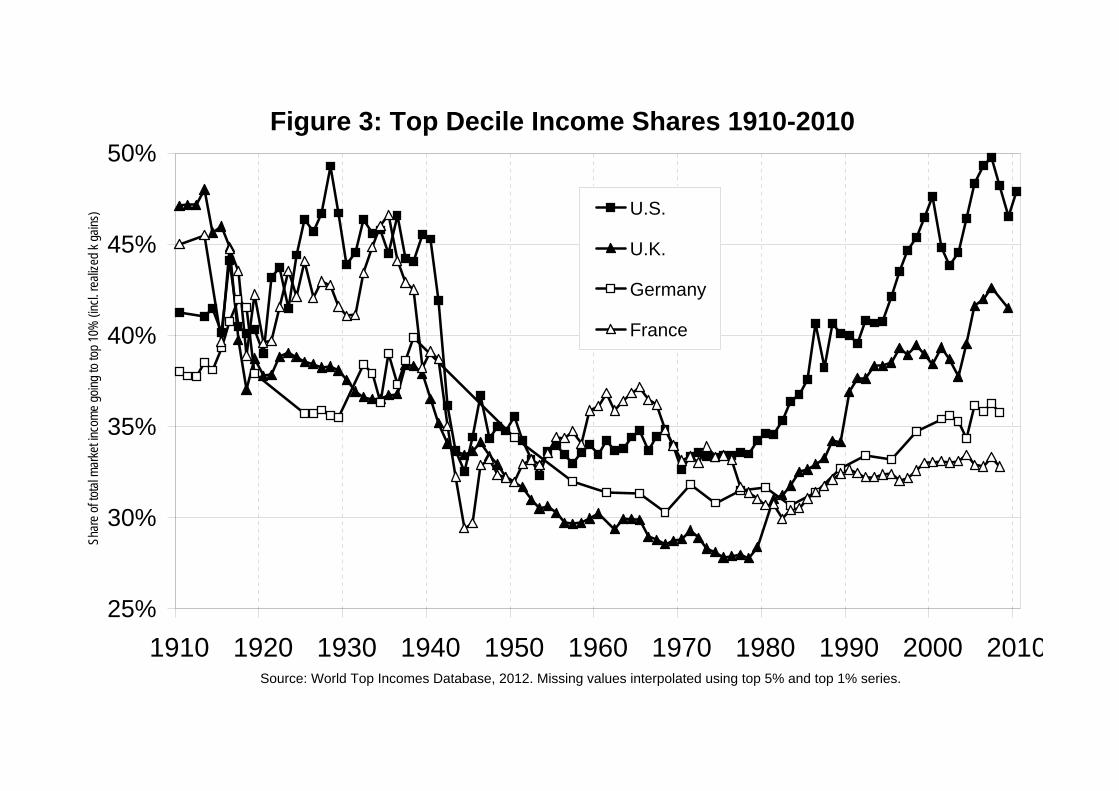
It is particulary striking to compare the evolution of the top decile share in the US, the
UK, Germany and France over the past century (see Figure 3). The US seems to be heading
back towards 50% of total income going to the top decile, the UK seems to be following this
trend, while Germany and France appear to be relatively stable around or below 35% - not
too much above the low levels observed in the 1970s-1980s, and very close to those prevailing
in the 1950s-1960s. To us, the fact that countries with similar technological and productivity
evolutions have gone through such di¤erent patterns of income inequality - especially at the
very top - strongly support the view that institutional and policy di¤erences play a key role
in these transformations. Purely technological stories based solely upon supply and demand
1For a comparaison between the trends obtained with administrative tax data and those obtained by scholarsusing CPS data (such as Burckauser et al 2009), see Atkinson, Piketty and Saez (2011, Figure 11).
3
of skills can hardly explain such diverging patterns. Changes in tax policies look like a more
promising candidate. We return to this below when we discuss optimal tax policies.
Another interesting lesson emerging from our historical perspective is the comparison be-
twwen the Great Depression and the Great Recession. Downturns per se do not seem to have
long run e¤ects on inequality, even when they are very large. The reason why the Great Depres-
sion was followed by huge inequality decline is not the depression per se, but rather the large
political shocks and policy responses - in particular the tremendous changes in institutions and
tax policies - which took place in the 1930s-1940s. The Great Recession is likely to have a large
long run impact only if it is followed by signi�cant policy changes.
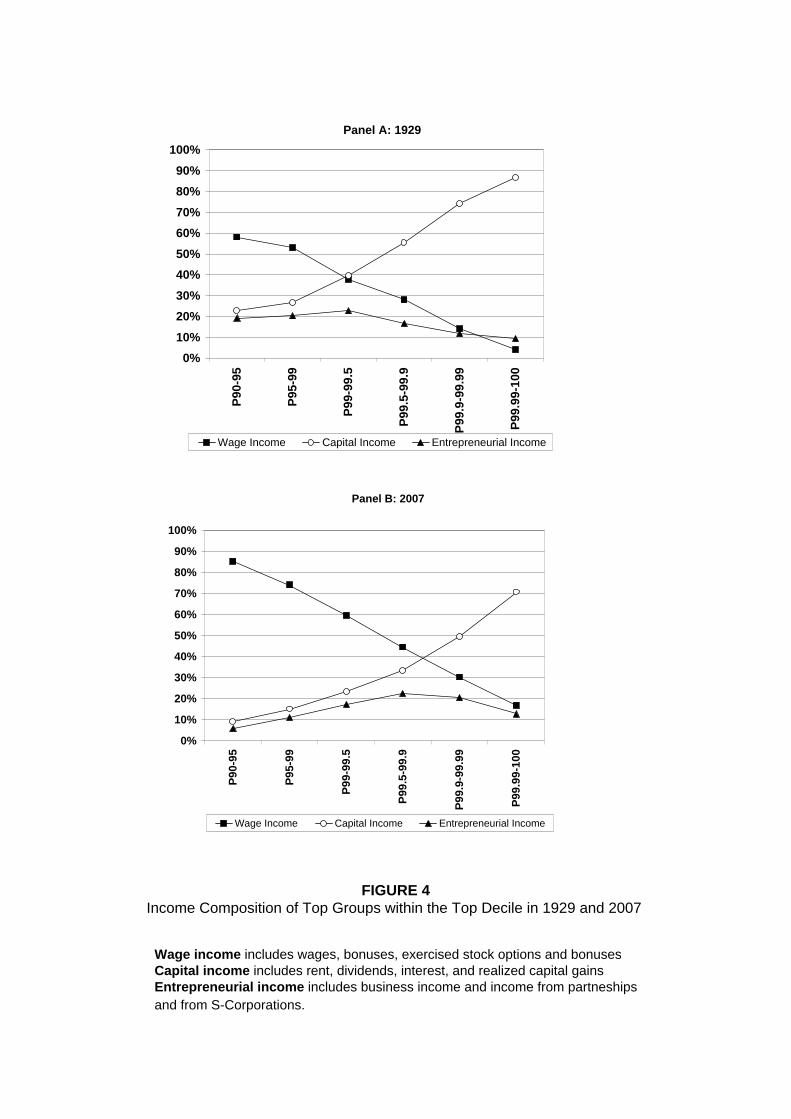
Finally, note that the composition of top incomes has changed between 1929 and 2007. In
both years, the share of wage income declines and the share of capital income rises as one moves
up within the top decile and the top percentile of the income distribution. However in 2007, one
needs to enter into the top 0,1% for capital income to dominate wage income, while in 1929 it
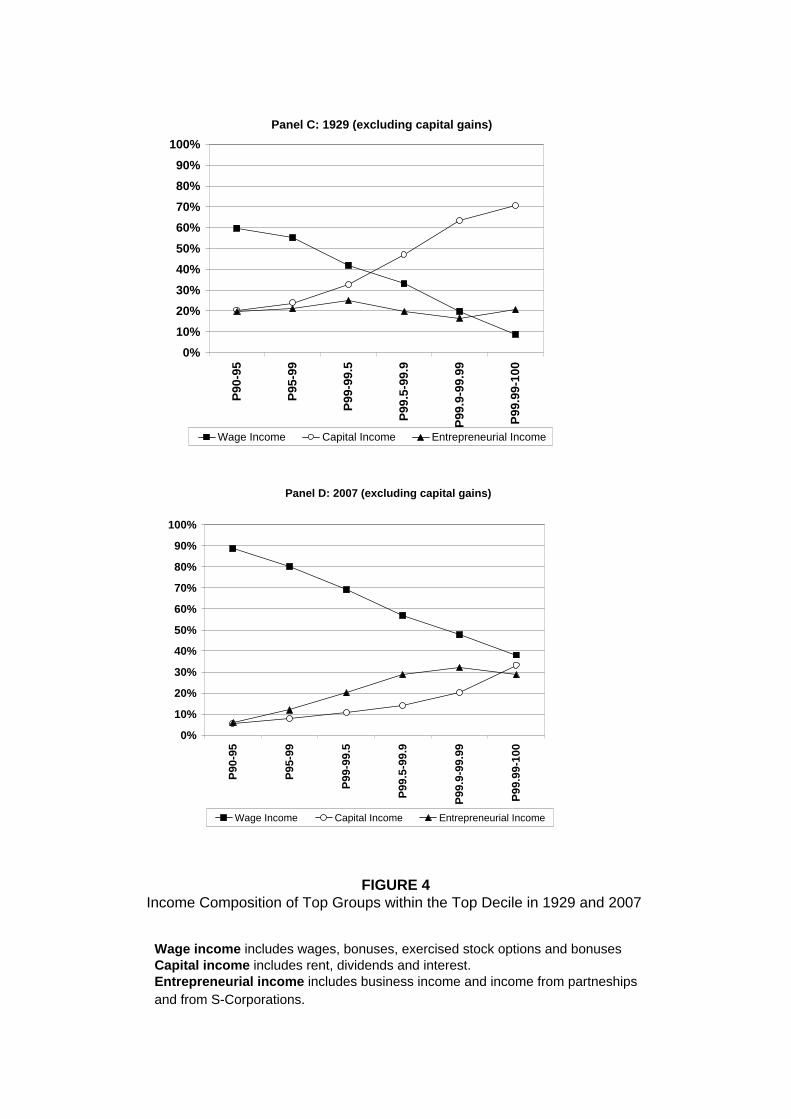
was su¢ cient to enter the top 1% (see Figures 4A-B). Also note that the composition of capital
income itself has changed markedly - it is today largely made up of capital gains. If one takes
away capital gains, then wage income now dominates capital income at the very top (see Figures
4C-D).
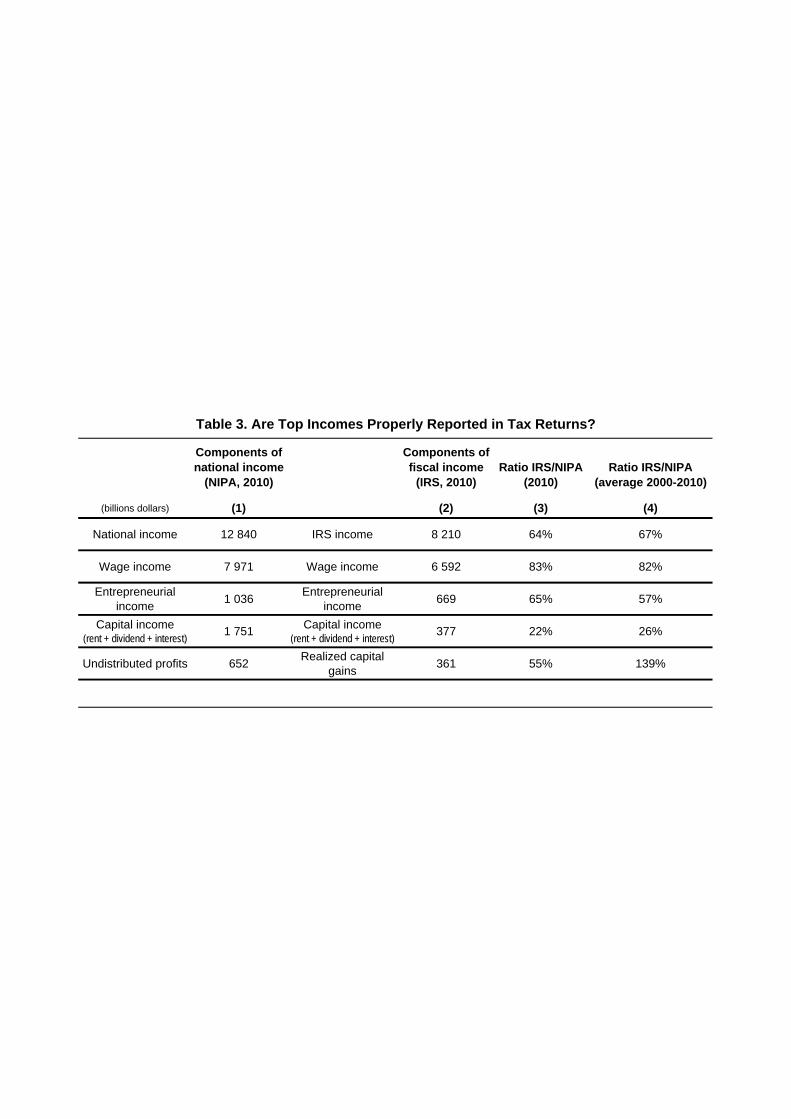
One should be cautious however about the tax reporting rate is today much lower for capital
income (and to some extent entrepreneurial income) than for wage income (see Table 3). If we
were to correct for this (e.g. assuming the reporting rate is the same at all income levels for
each income category), which did not do in our published series so far, then the US level of top
income shares today would probably be signi�cantly higher than in 1929, and the composition
would look closer. This is an important limitation of our series which also applies to other
countries (the share of tax-exempt capital income has increased pretty much everywhere during
the past decades), and which should be kept in mind.2 Another related limitation is that we did
not attempt so far to include estimates for top capital incomes originating from assets located
in tax havens (which are typically not well recorded in resident countries, and which have grown
2The WTID unfortunately does not include homogenous income composition series for all countries. Butfor all countries for which we have such series (in particular Germany, France, the UK and Sweden), we �ndevolutions that are comparable to those depicted on �gures 4A-4D for the US (namely a partial replacementof rent, interest and dividend income by capital gains), albeit with a lower rise of the wage share at very topincome levels.
4
considerably in recent decades).3
Another force going in the opposite direction is that our series do not take into account
tax-exempt transfer income. That is, all top income shares series presented in the WTID
relate to pretax market income. Given the rise of transfers since the 1970s, this is likely to
a¤ect the trends. Ideally, one would like to extend our series in order to take into account all
forms missing incomes, i.e. both missing capital income (this would tend to raise top income
shares), and missing transfer income (this would tend to reduce top income shares). It is
unclear which e¤ect would dominate. Also there are di¢ cult issues related to the measurement
of transfer incomes. E.g. in the US a big part of the rise of transfers took the form of in-kind
transfers, especially through Medicaid/Medicare soaring costs (with unclear value added for
those exploding costs). In any case, the main - and robust - lesson from our US series is that
bottom 99% cash market incomes have growth at a vey small rate since the 1970s, due the large
rise in income concentration.
3 How much should we tax top incomes?
How much should we use progressive income taxation in order to redistribute more fairly the
gains from aggregate income growth? Using the standard optimal tax framework, and the
relatively moderate labor supply elasticites found in the micro empirical literature, Diamond
and Saez (2011) have argued that the revenue maximizing top tax rate is likely to be well above
50% - say 60%-70%. In a recent paper, Piketty, Saez and Stantcheva (2012) have argued that
the socially optimal top tax rate might be even larger than what standard models suggest. Here
we summarize their main empirical and theorerical arguments and discuss evidence in support
of this model. We also provide simple simulations about optimal tax rates in order to illustrate
the magnitude of the e¤ects.
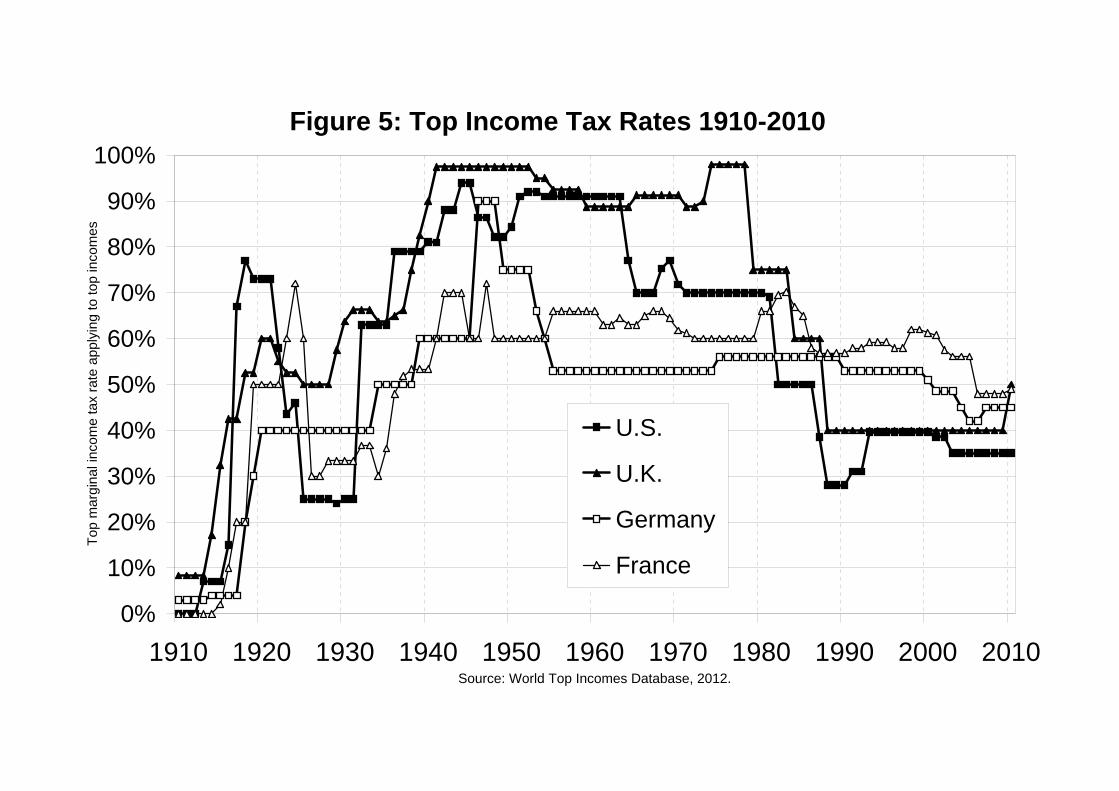
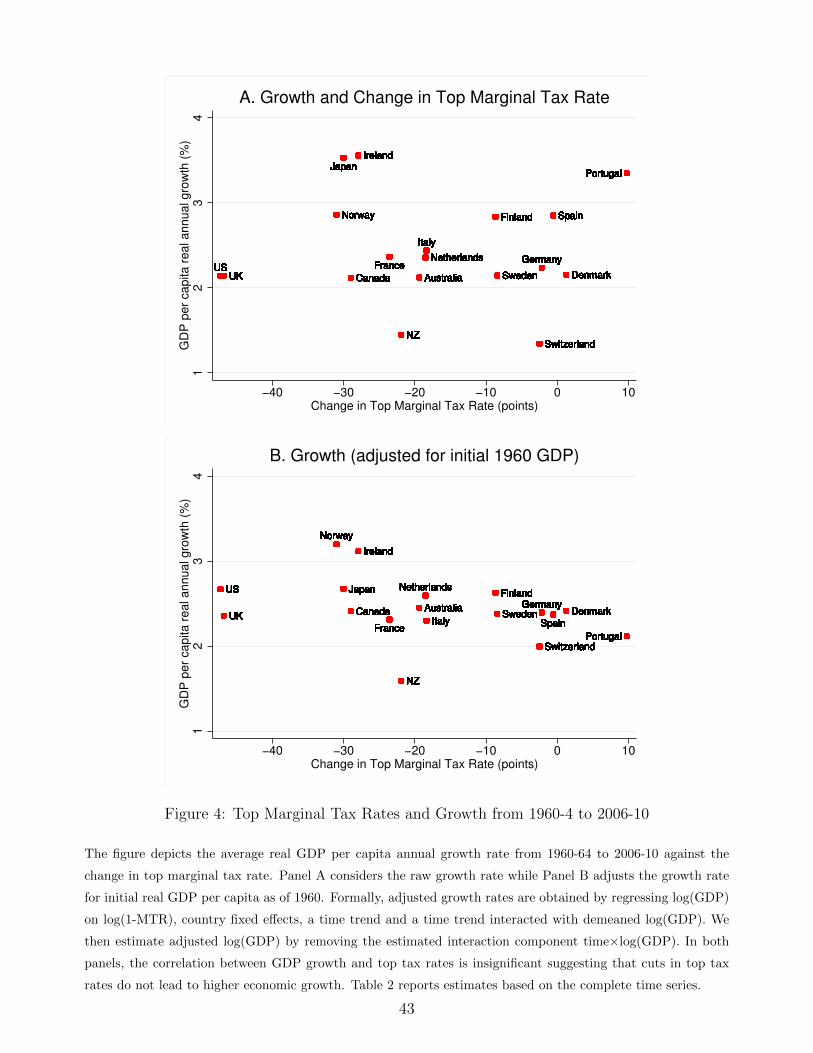
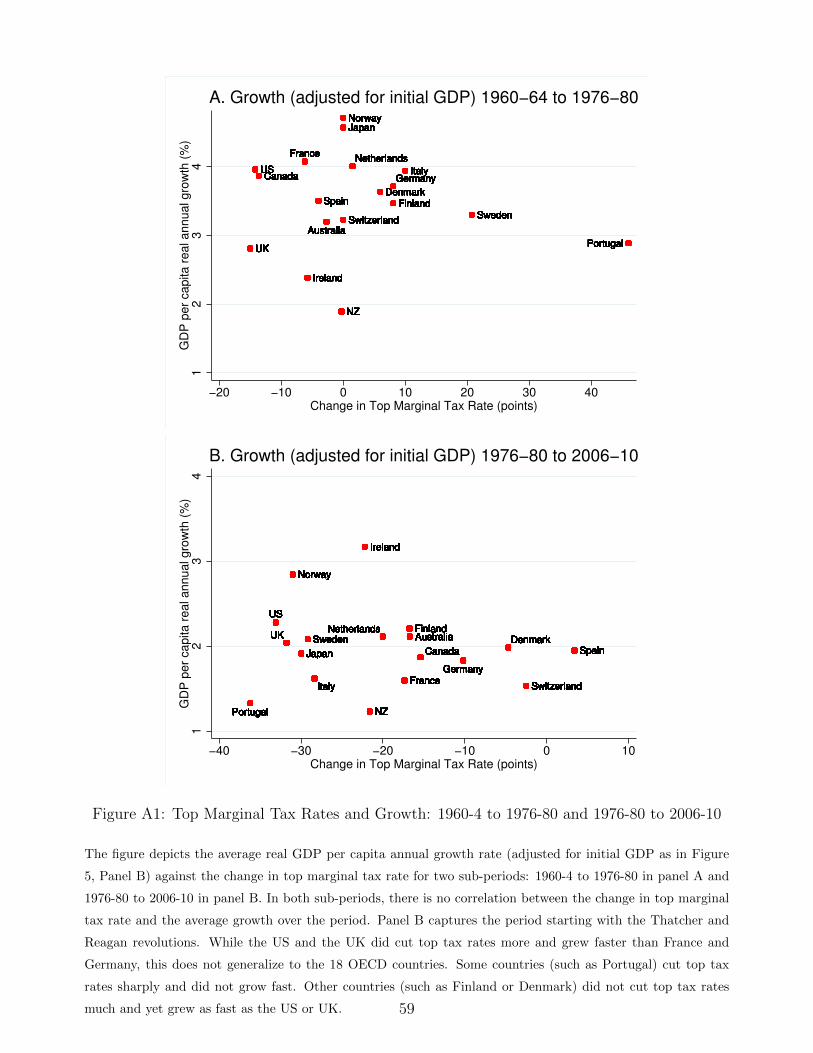
From a long run perspective, it is striking to see that the countries where top income shares
have increased the most - typically the US and the UK - are also those where top marginal
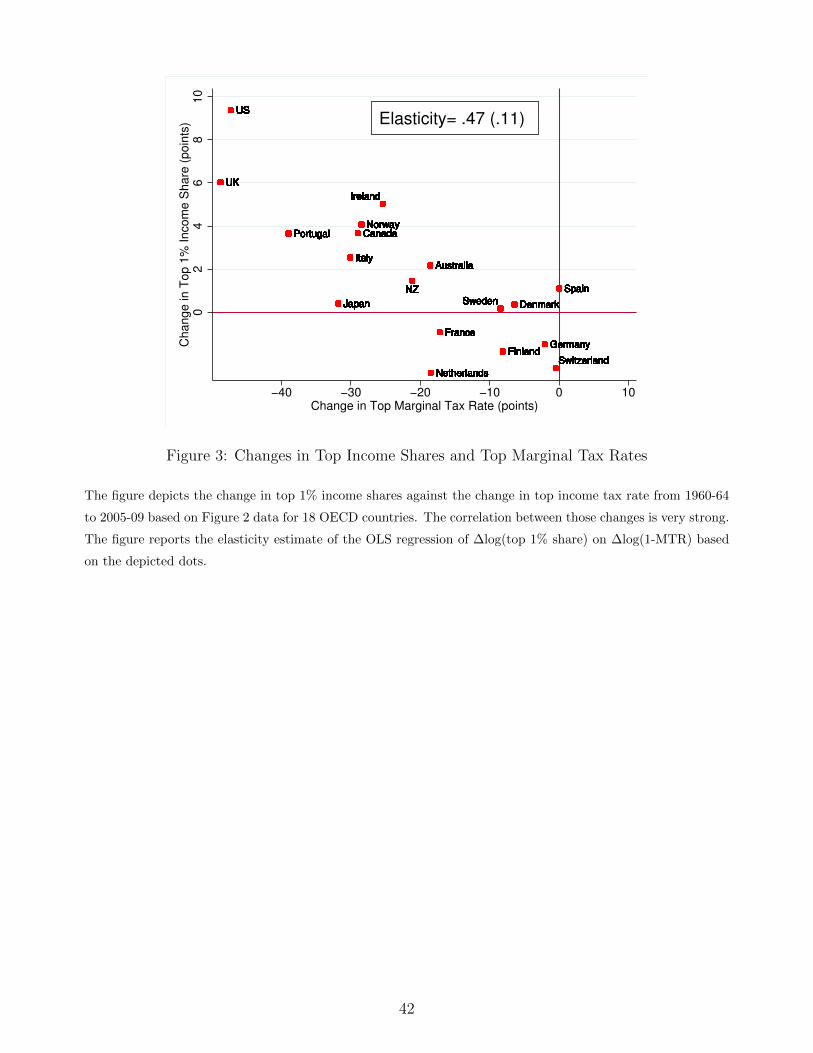
income tax rates were cut the most (see Figure 5). Taking a broader cross country perspective,
and using updated WTID series in a systematic manner, we �nd a clear a negative correlation,
with an elasticity around 0.5 (see Figure 6).
The central question is the following: where does this elasticity come from? Piketty, Saez and
3See Zucman (2012).
5
Stantcheva (2012) present a model of optimal labor income taxation where top incomes respond
to marginal tax rates through three channels: (1) standard labor supply, (2) tax avoidance, (3)
compensation bargaining. They show that the optimal top tax rate responds very di¤erently
to these three behavioral elasticities. The �rst elasticity (labor supply) is the sole real factor
limiting optimal top tax rates. The optimal tax system should be designed to minimize the
second elasticity (avoidance) through tax enforcement and tax neutrality across income forms.
The second elasticity then becomes irrelevant. Most interestingly, the optimal top tax rate
increases with the third elasticity (bargaining) as bargaining e¤orts are zero-sum in aggregate.
The key intuition behind the bargaining elasticity is that pay may not equal marginal eco-
nomic product for top income earners. In particular, executives can be overpaid if they are
entrenched and use their power to in�uence compensation committees (Bebchuk and Fried
(2004) survey the wide corporate �nance literature on this issue). More generally, pay can di¤er
from marginal product in any model in which compensation is decided by on-the-job bargaining
between an employer and an employee, as in the classic search model In more general mod-
els, given the substantial costs involved in replacing workers who quit in most modern work
environments, especially for management positions where speci�c human capital is important,
as well as imperfect information between �rm and employee, it seems reasonable to think that
there would be a band of possible compensation levels. In such a context, bargaining e¤orts on
the job can conceivably play a signi�cant role in determining pay. Marginal tax rates a¤ect the
rewards to bargaining e¤ort and can hence a¤ect the level of such bargaining e¤orts.
Yet another reason why pay may di¤er from marginal product is imperfect information.
In the real world, it is often very di¢ cult to estimate individual marginal products, especially
for managers working in large corporations. For tasks that are performed similarly by many
workers (e.g. one additional worker on a factory line), one can approximately compute the
contribution to total output brought by an extra worker. But for tasks that are more or less
unique, this is much more complex: one cannot run a company without a chief �nancial o¢ cer
or a head of communication during a few years in order to see what the measurable impact on
total output of the corporation is going to be. For such managerial tasks, it is very unlikely
that market experimentation and competition can ever lead to full information about individual
marginal products, especially in a rapidly changing corporate landscape. If marginal products
are unknown, or are only known to belong to relatively large intervals, then institutions, market
6
power and beliefs systems can naturally play a major role for pay determination (see Rotemberg
2002). This is particularly relevant for the recent rise of top incomes. Using matched individual
tax return data with occupations and industries, Bakija, Cole and Heim (2010) have recently
shown that executives, managers, supervisors, and �nancial professionals account for 70 percent
of the increase in the share of national income going to the top 0.1 percent of the US income
distribution between 1979 and 2005.4
It is obviously very di¢ cult to come with a fully satisfactory decomposition of the total
observed elasticity into three components. However, all existing evidence seems to point in
the same direction. First, the fact that all developed countries have had almost the same
productivity growth rates over the past decades suggests that the bargaining, zero-sum-game
channel is indeed important (see Figures 7-8). Next, micro evidence on corporate executive
pay setting appears to be consistent with our proposed interpretation: the elasticty of CEP
compensation with respect to lucky pro�ts - i.e. pro�ts predicted by exogenous shocks such as
mean industry performance - is larger than with respect to general pro�ts, and even more so in
countries with lower top marginal rates (see Piketty, Saez and Stantcheva 2012).
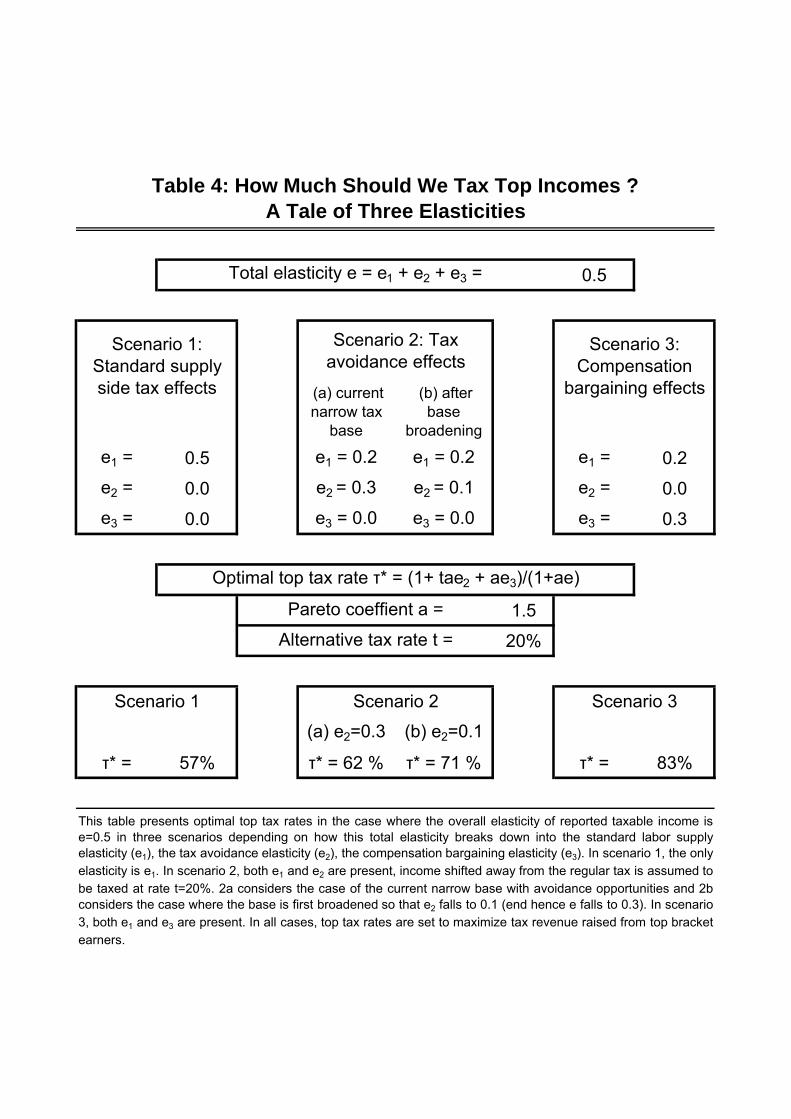
Our main conclusions about optimal top tax rates are summarized on Table 4. That is,
assuming the total elasticity is around 0.5 (as suggested by macro cross-country evidence), then
if this elasticity comes partly from standard labor supply channel and partly from bargaining
channel, then optimal top rate can be as large as 82% - as opposed to 57% is the elasticity
comes entirely from standatrd supply side channels.
4 Did rising top incomes exacerbate �nancial fragility?
In addition to equity and redistribution, the other major concern with rising top income shares
is the potential impact on macro �nancial fragility. Is the fact that the two highest top decile
income shares occurred in 1928 and 2007, i.e. at the eve of the Great Depression and at the eve
of the Great Recession, a mere coincidence?
A number of economists have argued that rising inequality and stagnant incomes for the
bottom 90% did spur the rise of household debt - and eventually directly contributed to make
the �nancial system more fragile and more vulnerable to shocks (see e.g. Kumhof and Ranciere
4Including about two thirds in the non-�nancial sector, and one third in the �nancial sector. In contrast, thecombined share of the arts, sports and medias sub-sectors, usually used to illustrate winner-take-all theories, isonly 3.1% of all top 0.1% taxpayers. See Bakija, Cole, and Heim (2012, Table 1).
7
(2010), Rajan (2010), Bertrand and Morse (2012); see also Azzimonti et al (2012) for a similar
story operating through the accumulation of government debt). Others however have argued
on the basis of historical evidence that credit and debt booms can happen basically everywhere,
and bear no systematic relationship with income inequality (see Bordo and Meisner, 2012).
On the basis of our series, our own view is the following. First, it is clear that is partly
a coincidence - a correlation rather than a causal impact. That is, a booming stock market
contributes both to the rise of top incomes (in particular via capital gains, which were very
large both in the 1920s and in the 2000s) and to the rise of �nancial fragility - but this does not
imply that there is causal relationship between rising inequality and �nancial fragility. Modern
�nancial systems are very fragile and can probably crash by themselves - even without rising
inequality.
This does not imply that rising inequality played no role at all. In our view it is highly
plausible that rising top incomes did contribute to exacerbate �nancial fragility. The fact that
household debt rose so much and so fast in the US during the 1990s-2000s (especially in the
2000s) and that the crash eventually occurred in the US rather than in Europe is probably
not a coincidence. Again the key point that needs to be stressed from our viewpoint is the
magnitude of the aggregate income shift that has occurred in the US since the early 1980s.
The bottom 90% has become poorer, the top 10% has become richer, with an income tansfer
over 15% of US national income. This was a permanent income transfer: as Kopczuk and Saez
(2010) have show, there has been no signi�cant rise in income mobility over the period. If the
two groups perceive the shocks to be permanent and adjust their consumption accordingly, then
there should have been no change in accumulation of assets and liabilities across groups. But if
the two groups do not immediately perceive the shocks to be permanent, and/or try to resist it
(e.g. because they su¤er a huge welfare loss is they cut their consumption too;much relative to
the average, as suggested by Bertrand and Morse 2012), then this can quickly generate a very
large - and unustainable - accumulation of debt. E.g. if the bottom 90% cuts its consumption
level by the equivalent of 7.5% of national income (instead of 15%), then 10 years down the road
household debt will have rise by the equivalent of 75% of national income - which is roughly
what happened.
In any case, we �nd it surprising that relatively little attention has been given to the magni-
tude of this domestic imbalance (over 15% of US national income), especially as compared to the
8
attention given to global imbalance (the 4% current account de�cit is certainly a large de�cit,
but it is four times smaller). To the extent that global imbalances have put extra pressure on
the US �nancial system, it is likely that domestic imbalances did put an even larger pressure.
Yet we feel that it would be a mistake to put too much emphasis on the top incomes/�nancial
fragility channel, �rst because rising top income shares would matter a lot even without such
a channel (simply because inequality has a large impact on aggregate social welfare), and next
because there are other mechanisms leading to �nancial fragility. There was limited rise of top
income shares in Europe - and yet the �nancial system has clearly become more fragile over
time. The rise of �nancial globalization and the exponential size of banking sector balance
sheets have occurred pretty much everywhere and seen to bear little relationship with rising
inequality. Of course some of the European �nancial fragily might have been imported from the
US (itself partly driven by the rise in inequality), as was argued by a number of scholars (see in
particular Acharya and Schnabl 2010). But there also other factors that are more speci�cally
European.
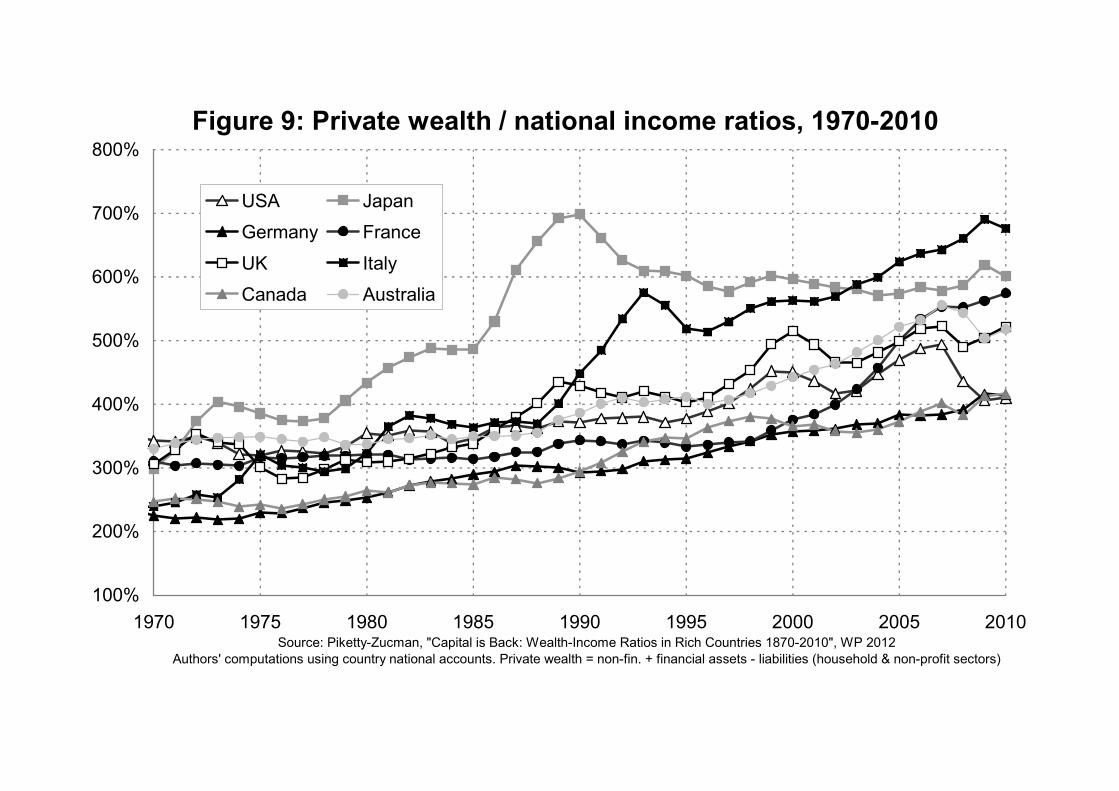
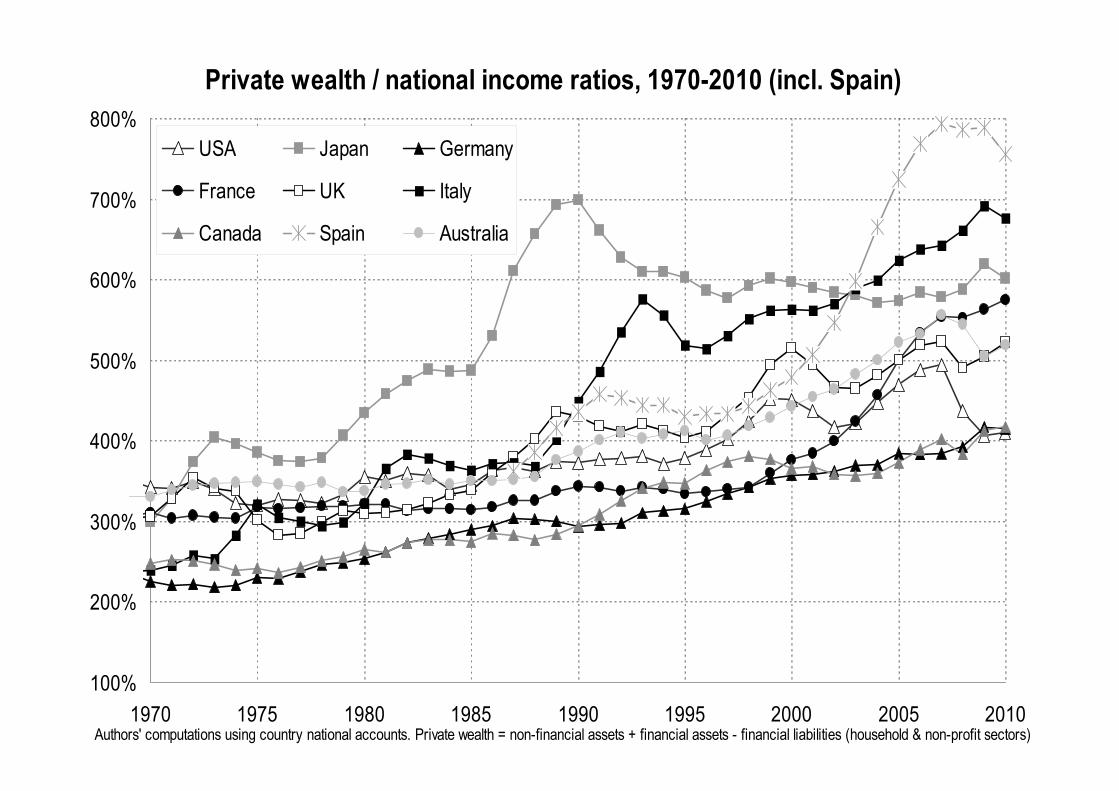
In particular, it is striking to see that the rise of aggregate private wealth/national income
ratios has been particularly strong in Europe, as one can see from Figure 9 (extracted from
Piketty and Zucman 2012, who have recently collected a new historical data set of country
balance sheets in order to study the long run evoluton of aggregate wealth-income ratios).
There are two main channels that contribute to explain this fact.
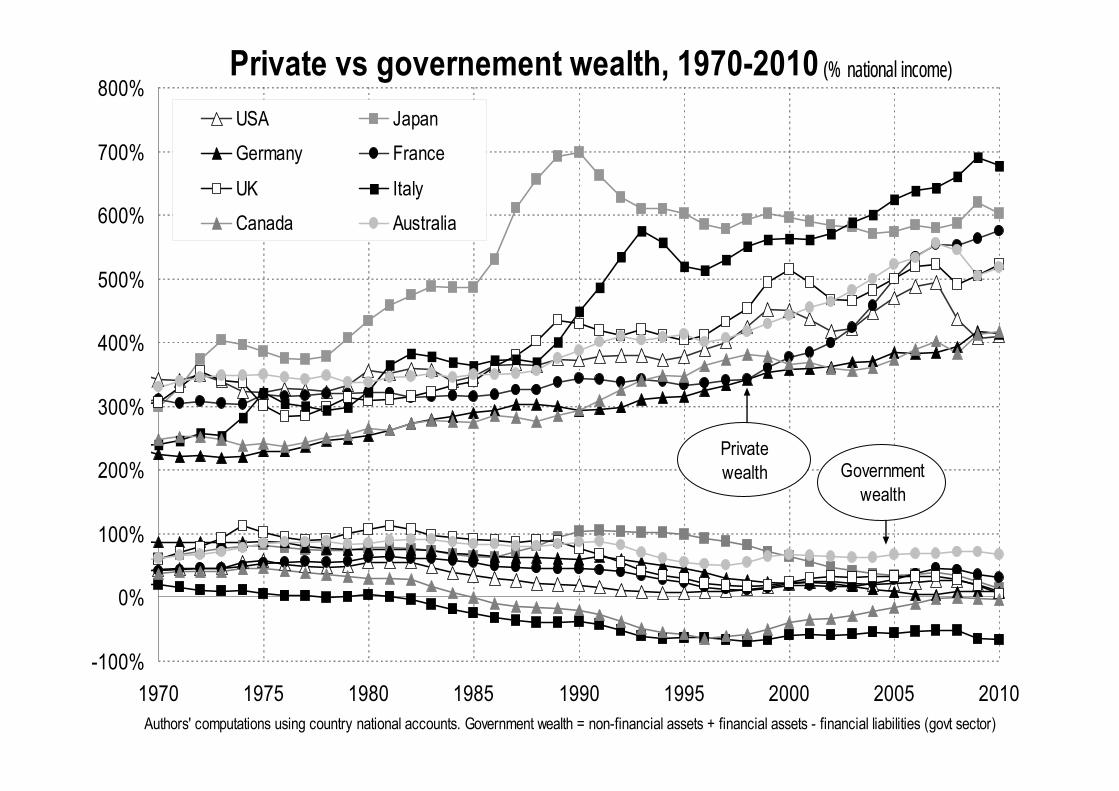
First, aggregate wealth was particularly low in Europe during the 1950s-1970s, both because
of real e¤ects (recovery from war destructions) and most importantly because relative asset
prices were unusually low - which was largerly driven by anti-private capital policies, including
rent control, �nancial repression, nationalization policies. This political factor was largerly
reversed since the 1980s-1990s, via �nancial globalization and deregulation, and large wealth
transfers from public to private hands through cheap privatization. In e¤ect, the rise of private
wealth is partly due to a decline of government wealth (see Figure 10).
Next, the rise of European wealth-income ratios is largely the consequence of high saving
rates and low growth rates (mostly due to near zero population growth rates), as predicted by
the one-good capital accumulation model and the Harrod-Domar-Solow steady-state formula
� = s=g. That is, for a given saving rate s = 10%, then the long run wealth-income ratio
� = s=g is about 300% if g = 3% and about 600% if g = 1.5%.
9
Of course, with perfect capital markets and fully diversi�ed country portfolios, such a rise
in aggregate wealth-income ratios should have no impact on �nancial fragility. However in
case there are imperfections, e.g. due to the fact that it is di¢ cult to put the right prices on
the various international assets, and/or due to home porfolio biases, then the rise of aggregate
wealth-income ratios can also generate asset price bubbles and large �nancial volatility, as the
cases of Japan and Spain - just to take two extreme examples - seem to illustrate (see Figure
11).
We certainly do not claim that the rise of wealth-income ratio the key mechanism behind
�nancial fragility. At a more modest level, we simply mean to suggest that this important
evolution has clearly little to do with the rise of top income shares (it follows for the most part
a di¤erent economic mechanism and involves di¤erent countries), and might also have played a
role to exacerbate fragility. Of course both mechanisms can very much reinforce each other.
5 Concluding comments
TO BE COMPLETED
10
ReferencesAcharya, Viral and Philipp Schnabl, 2010, "Do Global Banks Spread Global Imbalances?The Case of Asset-Backed Commercial Paper During the Financial Crisis of 2007�09", IMFEconomic ReviewAlvaredo, Facundo, Anthony Atkinson, Thomas Piketty, and Emmanuel Saez. 2012.The World Top Incomes Database, online at http://g-mond.parisschoolofeconomics.eu/topincomes/Atkinson, Anthony, and Thomas Piketty. 2007. Top Incomes over the Twentieth Century -A Contrast Between Continental European and English-Speaking Countries (Volume 1), Oxford:Oxford University Press: 585 ppAtkinson, Anthony, and Thomas Piketty. 2010. Top Incomes over the Twentieth Century- A Global Perspective (Volume 2), Oxford: Oxford University Press: 776 ppAtkinson, Anthony, Thomas Piketty, and Emmanuel Saez. 2011. �Top Incomes in theLong-Run of History�, Journal of Economic Literature 3-71.Azzimonti, Marina, Eva de Francisco and Vincenzo Quadrini, �Financial Globalization,Inequality, and the Raising of Public Debt", Reserve Bank of Philadelphia Working Paper, 2012Bakija, John, Adam Cole, and Bradley Heim. 2012. �Jobs and Income Growth of TopEarners and the Causes of Changing Income Inequality: Evidence from U.S. Tax Return Data,�Working Paper Williams College, April 2012.Bebchuk, Lucian, and Jesse Fried. 2004. Pay without Performance: The Unful�lledPromise of Executive Compensation, Harvard University Press: Cambridge.Bertrand, Marianne and Adair Morse, "Trickle-down consumption", Working Paper, 2012Burkhauser, Richard V., Shuaizhang Feng, Stephen P. Jenkins, and Je¤Larrimore.2009. �Recent Trends in Top Income Shares in the USA: Reconciling Estimates from MarchCPS and IRS Tax Return Data.�National Bureau of Economic Research Working Paper 15320.Bordo, Michael and Christopher Meissner, �Does Inequality Lead to a Financial Crisis?",NBER Working Paper, 2012Kumhof, Michael and Romain Ranciere, "Inequality, Leverage and Crises", IMF WorkingPaper, 2010Diamond, Peter, and Emmanuel Saez. 2011. �The Case for a Progressive Tax: FromBasic Research to Policy Recommendations,�CESifo Working Paper No. 3548, August 2011,forthcoming Journal of Economic Perspectives.Gabaix, Xavier, and Augustin Landier. 2008. �Why has CEO Pay Increased So Much?,�Quarterly Journal of Ecoonomics 123, 49-100.Piketty, Thomas, �Income Inequality in France, 1901-1998�, Journal of Political Economy,2003, 111(5), pp.1004-1042Piketty, Thomas, �On the Long-Run Evolution of Inheritance: France 1820-2050�, QuarterlyJournal of Economics, 2011, vol.126(3), pp.1071-1131Piketty, Thomas, and Emmanuel Saez. 2003. �Income Inequality in the United States,1913-1998,�Quarterly Journal of Economics 118(1), 1-39, series updated to 2010 in March 2012.
11
Piketty, Thomas, Emmanuel Saez and Stefanie Stantcheva. 2012, "Optimal Taxationof Top Labor Incomes - A Tale of Three Elasticities", NBER Working Paper.Piketty, Thomas and Gabriel Zucman, 2012, �Capital is Back: Wealth-Income Ratios inRich Countries 1870-2010�, Working Paper, Paris School of EconomicsRotemberg, Julio. 2002. �Perceptions of Equity and the Distribution of Income,�Journal ofLabor Economics 20, 249-288.Zucman, Gabriel, 2012, �The Missing Wealth of Nations - Are Europe and the US NetDebtors or Net Creditors?"�, Working Paper, Paris School of Economics
12
TABLE 1.
Percentile threshold
Income threshold Income Groups
Number of families
Average income in each
group
(1) (2) (3) (4) (5)
Full Population 156 167 000 $51 550
Bottom 90% 140 550 300 $29 840
Top 10% $108 024 Top 10-5% 7 808 350 $125 627
Top 5% $150 400 Top 5-1% 6 246 680 $205 529
Top 1% $352 055 Top 1-0.5% 780 835 $418 378
Top .5% $521 246 Top 0.5-0.1% 624 668 $798 120
Top .1% $1 492 175 Top 0.1-0.01% 140 550 $2 802 020
Top .01% $7 890 307 Top 0.01% 15 617 $23 846 950
Source. Piketty and Saez (2003), series updated to 2010. Computations based on income tax return statistics.
Income defined as market income (annual gross income reported on tax returns excluding all government transfers
and before individual income taxes), including realized capital gains
Thresholds and Average Incomes in Top Income Groups in the US in 2010
Average Income Real Annual
Growth
Top 1% Incomes Real Annual
Growth
Bottom 99% Incomes Real
Annual Growth
Fraction of total growth captured by
top 1%
(1) (2) (3) (4)
Period 1976-2007 1.2% 4.4% 0.6% 58%
Clinton Expansion 1993-2000 4.0% 10.3% 2.7% 45%
Bush Expansion 2002-2007 3.0% 10.1% 1.3% 65%
Computations based on family market income including realized capital gains (before individual taxes).
Incomes are deflated using the Consumer Price Index (and using the CPI-U-RS before 1992).
Column (4) reports the fraction of total real family income growth captured by the top 1%.
For example, from 2002 to 2007, average real family incomes grew by 3.0% annually but 65% of that growth
accrued to the top 1% while only 35% of that growth accrued to the bottom 99% of US families.
Source: Piketty and Saez (2003), series updated to 2007 in August 2009 using final IRS tax statistics.
Table 2. Top Percentile Share and Average Income Growth in the US
Components of national income
(NIPA, 2010)
Components of fiscal income
(IRS, 2010)Ratio IRS/NIPA
(2010)Ratio IRS/NIPA
(average 2000-2010)
(billions dollars) (1) (2) (3) (4)
National income 12 840 IRS income 8 210 64% 67%
Wage income 7 971 Wage income 6 592 83% 82%
Entrepreneurial income
1 036Entrepreneurial
income669 65% 57%
Capital income (rent + dividend + interest) 1 751
Capital income (rent + dividend + interest) 377 22% 26%
Undistributed profits 652Realized capital
gains361 55% 139%
Table 3. Are Top Incomes Properly Reported in Tax Returns?
0.5
e1 = 0.5 e1 = 0.2 e1 = 0.2 e1 = 0.2
e2 = 0.0 e2 = 0.3 e2 = 0.1 e2 = 0.0
e3 = 0.0 e3 = 0.0 e3 = 0.0 e3 = 0.3
1.5
20%
(a) e2=0.3 (b) e2=0.1
τ* = 57% τ* = 62 % τ* = 71 % τ* = 83%
Table 4: How Much Should We Tax Top Incomes ? A Tale of Three Elasticities
Scenario 1: Standard supply side tax effects
Scenario 3: Compensation
bargaining effects
Total elasticity e = e1 + e2 + e3 =
(a) current narrow tax
base
(b) after base
broadening
This table presents optimal top tax rates in the case where the overall elasticity of reported taxable income ise=0.5 in three scenarios depending on how this total elasticity breaks down into the standard labor supplyelasticity (e1), the tax avoidance elasticity (e2), the compensation bargaining elasticity (e3). In scenario 1, the onlyelasticity is e1. In scenario 2, both e1 and e2 are present, income shifted away from the regular tax is assumed tobe taxed at rate t=20%. 2a considers the case of the current narrow base with avoidance opportunities and 2bconsiders the case where the base is first broadened so that e2 falls to 0.1 (end hence e falls to 0.3). In scenario3, both e1 and e3 are present. In all cases, top tax rates are set to maximize tax revenue raised from top bracketearners.
Scenario 2: Tax avoidance effects
Optimal top tax rate τ* = (1+ tae2 + ae3)/(1+ae)
Pareto coeffient a =
Scenario 1 Scenario 2 Scenario 3
Alternative tax rate t =
FIGURE 1AThe Top Decile Income Share in the United States, 1917-2010
Source: Piketty and Saez (2003), series updated to 2010. Income is defined as market income including realized capital gains (excludes government transfers).
25%
30%
35%
40%
45%
50%
1917
1922
1927
1932
1937
1942
1947
1952
1957
1962
1967
1972
1977
1982
1987
1992
1997
2002
2007
Sh
are
of
tota
l in
com
e g
oin
g t
o T
op
10%
FIGURE 1BThe Top Decile Income Share in the United States, 1917-2010
Source: Piketty and Saez (2003), series updated to 2010. Income is defined as market income including realized capital gains (excludes government transfers).
25%
30%
35%
40%
45%
50%
1917
1922
1927
1932
1937
1942
1947
1952
1957
1962
1967
1972
1977
1982
1987
1992
1997
2002
2007
Sh
are
of
tota
l in
com
e g
oin
g t
o T
op
10%
Including capital gains
Excluding capital gains
FIGURE 1CDecomposing the Top Decile US Income Share into 3 Groups, 1913-2010
Source: Piketty and Saez (2003), series updated to 2010. Income is defined as market income including capital gains (excludes all government transfers).
0%
5%
10%
15%
20%
25%
19
13
19
18
19
23
19
28
19
33
19
38
19
43
19
48
19
53
19
58
19
63
19
68
19
73
19
78
19
83
19
88
19
93
19
98
20
03
20
08S
har
e o
f to
tal
inco
me
accr
uin
g t
o e
ach
gro
up
Top 1% (incomes above $352,000 in 2010)Top 5-1% (incomes between $150,000 and $352,000)Top 10-5% (incomes between $108,000 and $150,000)
Figure 2A. Top 1% share: English Speaking countries (U-shaped), 1910-2010
0
5
10
15
20
25
30
1910
1915
1920
1925
1930
1935
1940
1945
1950
1955
1960
1965
1970
1975
1980
1985
1990
1995
2000
2005
2010
Source: World Top Incomes Database, 2012
To
p P
erce
nti
le S
har
e (i
n p
erce
nt)
United States United Kingdom
Canada Australia
Ireland New Zealand
Figure 2B. Top 1% share: Contin. Europe and Japan (L-shaped), 1900-2010
0
5
10
15
20
25
3019
00
1905
1910
1915
1920
1925
1930
1935
1940
1945
1950
1955
1960
1965
1970
1975
1980
1985
1990
1995
2000
2005
2010
Source: World Top Incomes Database, 2012
To
p P
erce
nti
le S
har
e (i
n p
erce
nt)
France Germany
Netherlands Switzerland
Japan Sweden
Figure 2C. Top 1% share: Europe, North vs South (L-shaped), 1900-2010
0
5
10
15
20
25
30
1900
1905
1910
1915
1920
1925
1930
1935
1940
1945
1950
1955
1960
1965
1970
1975
1980
1985
1990
1995
2000
2005
2010
Source: World Top Incomes Databse, 2012
To
p P
erce
nti
le S
har
e (i
n p
erce
nt)
France Germany
Spain Italy
Sweden
Figure 3: Top Decile Income Shares 1910-2010
25%
30%
35%
40%
45%
50%
1910 1920 1930 1940 1950 1960 1970 1980 1990 2000 2010Source: World Top Incomes Database, 2012. Missing values interpolated using top 5% and top 1% series.
Shar
e of to
tal m
arke
t inco
me go
ing to
top 1
0% (in
cl. re
alize
d k ga
ins) U.S.
U.K.
Germany
France
FIGURE 4Income Composition of Top Groups within the Top Decile in 1929 and 2007
Wage income includes wages, bonuses, exercised stock options and bonusesCapital income includes rent, dividends, interest, and realized capital gains Entrepreneurial income includes business income and income from partneshipsand from S-Corporations.
Panel A: 1929
0%
10%
20%
30%
40%
50%
60%
70%
80%
90%
100%
P90
-95
P95
-99
P99
-99.
5
P99
.5-9
9.9
P99
.9-9
9.99
P99
.99-
100
Wage Income Capital Income Entrepreneurial Income
Panel B: 2007
0%
10%
20%
30%
40%
50%
60%
70%
80%
90%
100%
P90
-95
P95
-99
P99
-99.
5
P99
.5-9
9.9
P99
.9-9
9.99
P99
.99-
100
Wage Income Capital Income Entrepreneurial Income
FIGURE 4Income Composition of Top Groups within the Top Decile in 1929 and 2007
Wage income includes wages, bonuses, exercised stock options and bonusesCapital income includes rent, dividends and interest. Entrepreneurial income includes business income and income from partneshipsand from S-Corporations.
Panel C: 1929 (excluding capital gains)
0%
10%
20%
30%
40%
50%
60%
70%
80%
90%
100%
P90
-95
P95
-99
P99
-99.
5
P99
.5-9
9.9
P99
.9-9
9.99
P99
.99-
100
Wage Income Capital Income Entrepreneurial Income
Panel D: 2007 (excluding capital gains)
0%
10%
20%
30%
40%
50%
60%
70%
80%
90%
100%
P90
-95
P95
-99
P99
-99.
5
P99
.5-9
9.9
P99
.9-9
9.99
P99
.99-
100
Wage Income Capital Income Entrepreneurial Income
Figure 5: Top Income Tax Rates 1910-2010
0%
10%
20%
30%
40%
50%
60%
70%
80%
90%
100%
1910 1920 1930 1940 1950 1960 1970 1980 1990 2000 2010Source: World Top Incomes Database, 2012.