35
The 10 th AIM International Workshop 10-12, March, 2005 Trade and Environment Modeling with GTAP and AIM/CGE Sang In Kang [email protected]
The 10th AIM International Workshop
10-12, March, 2005
Trade and Environment Modeling
with GTAP and AIM/CGE
Sang In Kang
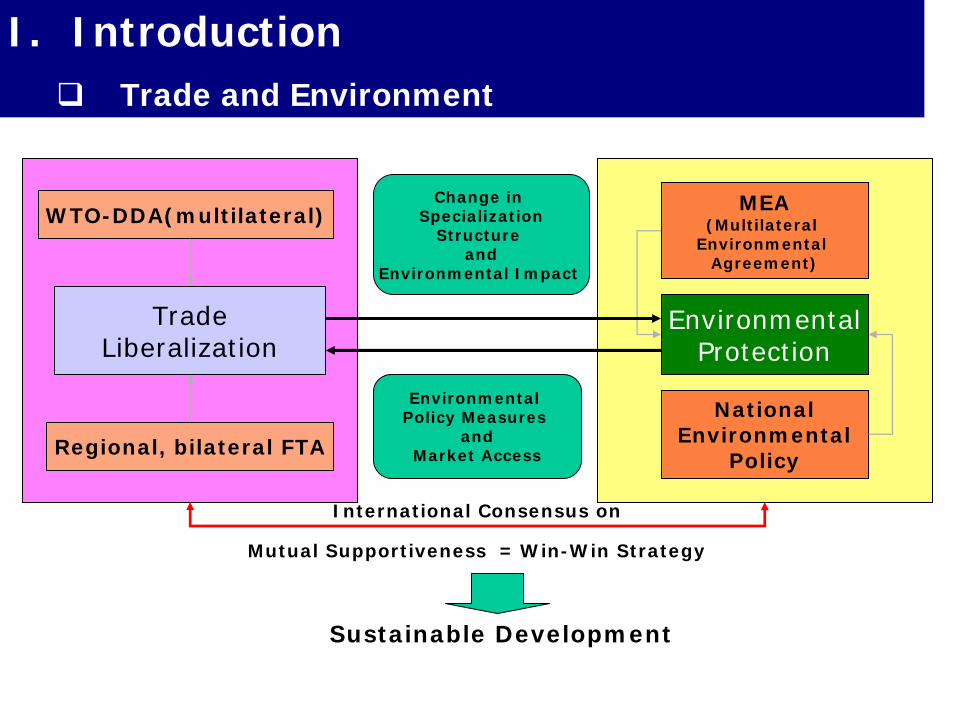
I. IntroductionTrade and Environment
WTO-DDA(multilateral)
TradeLiberalization
Regional, bilateral FTA
MEA(Multilateral
Environmental Agreement)
EnvironmentalProtection
NationalEnvironmental
Policy
Mutual Supportiveness = Win-Win Strategy
Sustainable Development
International Consensus on
Change in Specialization
Structure and
Environmental Impact
Environmental Policy Measures
andMarket Access
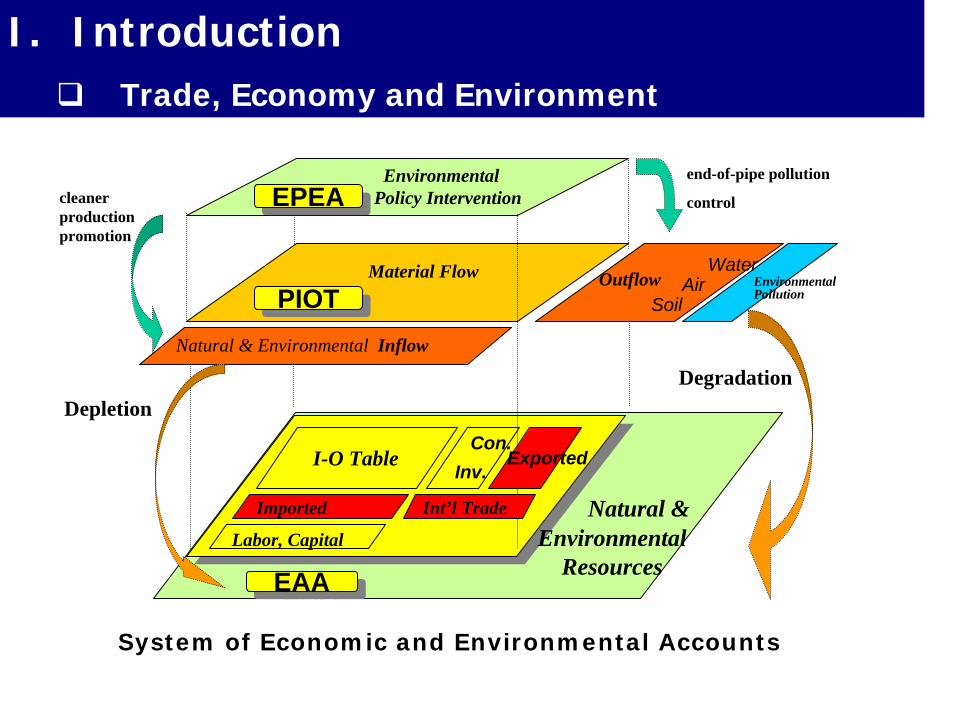
I. IntroductionTrade, Economy and Environment
Environmental Policy Intervention
Material Flow
Natural & Environmental Inflow
end-of-pipe pollution
control
· Water·Air
·Soil
Degradation
cleaner productionpromotion
Depletion
Labor, Capital
Environmental Pollution
Con. Inv.
I-O Table
EPEAEPEA
PIOTPIOTOutflow
EAAEAA
Natural & Environmental
Resources
Exported
Imported Int’l Trade
System of Economic and Environmental Accounts
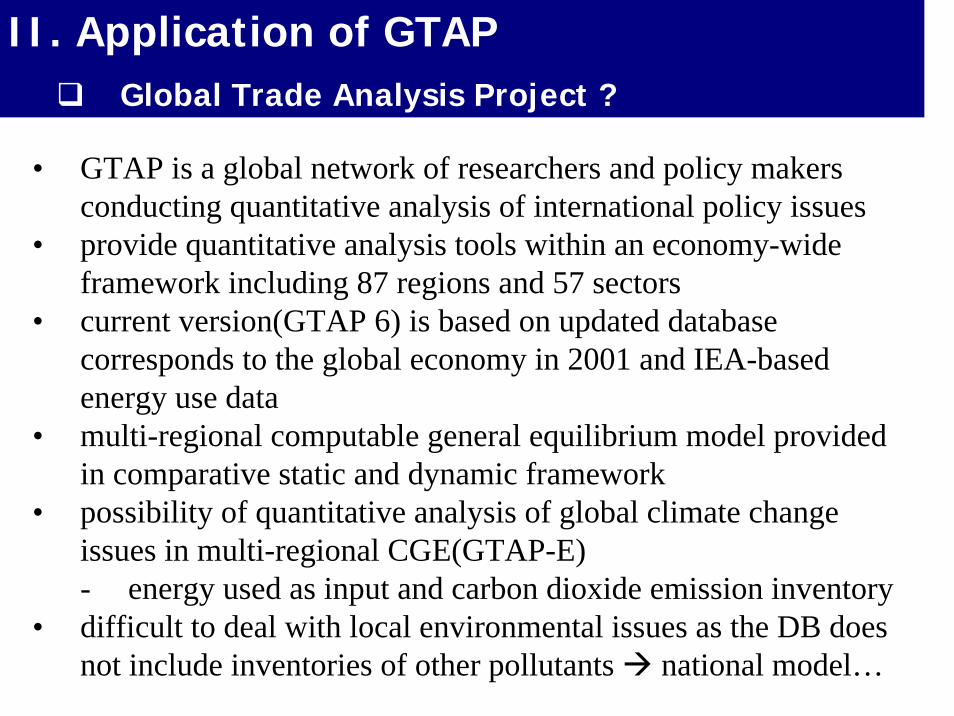
II. Application of GTAPGlobal Trade Analysis Project ?
• GTAP is a global network of researchers and policy makers conducting quantitative analysis of international policy issues
• provide quantitative analysis tools within an economy-wide framework including 87 regions and 57 sectors
• current version(GTAP 6) is based on updated database corresponds to the global economy in 2001 and IEA-based energy use data
• multi-regional computable general equilibrium model provided in comparative static and dynamic framework
• possibility of quantitative analysis of global climate change issues in multi-regional CGE(GTAP-E)- energy used as input and carbon dioxide emission inventory
• difficult to deal with local environmental issues as the DB doesnot include inventories of other pollutants national model…
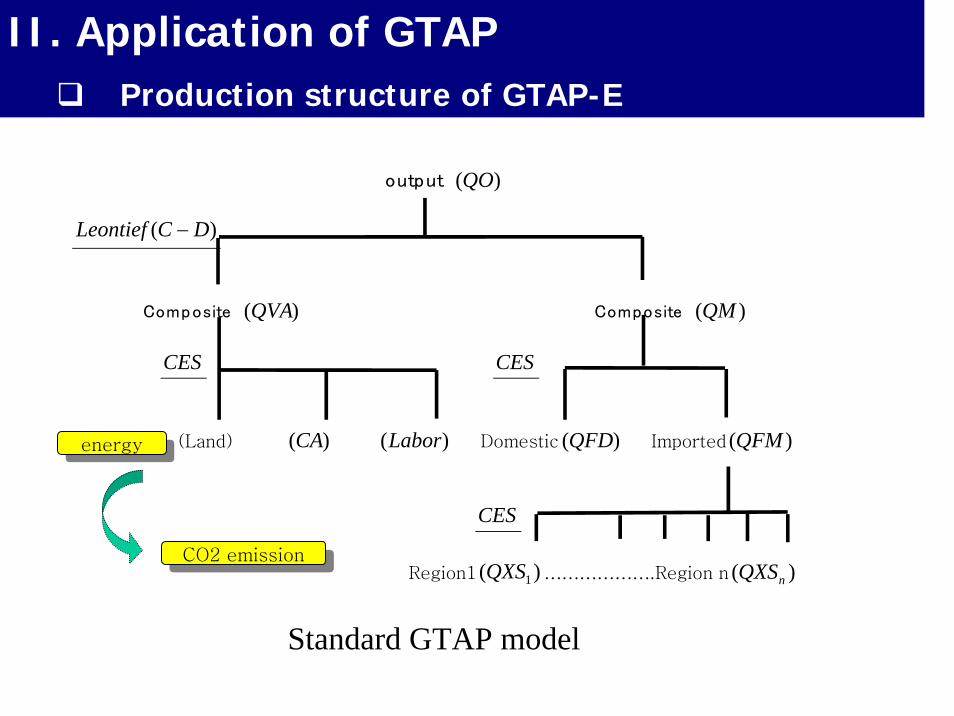
II. Application of GTAPProduction structure of GTAP-E
output )(QO
)( DCLeontief −
Composite )(QVA Composite )(QM
CES CES
(Land) )(CA )(Labor Domestic )(QFD Imported )(QFM
CES
Region1 )( 1QXS ……………….Region n )( nQXS
Standard GTAP model
energyenergy
CO2 emissionCO2 emission
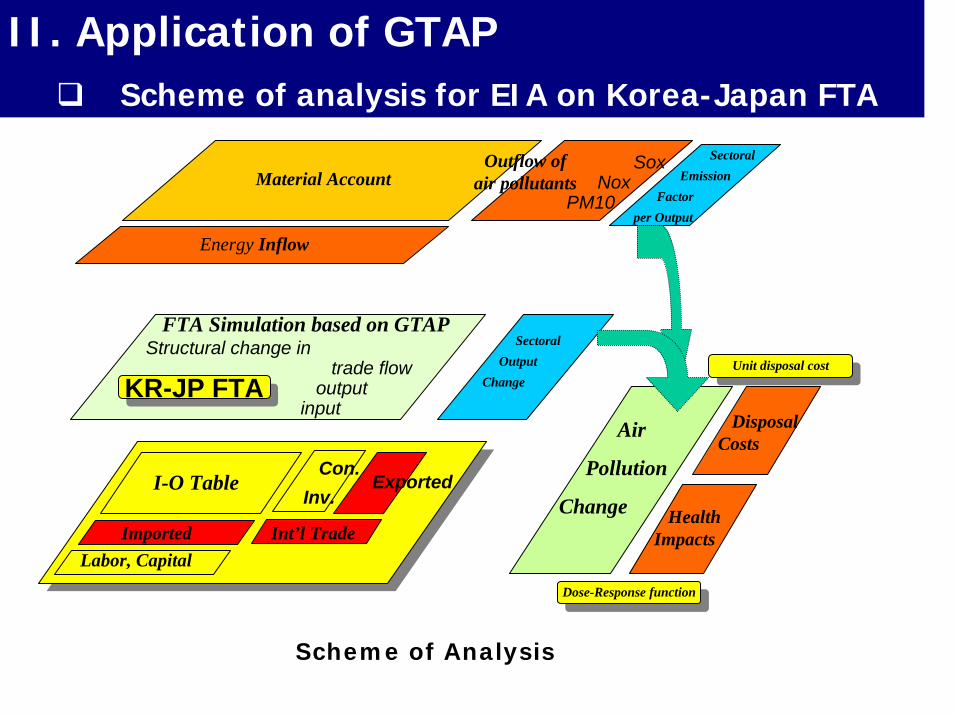
II. Application of GTAPScheme of analysis for EIA on Korea-Japan FTA
Energy Inflow
Air
Pollution
Change
Labor, Capital
Con. Inv.
I-O Table
Outflow of air pollutants
Exported
Imported Int’l Trade
Scheme of Analysis
FTA Simulation based on GTAPStructural change in
· trade flow· output
· input
SectoralOutput
Change
HealthImpacts
DisposalCosts
Unit disposal costUnit disposal cost
Dose-Response functionDose-Response function
SectoralEmission
Factorper Output
· Sox·Nox
·PM10
KR-JP FTAKR-JP FTA
Material Account
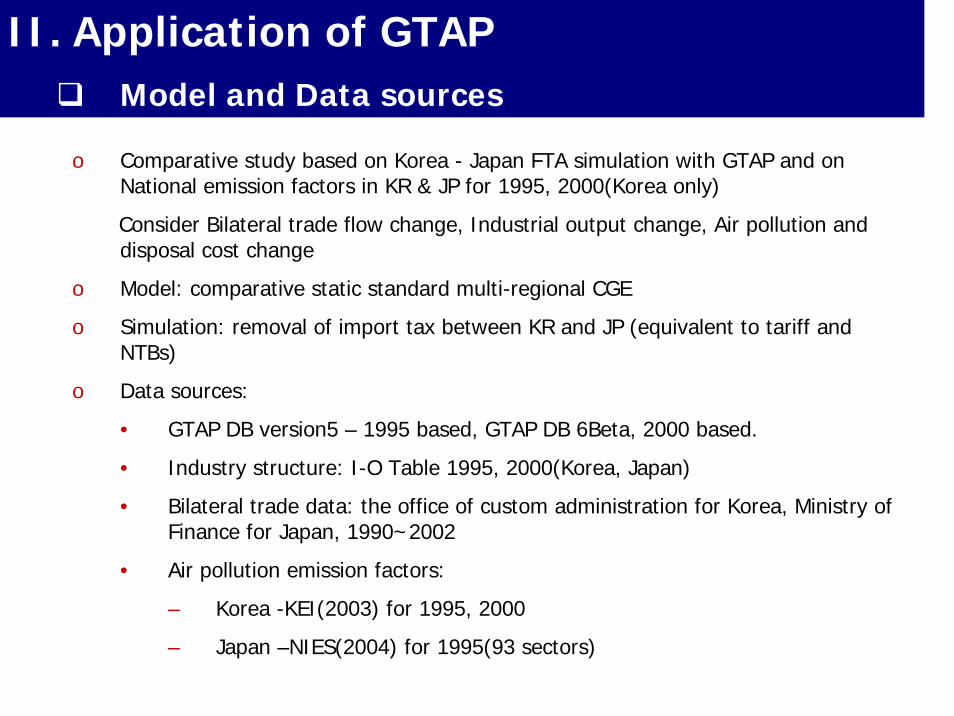
o Comparative study based on Korea - Japan FTA simulation with GTAP and on National emission factors in KR & JP for 1995, 2000(Korea only)
Consider Bilateral trade flow change, Industrial output change, Air pollution and disposal cost change
o Model: comparative static standard multi-regional CGE
o Simulation: removal of import tax between KR and JP (equivalent to tariff and NTBs)
o Data sources:
• GTAP DB version5 – 1995 based, GTAP DB 6Beta, 2000 based.
• Industry structure: I-O Table 1995, 2000(Korea, Japan)
• Bilateral trade data: the office of custom administration for Korea, Ministry of Finance for Japan, 1990~2002
• Air pollution emission factors:
– Korea -KEI(2003) for 1995, 2000
– Japan –NIES(2004) for 1995(93 sectors)
II. Application of GTAPModel and Data sources
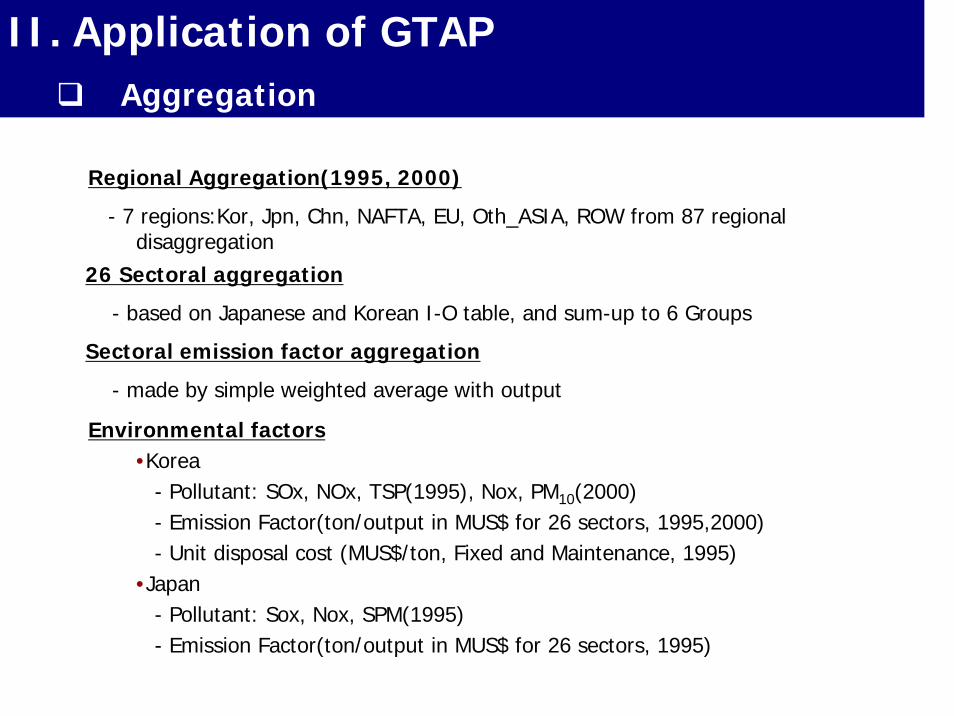
Regional Aggregation(1995, 2000)
- 7 regions:Kor, Jpn, Chn, NAFTA, EU, Oth_ASIA, ROW from 87 regional disaggregation
II. Application of GTAPAggregation
Environmental factors•Korea
- Pollutant: SOx, NOx, TSP(1995), Nox, PM10(2000)- Emission Factor(ton/output in MUS$ for 26 sectors, 1995,2000)- Unit disposal cost (MUS$/ton, Fixed and Maintenance, 1995)
•Japan- Pollutant: Sox, Nox, SPM(1995)- Emission Factor(ton/output in MUS$ for 26 sectors, 1995)
26 Sectoral aggregation
- based on Japanese and Korean I-O table, and sum-up to 6 Groups
Sectoral emission factor aggregation
- made by simple weighted average with output
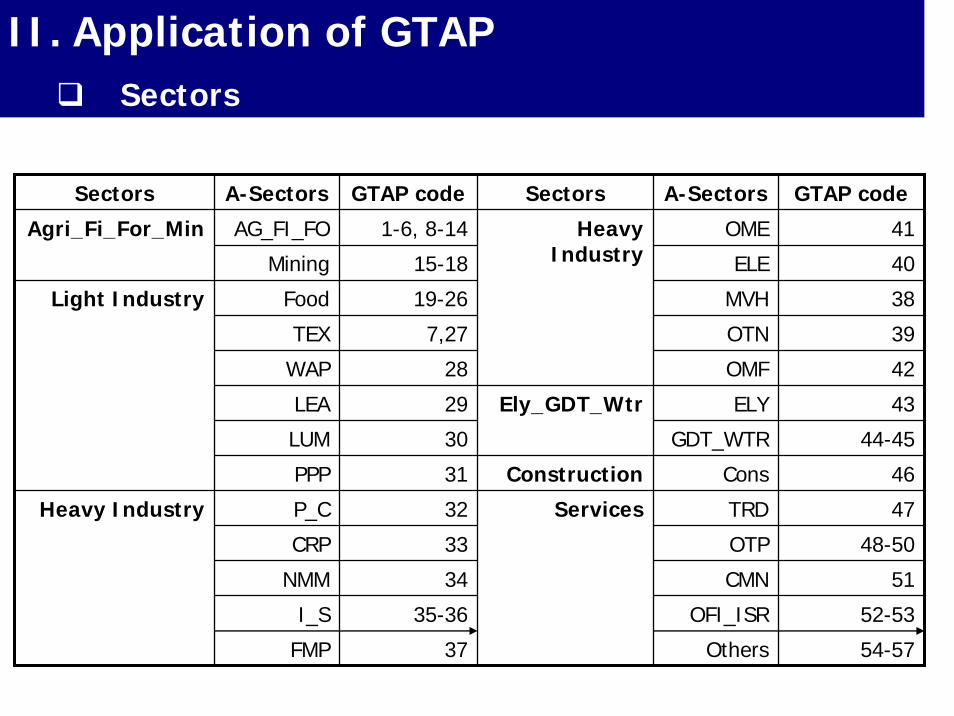
II. Application of GTAPSectors
Sectors A-Sectors GTAP code Sectors A-Sectors GTAP code
AG_FI_FO 1-6, 8-14 OME 41
Mining 15-18 ELE 40
Food 19-26 MVH 38
TEX 7,27 OTN 39
WAP 28 OMF 42
LEA 29 ELY 43
LUM 30 GDT_WTR 44-45
PPP 31 Construction Cons 46
P_C 32 TRD 47
CRP 33 OTP 48-50
NMM 34 CMN 51
I_S 35-36 OFI_ISR 52-53
FMP 37 Others 54-57
ServicesHeavy Industry
Ely_GDT_Wtr
Light Industry
Heavy Industry
Agri_Fi_For_Min
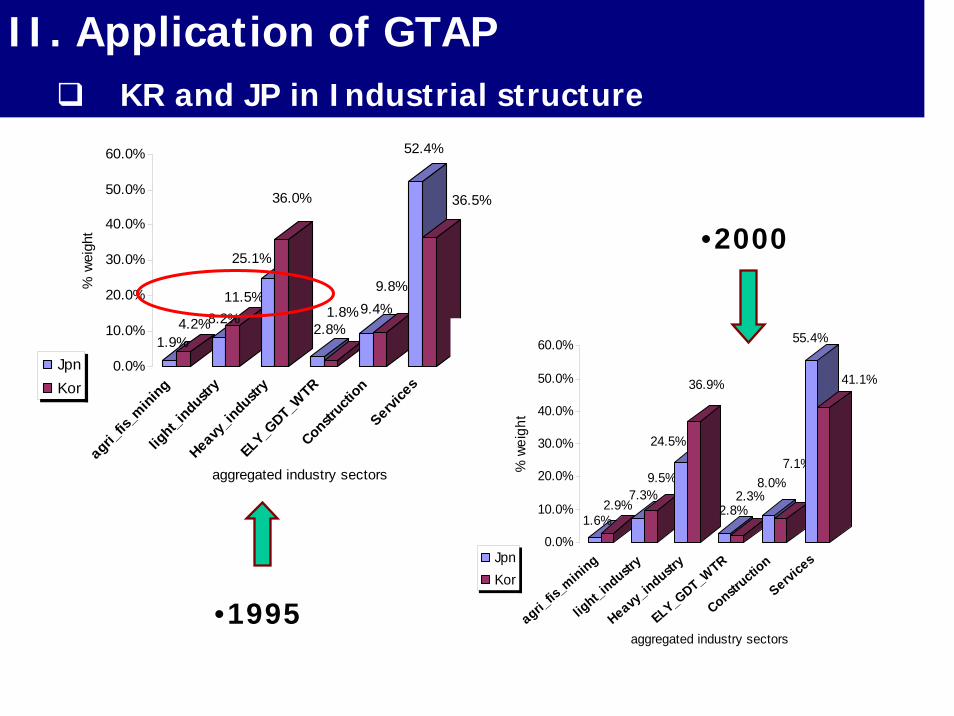
II. Application of GTAPKR and JP in Industrial structure
1.9%4.2%8.2%
11.5%
25.1%
36.0%
2.8%1.8%9.4%
9.8%
52.4%
36.5%
0.0%
10.0%
20.0%
30.0%
40.0%
50.0%
60.0%
% w
eigh
t
agri_fis
_mining
light_i
ndustry
Heavy_in
dustry
ELY_GDT_W
TRConstr
uction
Service
s
aggregated industry sectors
JpnKor
•1995
•2000
1.6%2.9%
7.3%9.5%
24.5%
36.9%
2.8%2.3%
8.0%7.1%
55.4%
41.1%
0.0%
10.0%
20.0%
30.0%
40.0%
50.0%
60.0%
% w
eigh
t
agri_fis_
mining
light_i
ndustry
Heavy_in
dustry
ELY_GDT_W
TR
Constructi
on
Service
s
aggregated industry sectors
JpnKor
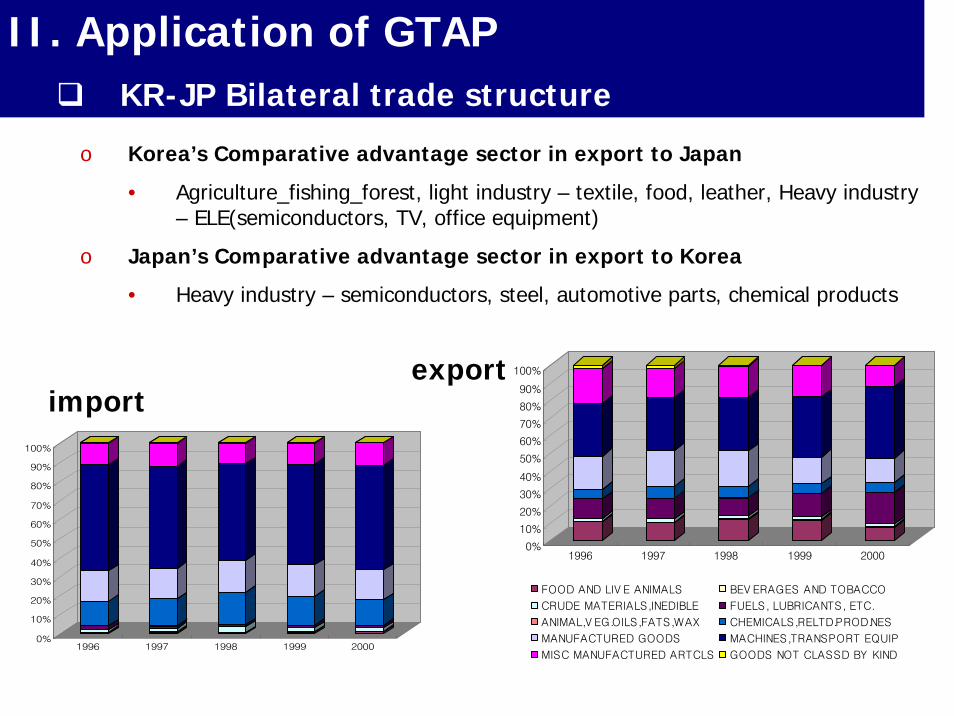
II. Application of GTAP KR-JP Bilateral trade structure
o Korea’s Comparative advantage sector in export to Japan
• Agriculture_fishing_forest, light industry – textile, food, leather, Heavy industry – ELE(semiconductors, TV, office equipment)
o Japan’s Comparative advantage sector in export to Korea
• Heavy industry – semiconductors, steel, automotive parts, chemical products
0%
10%
20%
30%
40%
50%
60%
70%
80%
90%
100%
1996 1997 1998 1999 2000
FOOD AND LIV E ANIMALS BEV ERAGES AND TOBACCO
CRUDE MATERIALS,INEDIBLE FUELS, LUBRICANTS, ETC.
ANIMAL,V EG.OILS,FATS,WAX CHEMICALS,RELTD.PROD.NES
MANUFACTURED GOODS MACHINES,TRANSPORT EQUIP
MISC MANUFACTURED ARTCLS GOODS NOT CLASSD BY KIND
0%
10%
20%
30%
40%
50%
60%
70%
80%
90%
100%
1996 1997 1998 1999 2000
exportimport
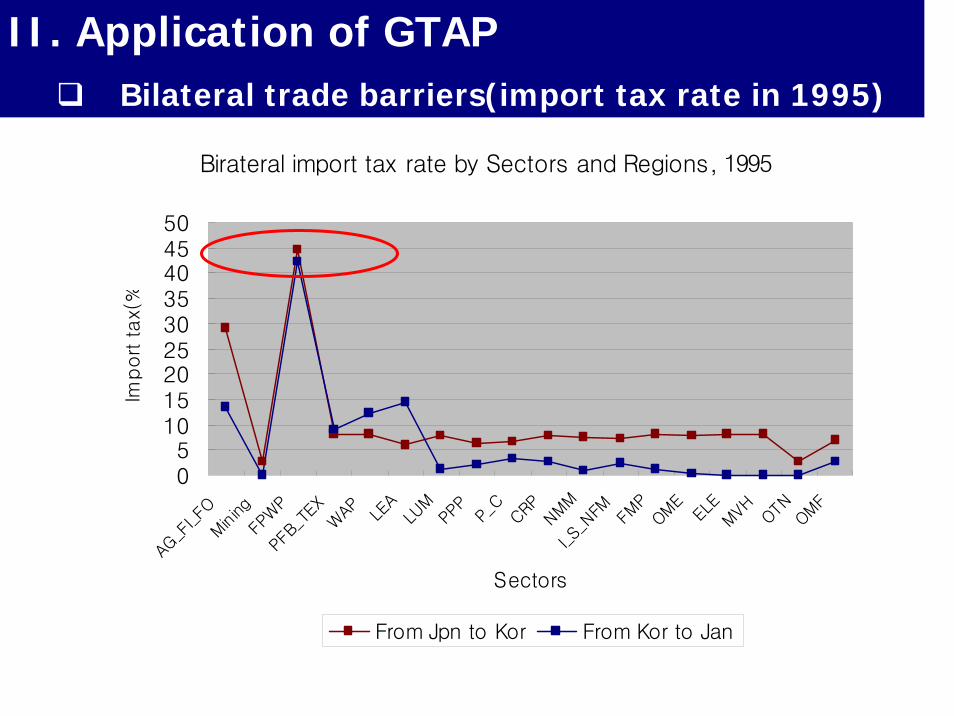
Birateral import tax rate by Sectors and Regions, 1995
05
101520253035404550
AG_F
I_FO
Min
ing
FPW
PPF
B_TE
XW
AP LEA
LUM
PPP
P_C
CRPNM
MI_
S_NFM FM
POM
E
ELE
MVH OTNOM
F
Sectors
Import tax(
%
From Jpn to Kor From Kor to Jan
II. Application of GTAPBilateral trade barriers(import tax rate in 1995)
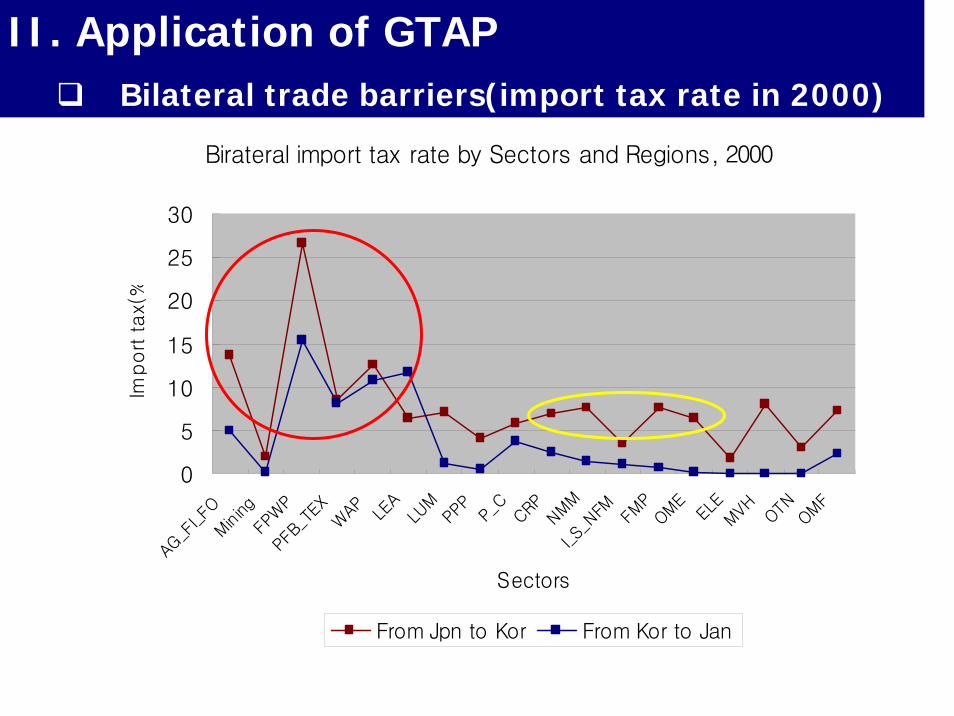
II. Application of GTAPBilateral trade barriers(import tax rate in 2000)
Birateral import tax rate by Sectors and Regions, 2000
0
5
10
15
20
25
30
AG_F
I_FO
Min
ingFP
WP
PFB_
TEX
WAP LE
ALU
MPP
P
P_C
CRPNM
MI_S
_NFM FM
POM
E
ELE
MVH OTNOM
F
Sectors
Import tax(
%
From Jpn to Kor From Kor to Jan
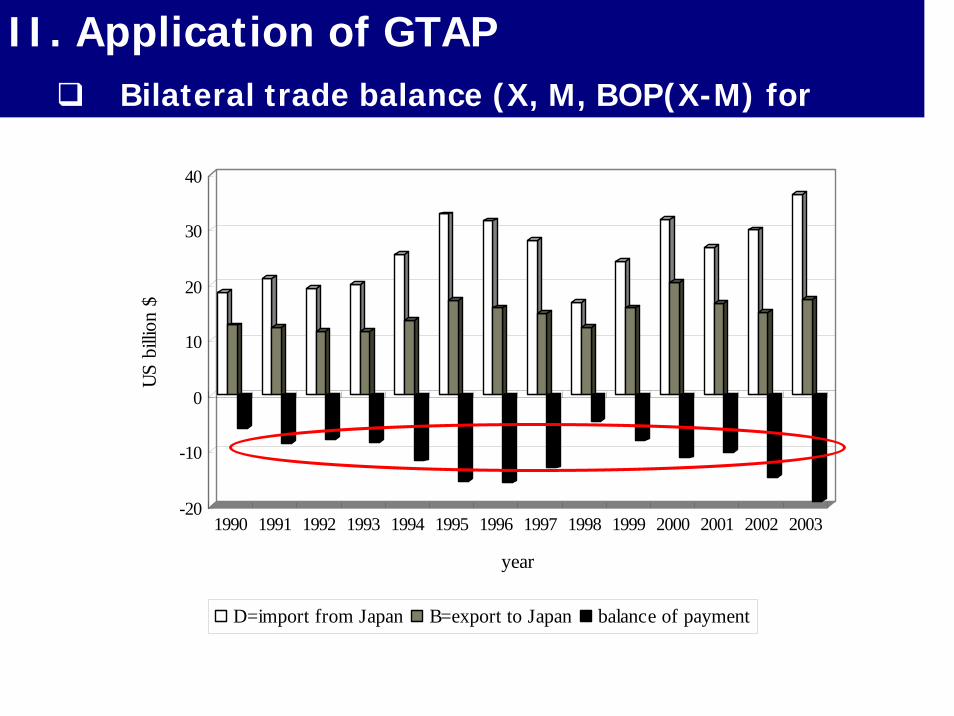
II. Application of GTAPBilateral trade balance (X, M, BOP(X-M) for Korea)
-20
-10
0
10
20
30
40US
billi
on $
1990 1991 1992 1993 1994 1995 1996 1997 1998 1999 2000 2001 2002 2003
year
D=import from Japan B=export to Japan balance of payment
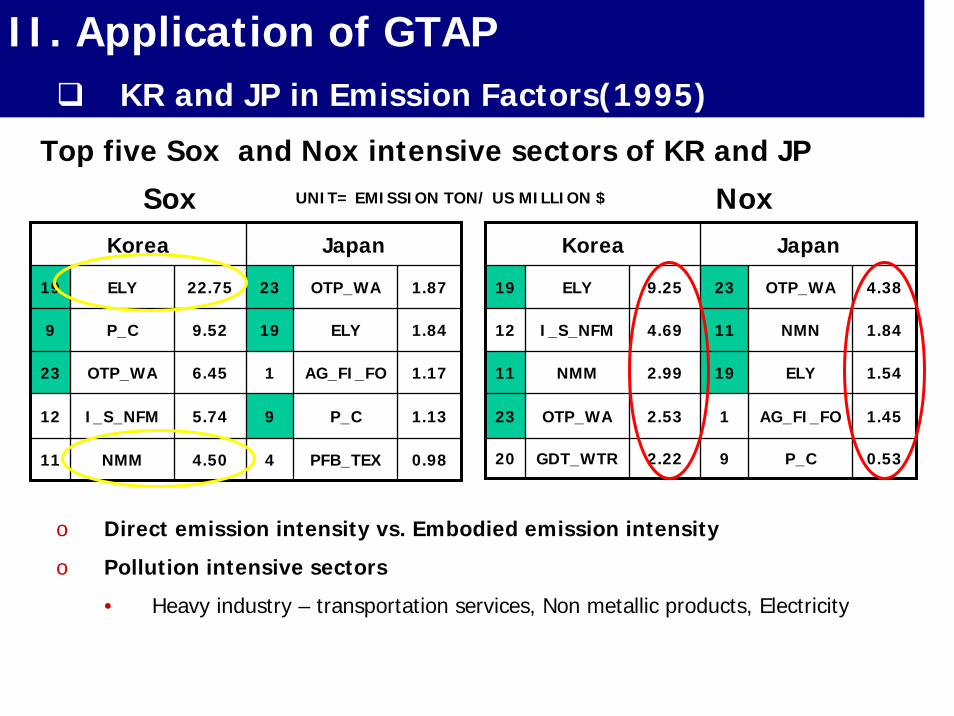
II. Application of GTAPKR and JP in Emission Factors(1995)
Korea Japan
19 ELY 22.75 23 OTP_WA 1.87
9 P_C 9.52 19 ELY 1.84
23 OTP_WA 6.45 1 AG_FI_FO 1.17
12 I_S_NFM 5.74 9 P_C 1.13
11 NMM 4.50 4 PFB_TEX 0.98
Top five Sox and Nox intensive sectors of KR and JP
0.53P_C92.22GDT_WTR20
1.45AG_FI_FO12.53OTP_WA23
1.54ELY192.99NMM11
1.84NMN114.69I_S_NFM12
4.38OTP_WA239.25ELY19
JapanKorea
UNIT= EMISSION TON/ US MILLION $Sox Nox
o Direct emission intensity vs. Embodied emission intensity
o Pollution intensive sectors
• Heavy industry – transportation services, Non metallic products, Electricity
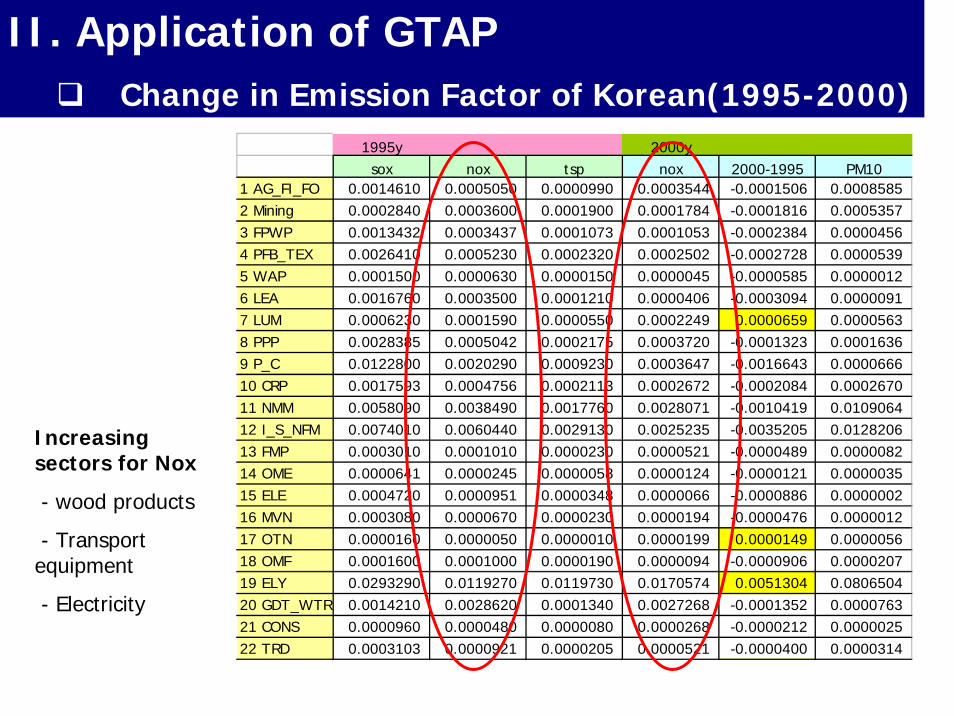
II. Application of GTAPChange in Emission Factor of Korean(1995-2000)
1995y 2000ysox nox tsp nox 2000-1995 PM10
1 AG_FI_FO 0.0014610 0.0005050 0.0000990 0.0003544 -0.0001506 0.00085852 Mining 0.0002840 0.0003600 0.0001900 0.0001784 -0.0001816 0.00053573 FPWP 0.0013432 0.0003437 0.0001073 0.0001053 -0.0002384 0.00004564 PFB_TEX 0.0026410 0.0005230 0.0002320 0.0002502 -0.0002728 0.00005395 WAP 0.0001500 0.0000630 0.0000150 0.0000045 -0.0000585 0.00000126 LEA 0.0016760 0.0003500 0.0001210 0.0000406 -0.0003094 0.00000917 LUM 0.0006230 0.0001590 0.0000550 0.0002249 0.0000659 0.00005638 PPP 0.0028385 0.0005042 0.0002175 0.0003720 -0.0001323 0.00016369 P_C 0.0122800 0.0020290 0.0009230 0.0003647 -0.0016643 0.000066610 CRP 0.0017593 0.0004756 0.0002113 0.0002672 -0.0002084 0.000267011 NMM 0.0058090 0.0038490 0.0017760 0.0028071 -0.0010419 0.010906412 I_S_NFM 0.0074010 0.0060440 0.0029130 0.0025235 -0.0035205 0.012820613 FMP 0.0003010 0.0001010 0.0000230 0.0000521 -0.0000489 0.000008214 OME 0.0000641 0.0000245 0.0000058 0.0000124 -0.0000121 0.000003515 ELE 0.0004720 0.0000951 0.0000348 0.0000066 -0.0000886 0.000000216 MVN 0.0003080 0.0000670 0.0000230 0.0000194 -0.0000476 0.000001217 OTN 0.0000160 0.0000050 0.0000010 0.0000199 0.0000149 0.000005618 OMF 0.0001600 0.0001000 0.0000190 0.0000094 -0.0000906 0.000020719 ELY 0.0293290 0.0119270 0.0119730 0.0170574 0.0051304 0.080650420 GDT_WTR 0.0014210 0.0028620 0.0001340 0.0027268 -0.0001352 0.000076321 CONS 0.0000960 0.0000480 0.0000080 0.0000268 -0.0000212 0.000002522 TRD 0.0003103 0.0000921 0.0000205 0.0000521 -0.0000400 0.0000314
Increasing sectors for Nox
- wood products
- Transport equipment
- Electricity
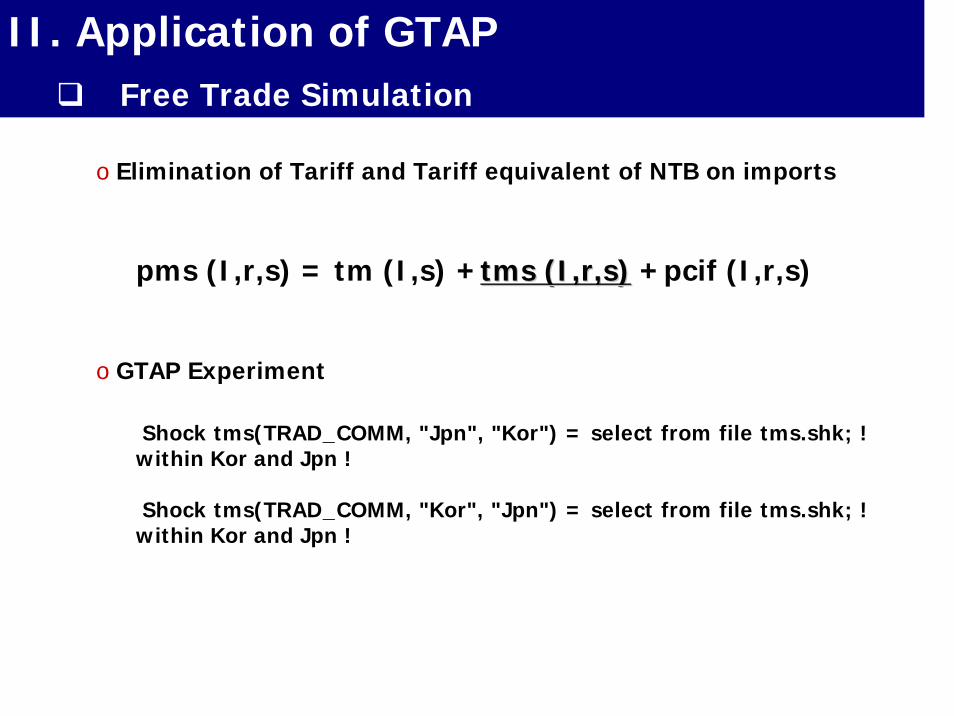
II. Application of GTAPFree Trade Simulation
o Elimination of Tariff and Tariff equivalent of NTB on imports
o GTAP Experiment
pms (I,r,s) = tm (I,s) +tmstms (I,r,s)(I,r,s) +pcif (I,r,s)
Shock tms(TRAD_COMM, "Jpn", "Kor") = select from file tms.shk; ! within Kor and Jpn !
Shock tms(TRAD_COMM, "Kor", "Jpn") = select from file tms.shk; ! within Kor and Jpn !
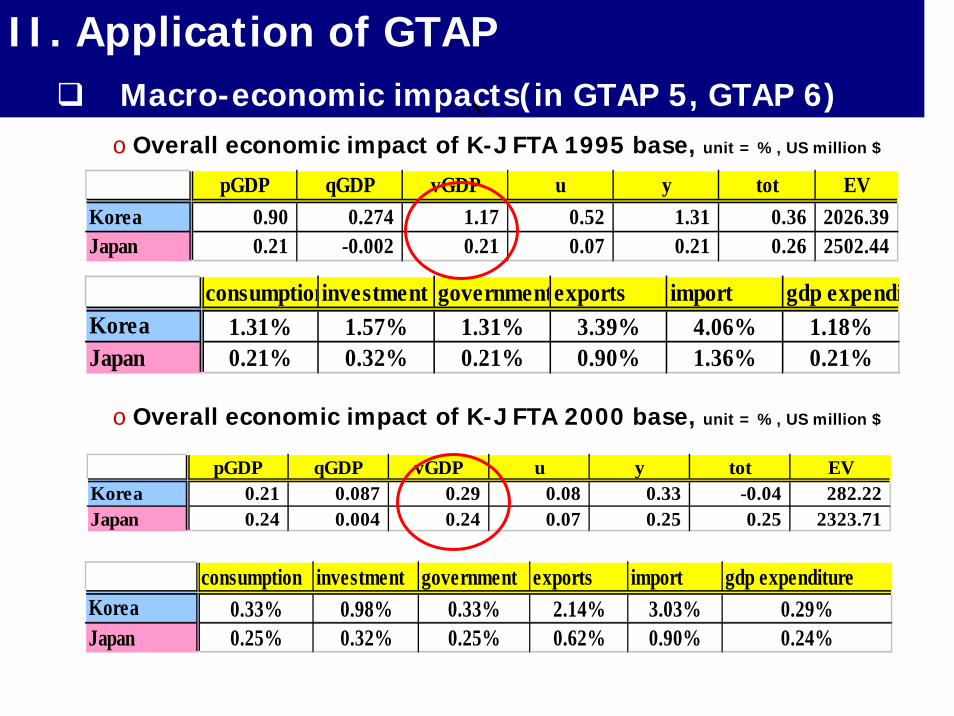
II. Application of GTAPMacro-economic impacts(in GTAP 5, GTAP 6)o Overall economic impact of K-J FTA 1995 base, unit = %, US million $
pGDP qGDP vGDP u y tot EVKorea 0.90 0.274 1.17 0.52 1.31 0.36 2026.39Japan 0.21 -0.002 0.21 0.07 0.21 0.26 2502.44
`
o Overall economic impact of K-J FTA 2000 base, unit = %, US million $
consumptioninvestment governmentexports import gdp expendiKorea 1.31% 1.57% 1.31% 3.39% 4.06% 1.18%Japan 0.21% 0.32% 0.21% 0.90% 1.36% 0.21%
pGDP qGDP vGDP u y tot EVKorea 0.21 0.087 0.29 0.08 0.33 -0.04 282.22Japan 0.24 0.004 0.24 0.07 0.25 0.25 2323.71
consumption investment government exports import gdp expenditureKorea 0.33% 0.98% 0.33% 2.14% 3.03% 0.29%Japan 0.25% 0.32% 0.25% 0.62% 0.90% 0.24%
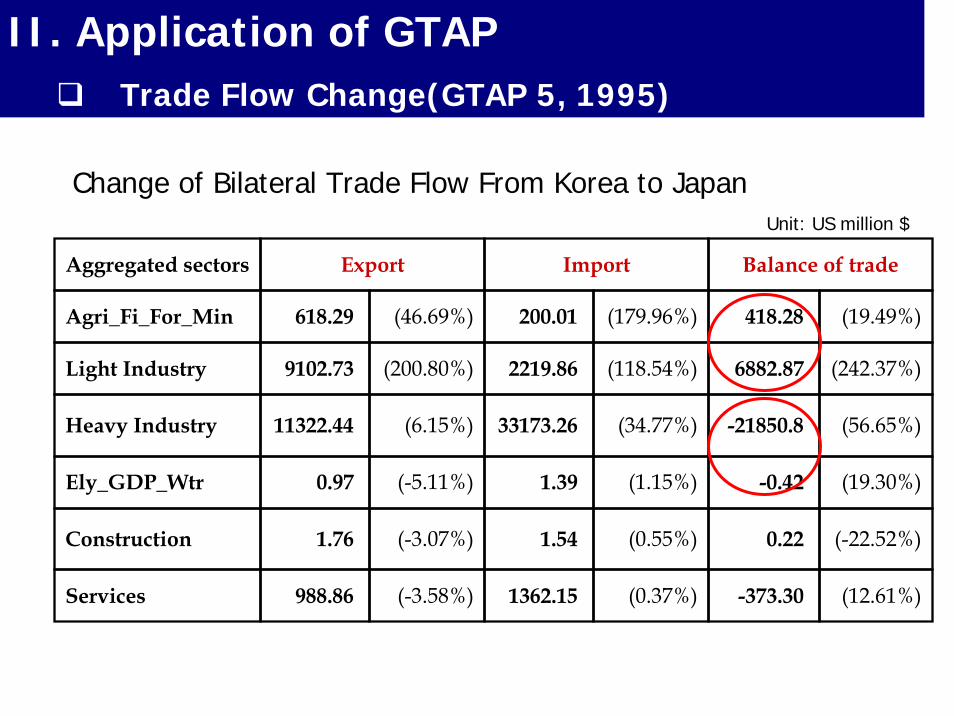
II. Application of GTAPTrade Flow Change(GTAP 5, 1995)
Aggregated sectors Export Import Balance of trade
Agri_Fi_For_Min 618.29 (46.69%) 200.01 (179.96%) 418.28 (19.49%)
Light Industry 9102.73 (200.80%) 2219.86 (118.54%) 6882.87 (242.37%)
Heavy Industry 11322.44 (6.15%) 33173.26 (34.77%) -21850.8 (56.65%)
Ely_GDP_Wtr 0.97 (-5.11%) 1.39 (1.15%) -0.42 (19.30%)
Construction 1.76 (-3.07%) 1.54 (0.55%) 0.22 (-22.52%)
Services 988.86 (-3.58%) 1362.15 (0.37%) -373.30 (12.61%)
Change of Bilateral Trade Flow From Korea to JapanUnit: US million $
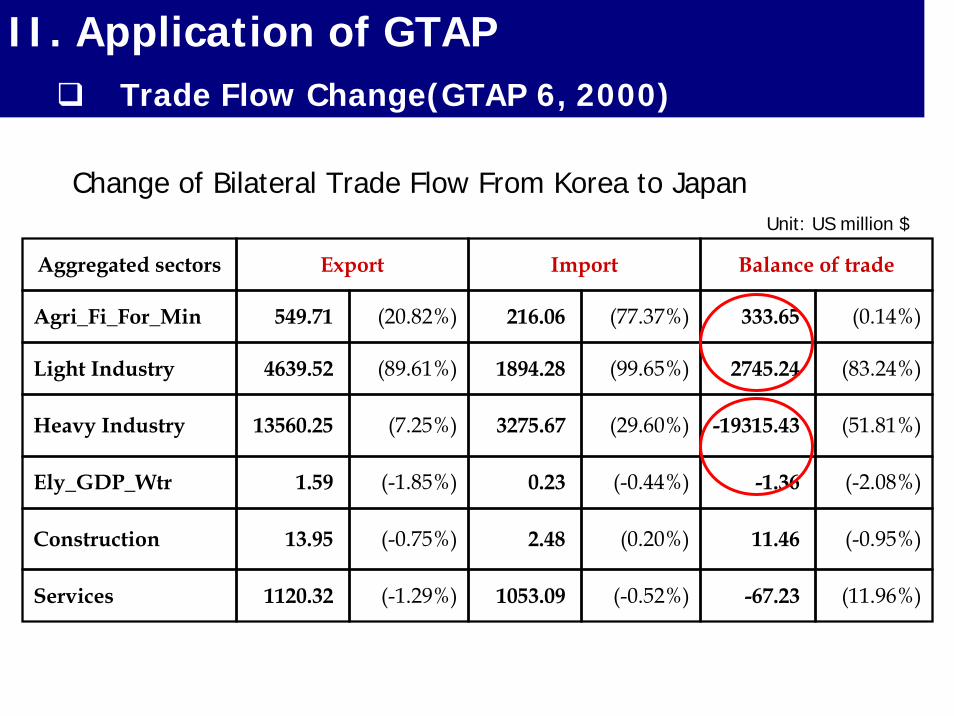
II. Application of GTAPTrade Flow Change(GTAP 6, 2000)
Aggregated sectors Export Import Balance of trade
Agri_Fi_For_Min 549.71 (20.82%) 216.06 (77.37%) 333.65 (0.14%)
Light Industry 4639.52 (89.61%) 1894.28 (99.65%) 2745.24 (83.24%)
Heavy Industry 13560.25 (7.25%) 3275.67 (29.60%) -19315.43 (51.81%)
Ely_GDP_Wtr 1.59 (-1.85%) 0.23 (-0.44%) -1.36 (-2.08%)
Construction 13.95 (-0.75%) 2.48 (0.20%) 11.46 (-0.95%)
Services 1120.32 (-1.29%) 1053.09 (-0.52%) -67.23 (11.96%)
Change of Bilateral Trade Flow From Korea to JapanUnit: US million $
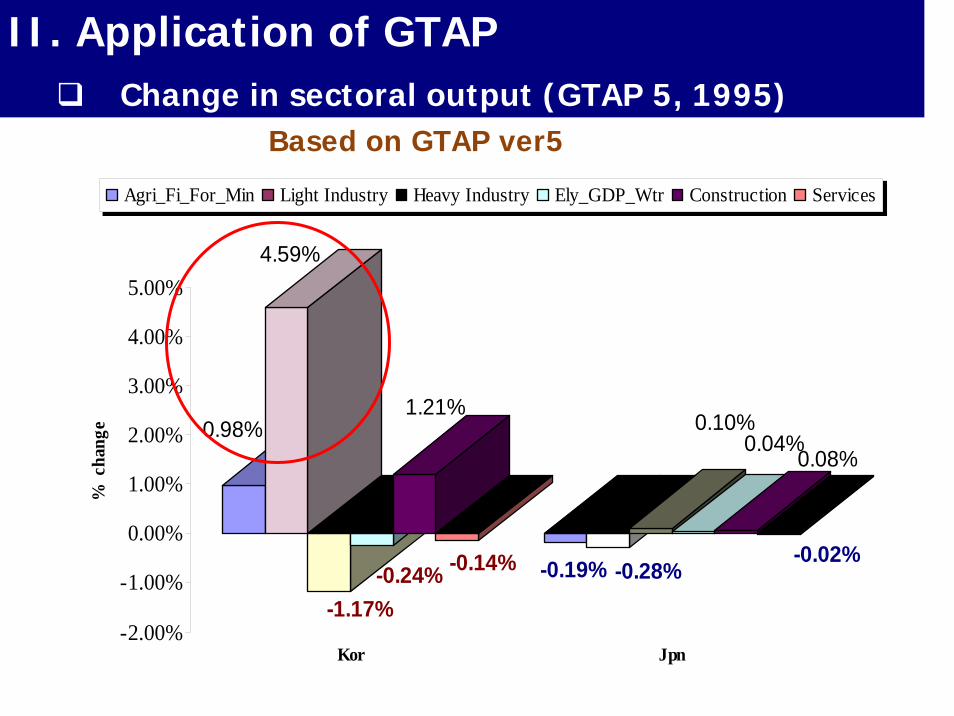
II. Application of GTAPChange in sectoral output (GTAP 5, 1995)
0.98%
4.59%
-1.17%-0.24%
1.21%
-0.14% -0.19% -0.28%
0.10%0.04%
0.08%
-0.02%
-2.00%
-1.00%
0.00%
1.00%
2.00%
3.00%
4.00%
5.00%
% c
hang
e
Kor Jpn
Agri_Fi_For_Min Light Industry Heavy Industry Ely_GDP_Wtr Construction Services
Based on GTAP ver5
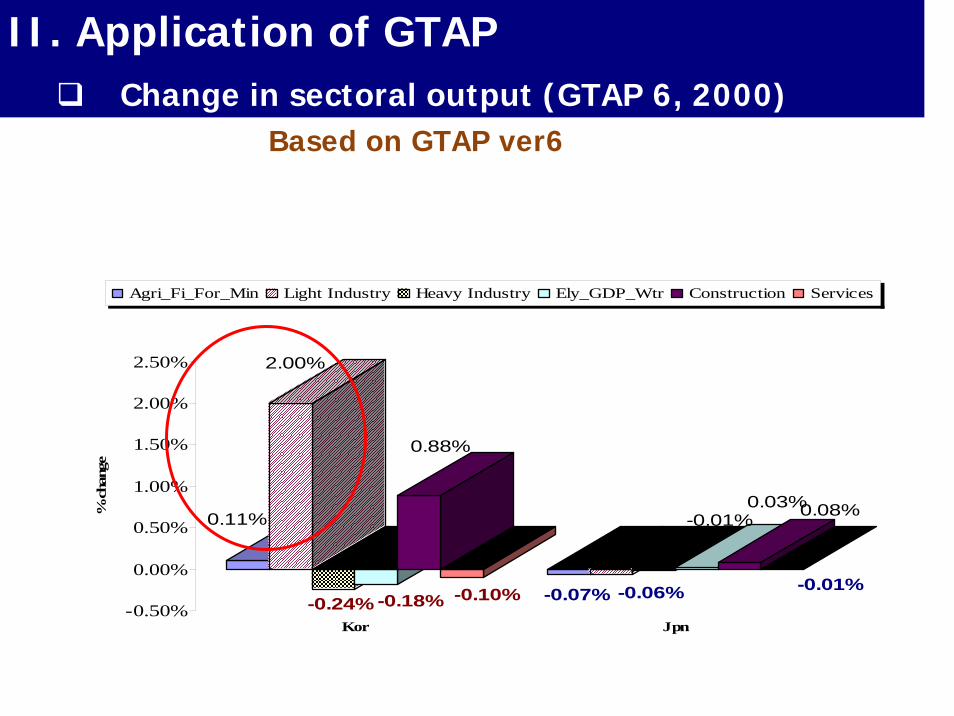
II. Application of GTAPChange in sectoral output (GTAP 6, 2000)
0.11%
2.00%
-0.24% -0.18%
0.88%
-0.10% -0.07% -0.06%
-0.01%0.03%0.08%
-0.01%-0.50%
0.00%
0.50%
1.00%
1.50%
2.00%
2.50%
% c
hang
e
Kor Jpn
Agri_Fi_For_Min Light Industry Heavy Industry Ely_GDP_Wtr Construction Services
Based on GTAP ver6
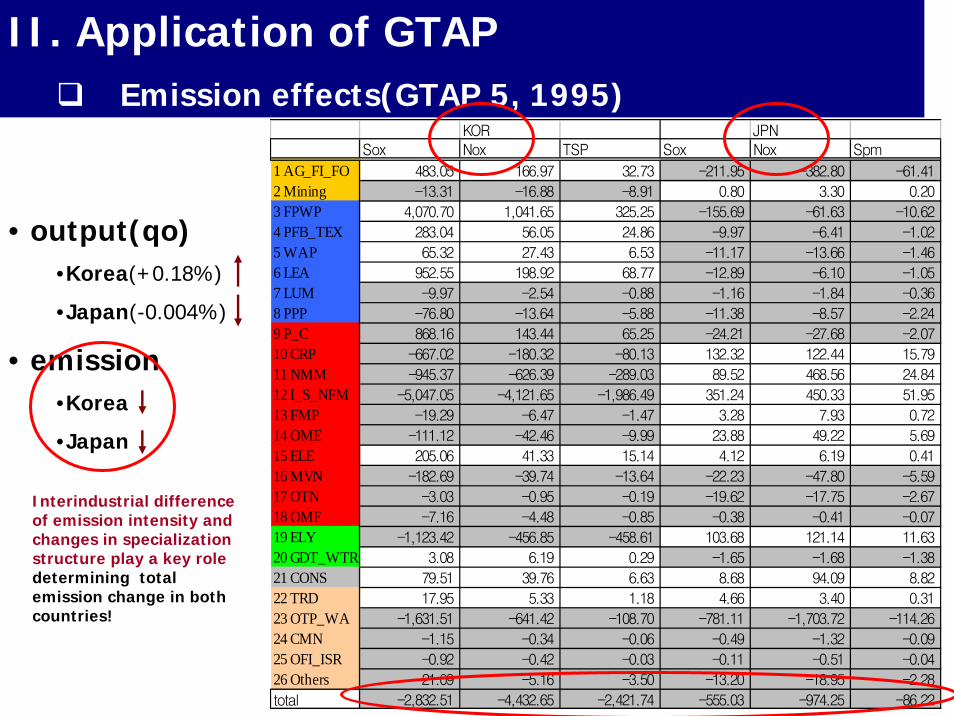
II. Application of GTAPEmission effects(GTAP 5, 1995)
• output(qo)•Korea(+0.18%)
•Japan(-0.004%)
• emission•Korea
•Japan
Interindustrial difference of emission intensity and changes in specialization structure play a key role determining total emission change in both countries!
KOR JPNSox Nox TSP Sox Nox Spm
1 AG_FI_FO 483.05 166.97 32.73 -211.95 -382.80 -61.41
2 Mining -13.31 -16.88 -8.91 0.80 3.30 0.20
3 FPWP 4,070.70 1,041.65 325.25 -155.69 -61.63 -10.62
4 PFB_TEX 283.04 56.05 24.86 -9.97 -6.41 -1.02
5 WAP 65.32 27.43 6.53 -11.17 -13.66 -1.46
6 LEA 952.55 198.92 68.77 -12.89 -6.10 -1.05
7 LUM -9.97 -2.54 -0.88 -1.16 -1.84 -0.368 PPP -76.80 -13.64 -5.88 -11.38 -8.57 -2.24
9 P_C 868.16 143.44 65.25 -24.21 -27.68 -2.07
10 CRP -667.02 -180.32 -80.13 132.32 122.44 15.79
11 NMM -945.37 -626.39 -289.03 89.52 468.56 24.84
12 I_S_NFM -5,047.05 -4,121.65 -1,986.49 351.24 450.33 51.95
13 FMP -19.29 -6.47 -1.47 3.28 7.93 0.72
14 OME -111.12 -42.46 -9.99 23.88 49.22 5.69
15 ELE 205.06 41.33 15.14 4.12 6.19 0.41
16 MVN -182.69 -39.74 -13.64 -22.23 -47.80 -5.59
17 OTN -3.03 -0.95 -0.19 -19.62 -17.75 -2.67
18 OMF -7.16 -4.48 -0.85 -0.38 -0.41 -0.07
19 ELY -1,123.42 -456.85 -458.61 103.68 121.14 11.63
20 GDT_WTR 3.08 6.19 0.29 -1.65 -1.68 -1.38
21 CONS 79.51 39.76 6.63 8.68 94.09 8.82
22 TRD 17.95 5.33 1.18 4.66 3.40 0.31
23 OTP_WA -1,631.51 -641.42 -108.70 -781.11 -1,703.72 -114.26
24 CMN -1.15 -0.34 -0.06 -0.49 -1.32 -0.09
25 OFI_ISR -0.92 -0.42 -0.03 -0.11 -0.51 -0.04
26 Others -21.09 -5.16 -3.50 -13.20 -18.95 -2.28
total -2,832.51 -4,432.65 -2,421.74 -555.03 -974.25 -86.22
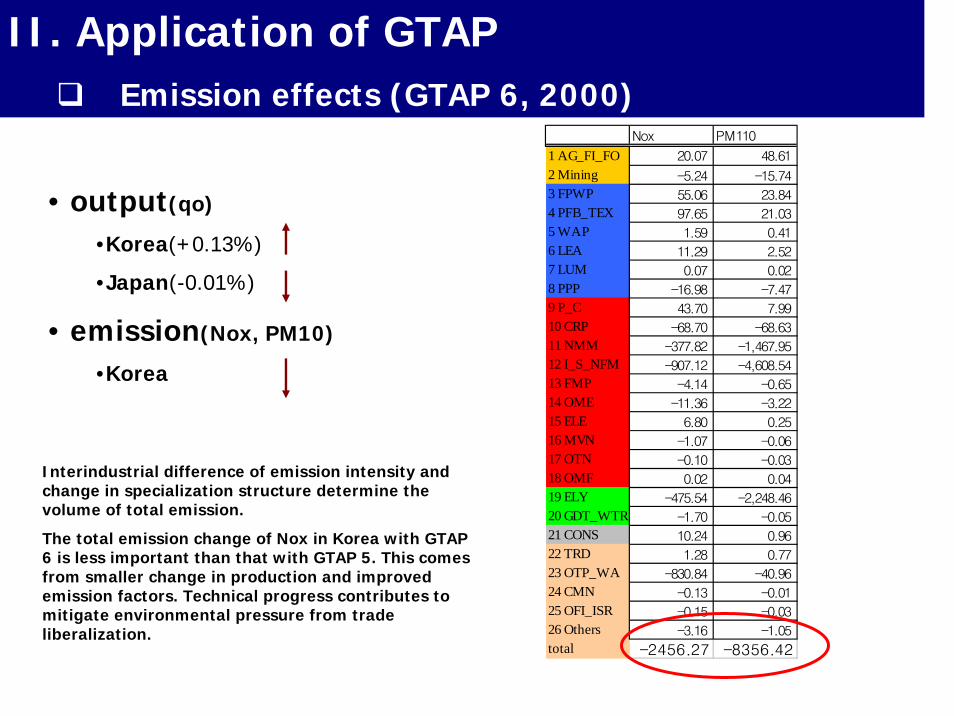
II. Application of GTAPEmission effects (GTAP 6, 2000)
Nox PM110
1 AG_FI_FO 20.07 48.61
2 Mining -5.24 -15.743 FPWP 55.06 23.844 PFB_TEX 97.65 21.035 WAP 1.59 0.416 LEA 11.29 2.527 LUM 0.07 0.02
8 PPP -16.98 -7.479 P_C 43.70 7.99
10 CRP -68.70 -68.6311 NMM -377.82 -1,467.9512 I_S_NFM -907.12 -4,608.5413 FMP -4.14 -0.6514 OME -11.36 -3.2215 ELE 6.80 0.2516 MVN -1.07 -0.0617 OTN -0.10 -0.0318 OMF 0.02 0.0419 ELY -475.54 -2,248.4620 GDT_WTR -1.70 -0.0521 CONS 10.24 0.9622 TRD 1.28 0.7723 OTP_WA -830.84 -40.9624 CMN -0.13 -0.0125 OFI_ISR -0.15 -0.0326 Others -3.16 -1.05
total -2456.27 -8356.42
• output(qo)
•Korea(+0.13%)
•Japan(-0.01%)
• emission(Nox, PM10)
•Korea
Interindustrial difference of emission intensity and change in specialization structure determine the volume of total emission.
The total emission change of Nox in Korea with GTAP 6 is less important than that with GTAP 5. This comes from smaller change in production and improved emission factors. Technical progress contributes to mitigate environmental pressure from trade liberalization.
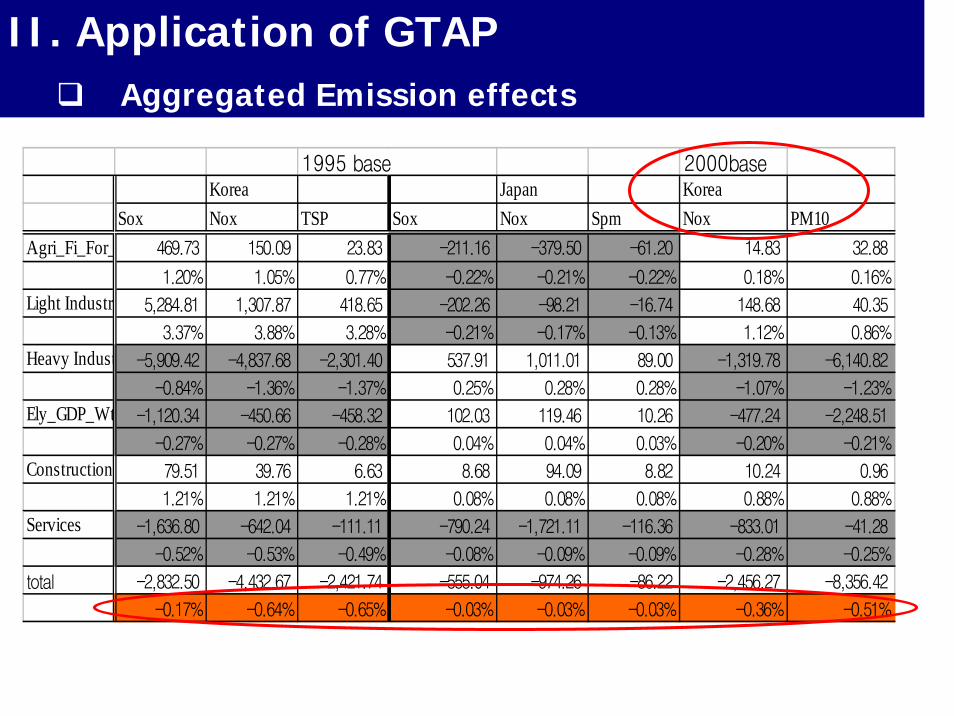
II. Application of GTAPAggregated Emission effects
1995 base 2000baseKorea Japan Korea
Sox Nox TSP Sox Nox Spm Nox PM10Agri_Fi_For_ 469.73 150.09 23.83 -211.16 -379.50 -61.20 14.83 32.88
1.20% 1.05% 0.77% -0.22% -0.21% -0.22% 0.18% 0.16%
Light Industry 5,284.81 1,307.87 418.65 -202.26 -98.21 -16.74 148.68 40.35
3.37% 3.88% 3.28% -0.21% -0.17% -0.13% 1.12% 0.86%
Heavy Indust -5,909.42 -4,837.68 -2,301.40 537.91 1,011.01 89.00 -1,319.78 -6,140.82
-0.84% -1.36% -1.37% 0.25% 0.28% 0.28% -1.07% -1.23%
Ely_GDP_Wt -1,120.34 -450.66 -458.32 102.03 119.46 10.26 -477.24 -2,248.51
-0.27% -0.27% -0.28% 0.04% 0.04% 0.03% -0.20% -0.21%
Construction 79.51 39.76 6.63 8.68 94.09 8.82 10.24 0.96
1.21% 1.21% 1.21% 0.08% 0.08% 0.08% 0.88% 0.88%
Services -1,636.80 -642.04 -111.11 -790.24 -1,721.11 -116.36 -833.01 -41.28
-0.52% -0.53% -0.49% -0.08% -0.09% -0.09% -0.28% -0.25%
total -2,832.50 -4,432.67 -2,421.74 -555.04 -974.26 -86.22 -2,456.27 -8,356.42
-0.17% -0.64% -0.65% -0.03% -0.03% -0.03% -0.36% -0.51%
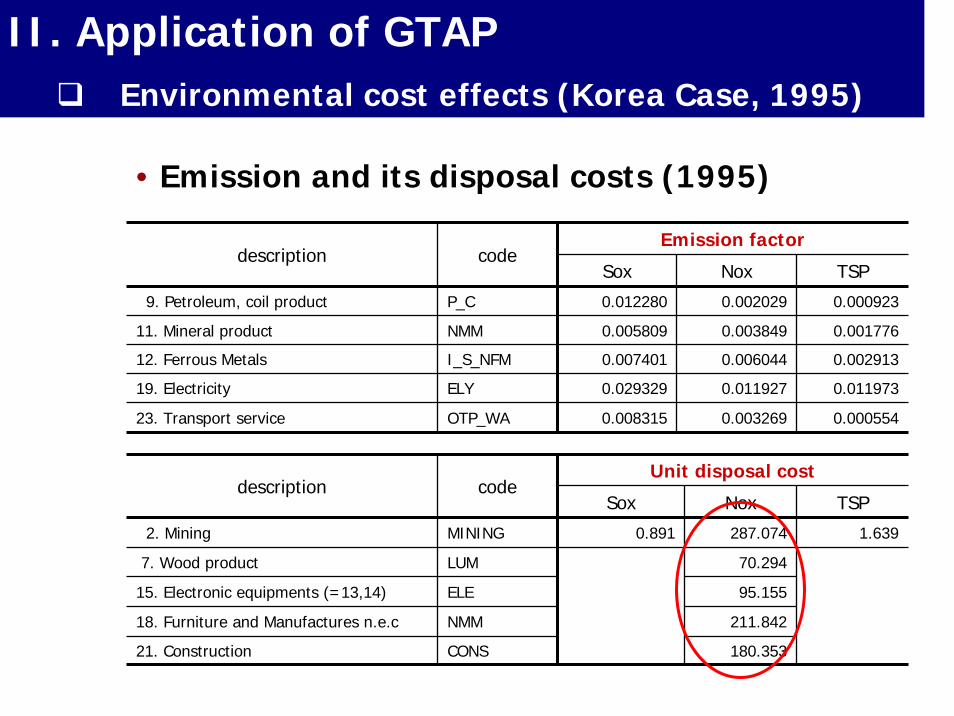
II. Application of GTAPEnvironmental cost effects (Korea Case, 1995)
Emission factordescription code
Sox Nox TSP
9. Petroleum, coil product P_C 0.012280 0.002029 0.000923
11. Mineral product NMM 0.005809 0.003849 0.001776
12. Ferrous Metals I_S_NFM 0.007401 0.006044 0.002913
19. Electricity ELY 0.029329 0.011927 0.011973
23. Transport service OTP_WA 0.008315 0.003269 0.000554
95.155ELE15. Electronic equipments (=13,14)
70.294LUM7. Wood product
1.639287.0740.891MINING2. Mining
211.842NMM18. Furniture and Manufactures n.e.c
180.353CONS21. Construction
TSPNoxSox
Unit disposal costcodedescription
• Emission and its disposal costs (1995)
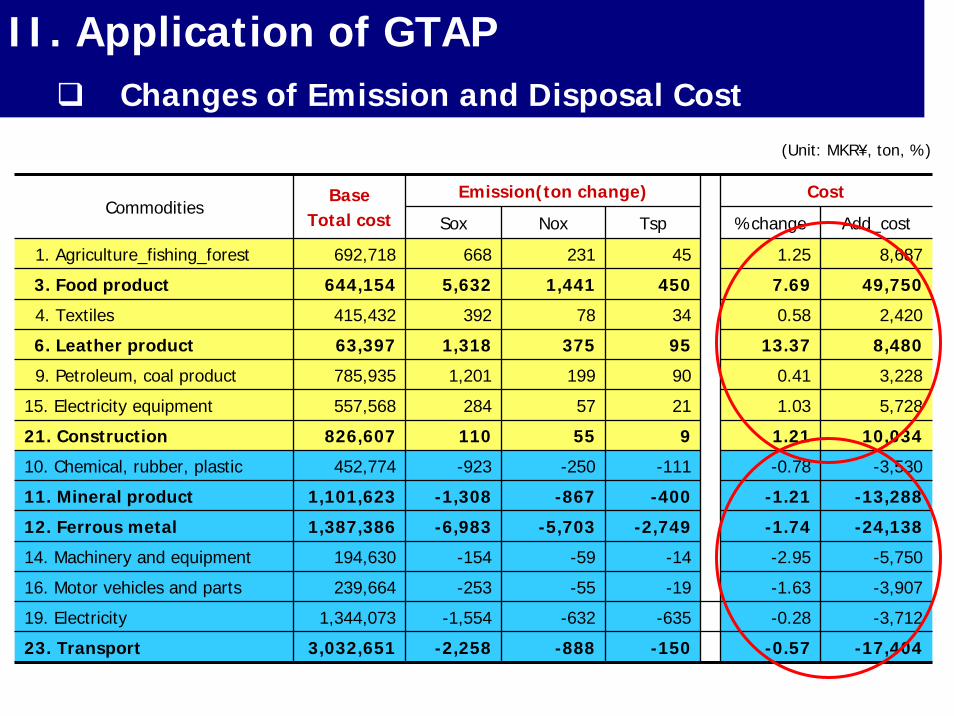
Emission(ton change) CostCommodities
BaseTotal cost Sox Nox Tsp %change Add_cost
1. Agriculture_fishing_forest
3. Food product
4. Textiles
6. Leather product
9. Petroleum, coal product
15. Electricity equipment
21. Construction
10. Chemical, rubber, plastic
11. Mineral product
12. Ferrous metal
14. Machinery and equipment
16. Motor vehicles and parts
19. Electricity
23. Transport
668 231 45 1.25 8,687692,718
644,154
415,432
63,397
785,935
557,568
826,607
452,774
1,101,623
1,387,386
194,630
239,664
1,344,073
5,632 1,441 450 7.69 49,750
392 78 34 0.58 2,420
1,318 375 95 13.37 8,480
1,201 199 90 0.41 3,228
284 57 21 1.03 5,728
110 55 9 1.21 10,034
-923 -250 -111 -0.78 -3,530
-253 -55 -19 -1.63 -3,907
-1,554 -632 -635 -0.28 -3,712
3,032,651
-1,308 -867 -400 -1.21 -13,288
-6,983 -5,703 -2,749 -1.74 -24,138
-154 -59 -14 -2.95 -5,750
-2,258 -888 -150 -0.57 -17,404
(Unit: MKR¥, ton, %)
II. Application of GTAPChanges of Emission and Disposal Cost
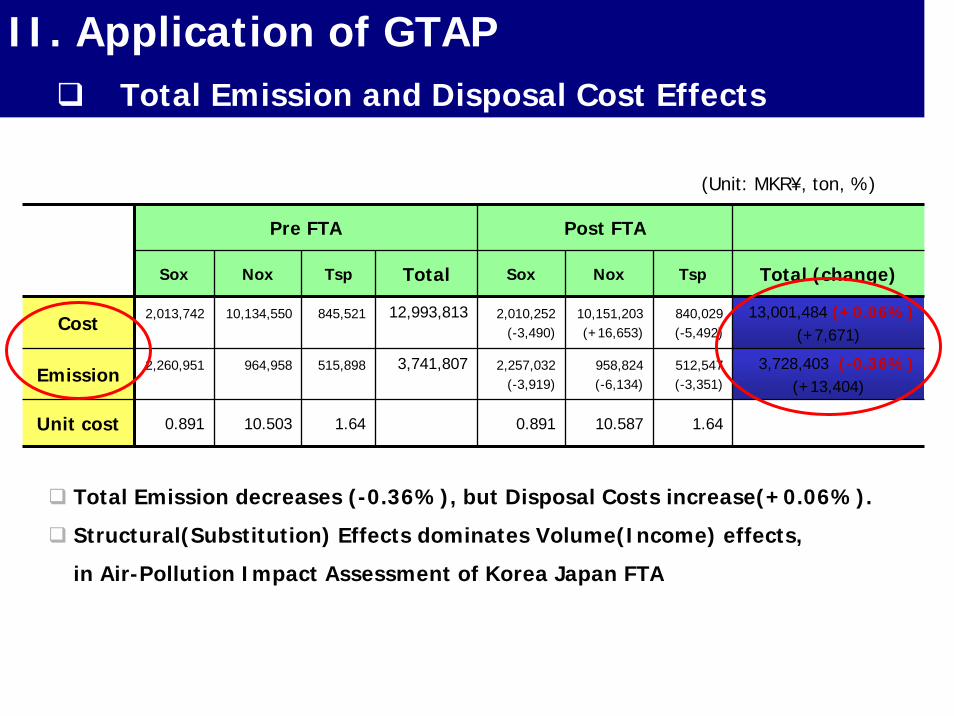
Pre FTA Post FTA
Sox Nox Tsp Total Sox Nox Tsp Total (change)
Cost 2,013,742 10,134,550 845,521 12,993,813 2,010,252(-3,490)
10,151,203(+16,653)
840,029(-5,492)
13,001,484 (+0.06%)(+7,671)
Emission 2,260,951 964,958 515,898 3,741,807 2,257,032(-3,919)
958,824(-6,134)
512,547(-3,351)
3,728,403 (-0.36%)(+13,404)
Unit cost 0.891 10.503 1.64 0.891 10.587 1.64
(Unit: MKR¥, ton, %)
Total Emission decreases (-0.36%), but Disposal Costs increase(+0.06%).
Structural(Substitution) Effects dominates Volume(Income) effects,
in Air-Pollution Impact Assessment of Korea Japan FTA
II. Application of GTAPTotal Emission and Disposal Cost Effects
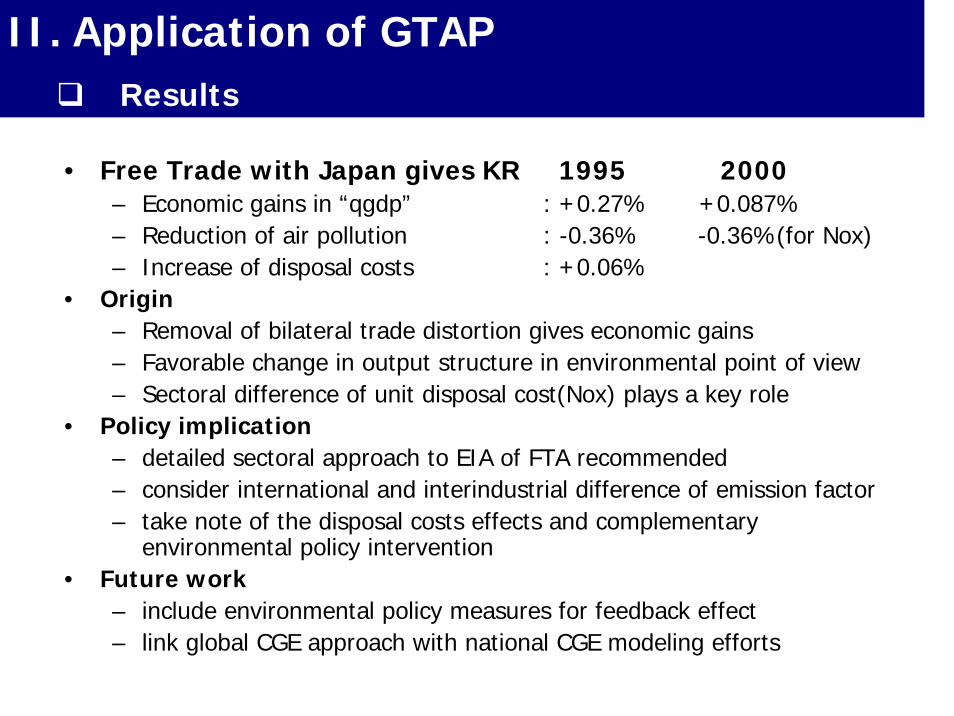
II. Application of GTAPResults
• Free Trade with Japan gives KR 1995 2000– Economic gains in “qgdp” : +0.27% +0.087%– Reduction of air pollution : -0.36% -0.36%(for Nox)– Increase of disposal costs : +0.06%
• Origin– Removal of bilateral trade distortion gives economic gains– Favorable change in output structure in environmental point of view– Sectoral difference of unit disposal cost(Nox) plays a key role
• Policy implication– detailed sectoral approach to EIA of FTA recommended– consider international and interindustrial difference of emission factor– take note of the disposal costs effects and complementary
environmental policy intervention • Future work
– include environmental policy measures for feedback effect– link global CGE approach with national CGE modeling efforts
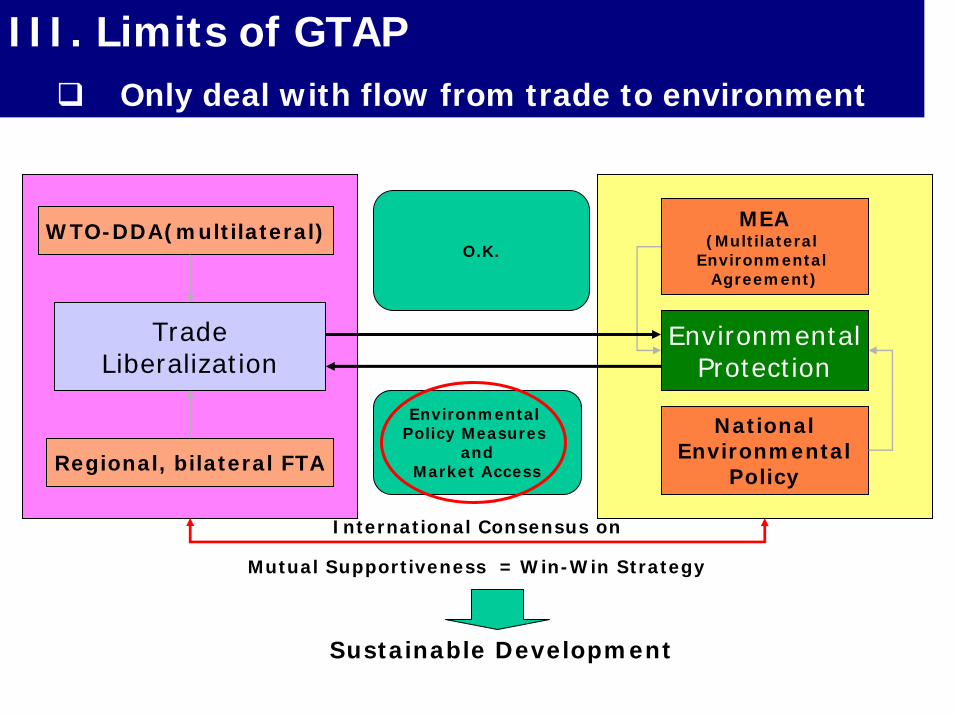
III. Limits of GTAPOnly deal with flow from trade to environment
WTO-DDA(multilateral)
TradeLiberalization
Regional, bilateral FTA
MEA(Multilateral
Environmental Agreement)
EnvironmentalProtection
NationalEnvironmental
Policy
Mutual Supportiveness = Win-Win Strategy
Sustainable Development
International Consensus on
O.K.
Environmental Policy Measures
andMarket Access
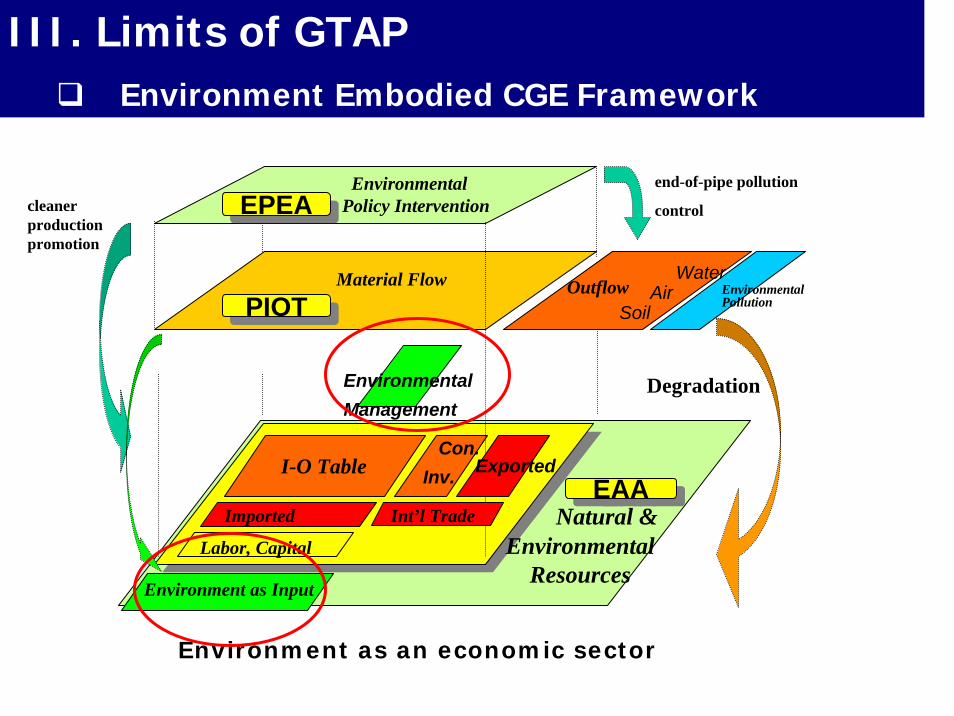
III. Limits of GTAPEnvironment Embodied CGE Framework
Environmental Policy Intervention
Material Flow
end-of-pipe pollution
control
· Water·Air
·Soil
Degradation
cleaner productionpromotion
Labor, Capital
Environmental Pollution
Con. Inv.I-O Table
EPEAEPEA
PIOTPIOTOutflow
EAAEAANatural &
Environmental Resources
Exported
Imported Int’l Trade
Environment as an economic sector
Environment as Input
EnvironmentalManagement
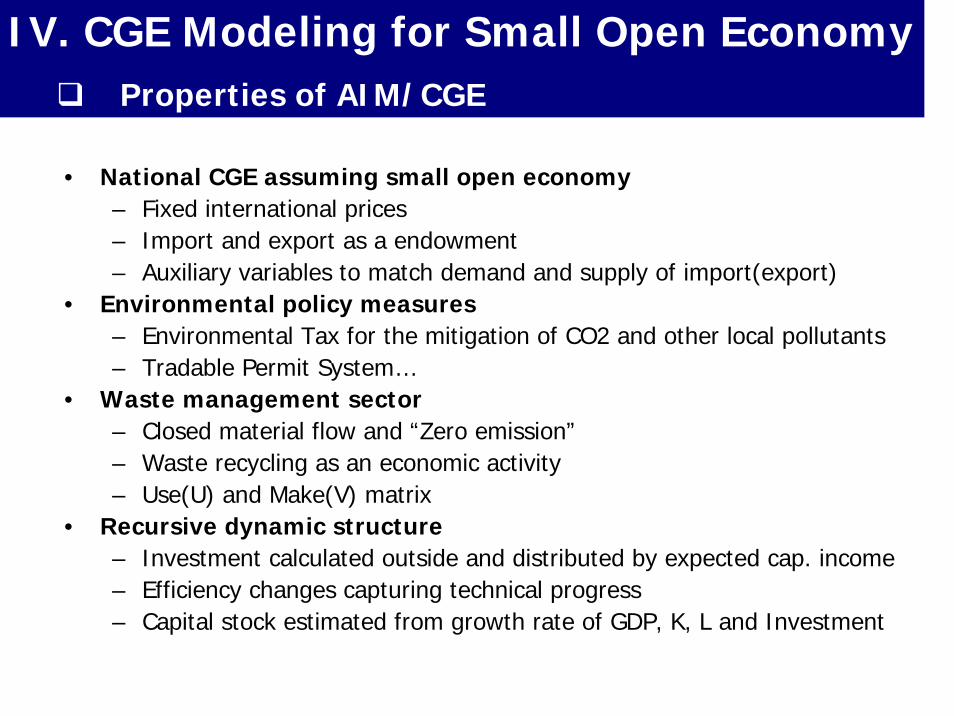
• National CGE assuming small open economy– Fixed international prices– Import and export as a endowment– Auxiliary variables to match demand and supply of import(export)
• Environmental policy measures– Environmental Tax for the mitigation of CO2 and other local pollutants– Tradable Permit System…
• Waste management sector– Closed material flow and “Zero emission”– Waste recycling as an economic activity– Use(U) and Make(V) matrix
• Recursive dynamic structure– Investment calculated outside and distributed by expected cap. income– Efficiency changes capturing technical progress– Capital stock estimated from growth rate of GDP, K, L and Investment
IV. CGE Modeling for Small Open EconomyProperties of AIM/CGE
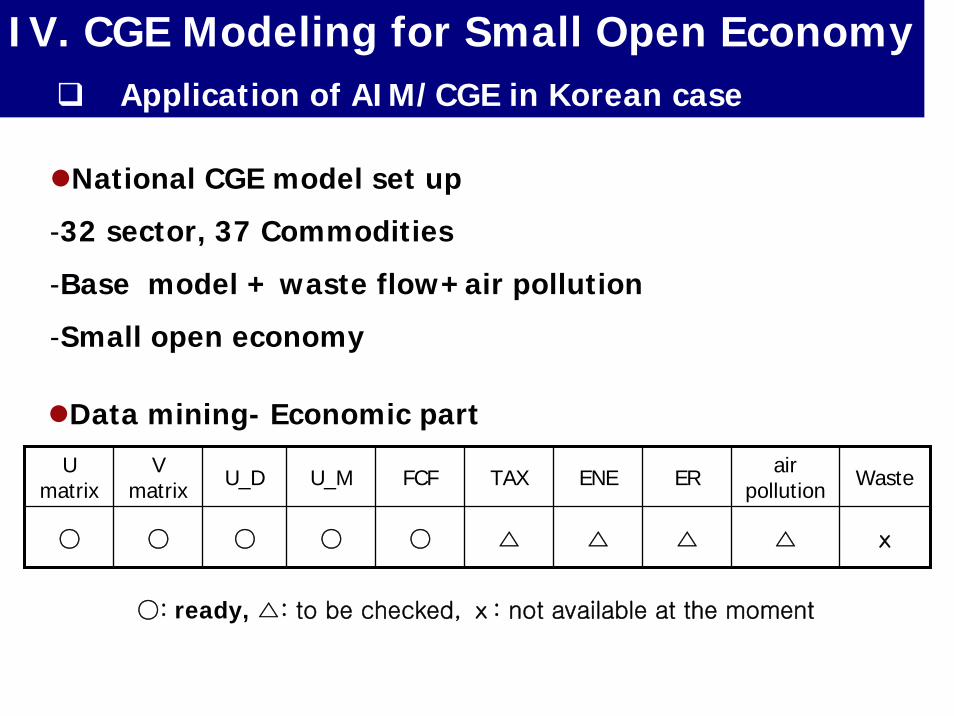
IV. CGE Modeling for Small Open EconomyApplication of AIM/CGE in Korean case
U matrix
V matrix U_D U_M FCF TAX ENE ER air
pollution
△ △△△○ ○○ ○
Waste
○ ⅹ
Data mining- Economic part
National CGE model set up
-32 sector, 37 Commodities
-Base model + waste flow+air pollution
-Small open economy
○: ready, △: to be checked, ⅹ: not available at the moment
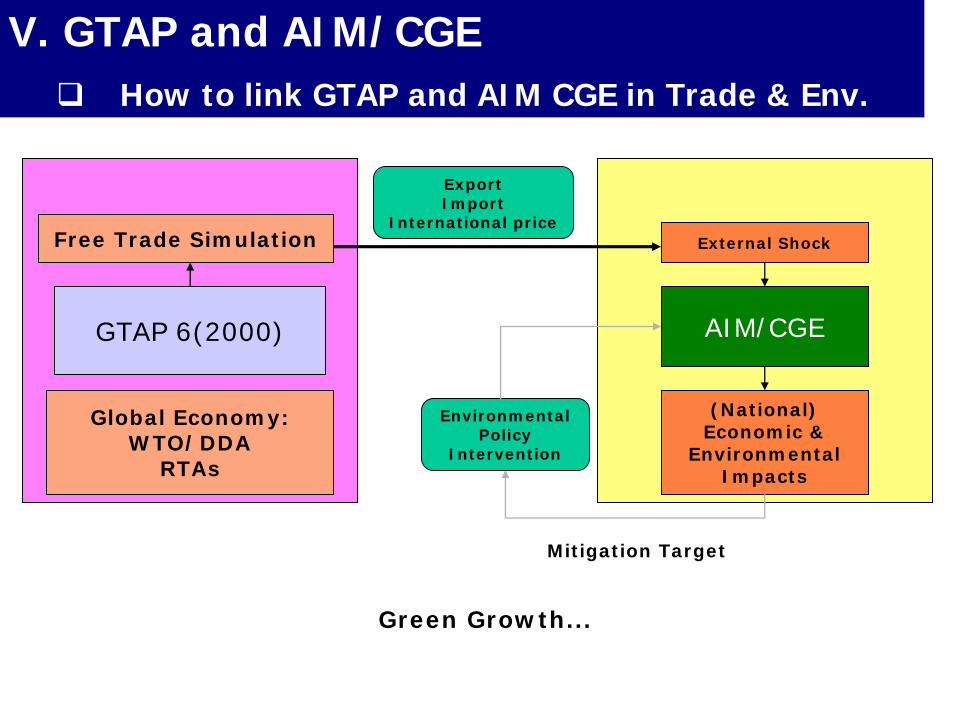
V. GTAP and AIM/CGEHow to link GTAP and AIM CGE in Trade & Env.
Free Trade Simulation
GTAP 6(2000)
Global Economy:WTO/DDA
RTAs
External Shock
AIM/CGE
(National)Economic &
EnvironmentalImpacts
Mitigation Target
Green Growth...
ExportImport
International price
EnvironmentalPolicy
Intervention
Tel:82-2-380-7640
Global Environment Research Center
Korea Environment Institute


