25
Transportation leadership you can trus presented to Talking Operations Webinar presented by Richard Margiotta Cambridge Systematics, Inc. June 28, 2006 Uses of Travel Time Reliability
| Date post: | 25-Dec-2015 |
| Category: |
Documents |
| Upload: | georgiana-terry |
| View: | 215 times |
| Download: | 0 times |

Transportation leadership you can trust.
presented to
Talking Operations Webinar
presented by
Richard MargiottaCambridge Systematics, Inc.
June 28, 2006
Uses of Travel Time Reliability

2
Why is Reliability Important?
Reliability is an indication of how travel times vary from day-to-day … OR …
• How consistent is travel?
• How predictable is travel?
Variability in travel times means that extra time must be planned for (the aforementioned Buffer).
In other words, travelers have to leave earlier to account for the Buffer

3
Why is Reliability Important? (cont.)
The Buffer has costs associated with it
• Planned extra time at least as costly as regular travel time
• Some studies place the Buffer’s costs at 2-6 times higher than average travel time
• Some trips will still exceed the Buffer – late penalties
• Some trips will take much less than the Buffer – early arrival penalties
Reliability (or the lack of it) just says that travel times are inconsistent/variable – it doesn’t tell you why!

4
So Why Do Travel Times Vary?
Seven Sources of Unreliability
1. Traffic incidents
2. Special events
3. Work zones
4. Weather
5. Day-to-day demand (volume) fluctuations
6. Traffic control devices (railroad crossing, poor signal timing)
7. Inadequate base capacity
5
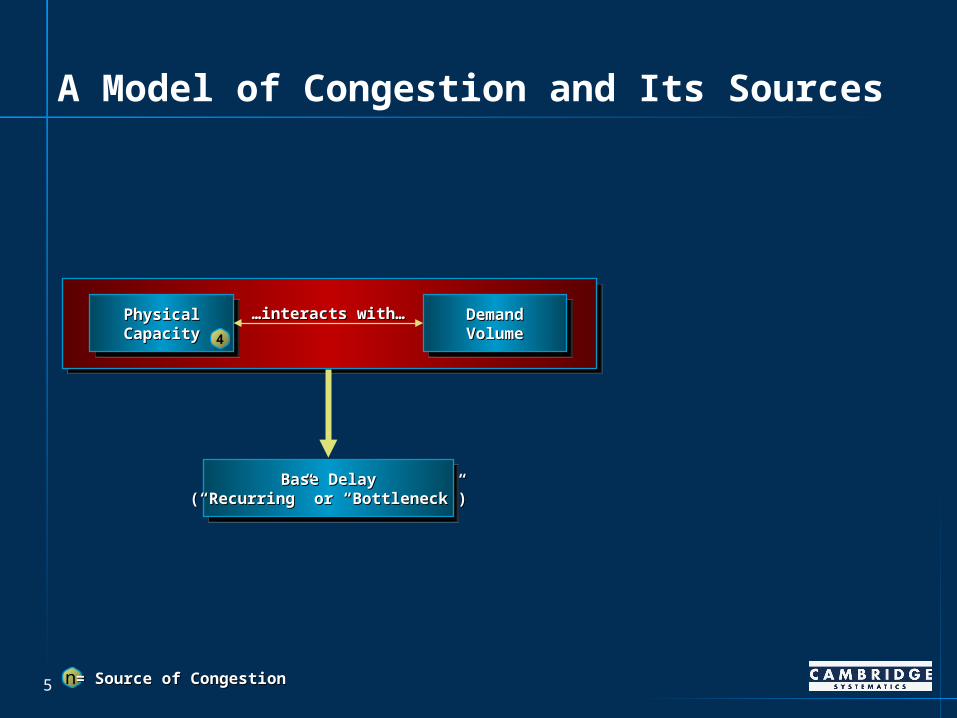
A Model of Congestion and Its Sources
n = Source of Congestion= Source of Congestion
Base DelayBase Delay(“Recurring” or “Bottleneck”)(“Recurring” or “Bottleneck”)
PhysicalPhysicalCapacityCapacity
……interacts withinteracts with…… DemandDemandVolumeVolume4

6
A Model of Congestion and Its Sources
n = Source of Congestion= Source of Congestion
Base DelayBase Delay(“Recurring” or “Bottleneck”)(“Recurring” or “Bottleneck”)
PhysicalPhysicalCapacityCapacity
……interacts withinteracts with…… DemandDemandVolumeVolume4
Daily/SeasonalDaily/SeasonalVariationVariation
SpecialSpecialEventsEvents
PlannedPlanned
……determinedetermine……EmergenciesEmergencies2 3

7
A Model of Congestion and Its Sources
n = Source of Congestion= Source of Congestion
Base DelayBase Delay(“Recurring” or “Bottleneck”)(“Recurring” or “Bottleneck”)
PhysicalPhysicalCapacityCapacity
……interacts withinteracts with…… DemandDemandVolumeVolume
Daily/SeasonalDaily/SeasonalVariationVariation
SpecialSpecialEventsEvents
PlannedPlanned
……determinedetermine……EmergenciesEmergencies2 31
……lowers capacitylowers capacityand changes demandand changes demand……
Traffic ControlTraffic ControlDevicesDevices
Roadway EventsRoadway Events
WeatherWeather
IncidentsIncidents
WorkWorkZonesZones
5
6
7
…can cause…
…can cause…
…can cause…

8
A Model of Congestion and Its Sources
n = Source of Congestion= Source of Congestion
Base DelayBase Delay(“Recurring” or “Bottleneck”)(“Recurring” or “Bottleneck”)
PhysicalPhysicalCapacityCapacity
……interacts withinteracts with…… DemandDemandVolumeVolume4
Event-RelatedEvent-RelatedDelayDelay
TotalTotalCongestionCongestion
Daily/SeasonalDaily/SeasonalVariationVariation
SpecialSpecialEventsEvents
PlannedPlanned
……determinedetermine……EmergenciesEmergencies2 31
……lowers capacitylowers capacityand changes demandand changes demand……
Traffic ControlTraffic ControlDevicesDevices
Roadway EventsRoadway Events
WeatherWeather
IncidentsIncidents
WorkWorkZonesZones
5
6
7
…can cause…
…can cause…
…can cause…

9
Effects of Incidents and Weather on Reliability

10
Changes in a High Growth Corridor

11
Use of Reliability: Congestion by Source
Where should we be concentrating our resources and effort?
• National programs
• State programs
• Corridor-specific programs

12
Current Estimates of Delay by Source: National
13
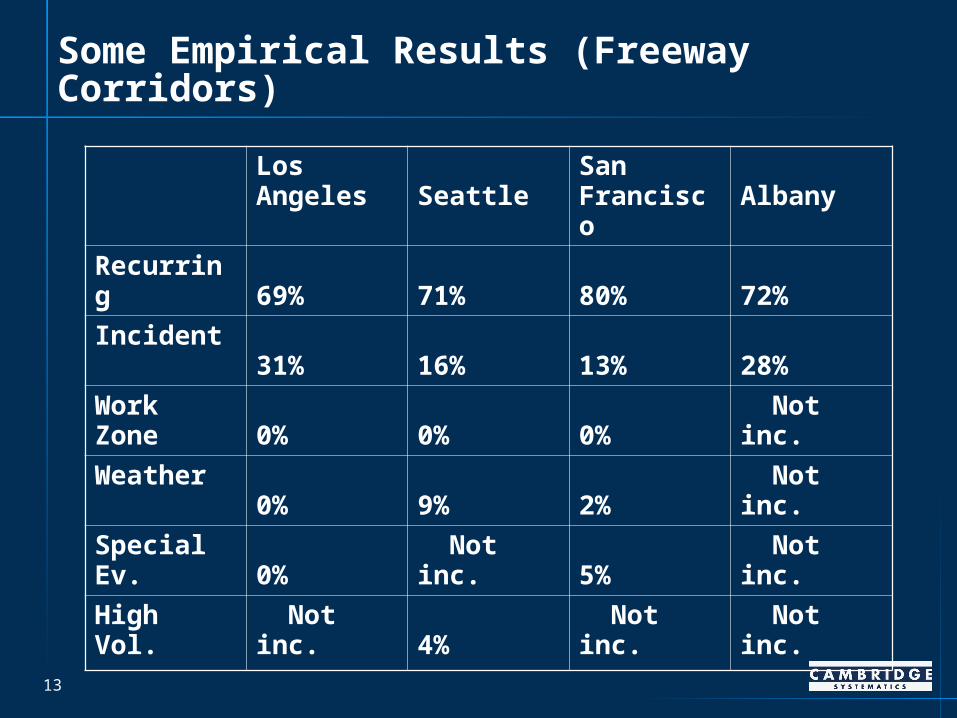
Some Empirical Results (Freeway Corridors)
Los Angeles
Seattle
San Francisco
Albany
Recurring 69% 71% 80% 72%
Incident 31% 16% 13% 28%
Work Zone 0% 0% 0% Not inc.
Weather 0% 9% 2% Not inc.
Special Ev. 0% Not inc. 5% Not inc.
High Vol. Not inc. 4% Not inc. Not inc.

14
The Effect of Treating Unreliability: I-75 Central Atlanta, 2002, SB, 4-7 PM

15
Operator’s View of Reliability: What’s Happening Now Compared to “Normal”
I-75 SB, 1/24/2002 (Thurs)
4.00
5.00
6.00
7.00
8.00
9.00
10.00
11.00
12.00
13.00
14.00
4:00 PM 4:29 PM 4:58 PM 5:26 PM 5:55 PM 6:24 PM
Average
Today
95th %ile

16
Use of Reliability: Performance Measurement
Part of a comprehensive program to monitor congestion trends and operational effectiveness
Can be applied at management, planning, and operations levels

17
Overall Reliability
• Travel conditions are unreliable (Variable over time)
USED BYMEASURESWHAT THEY TELL YOU
• Upper Management• Public Relations• Planners
Delay by Source
e.g., vehicle-hours
• What’s causing unreliable travel (e.g., incidents, weather, work zones)
• Mid-Management• Operators• Planners
Work Zones WeatherSpecial Events Incidents Traffic
ControlDemand-
VariabilityBase
Capacity
Activities, Procedures, and
Policies
• What aspects of operations, management, and construction need to be improved
• Operators• Field Managers
… for incidents …
e.g., buffer index
INCIDENT TIMELINE
Incident Occurs
Incident Recorded into
CAD (Detection)Incident Verified
Personnel Dispatched and Actions Initiated
Responders Arrive to
Scene
Incident Cleared and Actions Canceled
Return to Normal
Conditions
6:35 A.M. 6:42 A.M. 6:47 A.M. 6:49 A.M. 6:50-7:00 A.M. 7:15 A.M. 8:26 A.M.
1 2 3 4 5 6
Detection Time
Verification Time
Dispatch Time
Response Time
Clearance Time
Time to Normal
Conditions
Level 1
Level 2
Level 3

18

19

20
Other applications/studies
Goods movement study, Southern CA Assoc. of Governments
“Travel time reliability at international border crossings,” FHWA
“Travel times in freight-significant corridors,” FHWA
National Transportation Operations Coalition
SHRP II: “Providing a Highway with Reliability Travel Times”

21
SCAG Goods Movement Study SCAG Goods Movement Study
Speed• Trucking Industry Value-of-Time:
$25 to $200 per hour depending on cargo
• Analysis Assumption:
$73 per hour (2005 $)
Reliability• Unexpected delays can increase Value-of-Time
by 50 to 250 percent
22
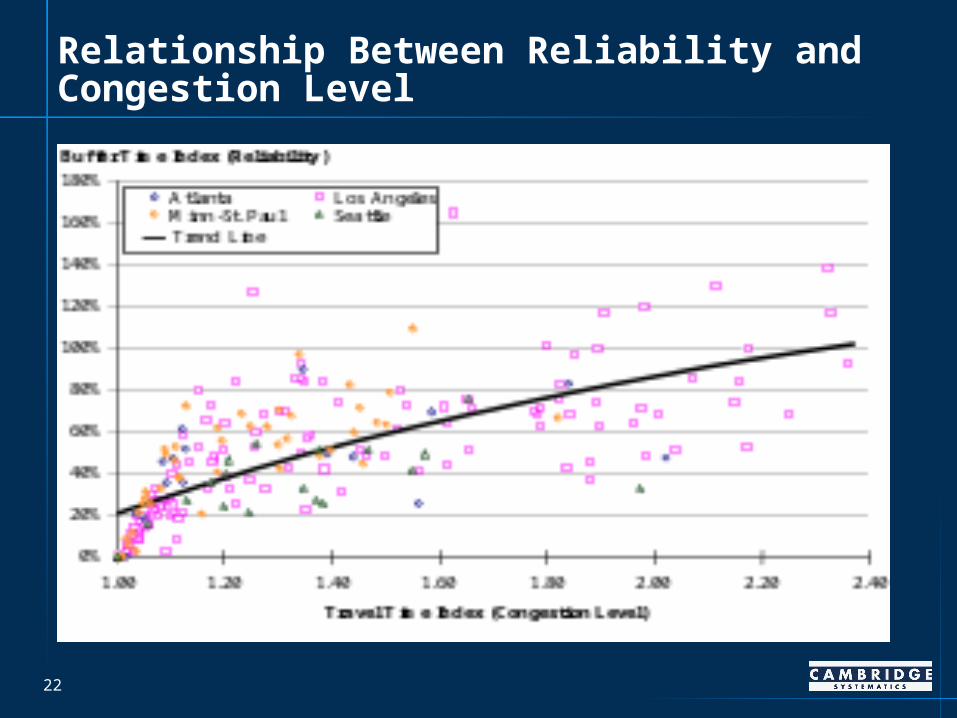
Relationship Between Reliability and Congestion Level

23

24
SHRP II Research Program
Reliability one of four SHRP II Program Areas (along with “Renewal”, “Safety”, and “Adding New Capacity”
Four Reliability topic areas
• Building a Foundation and Institutional Setting for Operations (5 projects)
• Tools and Techniques for Advancing Operations (4 projects)
• Integrating Operations into Agency Decision-Making (2 projects)
• Developing Improved Operational Strategies (5 projects)

25
Resources
FHWA Traffic Congestion and Reliability Report
• http://www.ops.fhwa.dot.gov/congestion_report/index.htm
NTOC
• http://www.ntoctalks.com/action_teams/perf_measure.php
NCHRP 3-68, Freeway Performance Measures (Fall 2006)
WSDOT Activities
• http://www.wsdot.wa.gov/Accountability/


