33
Camosun College Transportation & Parking Implementation Project: Three Year Working Plan Final Report April 1, 2010 – March 31, 2013 Maria Bremner 7/10/2013
Camosun College
Transportation & Parking Implementation Project: Three Year Working Plan Final Report April 1, 2010 – March 31, 2013
Maria Bremner 7/10/2013
Last updated: October 2nd
2013
1
Transportation & Parking Implementation Project: Three Year Working Plan Final Report April 1, 2010 – March 31, 2013 This report summarizes Camosun’s efforts in the Transportation and Parking Implementation Project (TPIP)
established from the Transportation and Parking Management (TPM) Plan (2009). There were 4 phases
identified in the TPIP (please see Transportation and Parking Management Project Charter1). The first phase
included surveying Camosun students and employees for the first time on transportation practices and
willingness to look at alternatives, reviewing current transportation conditions at and to Camosun, and
developing recommendations for moving forward in a framework appropriate for Camosun. Please see
“Camosun College Transportation and Parking Management Plan” by Todd Litman (2009)2 which was the result
of the first phase. Subsequently, a three year Transportation and Parking Management (TPM) working plan was
developed to support phases 2 – 4 of the Project. This report summarizes the efforts of the TPM working plan,
which concluded in March 2013.
BACKGROUND:
Goals and Objectives A primary goal of Camosun College transportation and parking planning is to provide convenient and affordable
access to the College’s campuses. Various other goals and objectives are defined in the following official
documents:
Provide a framework for addressing transportation and parking problems (Transportation and Parking
Management Charter).
Reduce traffic congestion around the campuses and the total number of motor vehicles driven to the
college (Transportation and Parking Management Charter).
Accommodate additional campus development, minimize impervious surfaces and preserve green
space (Transportation and Parking Management Charter).
Improve transportation within the context of developing an accessible, sustainable, and
environmentally conscionable service (Camosun Strategic Plan).
Improve mobility options to the college, particularly for people who are economically or physically
disadvantaged, including those burdened by rising fuel prices.
Achieve BC greenhouse gas (GHG) emission reduction targets. By 2020 and for each subsequent year,
BC GHG emissions will be at least 33% less than in 2007. By 2050 and for each subsequent year, BC
greenhouse gas emissions will be at least 80% less than in 2007 (BC Government Greenhouse Gas
Emission Plan).
Reduce Camosun’s greenhouse gas emissions by 8.5% or 200 tonnes by the year 2012 (Camosun
Energy Plan).
Implement an Energy Management Project to reduce energy use, increase energy efficiency and
reduce the production of greenhouse gases (Camosun Strategic Plan).
1 http://camosun.ca/documents/about/transportation/tpm-implementation-charter.pdf
2 http://camosun.ca/documents/about/transportation/plan-final-draft-june-2009.pdf
Last updated: October 2nd
2013
2
Planning Objective Definition
Mode shift targets Reduce automobile trips. Increase use of alternative modes.
Accessibility Improve students’, employees’, and visitors’ access to Camosun facilities and services.
Service quality Improve user convenience and comfort.
Traffic congestion Reduce traffic congestion on local roads and on each campus.
Parking convenience Improve the convenience of parking at the college.
Transport affordability Reduce transportation costs, particularly for lower-income users.
Mobility for non-drivers
Improve mobility options for non-drivers, including people with special needs.
Energy conservation and pollution reductions
Reduce per capita energy consumption and climate change emissions.
Land use Reduce impervious surfaces and habitat loss. Accommodate planned campus development. Support regional smart growth goals.
Revenue needs Provide funding for parking, transportation, and other college programs.
TPM Plan Recommendations (2009) at a glance The three –year work plan focused on working towards the following eight recommendations from the
Transportation and Parking Management Plan (Litman 2009):
1. Change Management: Change how transportation and parking problems are defined and the range of
solutions considered. Create new organizational relationships.
2. Transportation Management Program (TMP): establish a program within Ancillary Services responsible for
transportation and parking management activities.
3. Transportation Management Association (TMA): Coordinate with other local organizations (UVic, VIHA,
VITP, municipal governments, businesses, etc.) to provide transportation and parking management services.
4. Improve and support transportation options: Work with BC Transit, local, regional and provincial
governments to improve the quantity and quality of alternative modes
4.1 Public transit: Increase transit routes, service frequency and service hours. Improve user
information, waiting areas and amenities such as onboard Internet access.
4.2 Ridesharing (carpooling and vanpooling): Improve rideshare matching services, promotion efforts
and incentives.
4.3 Walking conditions: Improve walking conditions on and around the campus. Insure universal design
(facilities that accommodate all users).
4.4 Cycling conditions: Improve cycling conditions on and around
campus, including paths, lanes, parking and support services.
4.5 Carsharing and taxi services: Insure that carsharing and taxi services
are conveniently available on campuses.
4.6 Telework: Establish telework policies
4.7 Public transit: Increase transit routes, service frequency and service
hours. Improve user information, waiting areas and amenities such as
onboard Internet access.
Last updated: October 2nd
2013
3
5 Alternative schedules: Encourage alternative class and work schedules that reduce travel peaks.
5.1 Intercampus transport: Support services
5.2 Alternative schedules: Encourage alternative class and work schedules that reduce travel peaks.
5.3 Intercampus transport: Create programs
6 Parking management: Implement various parking management strategies.
6.1 Shared parking: Share parking facilities among users and buildings, including offsite parking as an
overflow option.
6.2 Staff parking pricing and cash out: Eliminate or cash out free employee parking. Charge employees
for parking and offer alternative benefits.
6.3 Parking price targets: Establish targets to increase parking fees, particularly during peak periods, to
reduce problems and generate revenues for transportation programs.
6.4 Overflow parking plans: Establish overflow parking plans for special events.
6.5 Improve parking user information and enforcement: Provide better user information on parking
and transportation options. Improve enforcement on campus, and of nearby spillover parking.
6.6 Parking pass rules and audits: Establish clearer rules concerning the allocation of free parking
passes. Provide alternatives, such as free transit passes.
7 Smart growth development policies: Build compact development, particularly affordable housing, within or
near existing campuses, including on existing parking lots.
8 Program evaluation: Perform ongoing evaluation to track problems, impacts and user satisfaction.
Specific targets for the above and the three-year work plan deliverables are identified and evaluated in detail in
Appendix A.
THREE YEAR HIGHLIGHTS (2010 – 13)
In the last three years, Camosun has made a significant investment to launch and support a more rigorous
transportation and parking program. A full report out on deliverables as it relates to the initial targets is
available in Appendix A.
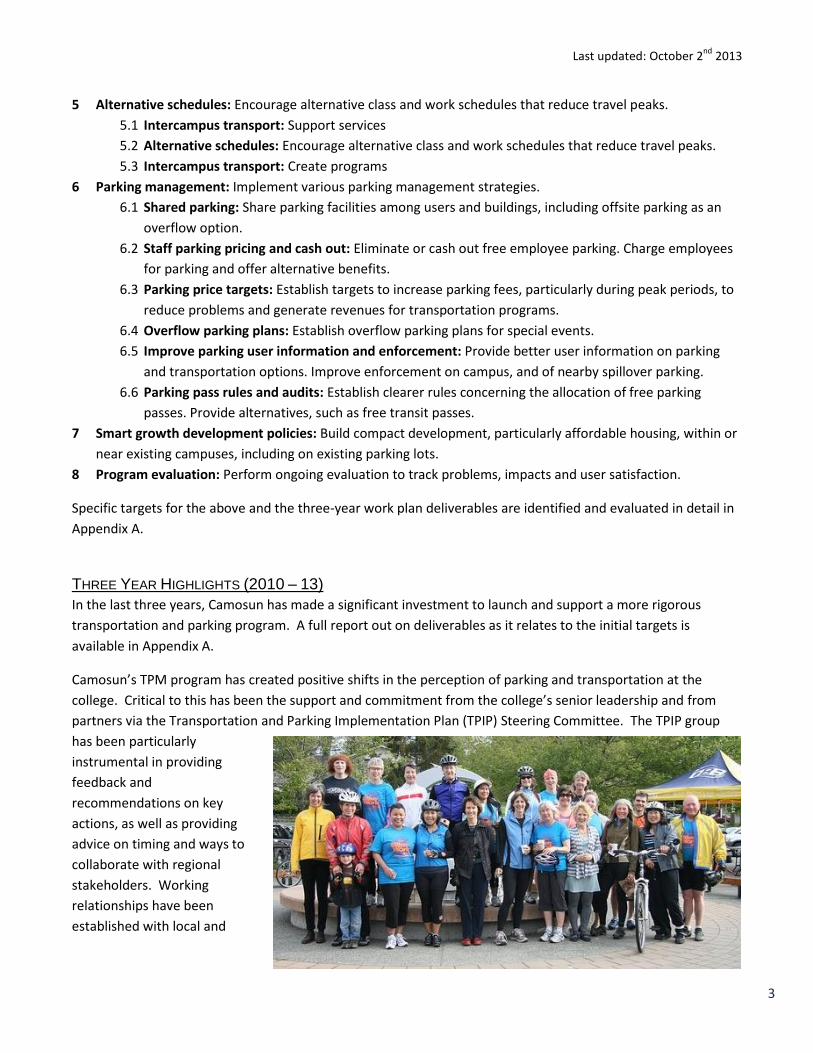
Camosun’s TPM program has created positive shifts in the perception of parking and transportation at the
college. Critical to this has been the support and commitment from the college’s senior leadership and from
partners via the Transportation and Parking Implementation Plan (TPIP) Steering Committee. The TPIP group
has been particularly
instrumental in providing
feedback and
recommendations on key
actions, as well as providing
advice on timing and ways to
collaborate with regional
stakeholders. Working
relationships have been
established with local and
Last updated: October 2nd
2013
4
regional transportation partners to advance the quantity and quality of alternative transportation modes.
Information about transportation and parking rules, management and processes (for both personal and business
vehicle use and for larger events), combined with ongoing support for alternative transportation options (e.g.
Alternative Transportation Campaign), is gradually shifting the perception of parking as a free resource. Work
with other departments (in particular ITS, Human Resources, Communications and Finance) has contributed
greatly to operational changes, as well as staff and student awareness of those changes (e.g. annual
permit/renewal database system, taxable benefits for staff parking and guest parking guidelines).
Other highlights and achievements include:
Program development & delivery: The Transportation Management Program (TMP) is now entrenched
within the Ancillary Services department (which was shifted from Physical Resources in 2008),
Transportation & Parking unit.
o Research that has been initiated and now
regularized, such as the biannual Getting Here
Survey, Mode Split survey, parking stall counts,
etc. has provided baseline and comparative information about the transportation and parking
situation. These findings are then incorporated with various programs, information updates, and
activities to promote and support alternative transportation and to improve parking
management. This work is integrated into the annual business plan with more developments to
come as the program continues to mature.
o Information delivery and outreach to students and employees is now built into the annual
business process of the Transportation & Parking unit.).
o Improvements to process and guidelines regarding special event parking.
o Development of more efficient parking administrative system, saving time and money for
Camosun’s parking administration process.
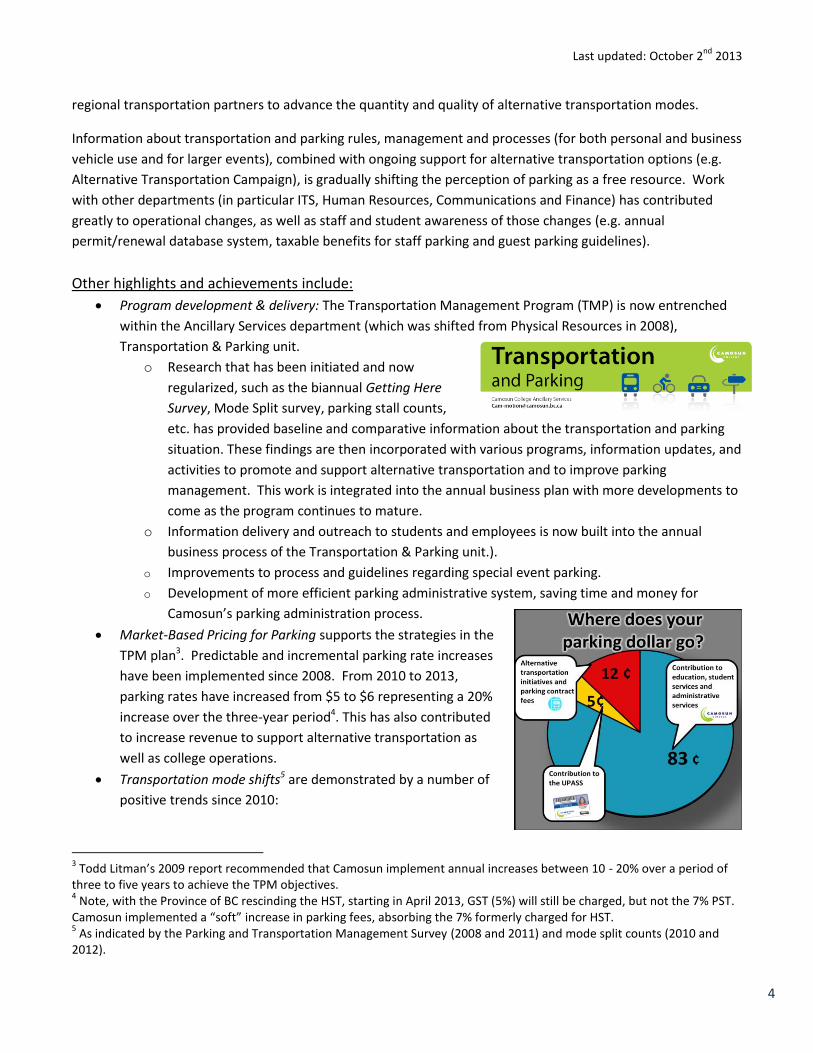
Market-Based Pricing for Parking supports the strategies in the
TPM plan3. Predictable and incremental parking rate increases
have been implemented since 2008. From 2010 to 2013,
parking rates have increased from $5 to $6 representing a 20%
increase over the three-year period4. This has also contributed
to increase revenue to support alternative transportation as
well as college operations.
Transportation mode shifts5 are demonstrated by a number of
positive trends since 2010:
3 Todd Litman’s 2009 report recommended that Camosun implement annual increases between 10 - 20% over a period of
three to five years to achieve the TPM objectives. 4 Note, with the Province of BC rescinding the HST, starting in April 2013, GST (5%) will still be charged, but not the 7% PST.
Camosun implemented a “soft” increase in parking fees, absorbing the 7% formerly charged for HST. 5 As indicated by the Parking and Transportation Management Survey (2008 and 2011) and mode split counts (2010 and
2012).
Last updated: October 2nd
2013
5
o Fewer people are driving to campus. From
2010 – 13, vehicle counts have dropped 7% (from 56% to
49%) as a proportion of total mode shares6. This is even more
significant when compared to 2008 vehicle use (63%). Most
significantly, both Interurban and Lansdowne showed a
decrease in SOV traffic (down 3.8% and 5.4% respectively
from the 2010 to the 2012 mode split counts)7. Other
positive trends point to more transit users and pedestrians.
o Camosun mode share splits are comparable
with UVic – a considerable achievement given that Camosun
does not have nearly the same transit service or alternative
travel incentives that UVic does.
o More people are walking or taking the bus to Camosun (an increase of about 5% since 2010)8.
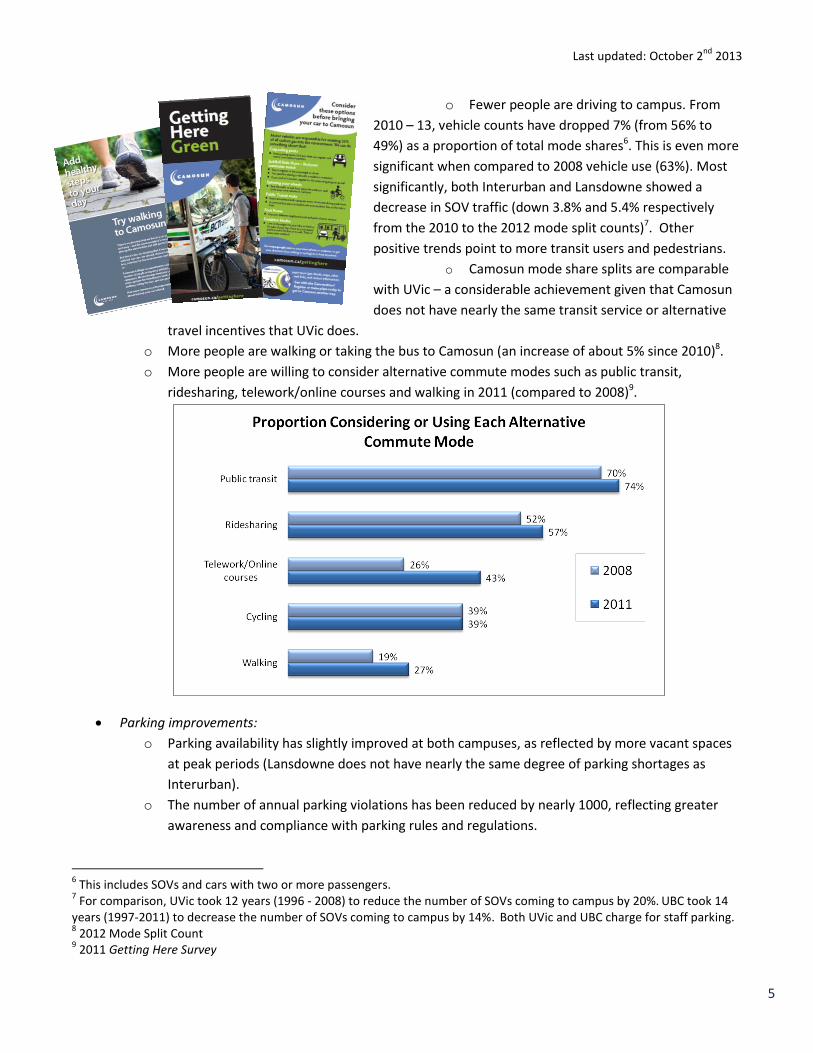
o More people are willing to consider alternative commute modes such as public transit,
ridesharing, telework/online courses and walking in 2011 (compared to 2008)9.
Parking improvements:
o Parking availability has slightly improved at both campuses, as reflected by more vacant spaces
at peak periods (Lansdowne does not have nearly the same degree of parking shortages as
Interurban).
o The number of annual parking violations has been reduced by nearly 1000, reflecting greater
awareness and compliance with parking rules and regulations.
6 This includes SOVs and cars with two or more passengers.
7 For comparison, UVic took 12 years (1996 - 2008) to reduce the number of SOVs coming to campus by 20%.
UBC took 14
years (1997-2011) to decrease the number of SOVs coming to campus by 14%. Both UVic and UBC charge for staff parking.
8 2012 Mode Split Count
9 2011 Getting Here Survey
Last updated: October 2nd
2013
6
o Since 2010, four parking bursaries per year ($500/each)
have been made available for those students with access
and affordability issues.
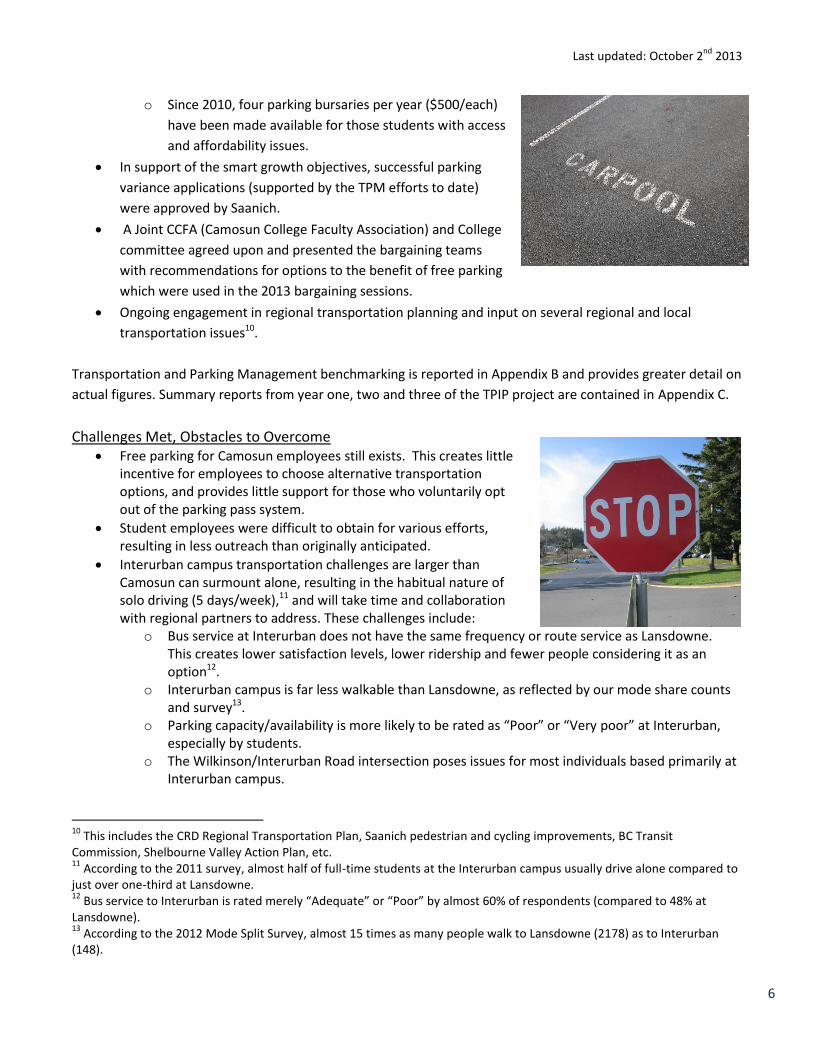
In support of the smart growth objectives, successful parking
variance applications (supported by the TPM efforts to date)
were approved by Saanich.
A Joint CCFA (Camosun College Faculty Association) and College
committee agreed upon and presented the bargaining teams
with recommendations for options to the benefit of free parking
which were used in the 2013 bargaining sessions.
Ongoing engagement in regional transportation planning and input on several regional and local
transportation issues10.
Transportation and Parking Management benchmarking is reported in Appendix B and provides greater detail on
actual figures. Summary reports from year one, two and three of the TPIP project are contained in Appendix C.
Challenges Met, Obstacles to Overcome Free parking for Camosun employees still exists. This creates little
incentive for employees to choose alternative transportation options, and provides little support for those who voluntarily opt out of the parking pass system.
Student employees were difficult to obtain for various efforts, resulting in less outreach than originally anticipated.
Interurban campus transportation challenges are larger than Camosun can surmount alone, resulting in the habitual nature of solo driving (5 days/week),11 and will take time and collaboration with regional partners to address. These challenges include:
o Bus service at Interurban does not have the same frequency or route service as Lansdowne. This creates lower satisfaction levels, lower ridership and fewer people considering it as an option12.
o Interurban campus is far less walkable than Lansdowne, as reflected by our mode share counts and survey13.
o Parking capacity/availability is more likely to be rated as “Poor” or “Very poor” at Interurban, especially by students.
o The Wilkinson/Interurban Road intersection poses issues for most individuals based primarily at Interurban campus.
10
This includes the CRD Regional Transportation Plan, Saanich pedestrian and cycling improvements, BC Transit Commission, Shelbourne Valley Action Plan, etc. 11
According to the 2011 survey, almost half of full-time students at the Interurban campus usually drive alone compared to just over one-third at Lansdowne. 12
Bus service to Interurban is rated merely “Adequate” or “Poor” by almost 60% of respondents (compared to 48% at Lansdowne). 13
According to the 2012 Mode Split Survey, almost 15 times as many people walk to Lansdowne (2178) as to Interurban (148).
Last updated: October 2nd
2013
7
o Having two campuses, combined with a high proportion of staff using personal vehicles to get to work, results in significant volume of campus-to-campus travel in SOVs. Currently, there is no incentive for employees to carpool.
Staff capacity in the Transportation & Parking unit is not equal to the goals and objectives within the original three year plan. This has been exacerbated by the number of managers of throughout the Project, creating continuity and consistency issues.
MOVING FORWARD
While the goals and targets of the original TPM Plan are
still relevant, there will be a shift to consolidate these and
make the work plan more achievable within the resources
of the office. The following have also been identified as
priorities.
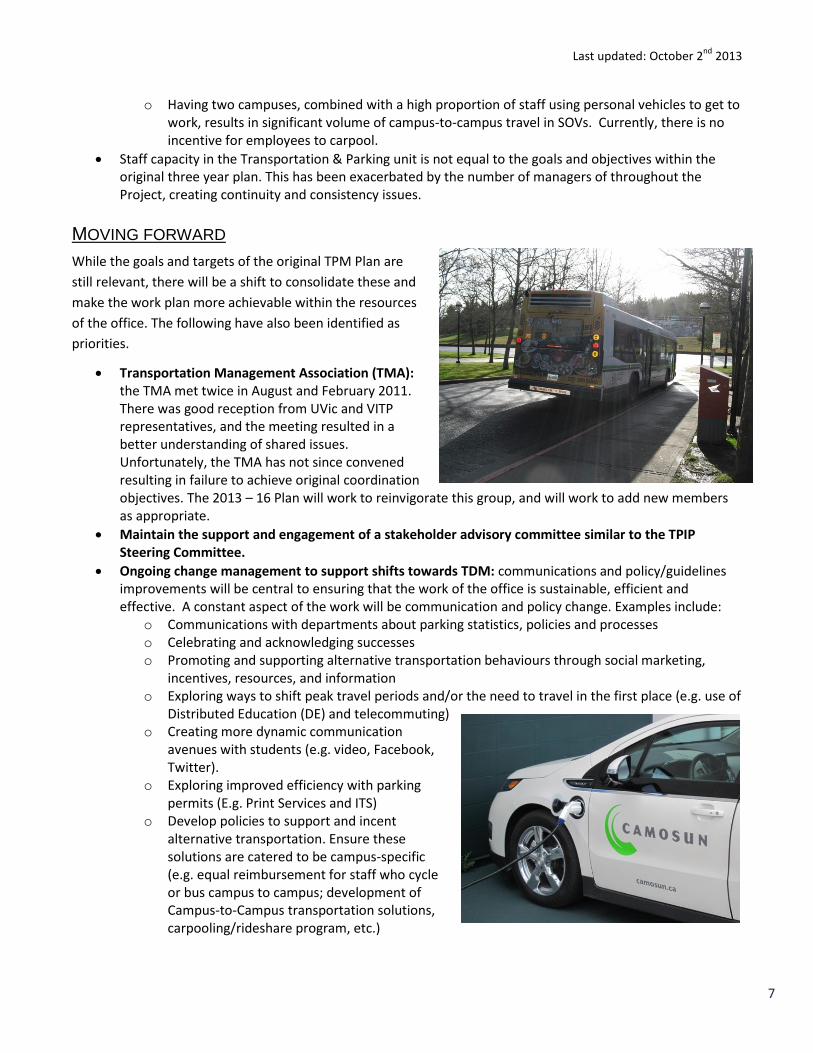
Transportation Management Association (TMA): the TMA met twice in August and February 2011. There was good reception from UVic and VITP representatives, and the meeting resulted in a better understanding of shared issues. Unfortunately, the TMA has not since convened resulting in failure to achieve original coordination objectives. The 2013 – 16 Plan will work to reinvigorate this group, and will work to add new members as appropriate.
Maintain the support and engagement of a stakeholder advisory committee similar to the TPIP Steering Committee.
Ongoing change management to support shifts towards TDM: communications and policy/guidelines improvements will be central to ensuring that the work of the office is sustainable, efficient and effective. A constant aspect of the work will be communication and policy change. Examples include:
o Communications with departments about parking statistics, policies and processes o Celebrating and acknowledging successes o Promoting and supporting alternative transportation behaviours through social marketing,
incentives, resources, and information o Exploring ways to shift peak travel periods and/or the need to travel in the first place (e.g. use of
Distributed Education (DE) and telecommuting) o Creating more dynamic communication
avenues with students (e.g. video, Facebook, Twitter).
o Exploring improved efficiency with parking permits (E.g. Print Services and ITS)
o Develop policies to support and incent alternative transportation. Ensure these solutions are catered to be campus-specific (e.g. equal reimbursement for staff who cycle or bus campus to campus; development of Campus-to-Campus transportation solutions, carpooling/rideshare program, etc.)

Last updated: October 2nd
2013
8
Parking rate increases. In keeping with the TPM recommendation, market based pricing mechanisms will continue to be implemented on an annual basis, with approval from the college executive. These increases will be incremental, clearly communicated, and in line with parking prices in the region including UVic.
Integration with other college actions and priorities such as: o Campus Planning o New buildings and development (e.g. Centre for Trades Education & Innovation, student
residences) o Climate Action Plan o Environmental Sustainability Plan
Last updated: October 2nd
2013
9
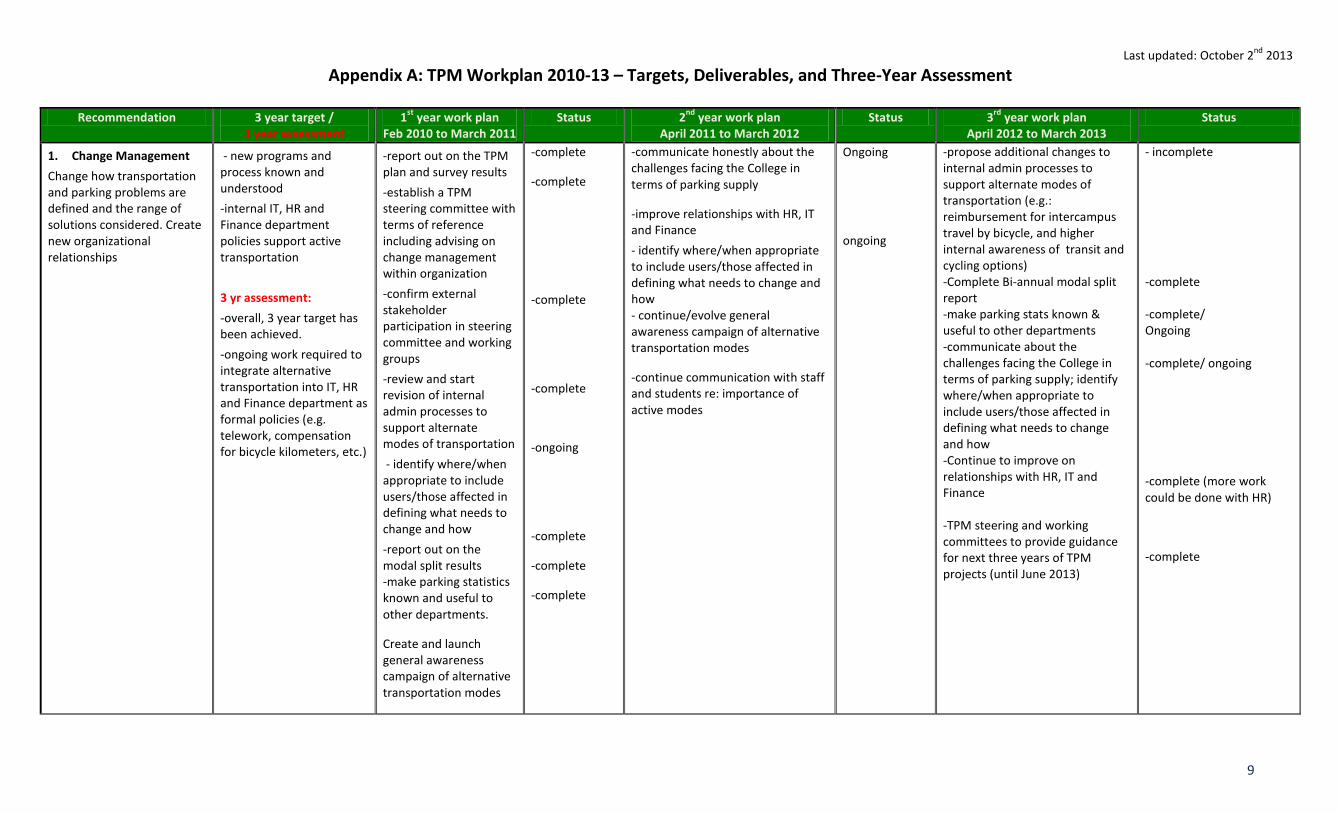
Appendix A: TPM Workplan 2010-13 – Targets, Deliverables, and Three-Year Assessment
Recommendation 3 year target / 3 year assessment
1st
year work plan Feb 2010 to March 2011
Status 2nd
year work plan April 2011 to March 2012
Status 3rd
year work plan April 2012 to March 2013
Status
1. Change Management
Change how transportation and parking problems are defined and the range of solutions considered. Create new organizational relationships
- new programs and process known and understood
-internal IT, HR and Finance department policies support active transportation
3 yr assessment:
-overall, 3 year target has been achieved.
-ongoing work required to integrate alternative transportation into IT, HR and Finance department as formal policies (e.g. telework, compensation for bicycle kilometers, etc.)
-report out on the TPM plan and survey results
-establish a TPM steering committee with terms of reference including advising on change management within organization
-confirm external stakeholder participation in steering committee and working groups
-review and start revision of internal admin processes to support alternate modes of transportation
- identify where/when appropriate to include users/those affected in defining what needs to change and how
-report out on the modal split results -make parking statistics known and useful to other departments.
Create and launch general awareness campaign of alternative transportation modes
-complete
-complete
-complete
-complete
-ongoing
-complete
-complete
-complete
-communicate honestly about the challenges facing the College in terms of parking supply
-improve relationships with HR, IT and Finance
- identify where/when appropriate to include users/those affected in defining what needs to change and how - continue/evolve general awareness campaign of alternative transportation modes
-continue communication with staff and students re: importance of active modes
Ongoing
ongoing
-propose additional changes to internal admin processes to support alternate modes of transportation (e.g.: reimbursement for intercampus travel by bicycle, and higher internal awareness of transit and cycling options) -Complete Bi-annual modal split report -make parking stats known & useful to other departments -communicate about the challenges facing the College in terms of parking supply; identify where/when appropriate to include users/those affected in defining what needs to change and how -Continue to improve on relationships with HR, IT and Finance -TPM steering and working committees to provide guidance for next three years of TPM projects (until June 2013)
- incomplete -complete -complete/ Ongoing -complete/ ongoing
-complete (more work could be done with HR)
-complete
Last updated: October 2nd
2013
10
Recommendation 3 year target 1st
year work plan Status 2nd
year work plan/target Status 3rd
year work plan April 2012 to March 2013
Status
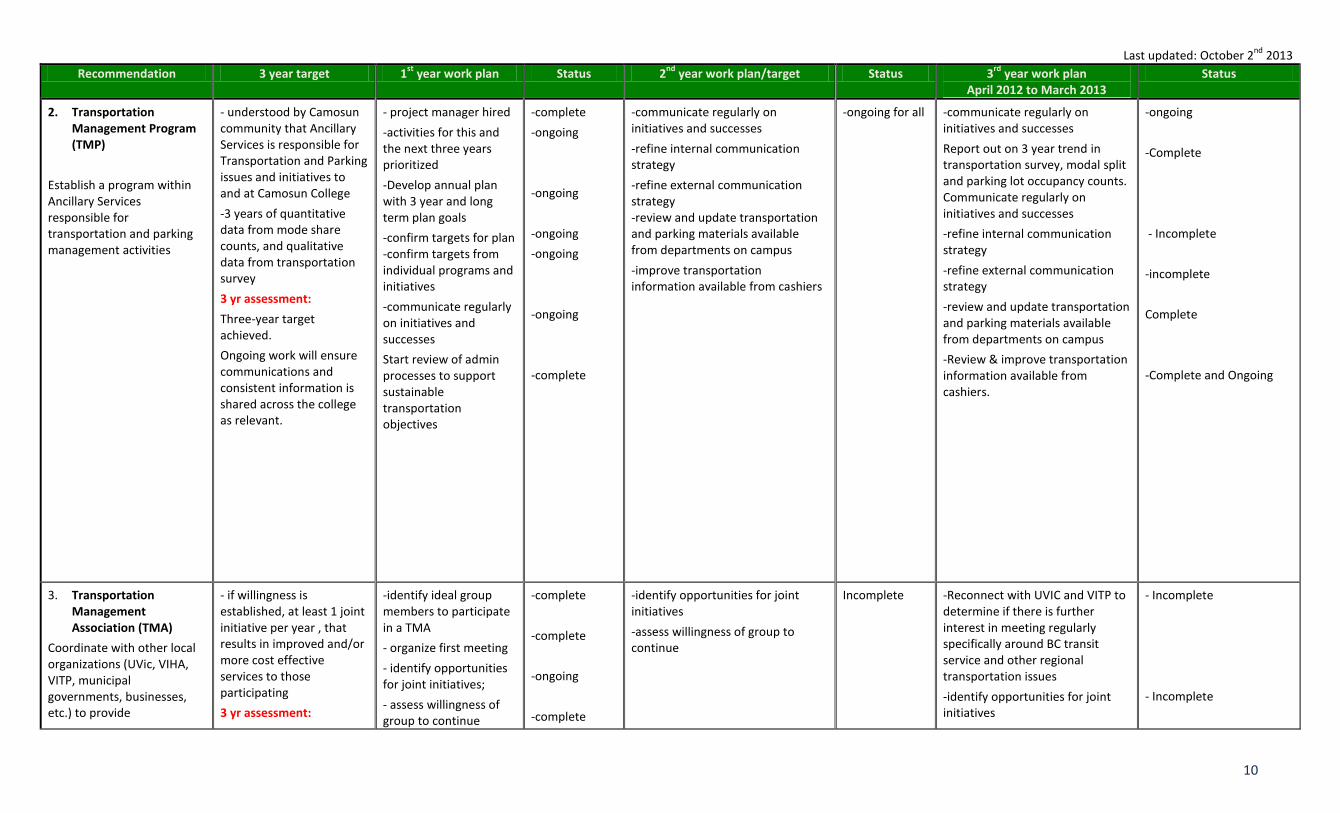
2. Transportation Management Program (TMP)
Establish a program within Ancillary Services responsible for transportation and parking management activities
- understood by Camosun community that Ancillary Services is responsible for Transportation and Parking issues and initiatives to and at Camosun College
-3 years of quantitative data from mode share counts, and qualitative data from transportation survey
3 yr assessment:
Three-year target achieved.
Ongoing work will ensure communications and consistent information is shared across the college as relevant.
- project manager hired
-activities for this and the next three years prioritized
-Develop annual plan with 3 year and long term plan goals
-confirm targets for plan -confirm targets from individual programs and initiatives
-communicate regularly on initiatives and successes
Start review of admin processes to support sustainable transportation objectives
-complete
-ongoing
-ongoing
-ongoing
-ongoing
-ongoing
-complete
-communicate regularly on initiatives and successes
-refine internal communication strategy
-refine external communication strategy -review and update transportation and parking materials available from departments on campus
-improve transportation information available from cashiers
-ongoing for all
-communicate regularly on initiatives and successes
Report out on 3 year trend in transportation survey, modal split and parking lot occupancy counts. Communicate regularly on initiatives and successes
-refine internal communication strategy
-refine external communication strategy
-review and update transportation and parking materials available from departments on campus
-Review & improve transportation information available from cashiers.
-ongoing
-Complete
- Incomplete
-incomplete
Complete
-Complete and Ongoing
3. Transportation Management Association (TMA)
Coordinate with other local organizations (UVic, VIHA, VITP, municipal governments, businesses, etc.) to provide
- if willingness is established, at least 1 joint initiative per year , that results in improved and/or more cost effective services to those participating
3 yr assessment:
-identify ideal group members to participate in a TMA
- organize first meeting
- identify opportunities for joint initiatives;
- assess willingness of group to continue
-complete
-complete
-ongoing
-complete
-identify opportunities for joint initiatives
-assess willingness of group to continue
Incomplete
-Reconnect with UVIC and VITP to determine if there is further interest in meeting regularly specifically around BC transit service and other regional transportation issues
-identify opportunities for joint initiatives
- Incomplete
- Incomplete
Last updated: October 2nd
2013
11
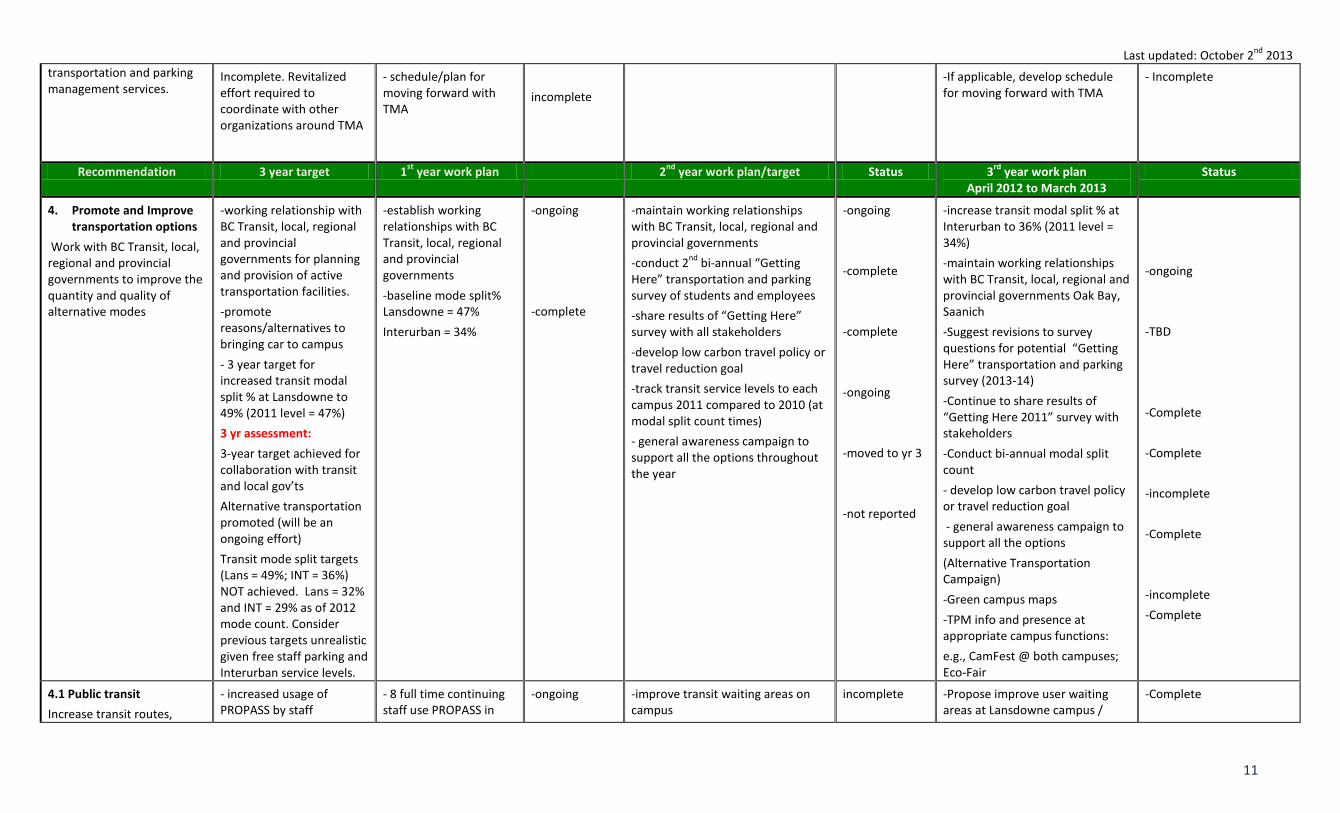
transportation and parking management services.
Incomplete. Revitalized effort required to coordinate with other organizations around TMA
- schedule/plan for moving forward with TMA
incomplete
-If applicable, develop schedule for moving forward with TMA
- Incomplete
Recommendation 3 year target 1st
year work plan 2nd
year work plan/target Status 3rd
year work plan April 2012 to March 2013
Status
4. Promote and Improve transportation options
Work with BC Transit, local, regional and provincial governments to improve the quantity and quality of alternative modes
-working relationship with BC Transit, local, regional and provincial governments for planning and provision of active transportation facilities.
-promote reasons/alternatives to bringing car to campus
- 3 year target for increased transit modal split % at Lansdowne to 49% (2011 level = 47%)
3 yr assessment:
3-year target achieved for collaboration with transit and local gov’ts
Alternative transportation promoted (will be an ongoing effort)
Transit mode split targets (Lans = 49%; INT = 36%) NOT achieved. Lans = 32% and INT = 29% as of 2012 mode count. Consider previous targets unrealistic given free staff parking and Interurban service levels.
-establish working relationships with BC Transit, local, regional and provincial governments
-baseline mode split% Lansdowne = 47%
Interurban = 34%
-ongoing
-complete
-maintain working relationships with BC Transit, local, regional and provincial governments
-conduct 2nd
bi-annual “Getting Here” transportation and parking survey of students and employees
-share results of “Getting Here” survey with all stakeholders
-develop low carbon travel policy or travel reduction goal
-track transit service levels to each campus 2011 compared to 2010 (at modal split count times)
- general awareness campaign to support all the options throughout the year
-ongoing
-complete
-complete
-ongoing
-moved to yr 3
-not reported
-increase transit modal split % at Interurban to 36% (2011 level = 34%)
-maintain working relationships with BC Transit, local, regional and provincial governments Oak Bay, Saanich
-Suggest revisions to survey questions for potential “Getting Here” transportation and parking survey (2013-14)
-Continue to share results of “Getting Here 2011” survey with stakeholders
-Conduct bi-annual modal split count
- develop low carbon travel policy or travel reduction goal
- general awareness campaign to support all the options
(Alternative Transportation Campaign)
-Green campus maps
-TPM info and presence at appropriate campus functions:
e.g., CamFest @ both campuses; Eco-Fair
-ongoing
-TBD
-Complete
-Complete
-incomplete
-Complete
-incomplete
-Complete
4.1 Public transit
Increase transit routes,
- increased usage of PROPASS by staff
- 8 full time continuing staff use PROPASS in
-ongoing
-improve transit waiting areas on campus
incomplete
-Propose improve user waiting areas at Lansdowne campus /
-Complete
Last updated: October 2nd
2013
12
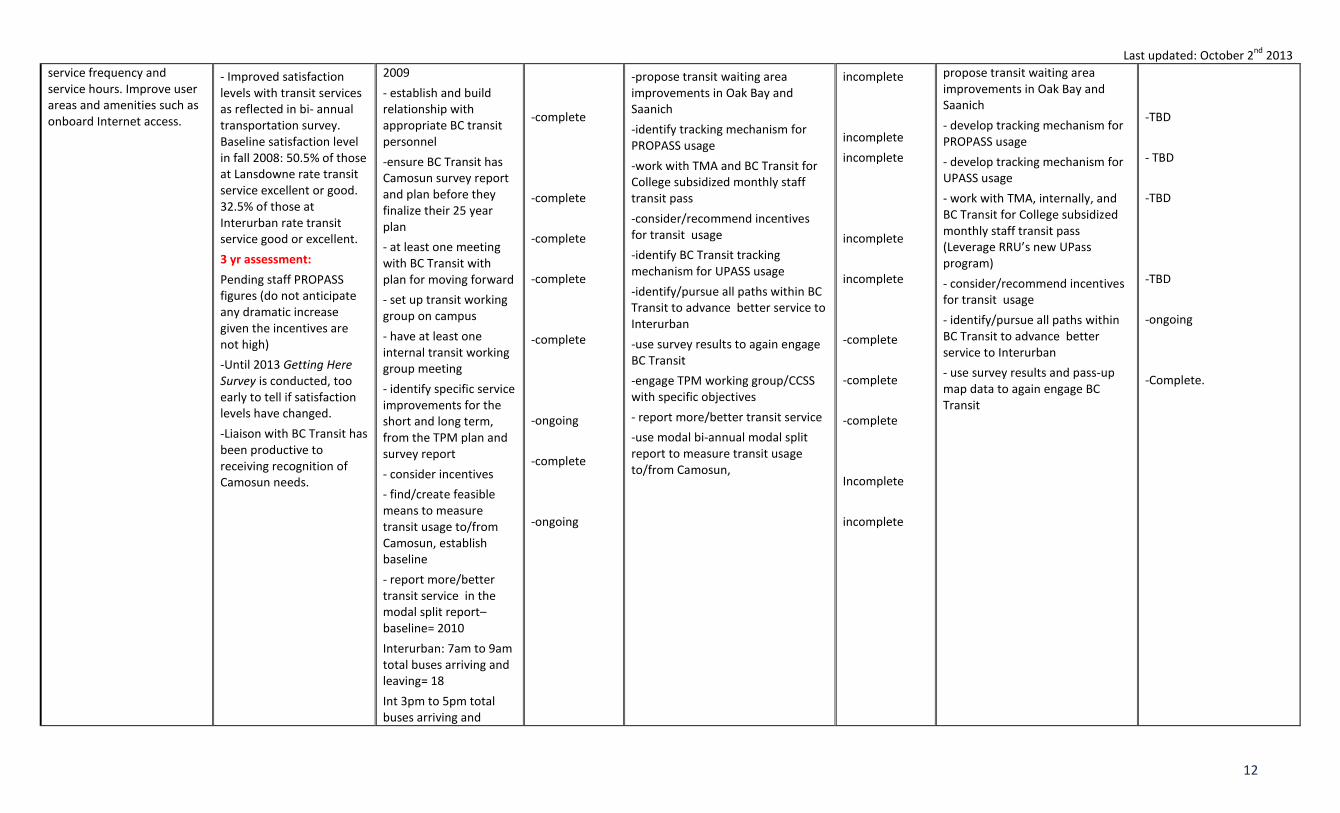
service frequency and service hours. Improve user areas and amenities such as onboard Internet access.
- Improved satisfaction levels with transit services as reflected in bi- annual transportation survey. Baseline satisfaction level in fall 2008: 50.5% of those at Lansdowne rate transit service excellent or good. 32.5% of those at Interurban rate transit service good or excellent.
3 yr assessment:
Pending staff PROPASS figures (do not anticipate any dramatic increase given the incentives are not high)
-Until 2013 Getting Here Survey is conducted, too early to tell if satisfaction levels have changed.
-Liaison with BC Transit has been productive to receiving recognition of Camosun needs.
2009
- establish and build relationship with appropriate BC transit personnel
-ensure BC Transit has Camosun survey report and plan before they finalize their 25 year plan
- at least one meeting with BC Transit with plan for moving forward
- set up transit working group on campus
- have at least one internal transit working group meeting
- identify specific service improvements for the short and long term, from the TPM plan and survey report
- consider incentives
- find/create feasible means to measure transit usage to/from Camosun, establish baseline
- report more/better transit service in the modal split report– baseline= 2010
Interurban: 7am to 9am total buses arriving and leaving= 18
Int 3pm to 5pm total buses arriving and
-complete
-complete
-complete
-complete
-complete
-ongoing
-complete
-ongoing
-propose transit waiting area improvements in Oak Bay and Saanich
-identify tracking mechanism for PROPASS usage
-work with TMA and BC Transit for College subsidized monthly staff transit pass
-consider/recommend incentives for transit usage
-identify BC Transit tracking mechanism for UPASS usage
-identify/pursue all paths within BC Transit to advance better service to Interurban
-use survey results to again engage BC Transit
-engage TPM working group/CCSS with specific objectives
- report more/better transit service
-use modal bi-annual modal split report to measure transit usage to/from Camosun,
incomplete
incomplete
incomplete
incomplete
incomplete
-complete
-complete
-complete
Incomplete
incomplete
propose transit waiting area improvements in Oak Bay and Saanich
- develop tracking mechanism for PROPASS usage
- develop tracking mechanism for UPASS usage
- work with TMA, internally, and BC Transit for College subsidized monthly staff transit pass (Leverage RRU’s new UPass program)
- consider/recommend incentives for transit usage
- identify/pursue all paths within BC Transit to advance better service to Interurban
- use survey results and pass-up map data to again engage BC Transit
-TBD
- TBD
-TBD
-TBD
-ongoing
-Complete.
Last updated: October 2nd
2013
13
leaving = 15
Lansdowne: 7am to 9am total buses arriving and leaving = 101
Lans 3pm to 5pm total buses arriving and leaving= 94
Recommendation- 3 year target 1st
year work plan Status 2nd year work plan Status 3rd
year work plan Status
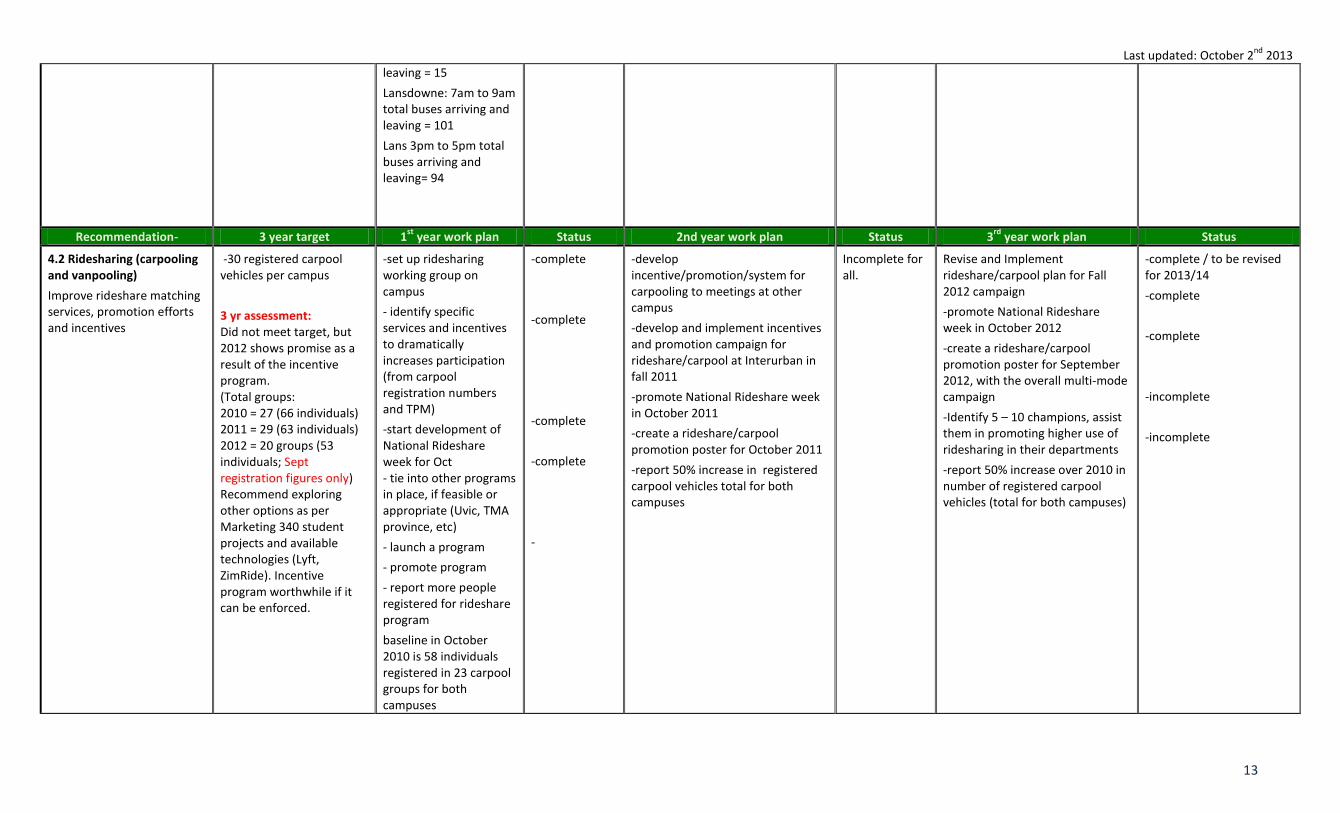
4.2 Ridesharing (carpooling and vanpooling)
Improve rideshare matching services, promotion efforts and incentives
-30 registered carpool vehicles per campus
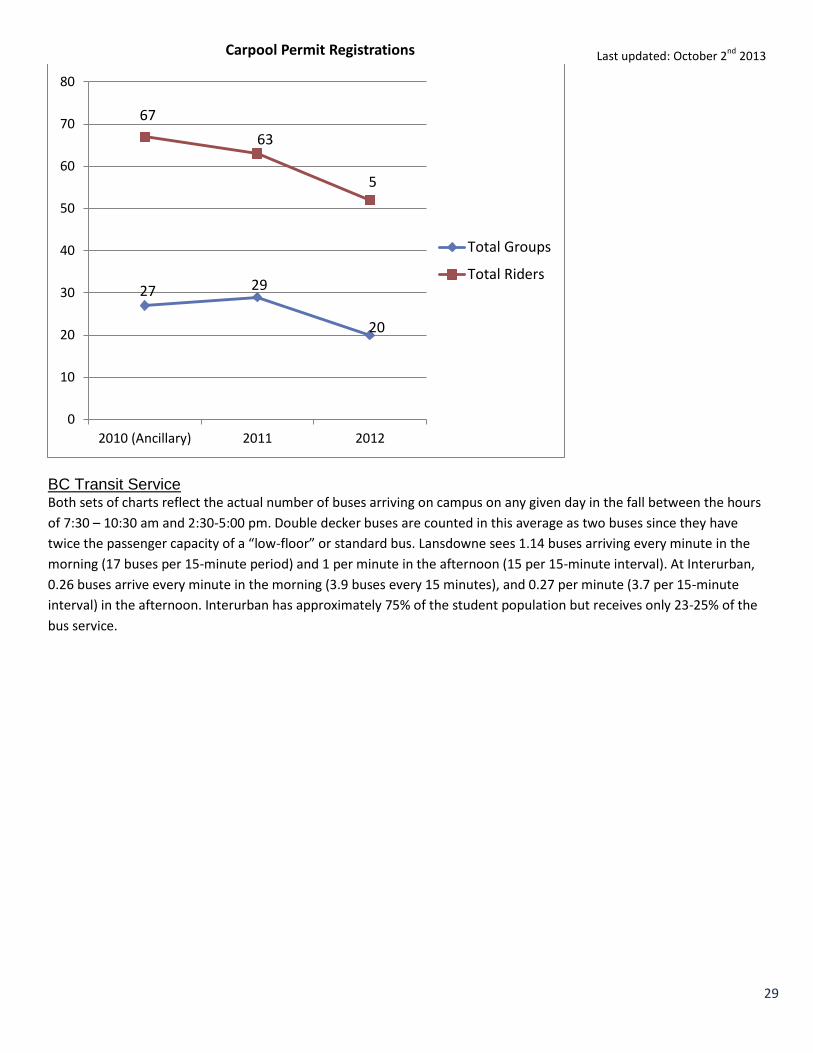
3 yr assessment: Did not meet target, but 2012 shows promise as a result of the incentive program. (Total groups: 2010 = 27 (66 individuals) 2011 = 29 (63 individuals) 2012 = 20 groups (53 individuals; Sept registration figures only) Recommend exploring other options as per Marketing 340 student projects and available technologies (Lyft, ZimRide). Incentive program worthwhile if it can be enforced.
-set up ridesharing working group on campus
- identify specific services and incentives to dramatically increases participation (from carpool registration numbers and TPM)
-start development of National Rideshare week for Oct - tie into other programs in place, if feasible or appropriate (Uvic, TMA province, etc)
- launch a program
- promote program
- report more people registered for rideshare program
baseline in October 2010 is 58 individuals registered in 23 carpool groups for both campuses
-complete
-complete
-complete
-complete
-
-develop incentive/promotion/system for carpooling to meetings at other campus
-develop and implement incentives and promotion campaign for rideshare/carpool at Interurban in fall 2011
-promote National Rideshare week in October 2011
-create a rideshare/carpool promotion poster for October 2011
-report 50% increase in registered carpool vehicles total for both campuses
Incomplete for all.
Revise and Implement rideshare/carpool plan for Fall 2012 campaign
-promote National Rideshare week in October 2012
-create a rideshare/carpool promotion poster for September 2012, with the overall multi-mode campaign
-Identify 5 – 10 champions, assist them in promoting higher use of ridesharing in their departments
-report 50% increase over 2010 in number of registered carpool vehicles (total for both campuses)
-complete / to be revised for 2013/14
-complete
-complete
-incomplete
-incomplete
Last updated: October 2nd
2013
14
Recommendation 3 year target 1st
year work plan Status 2nd
year work plan/target Status 3rd
year work plan Status
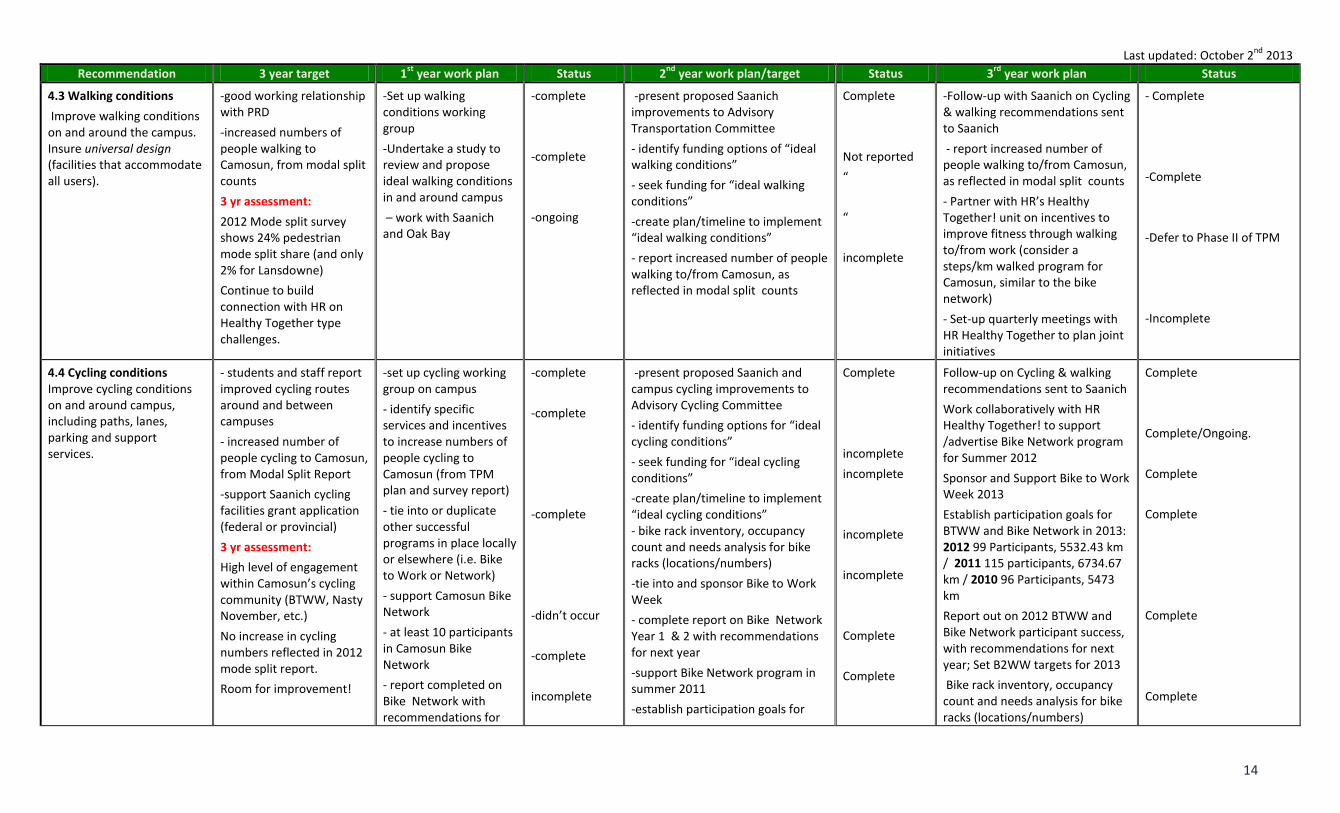
4.3 Walking conditions
Improve walking conditions on and around the campus. Insure universal design (facilities that accommodate all users).
-good working relationship with PRD
-increased numbers of people walking to Camosun, from modal split counts
3 yr assessment:
2012 Mode split survey shows 24% pedestrian mode split share (and only 2% for Lansdowne)
Continue to build connection with HR on Healthy Together type challenges.
-Set up walking conditions working group
-Undertake a study to review and propose ideal walking conditions in and around campus
– work with Saanich and Oak Bay
-complete
-complete
-ongoing
-present proposed Saanich improvements to Advisory Transportation Committee
- identify funding options of “ideal walking conditions”
- seek funding for “ideal walking conditions”
-create plan/timeline to implement “ideal walking conditions”
- report increased number of people walking to/from Camosun, as reflected in modal split counts
Complete
Not reported
“
“
incomplete
-Follow-up with Saanich on Cycling & walking recommendations sent to Saanich
- report increased number of people walking to/from Camosun, as reflected in modal split counts
- Partner with HR’s Healthy Together! unit on incentives to improve fitness through walking to/from work (consider a steps/km walked program for Camosun, similar to the bike network)
- Set-up quarterly meetings with HR Healthy Together to plan joint initiatives
- Complete
-Complete
-Defer to Phase II of TPM
-Incomplete
4.4 Cycling conditions Improve cycling conditions on and around campus, including paths, lanes, parking and support services.
- students and staff report improved cycling routes around and between campuses
- increased number of people cycling to Camosun, from Modal Split Report
-support Saanich cycling facilities grant application (federal or provincial)
3 yr assessment:
High level of engagement within Camosun’s cycling community (BTWW, Nasty November, etc.)
No increase in cycling numbers reflected in 2012 mode split report.
Room for improvement!
-set up cycling working group on campus
- identify specific services and incentives to increase numbers of people cycling to Camosun (from TPM plan and survey report)
- tie into or duplicate other successful programs in place locally or elsewhere (i.e. Bike to Work or Network)
- support Camosun Bike Network
- at least 10 participants in Camosun Bike Network
- report completed on Bike Network with recommendations for
-complete
-complete
-complete
-didn’t occur
-complete
incomplete
-present proposed Saanich and campus cycling improvements to Advisory Cycling Committee
- identify funding options for “ideal cycling conditions”
- seek funding for “ideal cycling conditions”
-create plan/timeline to implement “ideal cycling conditions” - bike rack inventory, occupancy count and needs analysis for bike racks (locations/numbers)
-tie into and sponsor Bike to Work Week
- complete report on Bike Network Year 1 & 2 with recommendations for next year
-support Bike Network program in summer 2011
-establish participation goals for
Complete
incomplete
incomplete
incomplete
incomplete
Complete
Complete
Follow-up on Cycling & walking recommendations sent to Saanich
Work collaboratively with HR Healthy Together! to support /advertise Bike Network program for Summer 2012
Sponsor and Support Bike to Work Week 2013
Establish participation goals for BTWW and Bike Network in 2013: 2012 99 Participants, 5532.43 km / 2011 115 participants, 6734.67 km / 2010 96 Participants, 5473 km
Report out on 2012 BTWW and Bike Network participant success, with recommendations for next year; Set B2WW targets for 2013
Bike rack inventory, occupancy count and needs analysis for bike racks (locations/numbers)
Complete
Complete/Ongoing.
Complete
Complete
Complete
Complete
Last updated: October 2nd
2013
15
next year
-review and propose improvements to cycling conditions in and around campus – work with Saanich
-research appropriate bike infrastructure and equipment to support TPM plan
- confirm and plan bicycle infrastructure and amenities
- work with Saanich to advocate more/better cycling lanes
- confirm/plan Bike to Work Week initiatives, target, sponsorship
-complete
-complete
-ongoing
-ongoing
-complete
Bike to Work Week and Bike Network in 2012
-report out on Bike to Work Week and Bike Network participant success (and recommendations for next year)
Meet with cycling working group -work with Saanich to advocate more/better cycling lanes
- report increased number of people cycling to Camosun from mode share counts
- report increased number of cycling routes around and between campuses
Complete
Complete
Complete
Incomplete
Incomplete
incomplete
Request a separate SharePoint site for Ancillary Services.
identify and seek out funding options for “ideal cycling conditions” on campus
create plan/timeline to implement “ideal cycling conditions”
Meet with Foundation to discuss possible funding sources
Meet with cycling working group work and with Saanich to advocate more/better cycling lanes
report increased number of people cycling to Camosun from mode share counts
Review/revise cycling routes around and between campuses
Completion of Secure Bike Parking at Lansdowne
Replacement of rusted bike fix-it station
Complete
Incomplete
Incomplete
Incomplete
Incomplete/Ongoing
Incomplete
Complete
Complete
Complete
Recommendation 3 year target 1st year work plan Status 2nd year work plan Status 3rd year work plan Status
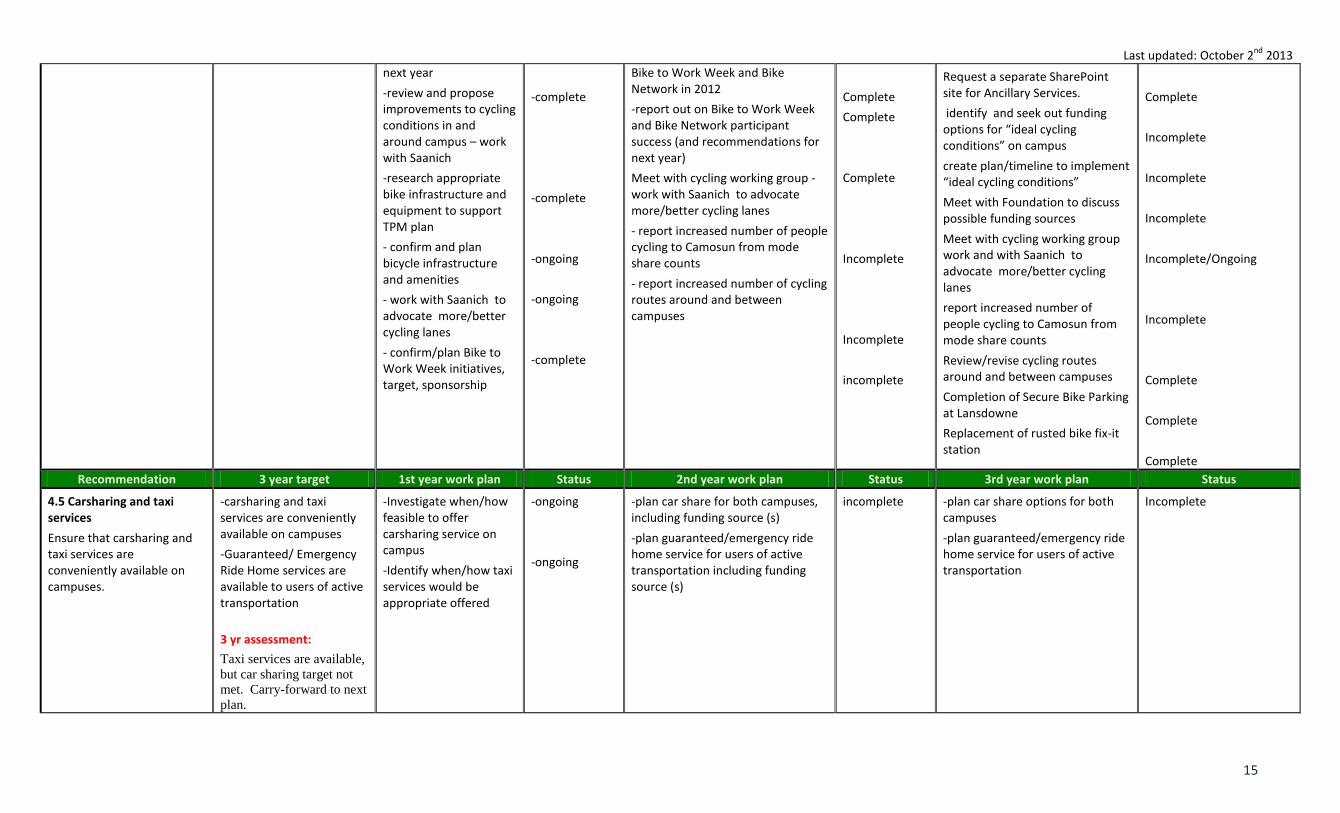
4.5 Carsharing and taxi services
Ensure that carsharing and taxi services are conveniently available on campuses.
-carsharing and taxi services are conveniently available on campuses
-Guaranteed/ Emergency Ride Home services are available to users of active transportation
3 yr assessment:
Taxi services are available,
but car sharing target not
met. Carry-forward to next
plan.
-Investigate when/how feasible to offer carsharing service on campus
-Identify when/how taxi services would be appropriate offered
-ongoing
-ongoing
-plan car share for both campuses, including funding source (s)
-plan guaranteed/emergency ride home service for users of active transportation including funding source (s)
incomplete -plan car share options for both campuses
-plan guaranteed/emergency ride home service for users of active transportation
Incomplete
Last updated: October 2nd
2013
16
Recommendation 3 year target 1st year work plan Status 2nd year work plan Status 3rd
year work plan Status
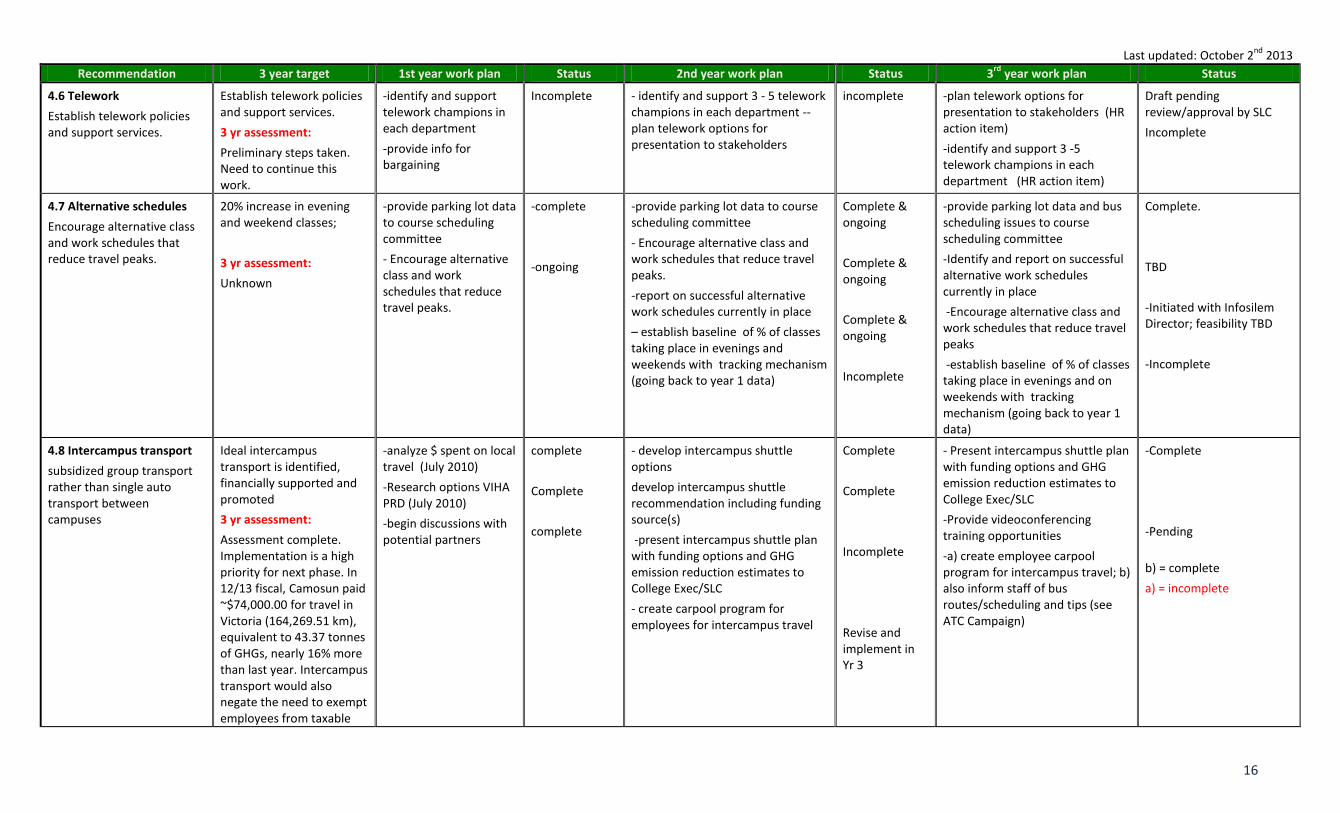
4.6 Telework
Establish telework policies and support services.
Establish telework policies and support services.
3 yr assessment:
Preliminary steps taken. Need to continue this work.
-identify and support telework champions in each department
-provide info for bargaining
Incomplete
- identify and support 3 - 5 telework champions in each department --plan telework options for presentation to stakeholders
incomplete -plan telework options for presentation to stakeholders (HR action item)
-identify and support 3 -5 telework champions in each department (HR action item)
Draft pending review/approval by SLC
Incomplete
4.7 Alternative schedules
Encourage alternative class and work schedules that reduce travel peaks.
20% increase in evening and weekend classes;
3 yr assessment:
Unknown
-provide parking lot data to course scheduling committee
- Encourage alternative class and work schedules that reduce travel peaks.
-complete
-ongoing
-provide parking lot data to course scheduling committee
- Encourage alternative class and work schedules that reduce travel peaks.
-report on successful alternative work schedules currently in place
– establish baseline of % of classes taking place in evenings and weekends with tracking mechanism (going back to year 1 data)
Complete & ongoing
Complete & ongoing
Complete & ongoing
Incomplete
-provide parking lot data and bus scheduling issues to course scheduling committee
-Identify and report on successful alternative work schedules currently in place
-Encourage alternative class and work schedules that reduce travel peaks
-establish baseline of % of classes taking place in evenings and on weekends with tracking mechanism (going back to year 1 data)
Complete.
TBD
-Initiated with Infosilem Director; feasibility TBD
-Incomplete
4.8 Intercampus transport
subsidized group transport rather than single auto transport between campuses
Ideal intercampus transport is identified, financially supported and promoted
3 yr assessment:
Assessment complete. Implementation is a high priority for next phase. In 12/13 fiscal, Camosun paid ~$74,000.00 for travel in Victoria (164,269.51 km), equivalent to 43.37 tonnes of GHGs, nearly 16% more than last year. Intercampus transport would also negate the need to exempt employees from taxable
-analyze $ spent on local travel (July 2010)
-Research options VIHA PRD (July 2010)
-begin discussions with potential partners
complete
Complete
complete
- develop intercampus shuttle options
develop intercampus shuttle recommendation including funding source(s)
-present intercampus shuttle plan with funding options and GHG emission reduction estimates to College Exec/SLC
- create carpool program for employees for intercampus travel
Complete
Complete
Incomplete
Revise and implement in Yr 3
- Present intercampus shuttle plan with funding options and GHG emission reduction estimates to College Exec/SLC
-Provide videoconferencing training opportunities
-a) create employee carpool program for intercampus travel; b) also inform staff of bus routes/scheduling and tips (see ATC Campaign)
-Complete
-Pending
b) = complete
a) = incomplete
Last updated: October 2nd
2013
17
benefits.
NEW: Participate in early adopter of Electric Charging station for both campuses (Government grant)
Installation complete. Complete
Recommendation 3 year target 1st
year work plan Status 2nd
year work plan/target Status 3rd year work plan Status
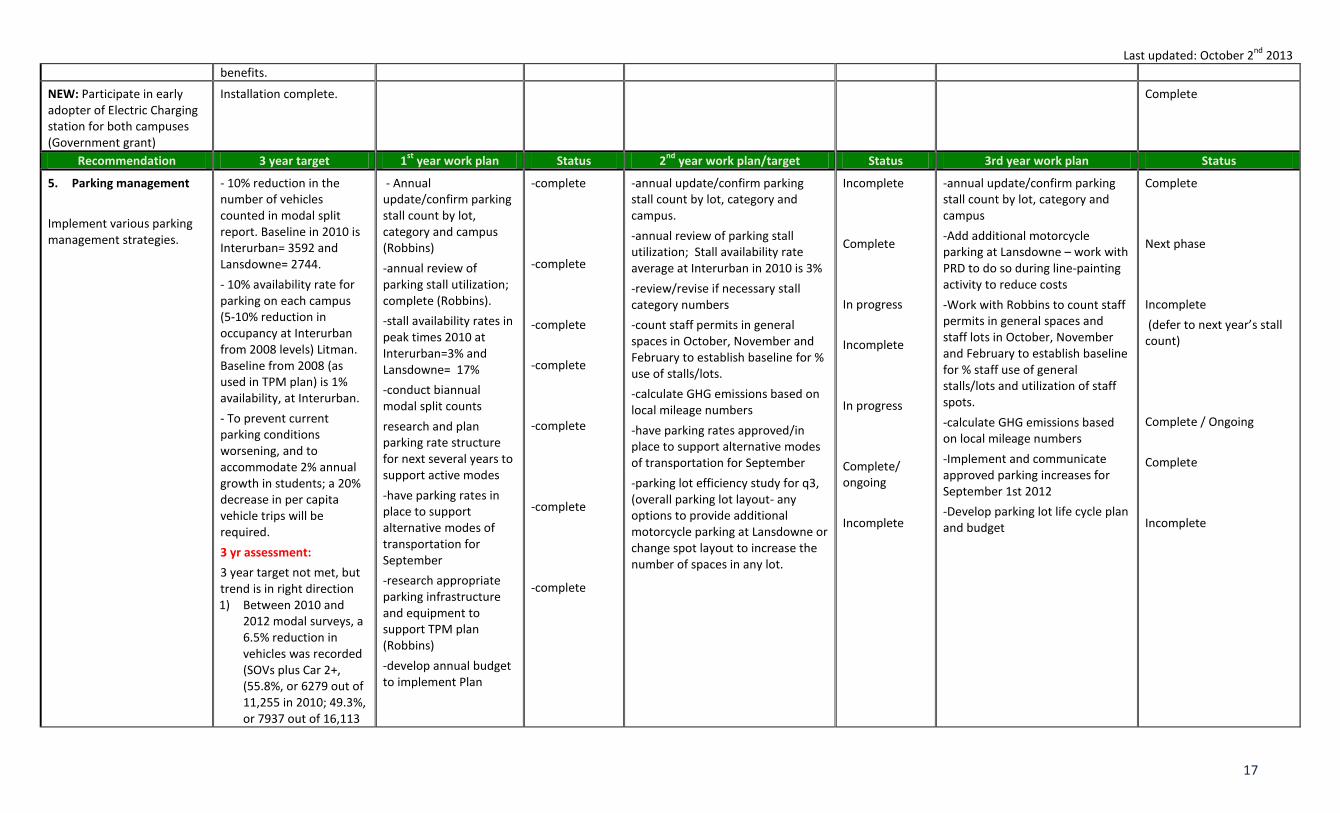
5. Parking management
Implement various parking management strategies.
- 10% reduction in the number of vehicles counted in modal split report. Baseline in 2010 is Interurban= 3592 and Lansdowne= 2744.
- 10% availability rate for parking on each campus (5-10% reduction in occupancy at Interurban from 2008 levels) Litman. Baseline from 2008 (as used in TPM plan) is 1% availability, at Interurban.
- To prevent current parking conditions worsening, and to accommodate 2% annual growth in students; a 20% decrease in per capita vehicle trips will be required.
3 yr assessment:
3 year target not met, but trend is in right direction 1) Between 2010 and
2012 modal surveys, a 6.5% reduction in vehicles was recorded (SOVs plus Car 2+, (55.8%, or 6279 out of 11,255 in 2010; 49.3%, or 7937 out of 16,113
- Annual update/confirm parking stall count by lot, category and campus (Robbins)
-annual review of parking stall utilization; complete (Robbins).
-stall availability rates in peak times 2010 at Interurban=3% and Lansdowne= 17%
-conduct biannual modal split counts
research and plan parking rate structure for next several years to support active modes
-have parking rates in place to support alternative modes of transportation for September
-research appropriate parking infrastructure and equipment to support TPM plan (Robbins)
-develop annual budget to implement Plan
-complete
-complete
-complete
-complete
-complete
-complete
-complete
-annual update/confirm parking stall count by lot, category and campus.
-annual review of parking stall utilization; Stall availability rate average at Interurban in 2010 is 3%
-review/revise if necessary stall category numbers
-count staff permits in general spaces in October, November and February to establish baseline for % use of stalls/lots.
-calculate GHG emissions based on local mileage numbers
-have parking rates approved/in place to support alternative modes of transportation for September
-parking lot efficiency study for q3, (overall parking lot layout- any options to provide additional motorcycle parking at Lansdowne or change spot layout to increase the number of spaces in any lot.
Incomplete
Complete
In progress
Incomplete
In progress
Complete/ ongoing
Incomplete
-annual update/confirm parking stall count by lot, category and campus
-Add additional motorcycle parking at Lansdowne – work with PRD to do so during line-painting activity to reduce costs
-Work with Robbins to count staff permits in general spaces and staff lots in October, November and February to establish baseline for % staff use of general stalls/lots and utilization of staff spots.
-calculate GHG emissions based on local mileage numbers
-Implement and communicate approved parking increases for September 1st 2012
-Develop parking lot life cycle plan and budget
Complete
Next phase
Incomplete
(defer to next year’s stall count)
Complete / Ongoing
Complete
Incomplete
Last updated: October 2nd
2013
18
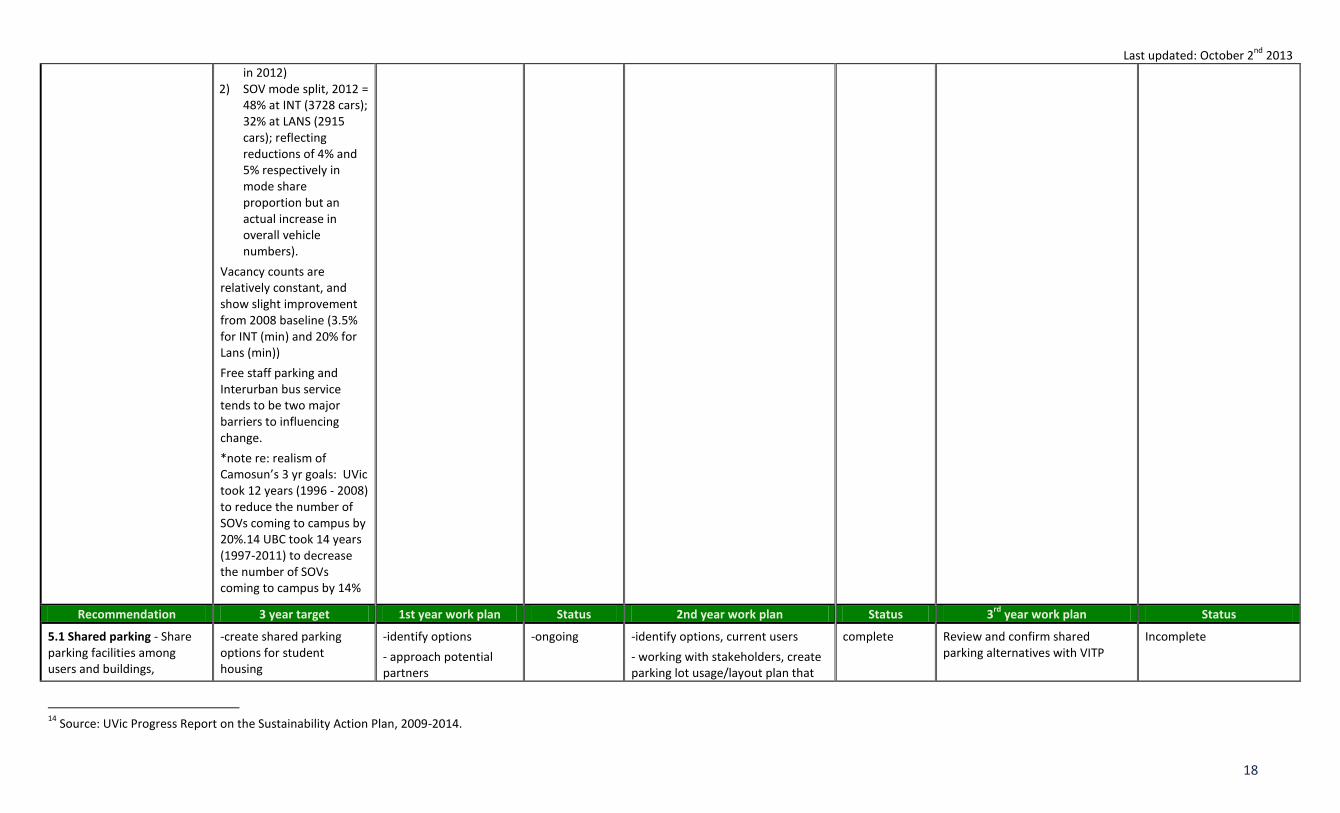
in 2012) 2) SOV mode split, 2012 =
48% at INT (3728 cars); 32% at LANS (2915 cars); reflecting reductions of 4% and 5% respectively in mode share proportion but an actual increase in overall vehicle numbers).
Vacancy counts are relatively constant, and show slight improvement from 2008 baseline (3.5% for INT (min) and 20% for Lans (min))
Free staff parking and Interurban bus service tends to be two major barriers to influencing change.
*note re: realism of Camosun’s 3 yr goals: UVic took 12 years (1996 - 2008) to reduce the number of SOVs coming to campus by 20%.14 UBC took 14 years (1997-2011) to decrease the number of SOVs coming to campus by 14%
Recommendation 3 year target 1st year work plan Status 2nd year work plan Status 3rd
year work plan Status
5.1 Shared parking - Share parking facilities among users and buildings,
-create shared parking options for student housing
-identify options
- approach potential partners
-ongoing -identify options, current users
- working with stakeholders, create parking lot usage/layout plan that
complete Review and confirm shared parking alternatives with VITP
Incomplete
14
Source: UVic Progress Report on the Sustainability Action Plan, 2009-2014.
Last updated: October 2nd
2013
19
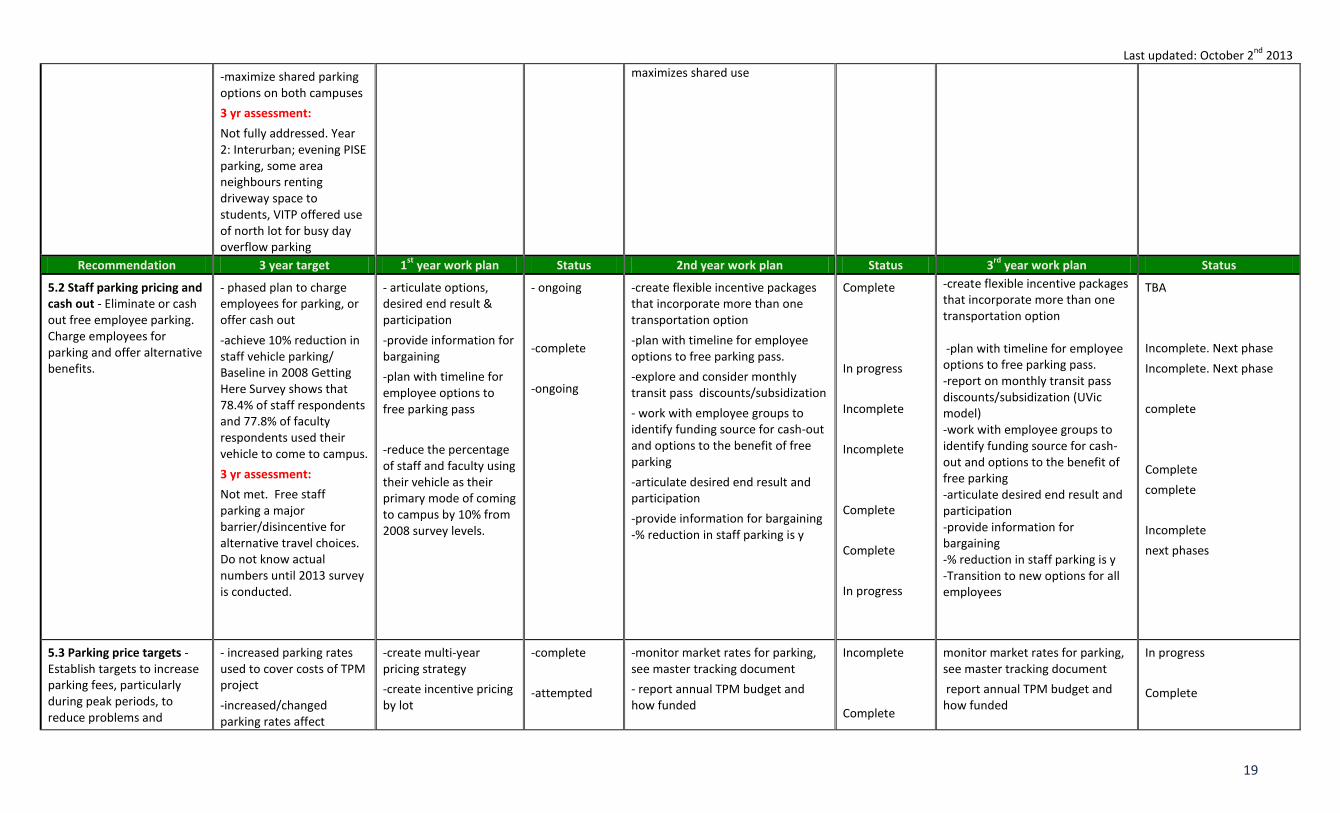
-maximize shared parking options on both campuses
3 yr assessment:
Not fully addressed. Year 2: Interurban; evening PISE parking, some area neighbours renting driveway space to students, VITP offered use of north lot for busy day overflow parking
maximizes shared use
Recommendation 3 year target 1st
year work plan Status 2nd year work plan Status 3rd
year work plan Status
5.2 Staff parking pricing and cash out - Eliminate or cash out free employee parking. Charge employees for parking and offer alternative benefits.
- phased plan to charge employees for parking, or offer cash out
-achieve 10% reduction in staff vehicle parking/ Baseline in 2008 Getting Here Survey shows that 78.4% of staff respondents and 77.8% of faculty respondents used their vehicle to come to campus.
3 yr assessment:
Not met. Free staff parking a major barrier/disincentive for alternative travel choices. Do not know actual numbers until 2013 survey is conducted.
- articulate options, desired end result & participation
-provide information for bargaining
-plan with timeline for employee options to free parking pass
-reduce the percentage of staff and faculty using their vehicle as their primary mode of coming to campus by 10% from 2008 survey levels.
- ongoing
-complete
-ongoing
-create flexible incentive packages that incorporate more than one transportation option
-plan with timeline for employee options to free parking pass.
-explore and consider monthly transit pass discounts/subsidization
- work with employee groups to identify funding source for cash-out and options to the benefit of free parking
-articulate desired end result and participation
-provide information for bargaining -% reduction in staff parking is y
Complete
In progress
Incomplete
Incomplete
Complete
Complete
In progress
-create flexible incentive packages that incorporate more than one transportation option -plan with timeline for employee options to free parking pass. -report on monthly transit pass discounts/subsidization (UVic model) -work with employee groups to identify funding source for cash-out and options to the benefit of free parking -articulate desired end result and participation -provide information for bargaining -% reduction in staff parking is y -Transition to new options for all employees
TBA
Incomplete. Next phase
Incomplete. Next phase
complete
Complete
complete
Incomplete
next phases
5.3 Parking price targets - Establish targets to increase parking fees, particularly during peak periods, to reduce problems and
- increased parking rates used to cover costs of TPM project
-increased/changed parking rates affect
-create multi-year pricing strategy
-create incentive pricing by lot
-complete
-attempted
-monitor market rates for parking, see master tracking document
- report annual TPM budget and how funded
Incomplete
Complete
monitor market rates for parking, see master tracking document
report annual TPM budget and how funded
In progress
Complete
Last updated: October 2nd
2013
20
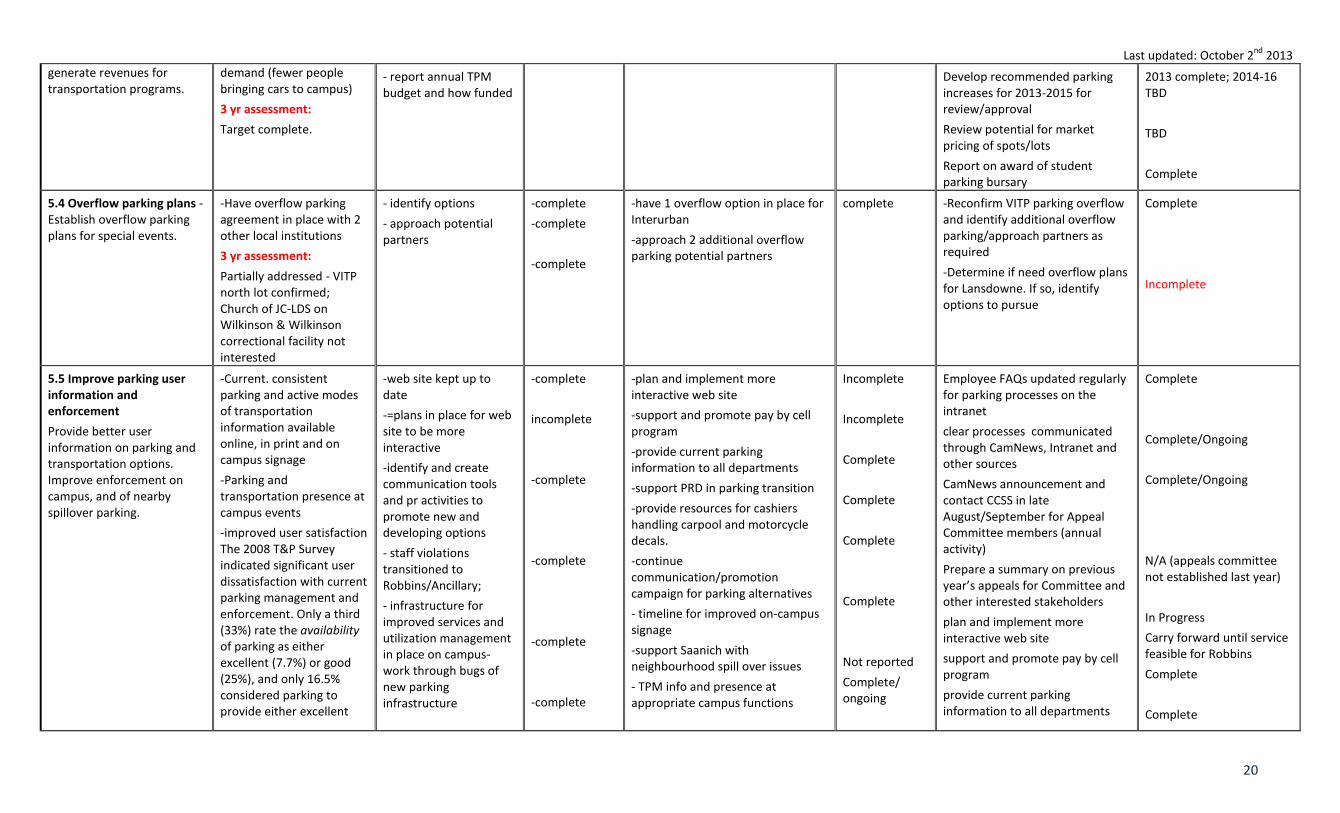
generate revenues for transportation programs.
demand (fewer people bringing cars to campus)
3 yr assessment:
Target complete.
- report annual TPM budget and how funded
Develop recommended parking increases for 2013-2015 for review/approval
Review potential for market pricing of spots/lots
Report on award of student parking bursary
2013 complete; 2014-16 TBD
TBD
Complete
5.4 Overflow parking plans -Establish overflow parking plans for special events.
-Have overflow parking agreement in place with 2 other local institutions
3 yr assessment:
Partially addressed - VITP north lot confirmed; Church of JC-LDS on Wilkinson & Wilkinson correctional facility not interested
- identify options
- approach potential partners
-complete
-complete
-complete
-have 1 overflow option in place for Interurban
-approach 2 additional overflow parking potential partners
complete -Reconfirm VITP parking overflow and identify additional overflow parking/approach partners as required
-Determine if need overflow plans for Lansdowne. If so, identify options to pursue
Complete
Incomplete
5.5 Improve parking user information and enforcement
Provide better user information on parking and transportation options. Improve enforcement on campus, and of nearby spillover parking.
-Current. consistent parking and active modes of transportation information available online, in print and on campus signage
-Parking and transportation presence at campus events
-improved user satisfaction The 2008 T&P Survey indicated significant user dissatisfaction with current parking management and enforcement. Only a third (33%) rate the availability of parking as either excellent (7.7%) or good (25%), and only 16.5% considered parking to provide either excellent
-web site kept up to date
-=plans in place for web site to be more interactive
-identify and create communication tools and pr activities to promote new and developing options
- staff violations transitioned to Robbins/Ancillary;
- infrastructure for improved services and utilization management in place on campus- work through bugs of new parking infrastructure
-complete
incomplete
-complete
-complete
-complete
-complete
-plan and implement more interactive web site
-support and promote pay by cell program
-provide current parking information to all departments
-support PRD in parking transition
-provide resources for cashiers handling carpool and motorcycle decals.
-continue communication/promotion campaign for parking alternatives
- timeline for improved on-campus signage
-support Saanich with neighbourhood spill over issues
- TPM info and presence at appropriate campus functions
Incomplete
Incomplete
Complete
Complete
Complete
Complete
Not reported
Complete/ ongoing
Employee FAQs updated regularly for parking processes on the intranet
clear processes communicated through CamNews, Intranet and other sources
CamNews announcement and contact CCSS in late August/September for Appeal Committee members (annual activity)
Prepare a summary on previous year’s appeals for Committee and other interested stakeholders
plan and implement more interactive web site
support and promote pay by cell program
provide current parking information to all departments
Complete
Complete/Ongoing
Complete/Ongoing
N/A (appeals committee not established last year)
In Progress
Carry forward until service feasible for Robbins
Complete
Complete
Last updated: October 2nd
2013
21
(5.9%) or good (10.6%) value for money
3 yr assessment:
Complete, except for improving user satisfaction rates (too early to tell as survey has not been completed)
-develop flyer for off-campus parking in conjunction with Saanich and BC Hydro
-TPM info and presence at appropriate campus functions
-complete
-complete
-report increased user satisfaction from survey results
Complete/ ongoing
Complete/ ongoing
Provide resources for cashiers handling carpool and motorcycle decals.
support Saanich and Oak Bay with neighbourhood spill over issues
report increased user satisfaction from survey results
Review annual signage and painting schedule with Brian Calvert
Incomplete
TBD
Complete March 2013
Recommendation 3 year target 1st
year work plan Status 2nd
year work plan/target Status 3rd
year work plan Status
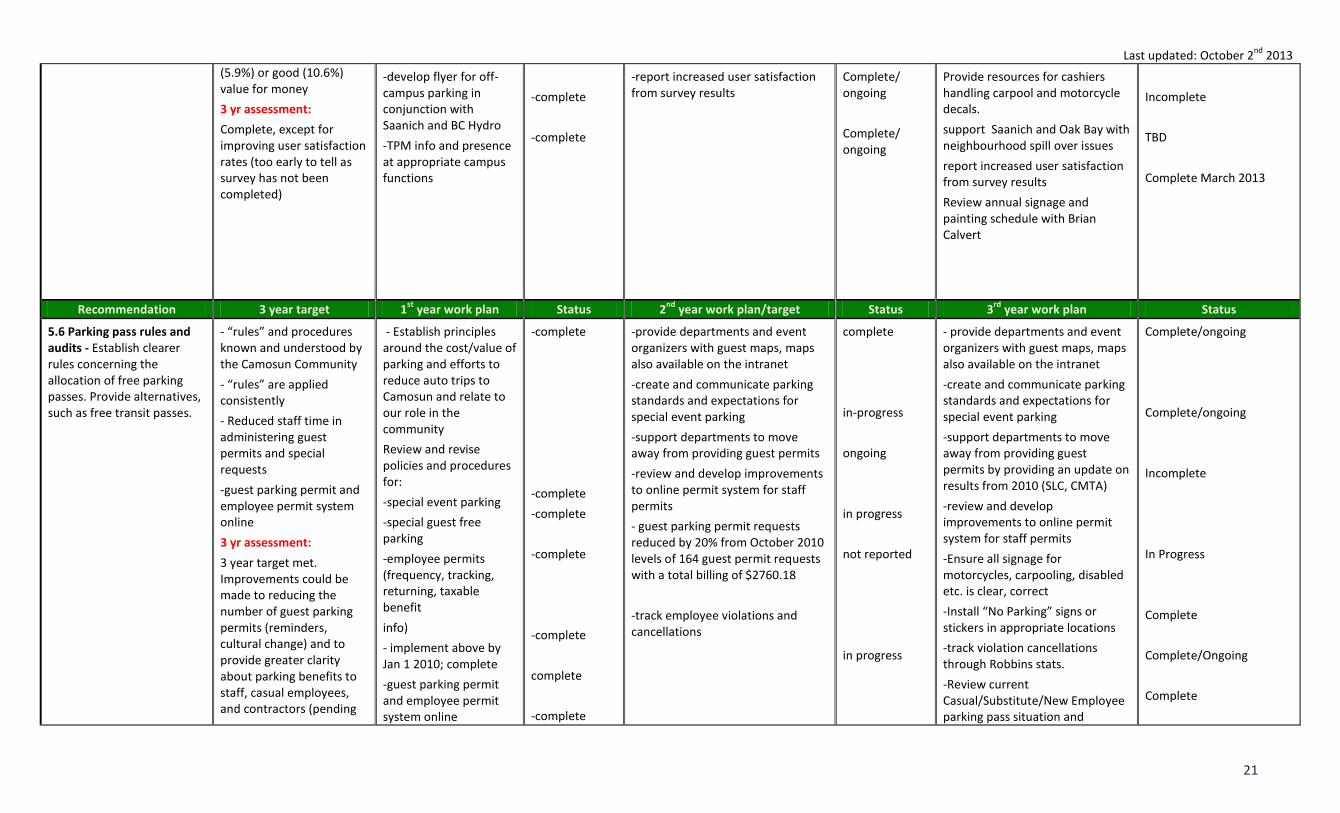
5.6 Parking pass rules and audits - Establish clearer rules concerning the allocation of free parking passes. Provide alternatives, such as free transit passes.
- “rules” and procedures known and understood by the Camosun Community
- “rules” are applied consistently
- Reduced staff time in administering guest permits and special requests
-guest parking permit and employee permit system online
3 yr assessment:
3 year target met. Improvements could be made to reducing the number of guest parking permits (reminders, cultural change) and to provide greater clarity about parking benefits to staff, casual employees, and contractors (pending
- Establish principles around the cost/value of parking and efforts to reduce auto trips to Camosun and relate to our role in the community
Review and revise policies and procedures for:
-special event parking
-special guest free parking
-employee permits (frequency, tracking, returning, taxable benefit
info)
- implement above by Jan 1 2010; complete
-guest parking permit and employee permit system online
-complete
-complete
-complete
-complete
-complete
complete
-complete
-provide departments and event organizers with guest maps, maps also available on the intranet
-create and communicate parking standards and expectations for special event parking
-support departments to move away from providing guest permits
-review and develop improvements to online permit system for staff permits
- guest parking permit requests reduced by 20% from October 2010 levels of 164 guest permit requests with a total billing of $2760.18
-track employee violations and cancellations
complete
in-progress
ongoing
in progress
not reported
in progress
- provide departments and event organizers with guest maps, maps also available on the intranet
-create and communicate parking standards and expectations for special event parking
-support departments to move away from providing guest permits by providing an update on results from 2010 (SLC, CMTA)
-review and develop improvements to online permit system for staff permits
-Ensure all signage for motorcycles, carpooling, disabled etc. is clear, correct
-Install “No Parking” signs or stickers in appropriate locations
-track violation cancellations through Robbins stats.
-Review current Casual/Substitute/New Employee parking pass situation and
Complete/ongoing
Complete/ongoing
Incomplete
In Progress
Complete
Complete/Ongoing
Complete
Last updated: October 2nd
2013
22
policy and guidelines).
-transition how staff violations are addressed
- appeal process in place for violations
- new admin process to support parking management and support alternate modes
- develop and implement transition plan from PRD to Ancillary
-complete
-complete
-complete
propose a solution In progress
Recommendation 3 year target 1st
year work plan Status 2nd year work plan Status 3rd
year work plan Status
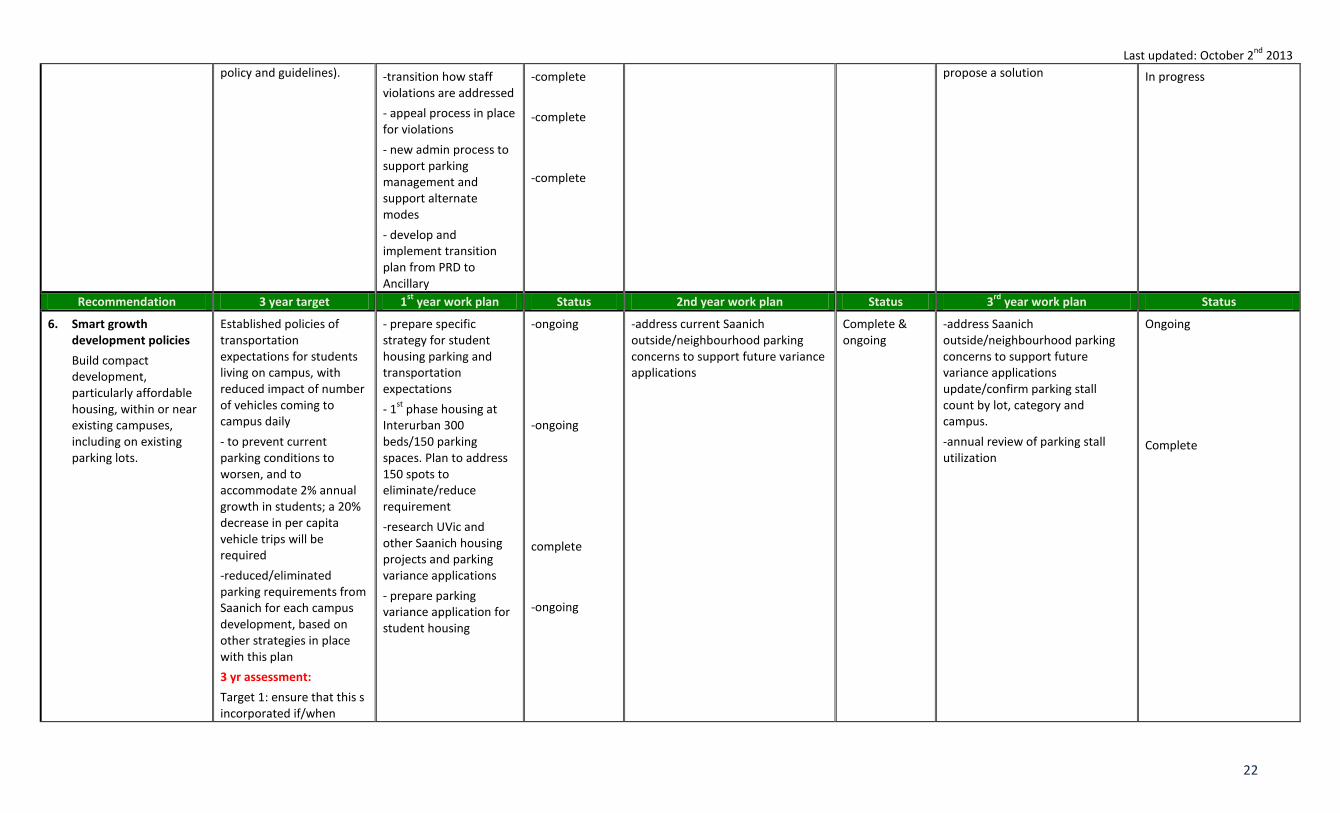
6. Smart growth development policies
Build compact development, particularly affordable housing, within or near existing campuses, including on existing parking lots.
Established policies of transportation expectations for students living on campus, with reduced impact of number of vehicles coming to campus daily
- to prevent current parking conditions to worsen, and to accommodate 2% annual growth in students; a 20% decrease in per capita vehicle trips will be required
-reduced/eliminated parking requirements from Saanich for each campus development, based on other strategies in place with this plan
3 yr assessment:
Target 1: ensure that this s incorporated if/when
- prepare specific strategy for student housing parking and transportation expectations
- 1st
phase housing at Interurban 300 beds/150 parking spaces. Plan to address 150 spots to eliminate/reduce requirement
-research UVic and other Saanich housing projects and parking variance applications
- prepare parking variance application for student housing
-ongoing
-ongoing
complete
-ongoing
-address current Saanich outside/neighbourhood parking concerns to support future variance applications
Complete & ongoing
-address Saanich outside/neighbourhood parking concerns to support future variance applications update/confirm parking stall count by lot, category and campus.
-annual review of parking stall utilization
Ongoing
Complete
Last updated: October 2nd
2013
23
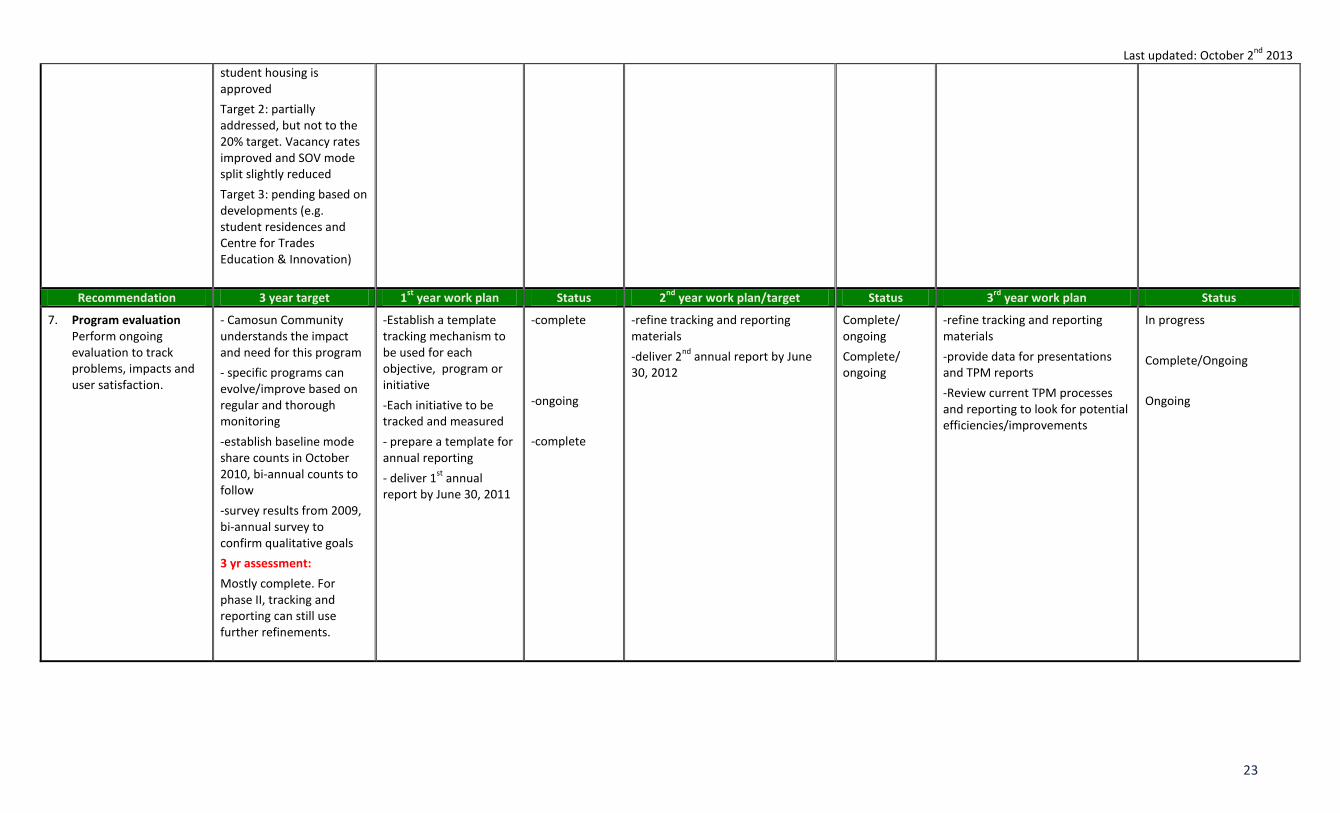
student housing is approved
Target 2: partially addressed, but not to the 20% target. Vacancy rates improved and SOV mode split slightly reduced
Target 3: pending based on developments (e.g. student residences and Centre for Trades Education & Innovation)
Recommendation 3 year target 1st
year work plan Status 2nd
year work plan/target Status 3rd
year work plan Status
7. Program evaluation Perform ongoing evaluation to track problems, impacts and user satisfaction.
- Camosun Community understands the impact and need for this program
- specific programs can evolve/improve based on regular and thorough monitoring
-establish baseline mode share counts in October 2010, bi-annual counts to follow
-survey results from 2009, bi-annual survey to confirm qualitative goals
3 yr assessment:
Mostly complete. For phase II, tracking and reporting can still use further refinements.
-Establish a template tracking mechanism to be used for each objective, program or initiative
-Each initiative to be tracked and measured
- prepare a template for annual reporting
- deliver 1st
annual report by June 30, 2011
-complete
-ongoing
-complete
-refine tracking and reporting materials
-deliver 2nd
annual report by June 30, 2012
Complete/ ongoing
Complete/ ongoing
-refine tracking and reporting materials
-provide data for presentations and TPM reports
-Review current TPM processes and reporting to look for potential efficiencies/improvements
In progress
Complete/Ongoing
Ongoing
Last updated: October 2nd
2013
24
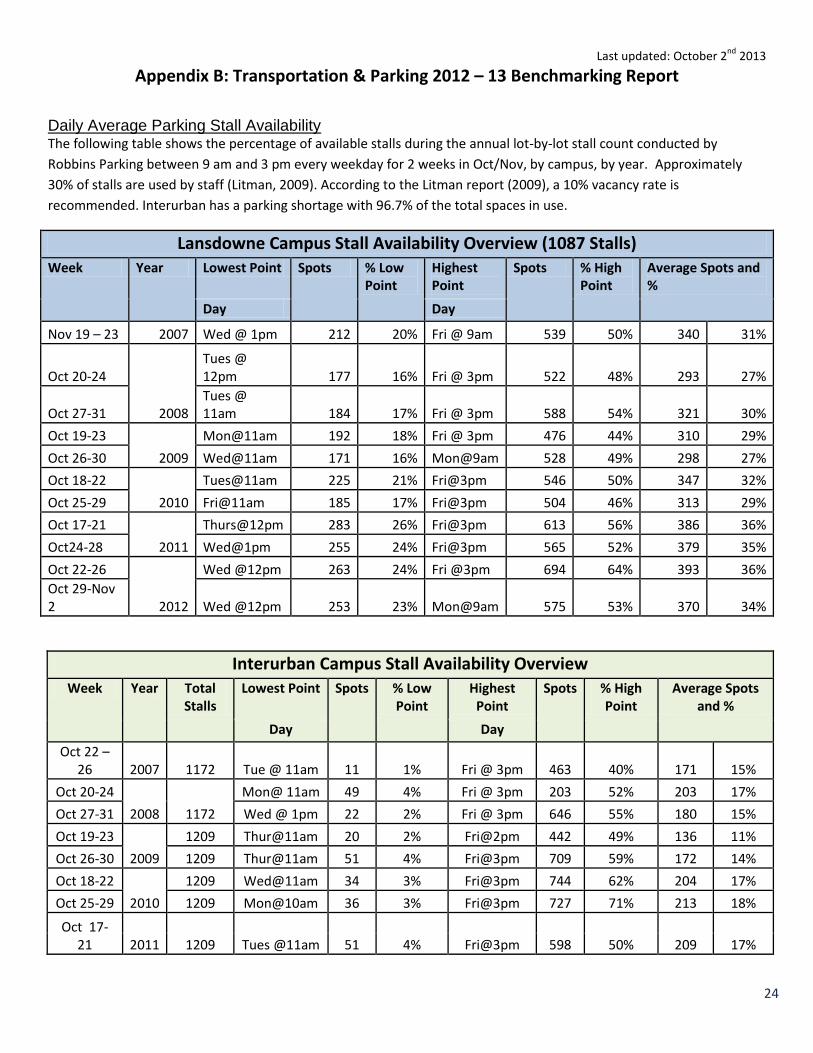
Appendix B: Transportation & Parking 2012 – 13 Benchmarking Report
Daily Average Parking Stall Availability The following table shows the percentage of available stalls during the annual lot-by-lot stall count conducted by
Robbins Parking between 9 am and 3 pm every weekday for 2 weeks in Oct/Nov, by campus, by year. Approximately
30% of stalls are used by staff (Litman, 2009). According to the Litman report (2009), a 10% vacancy rate is
recommended. Interurban has a parking shortage with 96.7% of the total spaces in use.
Lansdowne Campus Stall Availability Overview (1087 Stalls) Week Year Lowest Point Spots % Low
Point Highest Point
Spots % High Point
Average Spots and %
Day Day
Nov 19 – 23 2007 Wed @ 1pm 212 20% Fri @ 9am 539 50% 340 31%
Oct 20-24
2008
Tues @ 12pm 177 16% Fri @ 3pm 522 48% 293 27%
Oct 27-31 Tues @ 11am 184 17% Fri @ 3pm 588 54% 321 30%
Oct 19-23
2009
Mon@11am 192 18% Fri @ 3pm 476 44% 310 29%
Oct 26-30 Wed@11am 171 16% Mon@9am 528 49% 298 27%
Oct 18-22
2010
Tues@11am 225 21% Fri@3pm 546 50% 347 32%
Oct 25-29 Fri@11am 185 17% Fri@3pm 504 46% 313 29%
Oct 17-21
2011
Thurs@12pm 283 26% Fri@3pm 613 56% 386 36%
Oct24-28 Wed@1pm 255 24% Fri@3pm 565 52% 379 35%
Oct 22-26
2012
Wed @12pm 263 24% Fri @3pm 694 64% 393 36%
Oct 29-Nov 2 Wed @12pm 253 23% Mon@9am 575 53% 370 34%
Interurban Campus Stall Availability Overview Week Year Total
Stalls Lowest Point Spots % Low
Point Highest
Point Spots % High
Point Average Spots
and %
Day Day
Oct 22 – 26 2007 1172 Tue @ 11am 11 1% Fri @ 3pm 463 40% 171 15%
Oct 20-24
2008 1172
Mon@ 11am 49 4% Fri @ 3pm 203 52% 203 17%
Oct 27-31 Wed @ 1pm 22 2% Fri @ 3pm 646 55% 180 15%
Oct 19-23
2009
1209 Thur@11am 20 2% Fri@2pm 442 49% 136 11%
Oct 26-30 1209 Thur@11am 51 4% Fri@3pm 709 59% 172 14%
Oct 18-22
2010
1209 Wed@11am 34 3% Fri@3pm 744 62% 204 17%
Oct 25-29 1209 Mon@10am 36 3% Fri@3pm 727 71% 213 18%
Oct 17-21 2011 1209 Tues @11am 51 4% Fri@3pm 598 50% 209 17%
Last updated: October 2nd
2013
25
Interurban Campus Stall Availability Overview Week Year Total
Stalls Lowest Point Spots % Low
Point Highest
Point Spots % High
Point Average Spots
and %
Oct 24-28 1209 Thurs@11
am 45 4% Frid@2pm 466 39% 230 19%
Oct 22-26
2012
1209 Thur @11am 45 4% Wed @3pm 699 58% 275 23%
Oct 29-Nov 2 1209 Tue @ 11am 34 3% Fri @ 3pm 651 54% 233 19%
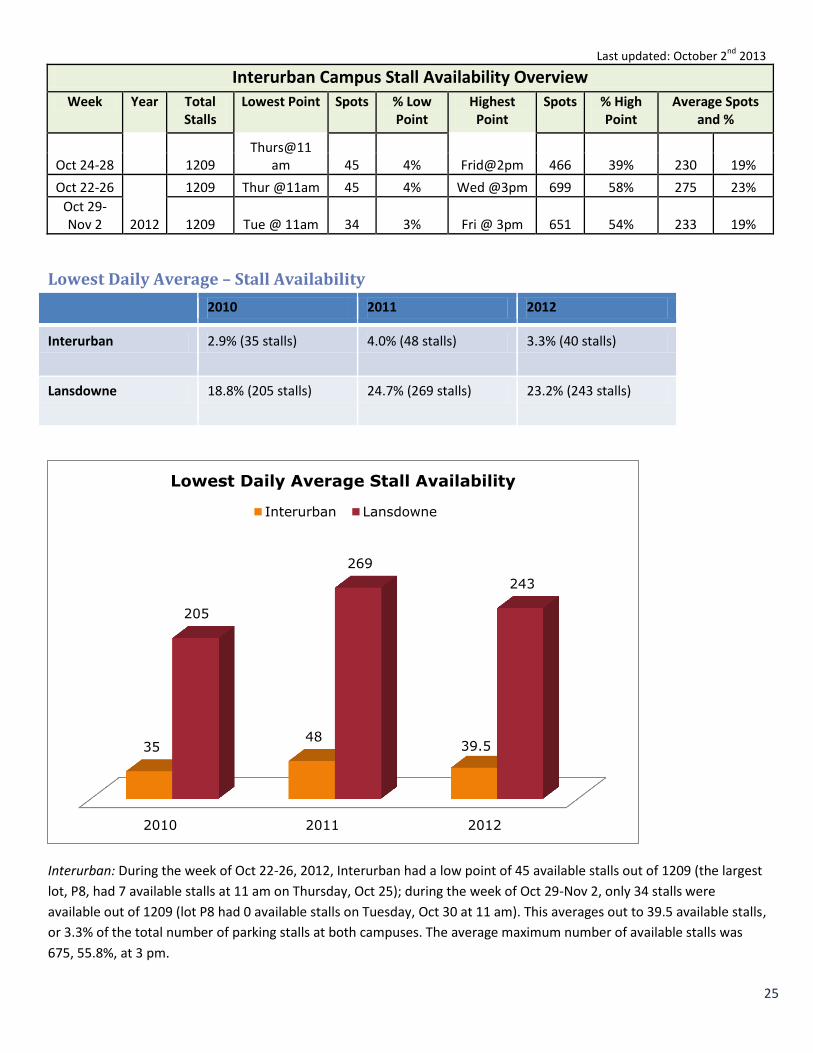
Lowest Daily Average – Stall Availability
2010 2011 2012
Interurban 2.9% (35 stalls) 4.0% (48 stalls) 3.3% (40 stalls)
Lansdowne 18.8% (205 stalls) 24.7% (269 stalls) 23.2% (243 stalls)
Interurban: During the week of Oct 22-26, 2012, Interurban had a low point of 45 available stalls out of 1209 (the largest
lot, P8, had 7 available stalls at 11 am on Thursday, Oct 25); during the week of Oct 29-Nov 2, only 34 stalls were
available out of 1209 (lot P8 had 0 available stalls on Tuesday, Oct 30 at 11 am). This averages out to 39.5 available stalls,
or 3.3% of the total number of parking stalls at both campuses. The average maximum number of available stalls was
675, 55.8%, at 3 pm.
2010 2011 2012
35 48
39.5
205
269
243
Lowest Daily Average Stall Availability
Interurban Lansdowne
Last updated: October 2nd
2013
26
Lansdowne: During the week of Oct 22-26, 2012, there was a low point of 263 stalls (197 in the largest lot, P6, on Wed
at 12 pm); during the week of Oct 29-Nov 2, Lansdowne had a low point of 243 stalls available (192 in P6 on Wed at 12
pm). This averages out to a low of 253 available stalls, or 23.2% of the 1089 stalls. The average maximum number of
stalls was 634.5, 58.3% of the total number of stalls.
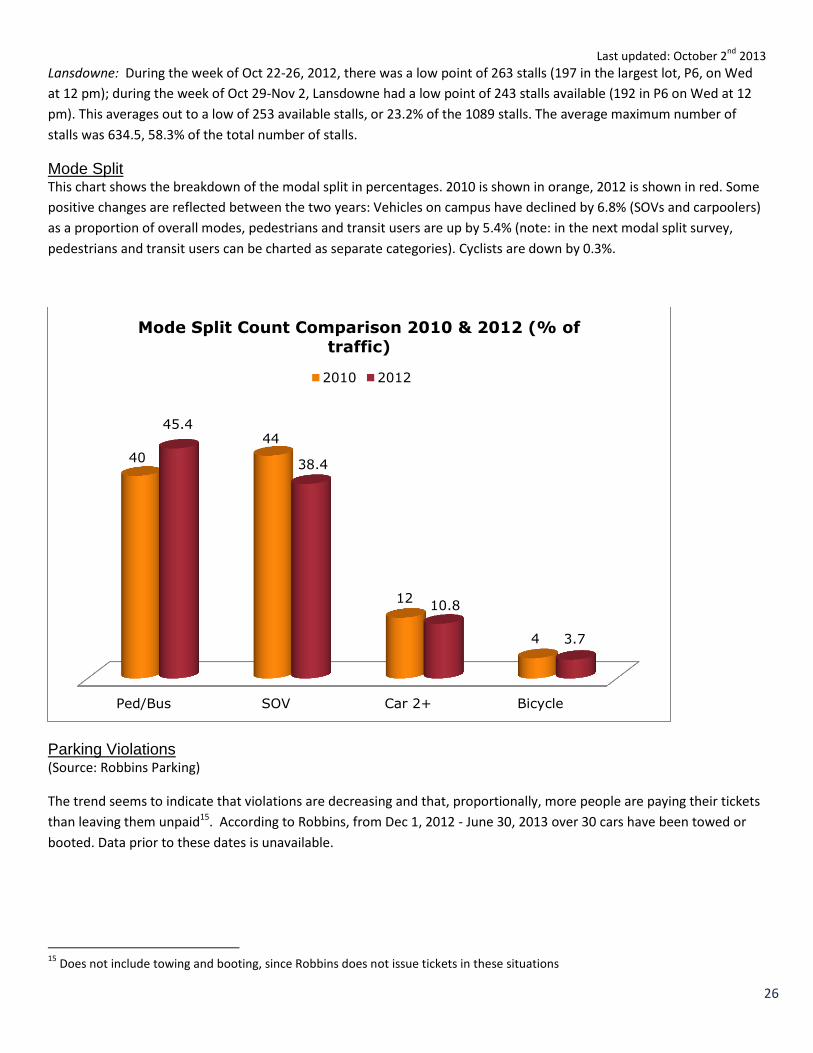
Mode Split This chart shows the breakdown of the modal split in percentages. 2010 is shown in orange, 2012 is shown in red. Some
positive changes are reflected between the two years: Vehicles on campus have declined by 6.8% (SOVs and carpoolers)
as a proportion of overall modes, pedestrians and transit users are up by 5.4% (note: in the next modal split survey,
pedestrians and transit users can be charted as separate categories). Cyclists are down by 0.3%.
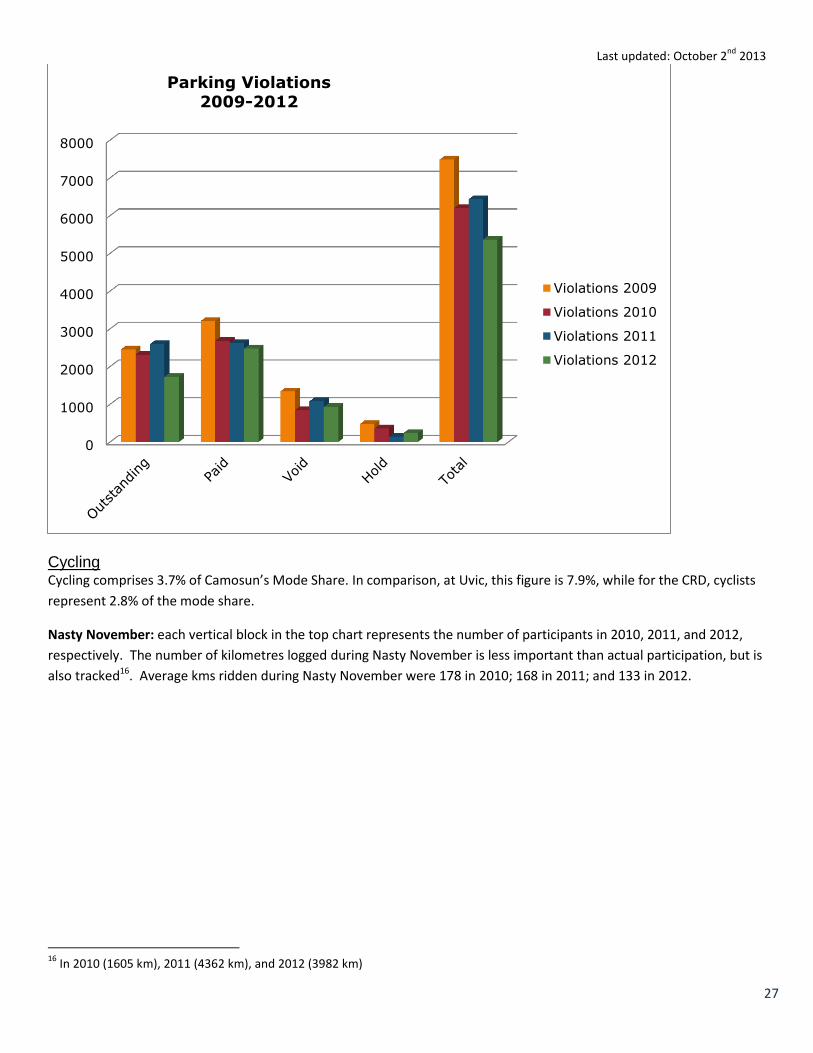
Parking Violations (Source: Robbins Parking)
The trend seems to indicate that violations are decreasing and that, proportionally, more people are paying their tickets
than leaving them unpaid15. According to Robbins, from Dec 1, 2012 - June 30, 2013 over 30 cars have been towed or
booted. Data prior to these dates is unavailable.
15
Does not include towing and booting, since Robbins does not issue tickets in these situations
Ped/Bus SOV Car 2+ Bicycle
40
44
12
4
45.4
38.4
10.8
3.7
Mode Split Count Comparison 2010 & 2012 (% of traffic)
2010 2012
Last updated: October 2nd
2013
27
Cycling Cycling comprises 3.7% of Camosun’s Mode Share. In comparison, at Uvic, this figure is 7.9%, while for the CRD, cyclists
represent 2.8% of the mode share.
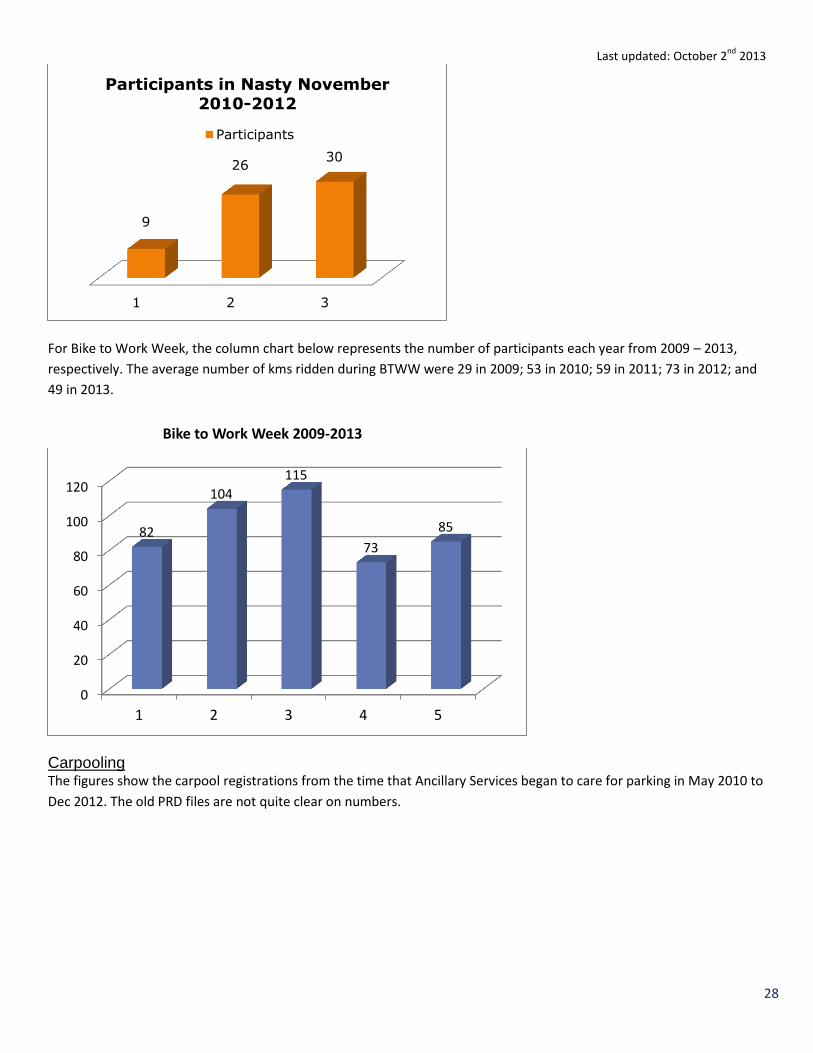
Nasty November: each vertical block in the top chart represents the number of participants in 2010, 2011, and 2012,
respectively. The number of kilometres logged during Nasty November is less important than actual participation, but is
also tracked16. Average kms ridden during Nasty November were 178 in 2010; 168 in 2011; and 133 in 2012.
16
In 2010 (1605 km), 2011 (4362 km), and 2012 (3982 km)
0
1000
2000
3000
4000
5000
6000
7000
8000
Parking Violations 2009-2012
Violations 2009
Violations 2010
Violations 2011
Violations 2012
Last updated: October 2nd
2013
28
For Bike to Work Week, the column chart below represents the number of participants each year from 2009 – 2013,
respectively. The average number of kms ridden during BTWW were 29 in 2009; 53 in 2010; 59 in 2011; 73 in 2012; and
49 in 2013.
Carpooling The figures show the carpool registrations from the time that Ancillary Services began to care for parking in May 2010 to
Dec 2012. The old PRD files are not quite clear on numbers.
1 2 3
9
26 30
Participants in Nasty November 2010-2012
Participants
0
20
40
60
80
100
120
1 2 3 4 5
82
104
115
73
85
Bike to Work Week 2009-2013
Last updated: October 2nd
2013
29
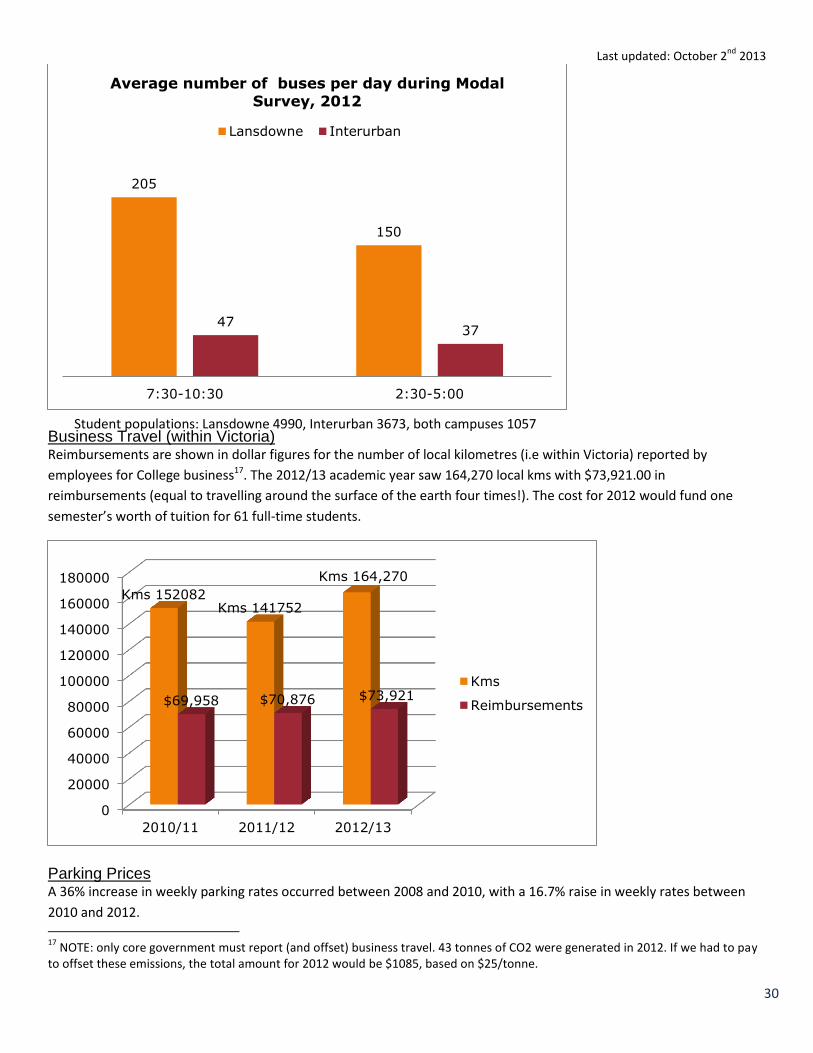
BC Transit Service Both sets of charts reflect the actual number of buses arriving on campus on any given day in the fall between the hours
of 7:30 – 10:30 am and 2:30-5:00 pm. Double decker buses are counted in this average as two buses since they have
twice the passenger capacity of a “low-floor” or standard bus. Lansdowne sees 1.14 buses arriving every minute in the
morning (17 buses per 15-minute period) and 1 per minute in the afternoon (15 per 15-minute interval). At Interurban,
0.26 buses arrive every minute in the morning (3.9 buses every 15 minutes), and 0.27 per minute (3.7 per 15-minute
interval) in the afternoon. Interurban has approximately 75% of the student population but receives only 23-25% of the
bus service.
0
10
20
30
40
50
60
70
80
2010 (Ancillary) 2011 2012
Total Groups
Total Riders
67
63
5
27 29
20
Carpool Permit Registrations
Last updated: October 2nd
2013
30
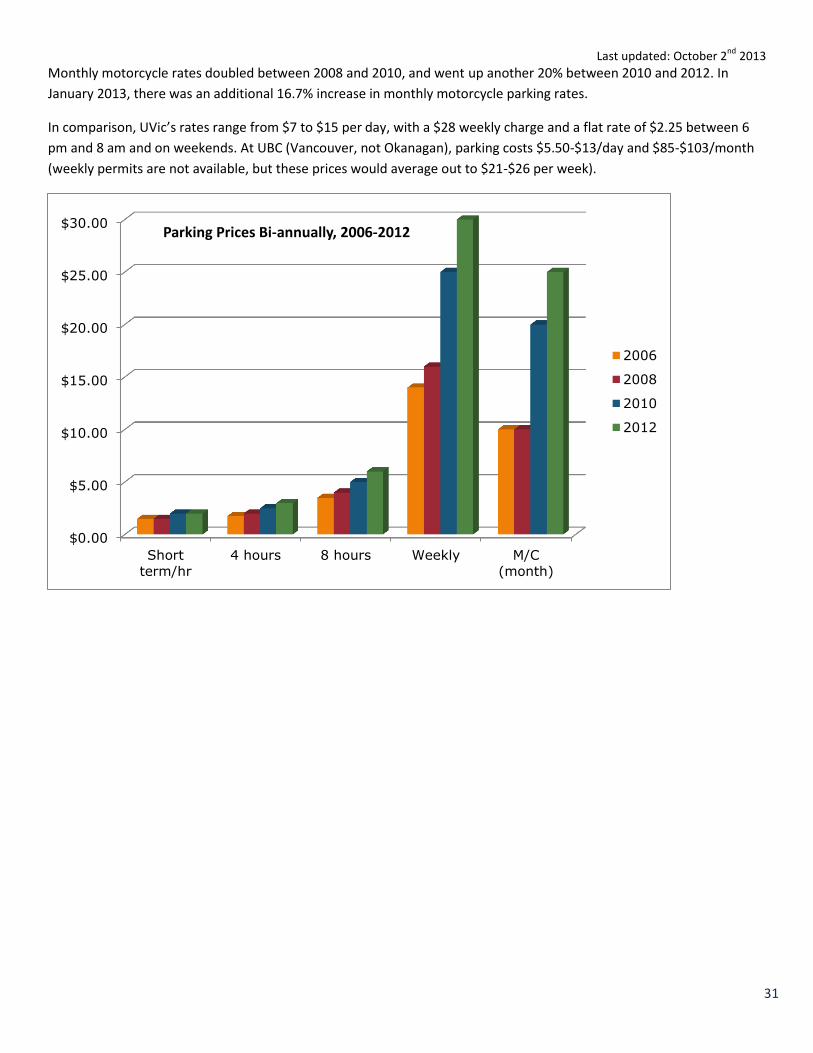
Business Travel (within Victoria) Reimbursements are shown in dollar figures for the number of local kilometres (i.e within Victoria) reported by
employees for College business17. The 2012/13 academic year saw 164,270 local kms with $73,921.00 in
reimbursements (equal to travelling around the surface of the earth four times!). The cost for 2012 would fund one
semester’s worth of tuition for 61 full-time students.
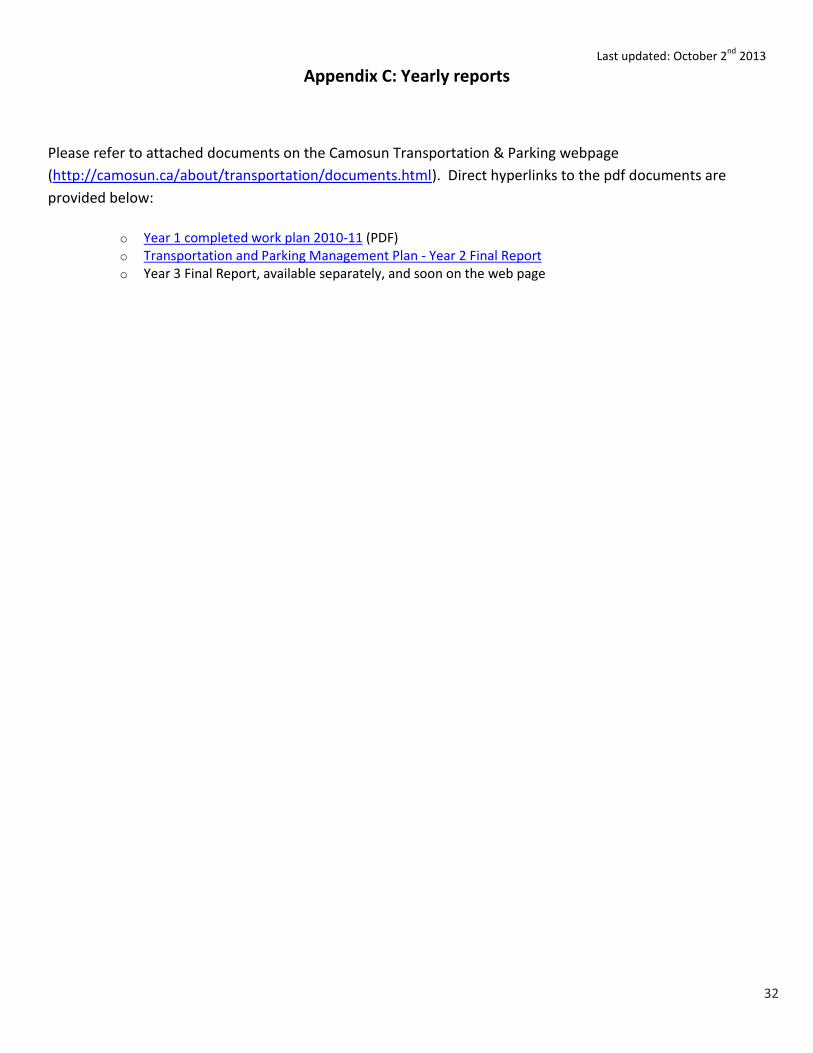
Parking Prices A 36% increase in weekly parking rates occurred between 2008 and 2010, with a 16.7% raise in weekly rates between
2010 and 2012. 17
NOTE: only core government must report (and offset) business travel. 43 tonnes of CO2 were generated in 2012. If we had to pay to offset these emissions, the total amount for 2012 would be $1085, based on $25/tonne.
205
150
47 37
7:30-10:30 2:30-5:00
Average number of buses per day during Modal Survey, 2012
Lansdowne Interurban
0
20000
40000
60000
80000
100000
120000
140000
160000
180000
2010/11 2011/12 2012/13
Kms 152082 Kms 141752
Kms 164,270
$69,958 $70,876 $73,921 Kms
Reimbursements
Student populations: Lansdowne 4990, Interurban 3673, both campuses 1057
Last updated: October 2nd
2013
31
Monthly motorcycle rates doubled between 2008 and 2010, and went up another 20% between 2010 and 2012. In
January 2013, there was an additional 16.7% increase in monthly motorcycle parking rates.
In comparison, UVic’s rates range from $7 to $15 per day, with a $28 weekly charge and a flat rate of $2.25 between 6
pm and 8 am and on weekends. At UBC (Vancouver, not Okanagan), parking costs $5.50-$13/day and $85-$103/month
(weekly permits are not available, but these prices would average out to $21-$26 per week).
$0.00
$5.00
$10.00
$15.00
$20.00
$25.00
$30.00
Short
term/hr
4 hours 8 hours Weekly M/C
(month)
2006
2008
2010
2012
Parking Prices Bi-annually, 2006-2012
Last updated: October 2nd
2013
32
Appendix C: Yearly reports
Please refer to attached documents on the Camosun Transportation & Parking webpage
(http://camosun.ca/about/transportation/documents.html). Direct hyperlinks to the pdf documents are
provided below:
o Year 1 completed work plan 2010-11 (PDF) o Transportation and Parking Management Plan - Year 2 Final Report o Year 3 Final Report, available separately, and soon on the web page


